Abstract
The online monitoring of partial discharge (PD) in converter transformers faces significant noise interference. Among these, the periodic pulsating interference caused by the switching process of thyristors is particularly challenging to directly identify from waveforms or frequency spectra, which affects the accuracy of PD monitoring. To address this, a time-domain multi-feature joint recognition algorithm based on periodic consistency scoring and waveform characteristics is proposed. Firstly, the timestamps of each pulse in the signal sequence are extracted based on the cumulative energy function. Secondly, the periodic consistency score and time–frequency feature parameters of each pulse are extracted separately, and an optimal recognition vector is constructed based on univariate screening and redundancy feature checking. Finally, dimensionality reduction is performed using principal component analysis, and the PD signals are separated from periodic pulse interference through fuzzy C-means clustering. The proposed algorithm is applied to denoise PD signals superimposed with on-site noise interference and field-measured signals. The results demonstrate that the algorithm effectively suppresses periodic pulsation interference while significantly reducing the attenuation of PD signals during the denoising process.
1. Introduction
Converter transformers are critical equipment in high-voltage direct current (HVDC) transmission projects, serving as hubs within converter stations. Their operational reliability directly impacts the stability of the power grid [1]. Compared to traditional AC transformers, converter transformers are subjected to complex composite electric fields during operation, including power frequency AC, harmonics, and DC components. This leads to concentrated electric field stress on key components, making local insulation defects more prone to excitation and triggering partial discharges [2,3]. Partial discharge (PD) is an important indicator of insulation conditions in equipment [4], and PD detection has been widely adopted as an effective method for assessing the insulation status of converter transformers [5,6].
The pulse current method is currently the most mature and widely used technique for PD detection [7,8]. However, due to the complex electromagnetic environment within converter stations, on-site pulse current monitoring signals are often severely affected by noise interference [9]. Particularly during the switching on and off of thyristors in converter valves, the abrupt changes in voltage and current caused by the interaction of capacitance and inductance generate high-energy, wide-frequency pulsation interference [10]. This pulsation interference propagates to the detection terminals of a converter transformer and couples into the pulse current signals [11]. In the time domain, it manifests as short periodic pulses, while in the frequency domain, it appears as a wideband signal with multiple frequency components. The waveform of pulsation interference resembles that of PD pulses, potentially causing missed detections or false alarms in PD monitoring, significantly compromising the accuracy of online PD detection [12].
To suppress thyristor pulsation interference, considering its relatively fixed phase within a power frequency cycle, manual windowing methods are commonly employed in the field, including direct time-axis and phase-domain processing. However, these methods are highly subjective, require substantial experience, and may result in signal loss during window selection, affecting the accuracy of PD detection [13]. To address these limitations, researchers have proposed new suppression methods based on signal processing techniques. For instance, Yang et al. introduced a novel pulse segmentation technique that truncates multi-pulse signals based on higher-order cumulants and then separates PD pulses using time–frequency clustering, thereby suppressing pulse noise interference [14]. Janani et al. used parameters such as rise time, fall time, and pulse width as discriminative features for PD signals, separating different types of pulse signals based on Weibull distribution and K-means clustering [15]. F. Álvarez et al. developed a signal feature generation algorithm to calculate representative parameters for each pulse waveform, including frequency content and normalized correlation envelope waveform characteristics, enabling effective separation of PD signals and pulse-type noise interference [16]. While these studies have achieved certain results, the randomness of both interference and PD pulses limits the effectiveness of existing waveform-based interference suppression methods, which lack adaptability. Additionally, for the widely used pulse current detection bands based on IEC standards, spectrum aliasing causes frequency domain filtering methods to remove not only pulsation interference but also partial frequency components of PD signals, leading to signal attenuation and distortion. Therefore, further research is needed to develop effective methods for suppressing periodic pulsation interference in PD monitoring.
To address these challenges, this paper proposed a time-domain multi-feature joint recognition algorithm based on periodic consistency scoring and waveform characteristics for adaptive suppression of periodic pulsation interference in PD detection of converter transformers. The algorithm first extracts the timestamps of each pulse in the signal sequence, then calculates the periodic consistency scores and time–frequency feature parameters of each pulse, and then constructs an optimal recognition vector through screening. Finally, dimensionality reduction is performed using principal component analysis (PCA), and signal separation is achieved through fuzzy C-means (FCM) clustering. Experimental results demonstrate that this method can adaptively suppress pulsation interference while more accurately restoring PD signals.
2. Adaptive Suppression Algorithm for Periodic Pulsation Interference
2.1. Determination of Pulse Timestamps
To analyze individual pulses within the time series of pulse current signals, it is essential to first extract the timestamps of each pulse. However, field-measured signals often contain substantial white noise, which may obscure certain pulses, leading to their omission during extraction. To mitigate the effects of white noise, adaptive wavelet packet decomposition is initially employed to preprocess the raw signal. For white noise interference, this algorithm firstly adopts a Gaussian-weighted moving average filtering technique to smooth the noisy data vectors, sets the Gaussian-weighted moving average filter length to i, and carries out wavelet packet decomposition (WPD) on it at the decomposition level of j. It adaptively selects the optimal basis function according to the characteristics of the analyzed signals so as to make it match with the local discharged signals. Then, the optimal Gaussian-weighted moving average filter length and the number of layers of wavelet packet decomposition are determined according to the signal-to-noise ratio and the waveform distortion mean square error, and the low-frequency components and the processed high-frequency components are reconstructed to obtain the denoised signal. This method effectively suppresses white noise while accurately reconstructing the pulse waveform [17].
In contrast to waveforms in time intervals devoid of pulses, non-stationary signals such as periodic pulse interference and PD pulses exhibit energy that is highly concentrated in the time domain. Consequently, the starting time of pulse signals can be determined by computing the cumulative energy function of the signal. The cumulative energy function E(i) is defined as follows [18]:
where N represents the length of the signal, x denotes the signal sequence, and Em represents the average energy of the signal. When calculating the cumulative energy function for signals containing PD pulses and pulsating interference, the cumulative energy function is not smooth and exhibits multiple extreme points, making it difficult to determine which correspond to pulse signals. Therefore, it is necessary to further apply smoothing filtering to the obtained cumulative energy function curve. The extreme points of the cumulative energy function correspond to the positions where pulse signals begin to appear. Thus, the local minimum points of the smoothed cumulative energy function are identified as the starting times of the pulse signals, thereby determining the timestamps of each pulse.
2.2. Construction of the Optimal Pulse Identification Vector
2.2.1. Pulse Periodicity Consistency Score
A typical characteristic of periodic pulsating interference is its relatively fixed phase of occurrence within one power frequency cycle. Taking the widely used 12-pulse rectifier circuit as an example, the 12-pulse interference it generates appears approximately 12 times at equal intervals within one power frequency cycle. In contrast, PD signals do not exhibit periodicity and show different distribution probabilities at different phases. The periodicity consistency score is used to measure the degree of periodicity of a pulse, and its calculation method is as follows:
(1) Calculate the deviation of the pulse from the ideal cycle. In the previous step, the starting times of each pulse in the time series have been determined and are denoted as t1, t2, t3, …, tn, where n is the total number of pulses. Let the starting time of the signal be t0. The time difference of each pulse relative to t0 is calculated to construct the cumulative interval sequence:
Since pulsating interference exhibits periodicity, Δti will be close to an integer multiple of a certain period T. For 12-pulse interference, this period is one-twelfth of the power frequency cycle T0. The deviation of Δti from the ideal integer multiple of the period is denoted as di, and it is calculated using the following formula:
If the pulse is periodic interference, di should be close to 0; if it is a PD pulse, di will be larger and irregular.
(2) Phase calibration. To determine the dominant phase of the periodic pulses, the phase ϕi of each pulse relative to the period T is calculated as follows:
By statistically analyzing all ϕi, the value ϕpeak where the phase distribution is most concentrated can be identified. Since the phase of periodic pulses is fixed, while the phase distribution of other pulses is irregular, this peak corresponds to the phase of the periodic pulsating interference. The reference time point is then adjusted to calibrate the phase of the periodic pulsating interference, aligning its phase to 0:
Using the calibrated t0′, recalculate Δti. At this point, the deviation of the periodic pulsating interference becomes smaller, while the deviation of other pulses remains larger.
(3) Parameter calculation. Given the large total number of pulses, the periodicity within a specific region needs to be evaluated using a local window. Define half of the power frequency cycle, which is 10 ms, as a time window, and collect the timestamps of all pulses within the window. For each pulse in the window, calculate its deviation dj, and define the local window score Si as
where M is the number of pulses within the window, β is an adjustment parameter used to control the sensitivity to deviations, set to β = 1/T ≈ 0.6 in this paper. The value of Si ranges between 0 and 1, where a value close to 1 indicates that the pulses within the window are highly periodic, while a value close to 0 indicates a random distribution of pulses. On this basis, by checking whether the subsequent pulses starting from ti continuously satisfy periodicity, the ability to identify periodic pulses can be further improved. Considering the next m pulses, the Continuous Matching Score (CMSi) is defined as
where γ is the adjustment parameter, set to γ = 1/T, which controls the penalty strength for time deviations; a CMSi value close to 1 indicates that the subsequent pulses are continuously periodic, while a value close to 0 indicates non-periodicity. By combining the local window score Si and the continuous matching score CMSi, the periodic consistency score Fi is defined as
where w1 and w2 are weights, set to w1 = w2 = 0.5, which can be adjusted based on actual data. A higher Fi value indicates a greater likelihood of the pulse being periodic pulsation interference, while a lower Fi value suggests a lower probability of periodic pulsation interference.
2.2.2. Time–Frequency Feature Parameters
There are differences in the time–frequency characteristics between pulsation interference and PD signals. Based on this, identification conditions are established to achieve the separation of signals with different characteristics. Considering the randomness of signal waveforms, identification conditions based on a single feature are prone to misjudgment. To improve the reliability of identification, multiple time–frequency features of the signal are extracted from different perspectives to construct a time–frequency feature group, enabling comprehensive analysis.
The time-domain waveform characteristics of pulse signals can be divided into three categories: amplitude characteristics, shape characteristics, and distribution characteristics. Among them, the amplitude characteristics include the extraction of pulse peak value Pmax, peak-to-peak value Pp-p, average value , and root mean square value RMS. The shape characteristics involve the extraction of rise time Tr, fall time Td, pulse width W, pulse duration Tpulse, and pulse interval Tint. The distribution characteristics include the extraction of symmetry r, sharpness S, standard deviation σ, kurtosis K, and skewness SK. In the frequency domain, the characteristics of the pulse signal include the extraction of band width B, center frequency fc, high-frequency energy ratio Ph, skewness SKf, and steepness Kuf. These 19 time–frequency feature parameters constitute the time–frequency feature group of the pulse [19,20].
2.2.3. Optimal Identification Vector
The time–frequency feature group and the periodic consistency score together form a 20-dimensional pulse identification vector. However, periodic pulsation interference and PD pulses do not exhibit significant differences in all feature parameters. Therefore, the first step is to screen out features with higher discriminative power using the analysis of variance (ANOVA) method. ANOVA decomposes the total sum of squares (SST) into the between-group sum of squares (SSA) and the within-group sum of squares (SSE). By calculating the ratio F of the between-group variance to the within-group variance, it determines whether a feature has significant discriminative ability for target classification. Let dfB = K − 1 be the degrees of freedom between groups and dfW = N − K be the degrees of freedom within groups. The F-statistic is calculated as
where SSA/dfB is the between-group mean square, SSE/dfW is the within-group mean square, xij is the j-th observation in the i-th group, is the overall mean of all observations, K is the number of groups, and ni is the sample size of the i-th group. The P-value represents the probability of observing the current F-value or a more extreme value under the assumption that the group means are equal. Since the variance test is one-tailed, we only need to focus on whether the between-group variation is significantly greater than the within-group variation, and if the P-value corresponds to the right-tail probability of the F-distribution.
where Fobs is the actual calculated F-statistic. The P-value is calculated based on the F-statistic and the F-distribution. If the P-value is less than the significance level α, the null hypothesis is rejected, indicating that the feature has a significant difference between different categories and can be considered an effective feature for distinguishing the two types of signals. In this study, the significance level α is set to 0.05.
The above process selects features with high discriminative power, but some features may exhibit strong correlations, leading to data redundancy. Therefore, redundancy is checked by calculating the Pearson correlation coefficient matrix. For two feature variables X and Y, the Pearson correlation coefficient rXY is calculated as follows [21]:
where Cov(X,Y) is the covariance of X and Y, σX and σY are the standard deviations of X and Y, respectively, and are the means of X and Y, n is the sample size, and xi and yi are the i-th observations of X and Y, respectively. Suppose there are m features X1, X2, …, Xm, the correlation coefficient matrix R is an m × m symmetric matrix, where each element Rjk represents the Pearson correlation coefficient between the j-th and k-th features. By calculating the correlation coefficient matrix, for each pair of features (Xj, Xk), if |rjk| > 0.8, it indicates that they are linearly correlated, and only one of the features is retained.
After the two steps of univariate feature selection and redundancy checking, the dimensionality of the pulse identification vector is significantly reduced, thereby constructing the optimal pulse identification vector.
2.3. Adaptive Separation of Signals
Unsupervised clustering is a machine learning method that does not require labeled data. It aims to divide samples into several categories based on the intrinsic structure of the data and is widely used for signal separation. To intuitively demonstrate the signal separation effect in a three-dimensional separation plot and reduce the computational complexity of the algorithm while preserving the original information of statistical operators as much as possible, the principal component analysis (PCA) method is employed to reduce the multidimensional features in the optimal identification vector to three dimensions [22]. The calculation method is as follows:
where Xstd is the standardized data, W is the projection matrix composed of the feature vectors of the first three principal components, and Y is the three-dimensional data after dimensionality reduction. Through this method, the reduced-dimensional features can retain the main characteristics of the original signals while reducing the number of features. The reduced-dimensional features are mutually independent, avoiding overlapping information between features.
Based on the feature parameters reduced by PCA, clustering is performed on pulsating interference and PD pulses, grouping signals with similar characteristics into the same category. The clustering method selected in this study is FCM clustering [23], which separates signals of different categories by minimizing the weighted sum of squared distances from all data points in the clustering domain to the cluster centroids. Its objective function is defined as
where c is the number of clusters, n is the total number of data points, yj is the j-th data point, vi is the centroid of the i-th cluster, uij is the membership degree of the j-th data point belonging to the i-th cluster, and m is the fuzziness exponent, which takes the typical value of 2. By iteratively optimizing the membership degrees uij and the cluster centroids vi, FCM can effectively separate signals into different categories.
After completing the signal separation, periodic pulsating interference is removed. The time-domain waveforms are reconstructed based on the timestamps of each PD pulse, fully retaining the waveforms corresponding to the time periods with PD pulses. The waveforms of other time periods without PD pulses are set to zero, thereby completing the entire process of pulsating interference suppression. The complete flowchart of the algorithm is shown in Figure 1.
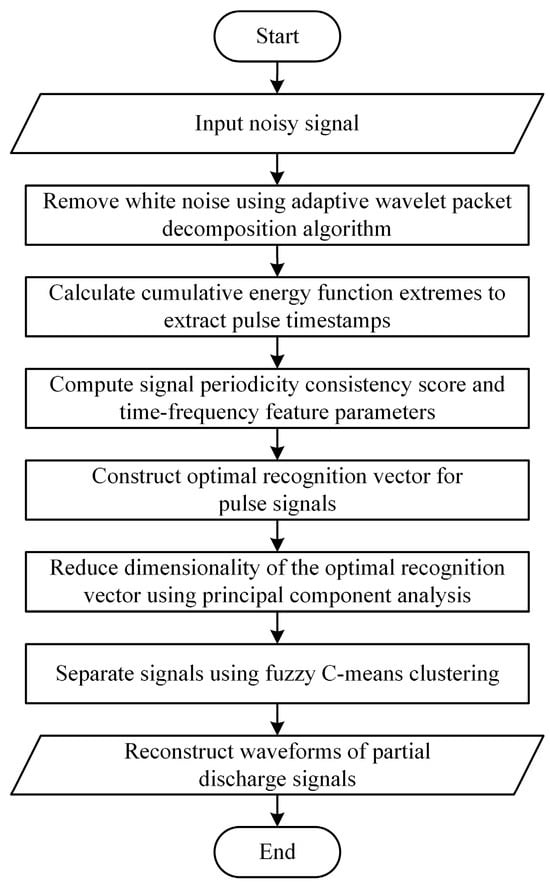
Figure 1.
Algorithm flowchart.
3. Denoising of PD Signals Superimposed with On-Site Pulsating Interference
3.1. Measurement of PD Signals
A typical defect discharge experimental circuit was set up in the laboratory to apply voltage to the defect model. The experimental platform is shown in Figure 2. Specifically, a PD-free AC test transformer was used to apply voltage to the defect; a current-limiting resistor with a resistance of 10 MΩ was employed to restrict the loop current and protect the experimental equipment; a high-frequency current transformer (MCT120) and a 400 pF coupling capacitor were used to measure the high-frequency discharge signals. A PICO acquisition card was utilized to collect high-frequency signals in the test loop through the high-frequency current transformer MCT120, which exhibits a flat frequency response and high frequency gain within the range of 80 kHz to 40 MHz, effectively meeting the experimental requirements for high-frequency signal testing. The defect electrode adopted a needle-plate electrode structure, with the needle electrode being a tungsten electrode with a curvature radius of 30 μm. The distance between the needle electrode and the insulating cardboard was 10 mm, and the insulating cardboard served to prevent breakdown between the needle electrode and the ground electrode. The measured PD signal is shown in Figure 3.
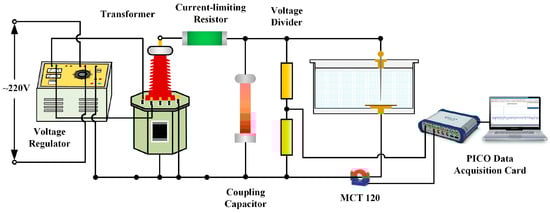
Figure 2.
PD signal acquisition circuit.

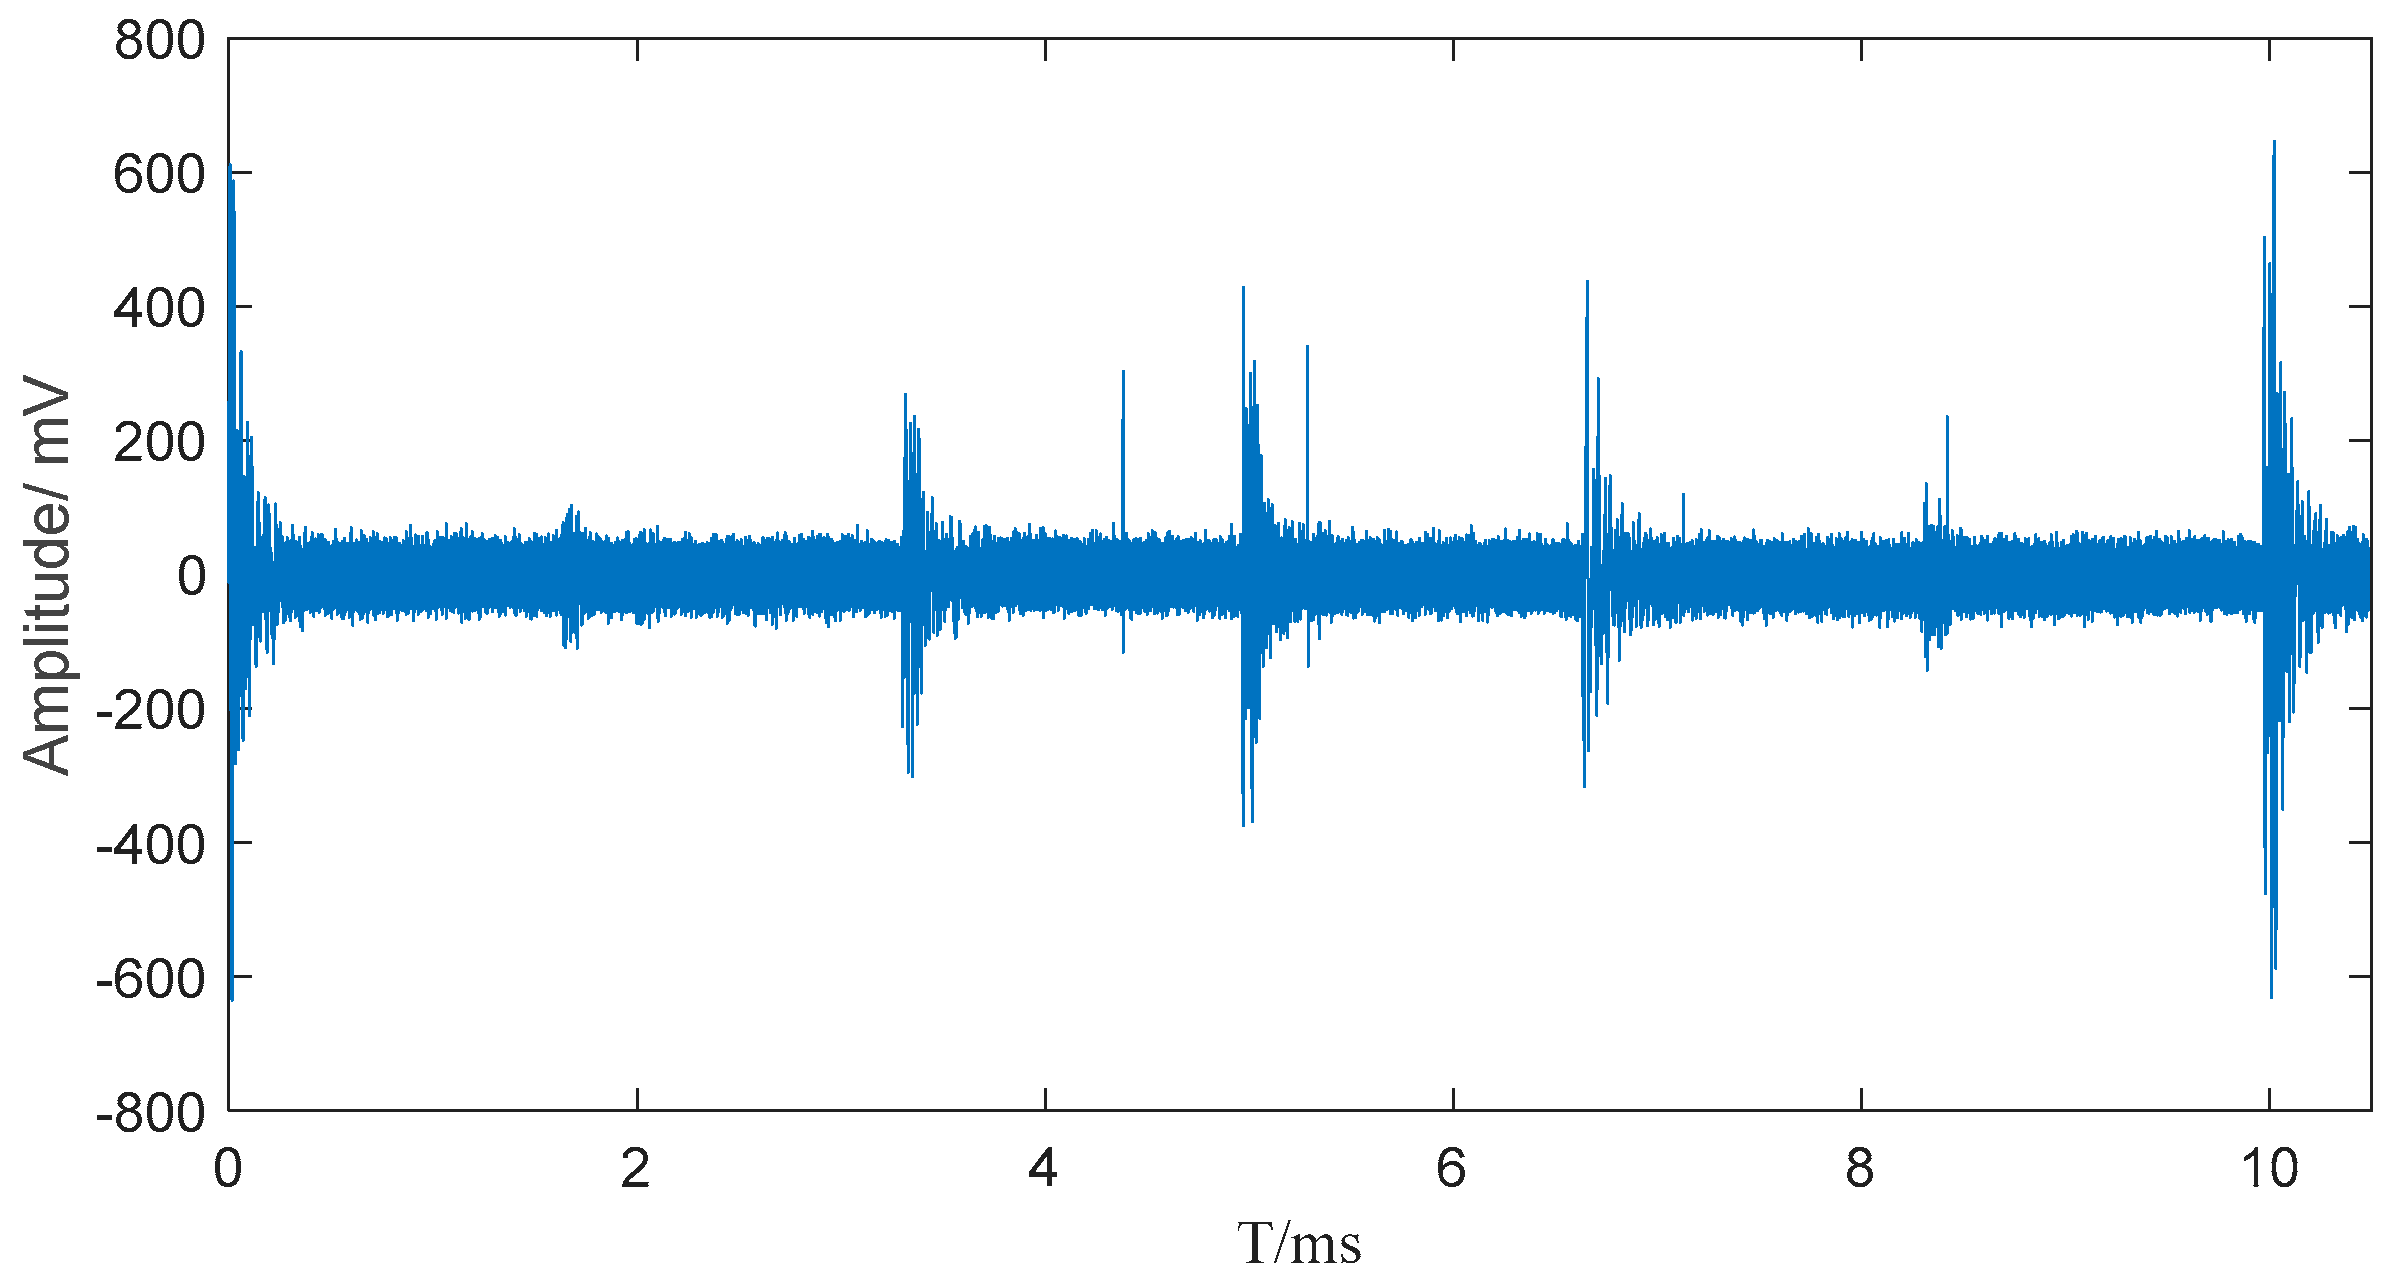
Figure 3.
Experimentally measured PD signals.
3.2. Suppression of Pulsating Interference
The periodic pulsating interference at the converter station site is highly complex and difficult to accurately simulate. To verify the effectiveness of the noise suppression algorithm proposed in this paper for on-site pulsating interference, pulse current signals were collected from the bushing tap of a converter transformer at a converter station using a current transformer. These signals represent on-site noise interference without PD pulses, as shown in Figure 4.
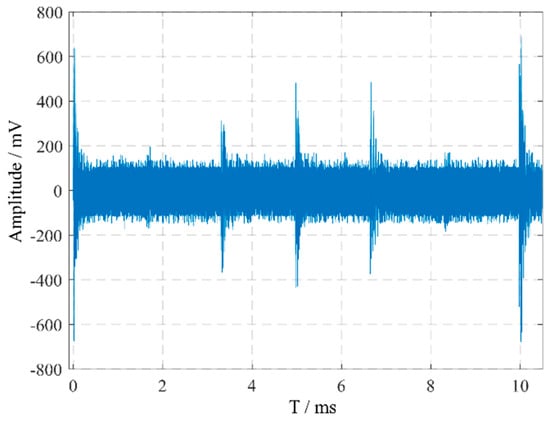
Figure 4.
On-site measured noise interference in a converter station.
The figure indicates that in the on-site measured noise interference, in addition to white noise, there are multiple 12-pulse interferences with relatively high amplitudes. The PD signal shown in Figure 3 was obtained through direct measurement using a defect model. However, for the pulse current detection signals in converter transformers, PD pulses undergo significant attenuation during propagation to the detection terminal and may become submerged in noise. To more realistically simulate the actual conditions of on-site detection, the laboratory-measured PD signal (shown in Figure 3) was superimposed with the noise interference collected from a converter station. Additionally, the amplitude of the PD signal was adjusted to ensure partial submersion in noise. This process formed the final PD signal containing on-site noise interference, as illustrated in Figure 5.

Figure 5.
PD signals superimposed with on-site noise interference.
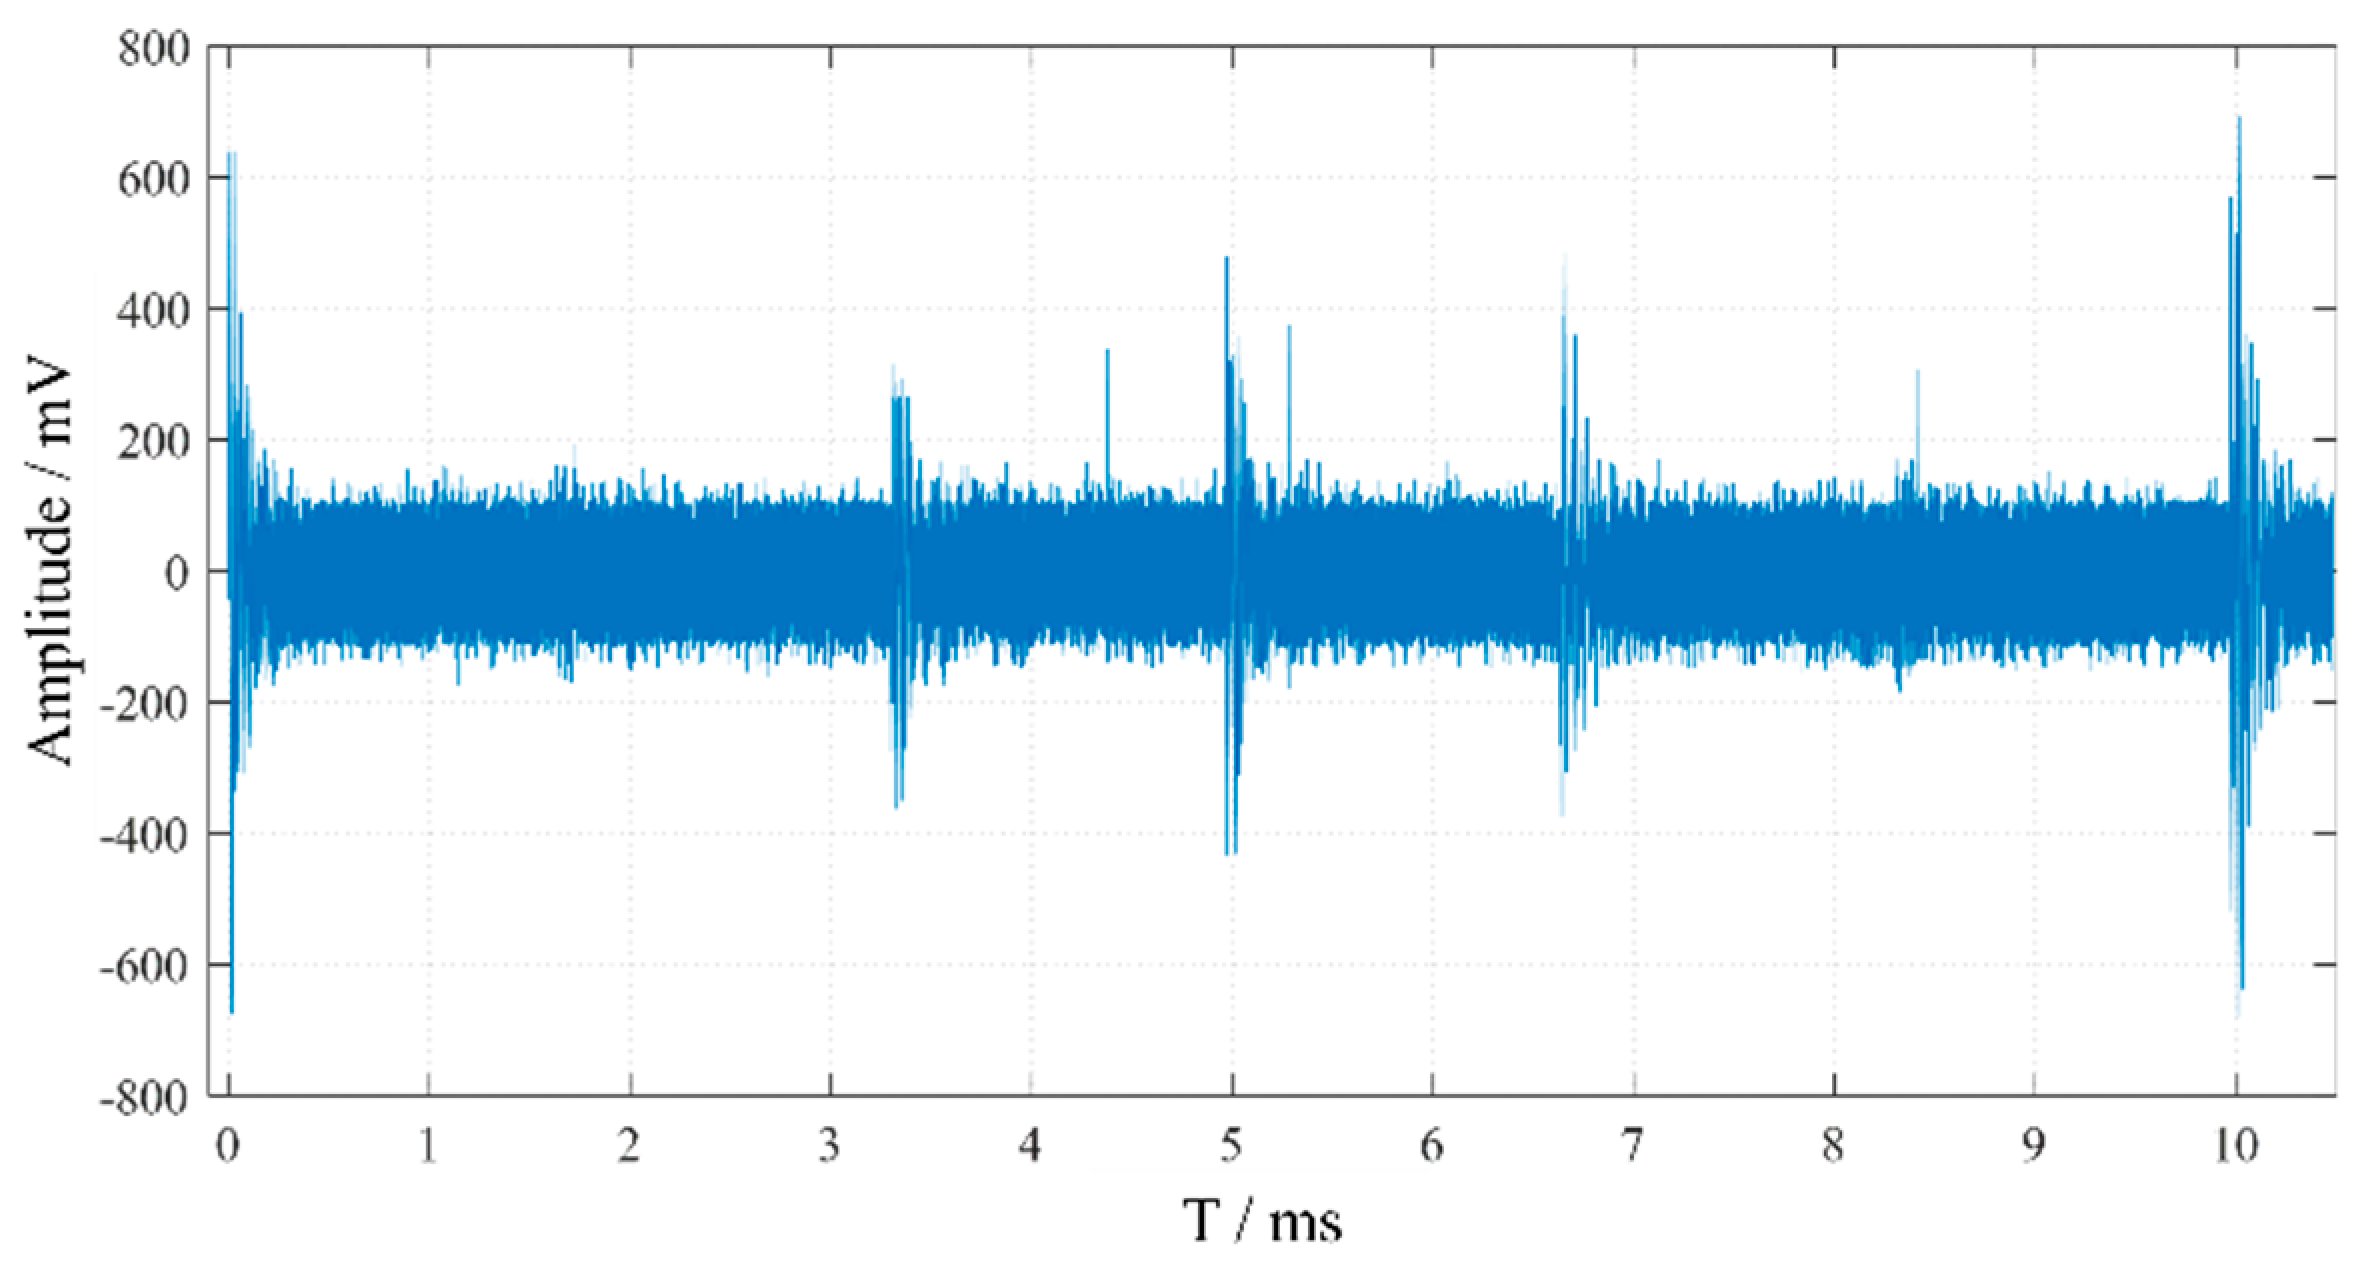
The signal after the removal of white noise by the adaptive wavelet packet denoising algorithm is shown in Figure 6.
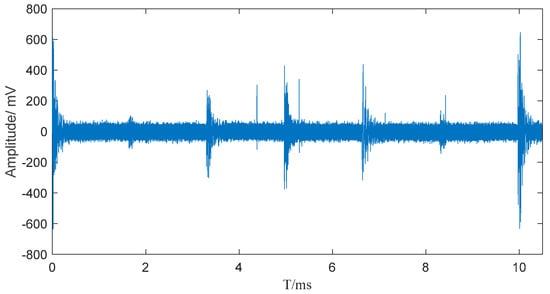
Figure 6.
Signal after adaptive wavelet packet processing.
For the field-measured signals, since it is impossible to obtain the pure local discharge pulse without noise to compare with the denoising results, the denoising results can be evaluated according to the noise rejection ratio (NRR) and energy retention rate (ERR) [24]. The NRR reflects the filtering effect of noise, and the higher the NRR is, the more significant the suppression of the noise. The ERR reflects the retention of energy in the denoised signal, and the higher the ERR is, the more energy is retained in the denoised signal, indicating that more energy is retained in the denoised signal.
where x1(n) is the original dyed-noise signal, x2(n) is the denoised signal, σ1 and σ2 are the standard deviation of the pre- and post-denoised signals, respectively, and N is the length of the signal. The NRR after the denoising process for Figure 5 is 3.519 and ERR is 0.656.
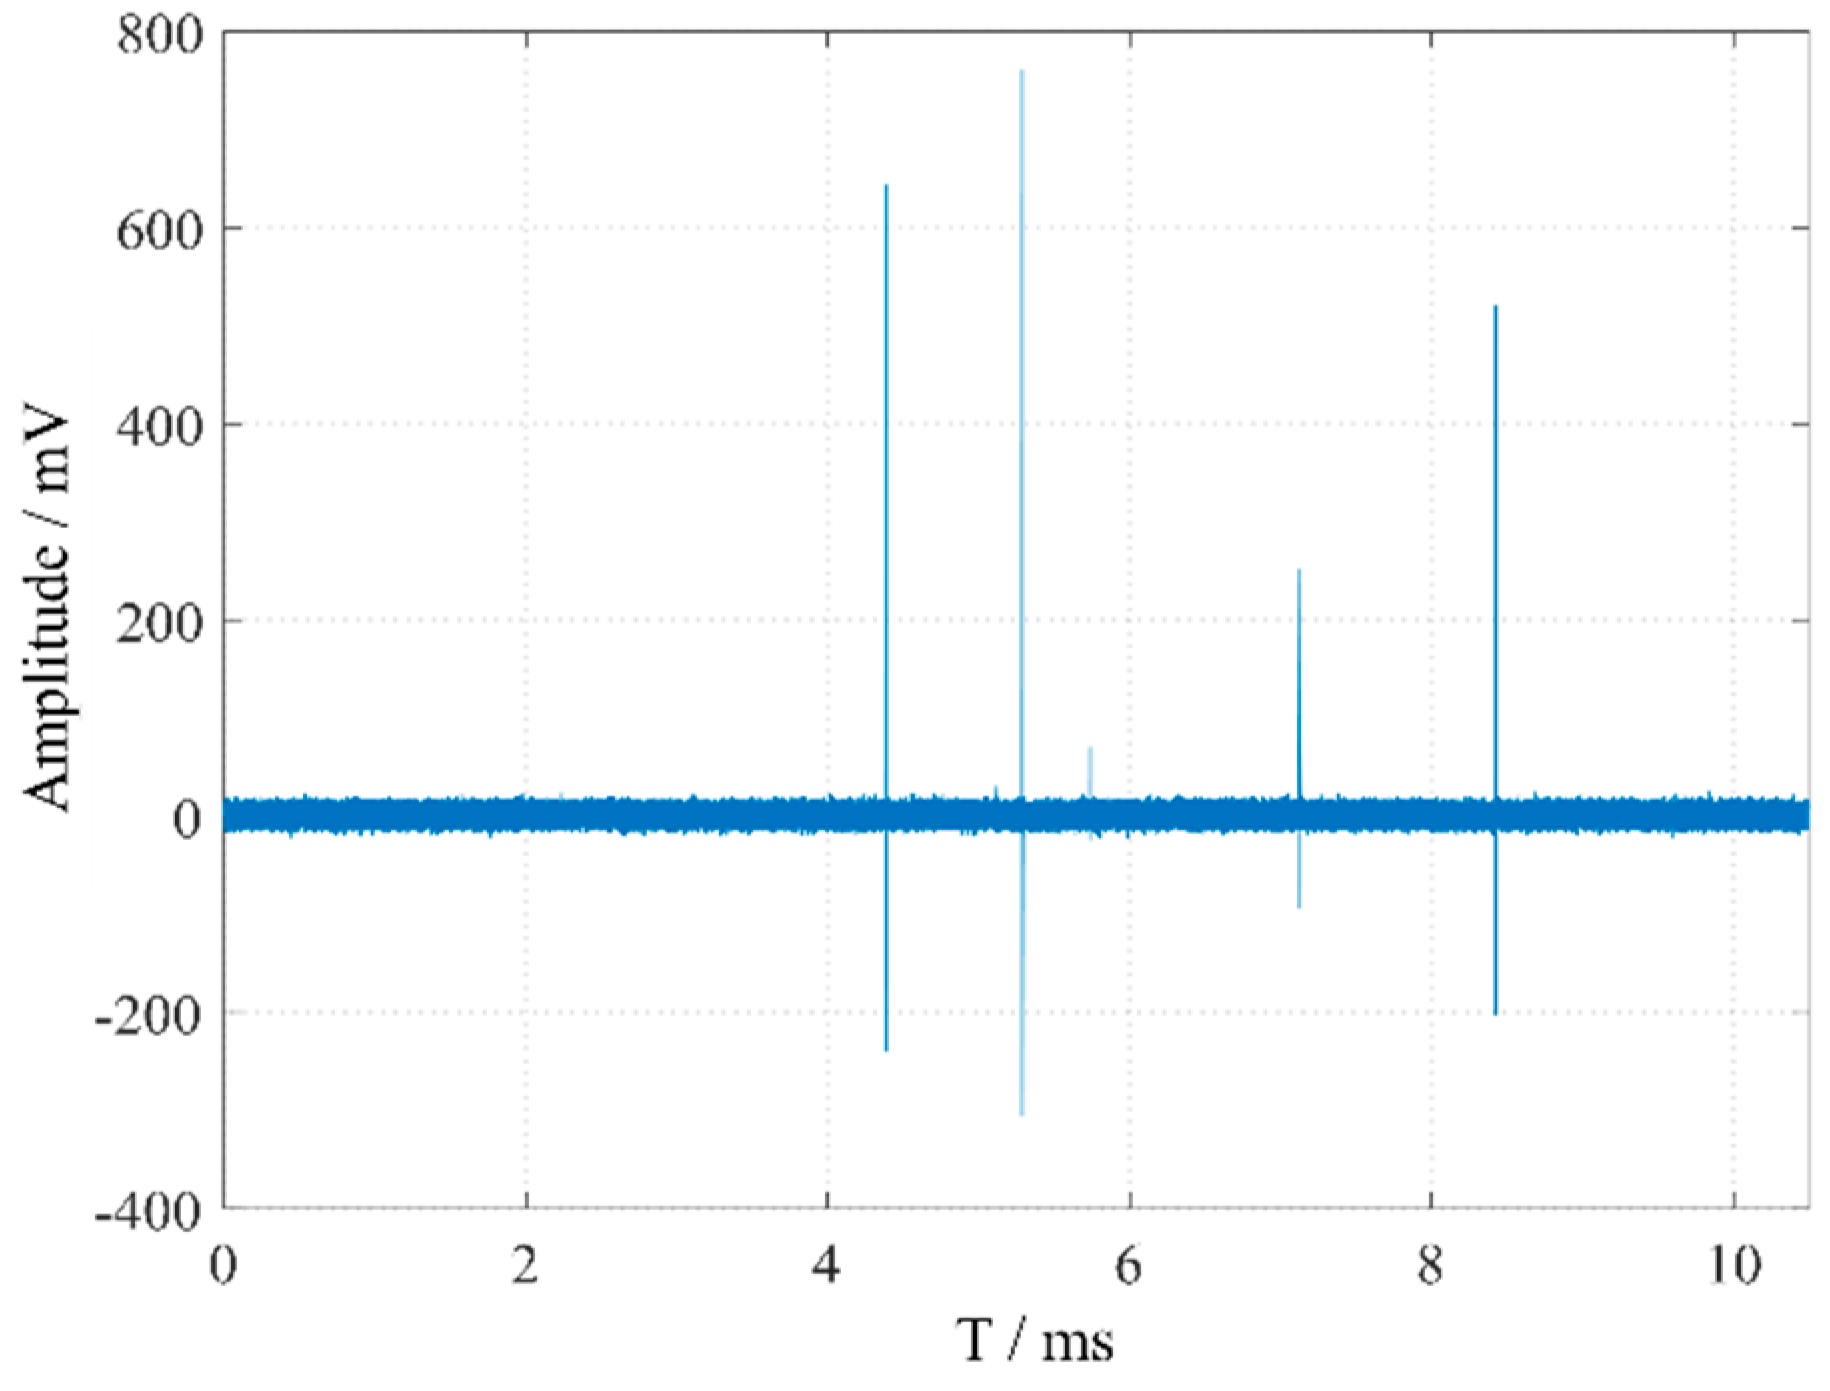
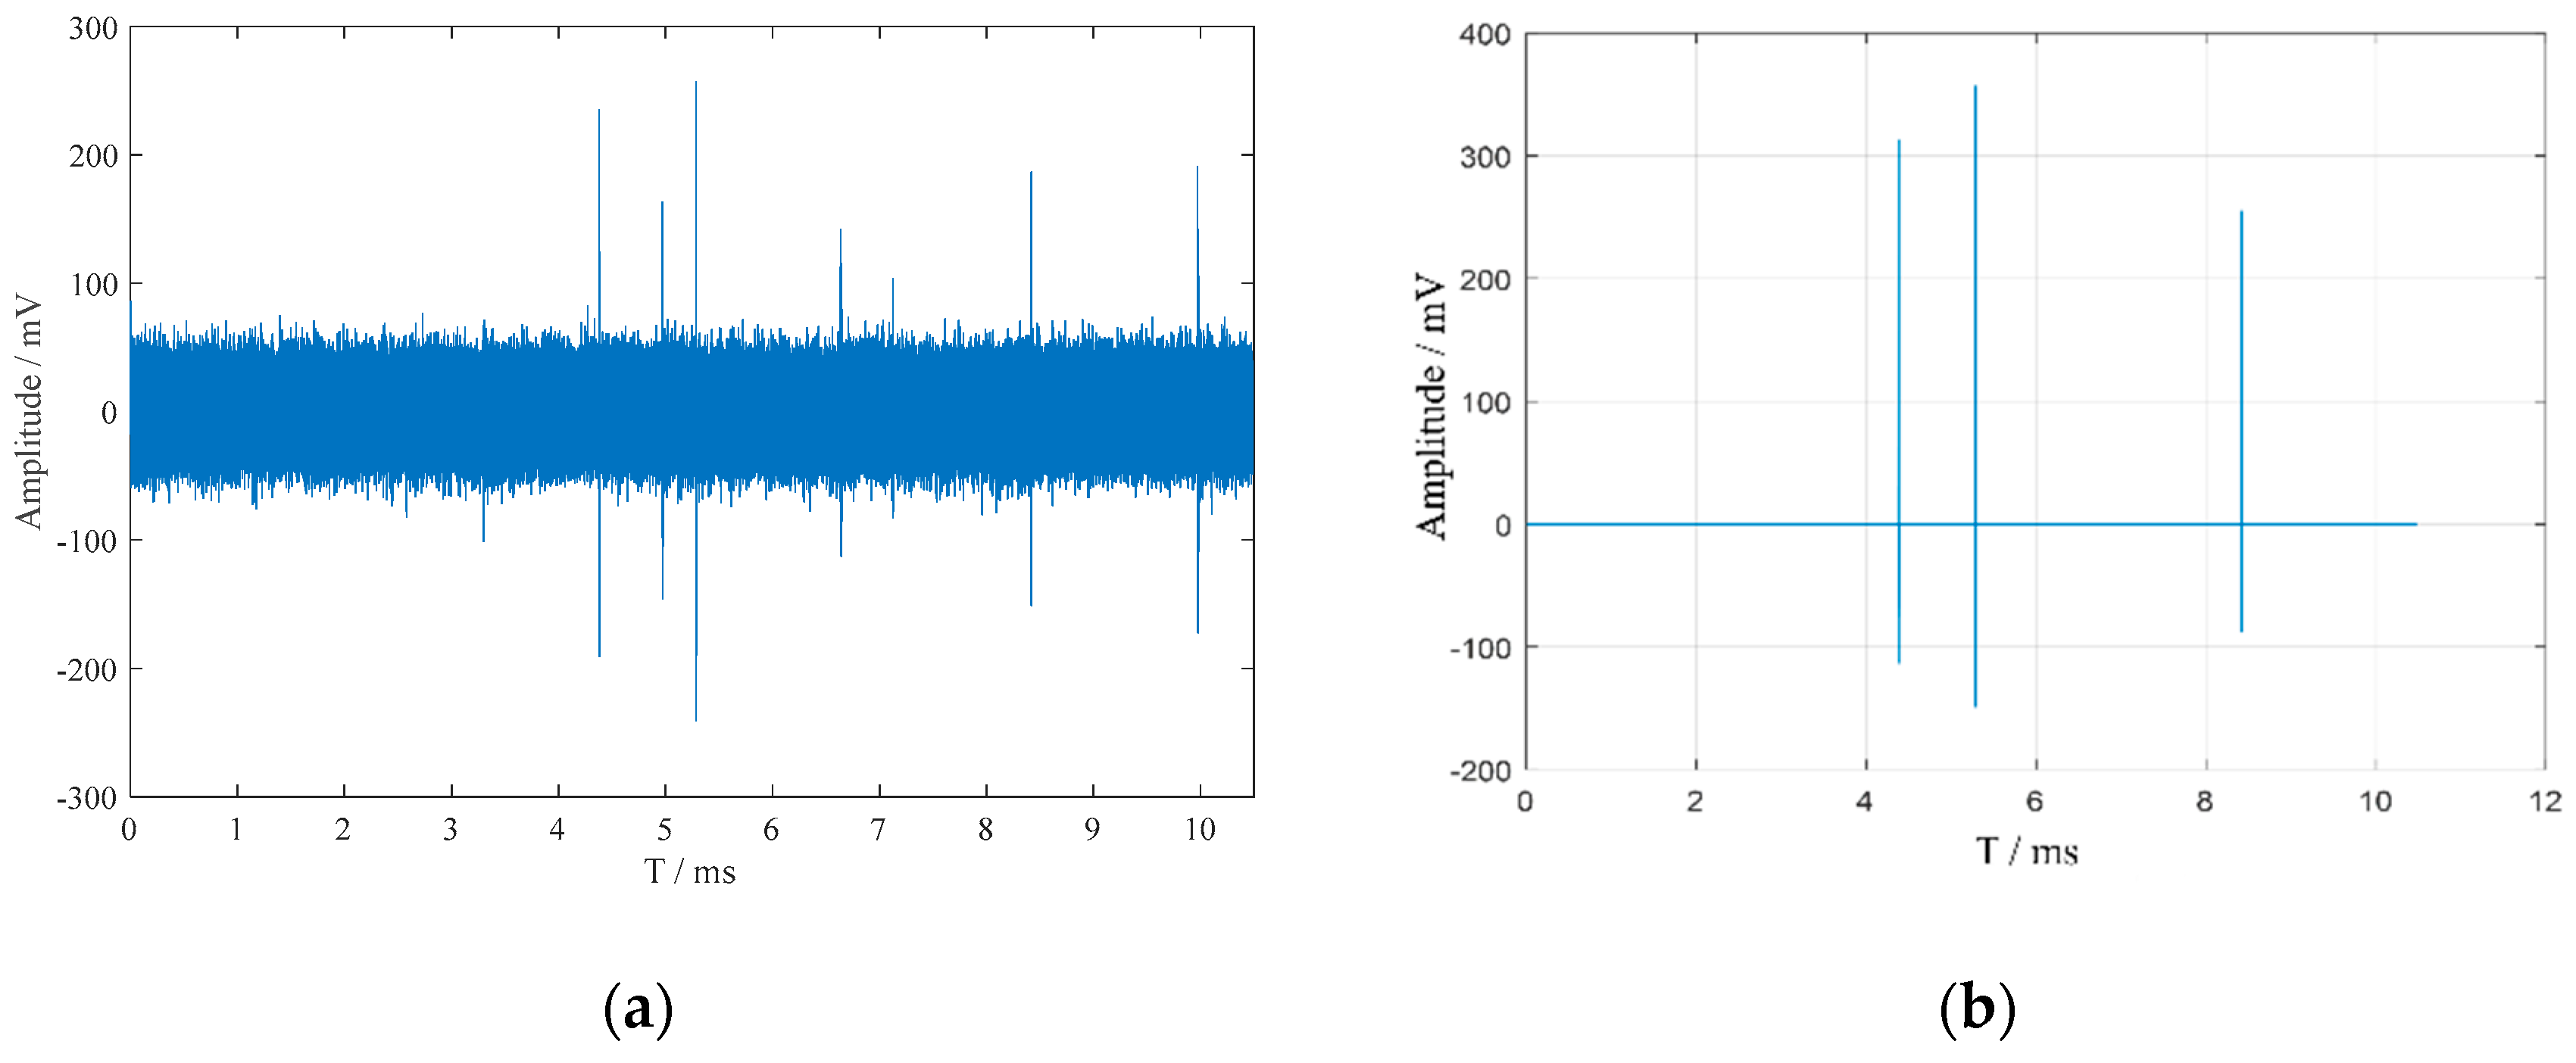
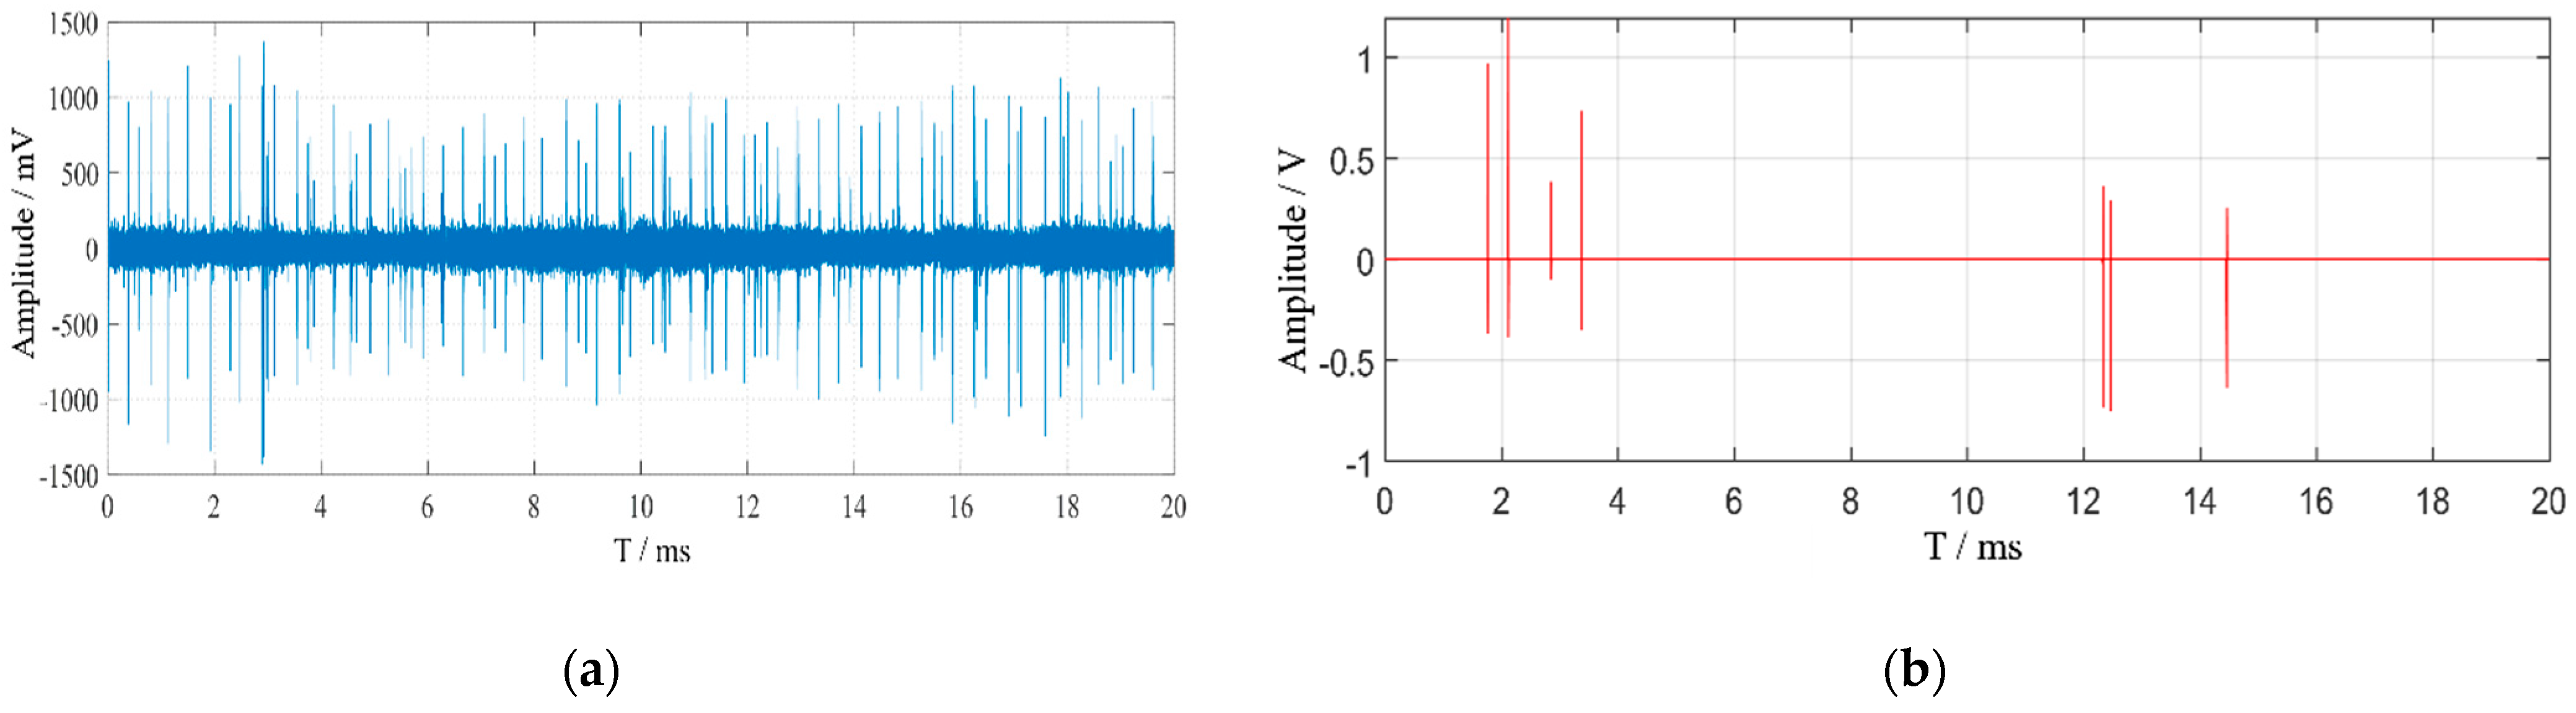
For the suppression of 12-pulse interference in PD detection of converter transformers, the current on-site approach primarily relies on high-pass filtering. Both a high-pass filtering algorithm with a cutoff frequency of 500 kHz and the time-domain multi-feature joint recognition algorithm proposed in this paper were applied to denoise the signal shown in Figure 6, with the results presented in Figure 7. From the original Figure 7b, the peak PD signals located at 4.38 ms, 5.23 ms, and 8.27 ms are accurately extracted, and only the PD located at 7.15 ms cannot be extracted due to the small amplitude submerged in the noise; all the other pulsating interference signals are suppressed and removed.

Figure 7.
Denoising results of PD signals superimposed with on-site noise interference. (a) 500 kHz high-pass filtering algorithm; (b) time-domain multi-feature joint recognition algorithm.
The denoising results demonstrate that the 500 kHz high-pass filter can suppress 12-pulse interference to some extent. However, for certain 12-pulse interferences that overlap significantly with the frequency range of the PD signal, the suppression effect is inadequate. Additionally, high-pass filtering causes significant attenuation of the PD signal, leading to waveform distortion. In contrast, the time-domain multi-feature joint recognition algorithm proposed in this paper not only effectively filters out 12-pulse interference but also avoids significant attenuation of the PD signal. This algorithm exhibits excellent denoising performance for pulse current signals under complex noise interference in converter station environments.
Since the energy of the local discharge pulse in the measured signal is significantly smaller than that of the interference pulse, the higher NRR and lower ERR in this case indicate the better suppression of noise. The evaluation indexes of denoising effect are shown in Table 1.

Table 1.
Evaluation of denoising performance for on-site measured signals.
4. Denoising of On-Site Measured PD Signals
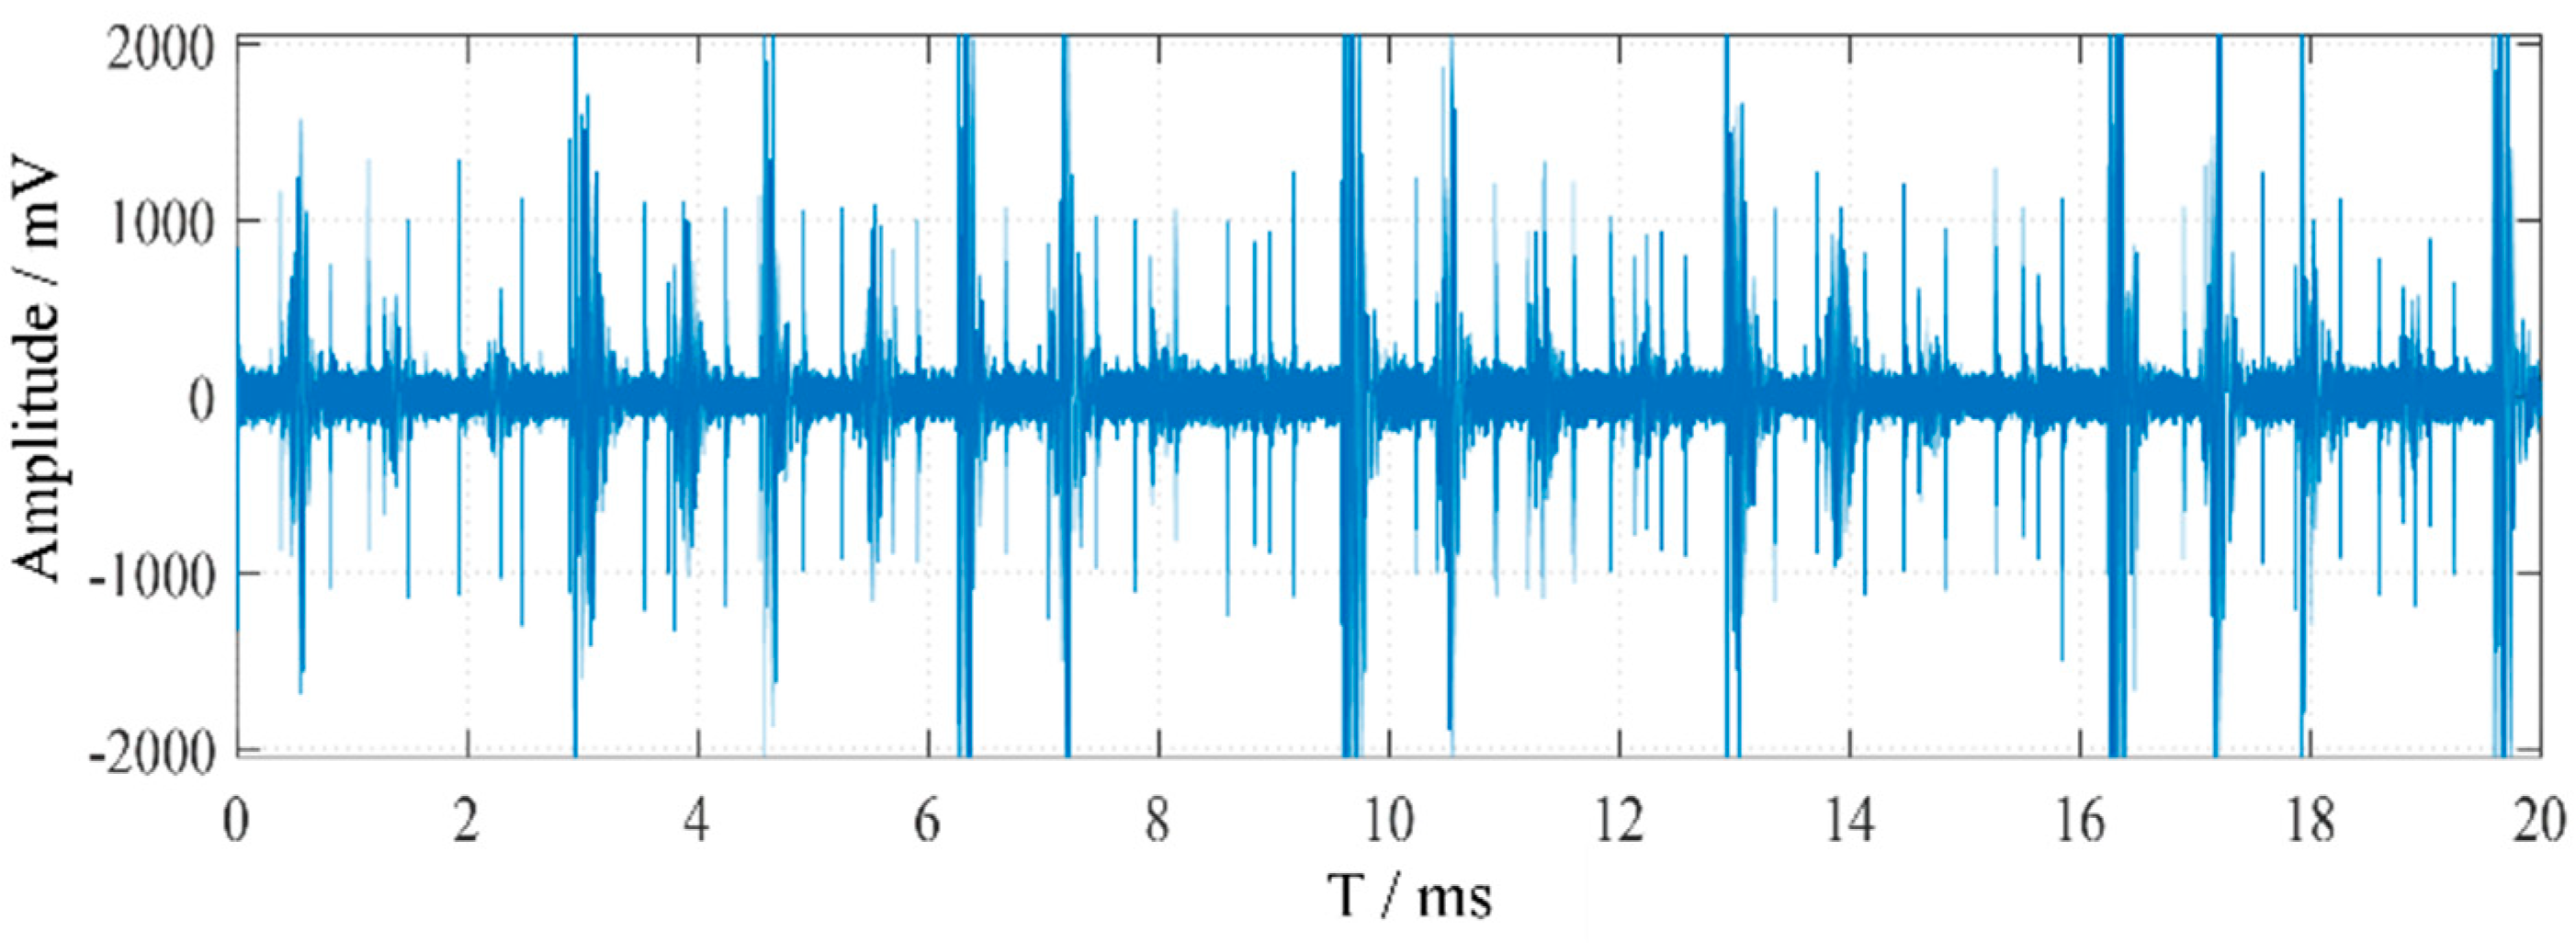
To verify the denoising performance of the proposed algorithm for on-site measured PD (PD) signals, a PD test was conducted on a converter transformer at an ±800 kV converter station. The original signal collected on-site is shown in Figure 8. The measured raw signal includes on-site background white noise, PD signals, 12-pulse interference, and random pulse interference. Denoising was performed on the on-site collected signal. The high amplitude and numerous interference pulses make it difficult to identify the PD signals, significantly affecting the accuracy of PD detection. The signal after removal of white noise by adaptive wavelet packet denoising algorithm is shown in Figure 9. The NRR after denoising is more or less 2.878 and ERR is 0.588 in Figure 8.

Figure 8.
On-site measured pulse current signal in a converter station.

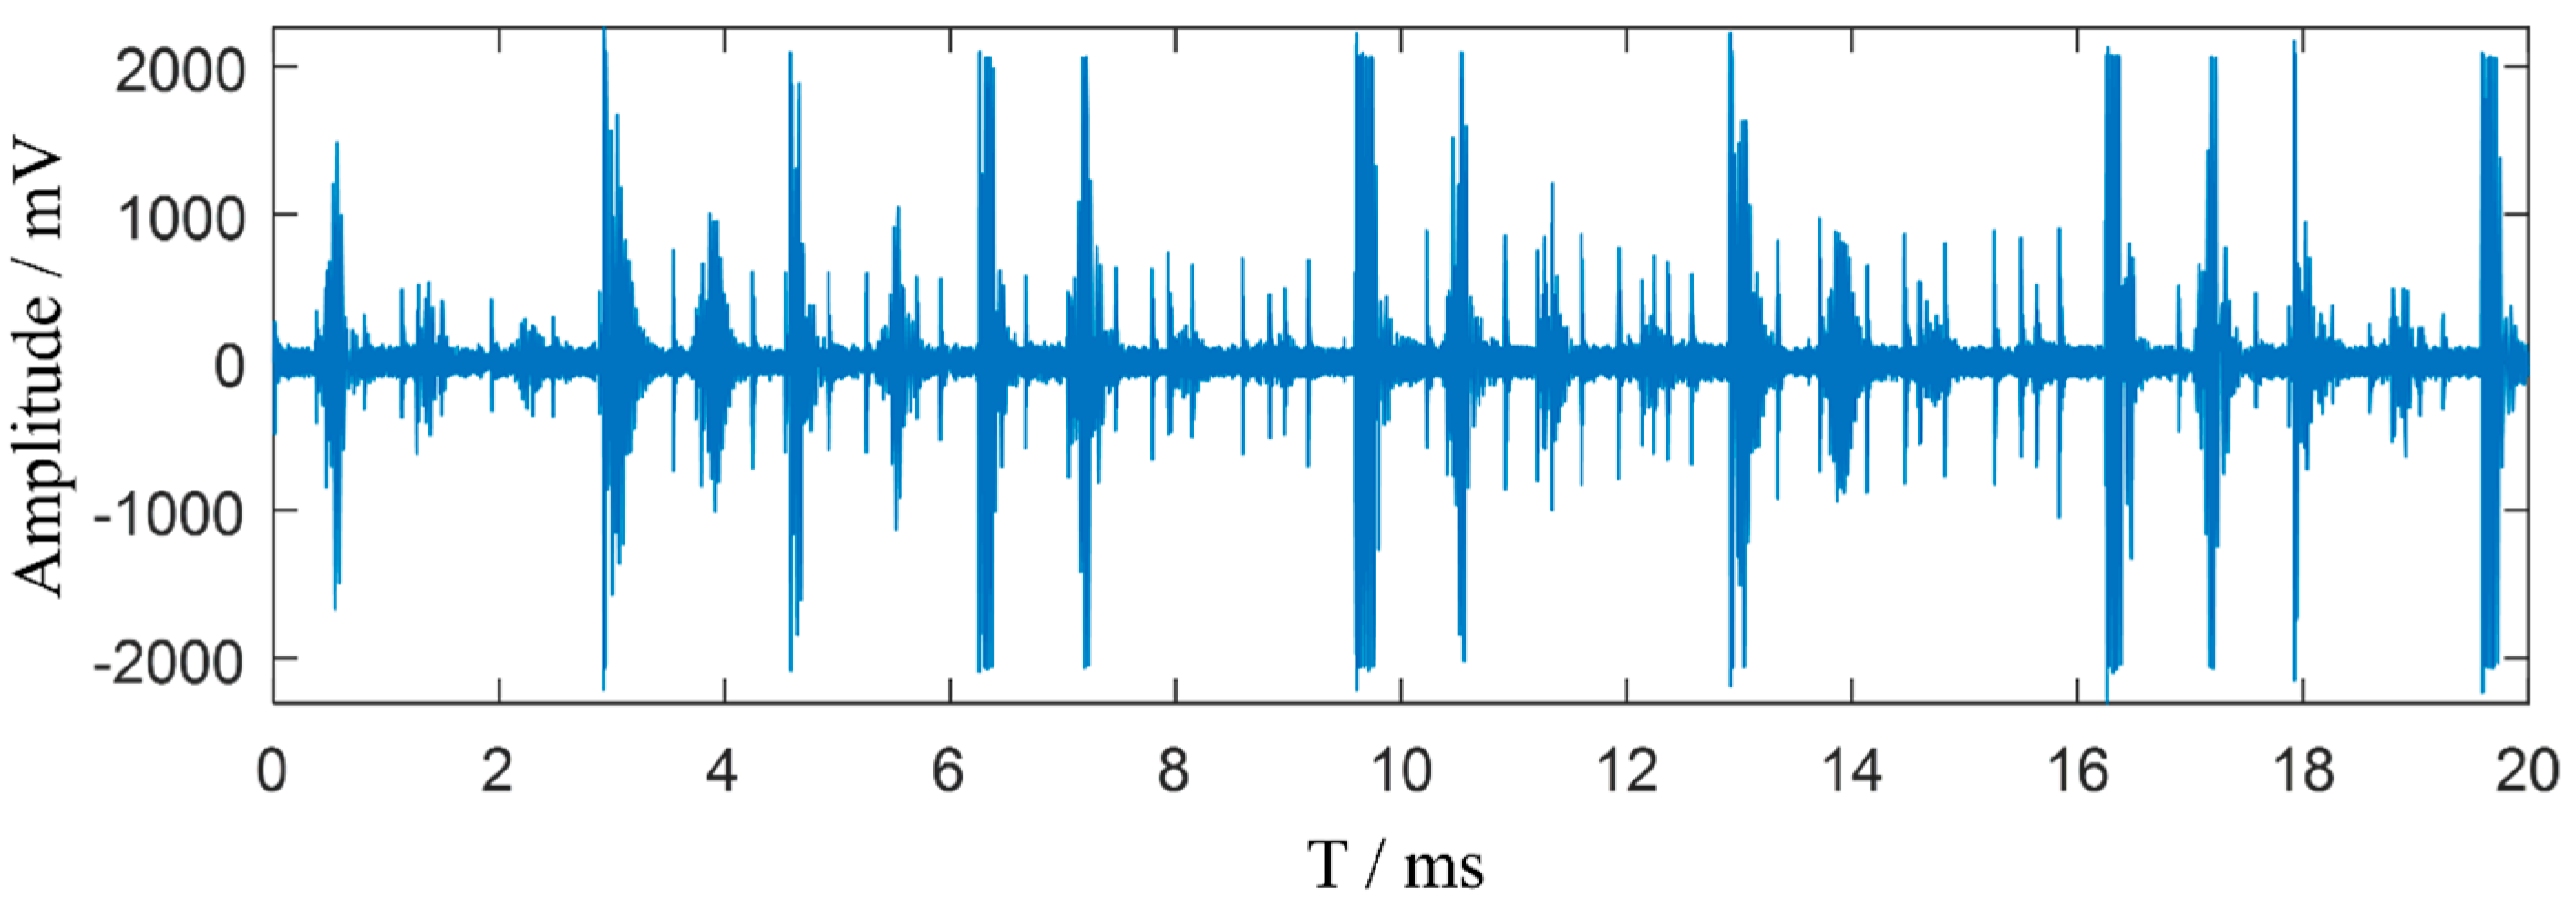
Figure 9.
The result of adaptive wavelet packet processing.
4.1. Denoising Results and Analysis
The signal shown in Figure 9 was denoised using both a high-pass filtering algorithm with a cutoff frequency of 500 kHz and the time-domain multi-feature joint recognition algorithm. The results are presented in Figure 10.
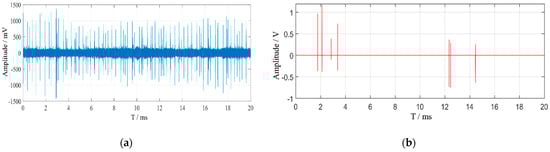
Figure 10.
Denoising results of on-site measured signals. (a) 500 kHz high-pass filtering algorithm; (b) time-domain multi-feature joint recognition algorithm.
The denoising results show that the high-pass filtering algorithm does not significantly suppress the pulsating interference, and a large amount of residual interference remains after denoising, which obscures the PD signals. In contrast, the time-domain multi-feature joint recognition algorithm significantly reduces the pulsating interference. Compared to the original signal, the attenuation of the PD signals during the denoising process is not marked. This algorithm effectively suppresses complex on-site interference while maximally preserving the PD signals.
4.2. Influence of Periodic Consistency Score on Signal Separation Effectiveness
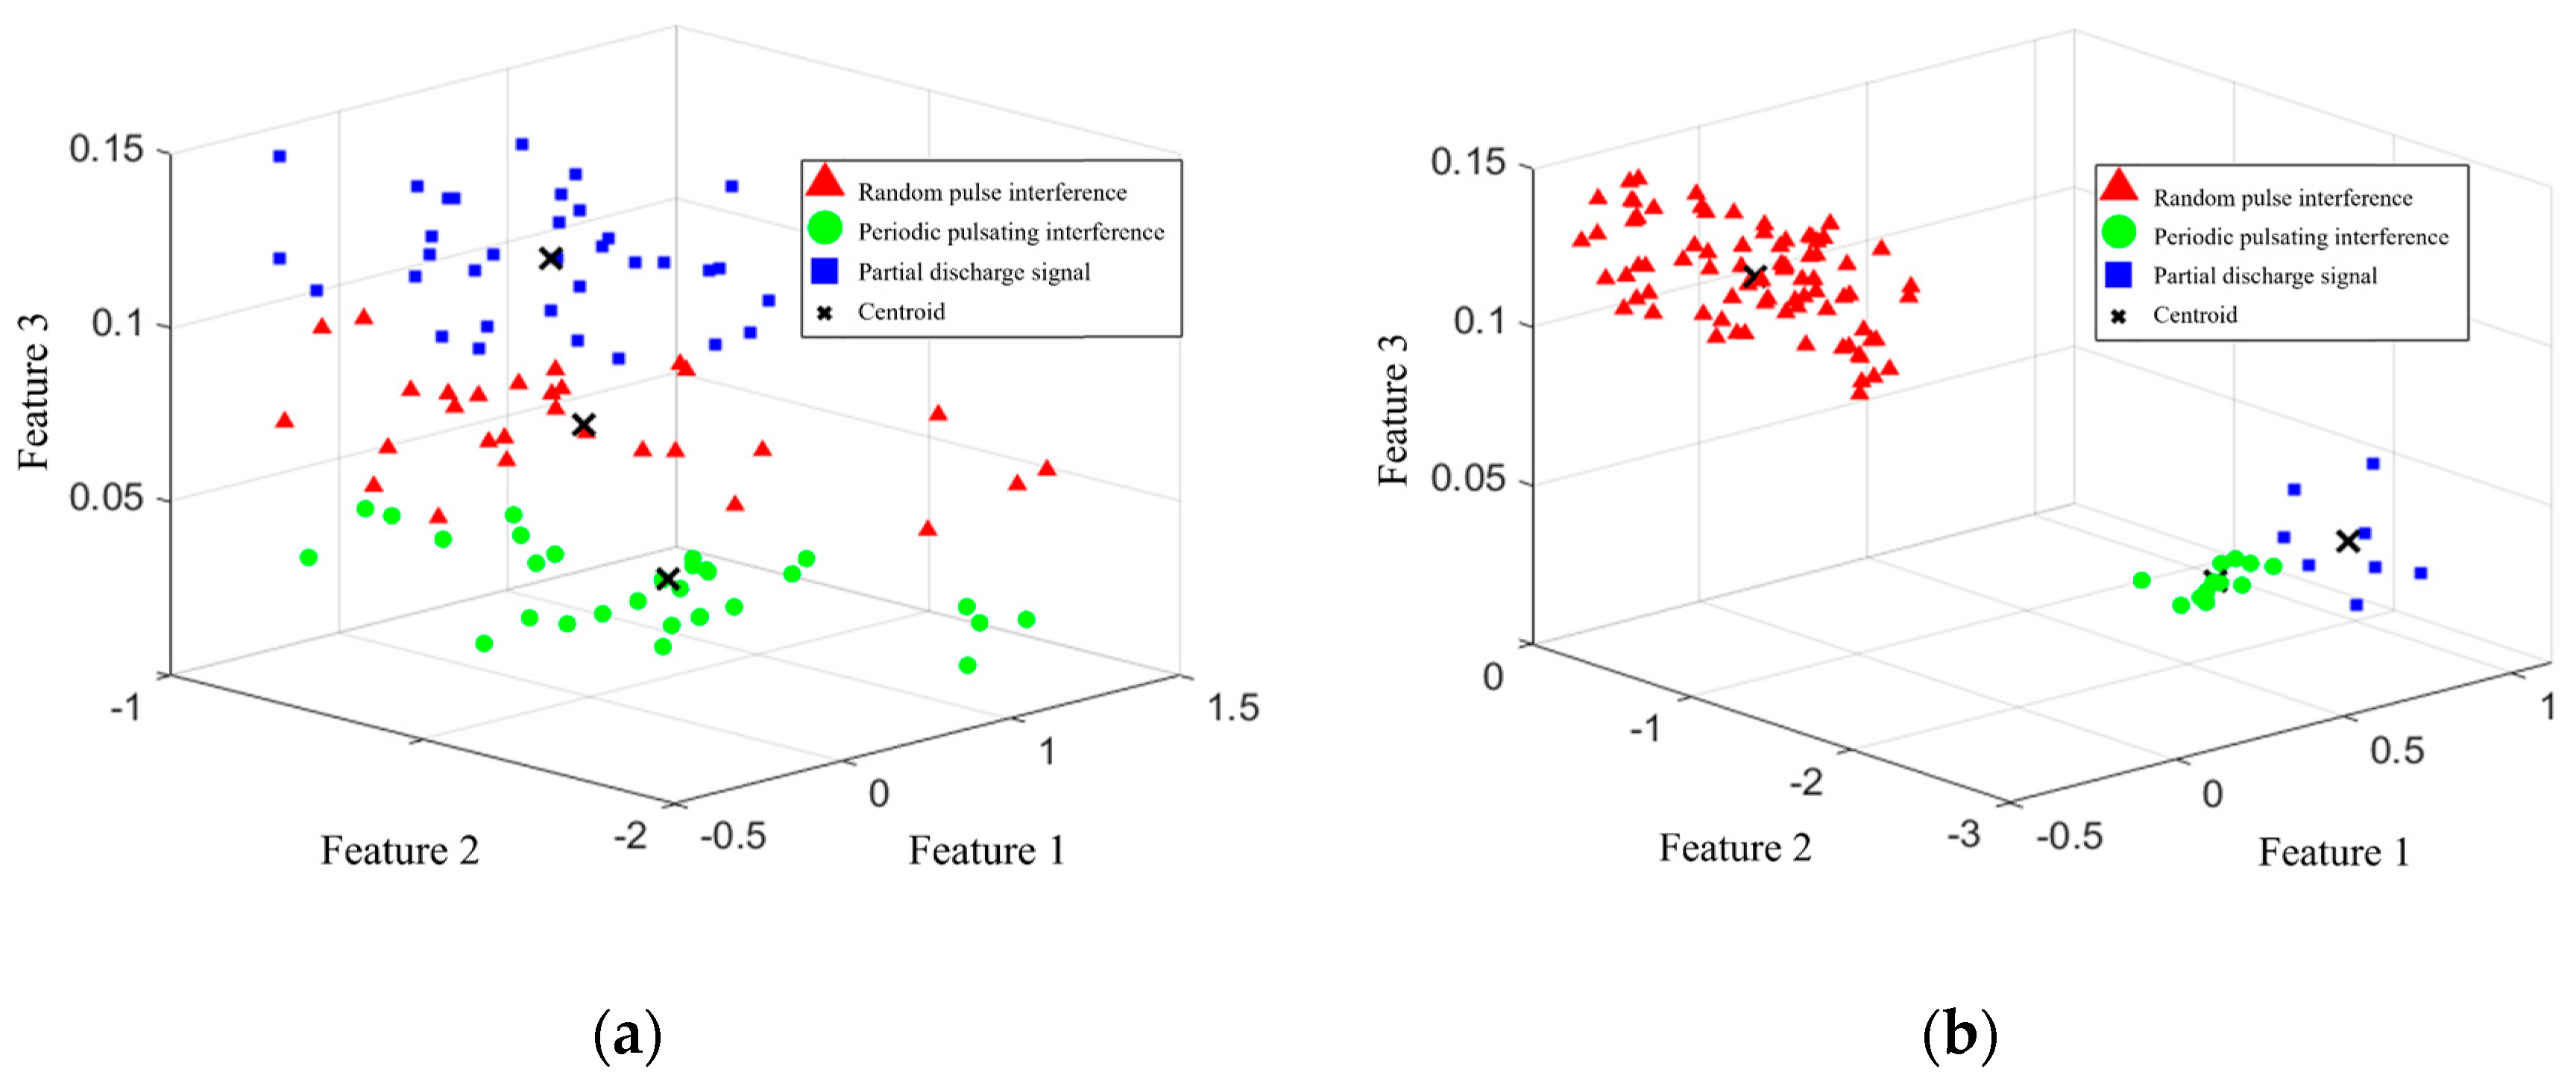
To illustrate the impact of the periodic consistency score proposed in this paper on the separation effectiveness of PD signals and periodic pulsating interference, the score is disregarded, and the optimal recognition vector of the signal is constructed solely based on the time–frequency feature group. The remaining steps of the algorithm remain unchanged as a control group for comparison with the complete time-domain multi-feature joint recognition algorithm. The pulse current signal measured at the converter station, as shown in Figure 9, is processed, while the signal clustering results are presented in Figure 11. In the figure, the x, y, and z axes represent the three features obtained after dimensionality reduction using PCA.
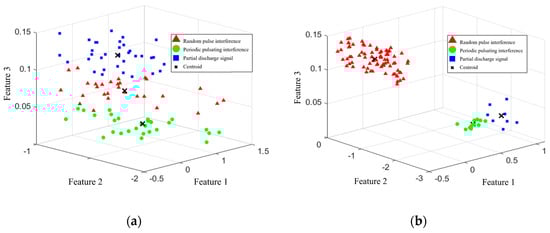
Figure 11.
Clustering and separation results of signals (a) without considering the periodic consistency score Fi and (b) considering the periodic consistency score Fi.
The results demonstrate that considering the periodic consistency score significantly enhances the signal separation effectiveness. This is because, although the time–frequency feature group describes the waveform characteristics of pulses from multiple dimensions, it only includes the time–frequency features of individual pulse waveforms. Both PD signals and interference pulses exhibit a certain degree of randomness, which may not be sufficiently distinguishable during clustering. In contrast, the periodic consistency score incorporates the phase information of the pulses, thereby representing the repetitiveness among multiple pulses. It is less affected by the randomness of individual pulse waveforms and can significantly improve the distinction between periodic pulsating interference and other pulses, thereby enhancing the denoising performance.
5. Conclusions
This paper proposed an adaptive suppression method for periodic pulsating interference in PD signals based on periodic consistency scoring and waveform characteristics. Denoising processing was performed on PD signals superimposed with on-site noise interference and on-site measured signals, leading to the following conclusions:
- (1)
- The periodic consistency score can comprehensively evaluate the periodic characteristics of signals from two dimensions: local time range and time series continuity. For periodic pulsating interference, its periodic consistency score is significantly greater than that of other pulse signals, demonstrating high accuracy and robustness in identifying periodic pulsating interference.
- (2)
- The amplitude and frequency of pulsating interference may be similar to those of PD signals, but their waveform characteristics exhibit distinct differences. The optimal recognition vector constructed based on univariate screening and redundant feature inspection can maximally reflect these differences, enabling effective separation of different signals through principal component analysis and FCM clustering.
- (3)
- The proposed algorithm is suitable for PD monitoring in the complex noise environment of converter stations. It achieves significant suppression of periodic pulsating interference while notably reducing the attenuation of PD signals during denoising, enhancing the accuracy of PD detection.
Author Contributions
Conceptualization, H.L. and Z.L.; methodology, T.B. and C.Z.; software, X.H.; validation, Z.L., T.B. and C.Z.; formal analysis, H.M.; investigation, X.S. and H.M.; data curation, H.L. and X.S.; writing—original draft preparation, Z.L. and T.B.; writing—review and editing, C.Z.; visualization, X.H.; supervision, H.M. All authors have read and agreed to the published version of the manuscript.
Funding
This research was funded by State Grid Zhejiang Electric Power Company Ltd. (5211DS24000K).
Data Availability Statement
The original contributions presented in the study are included in the article; further inquiries can be directed to the corresponding author.
Conflicts of Interest
Author Haofan Lin was employed by State Grid Zhejiang Electric Power Research Institute and Xianjun Shao was employed by State Grid Quzhou Power Supply Company. The remaining authors declare that the research was conducted in the absence of any commercial or financial relationships that could be construed as a potential conflict of interest.
References
- Mahmud, S.; Chen, G.; Golosnoy, I.O.; Chen, G.; Wilson, G.; Jarman, P. Bridging phenomenon in contaminated transformer oil. In Proceedings of the 2012 IEEE International Conference on Condition Monitoring and Diagnosis, Bali, Indonesia, 23–27 September 2012; pp. 180–183. [Google Scholar]
- Montanari, G.C. Envisaging links between fundamental research in electrical insulation and electrical asset management. IEEE Electr. Insul. Mag. 2008, 24, 7–21. [Google Scholar] [CrossRef]
- Li, Q.; Li, S.; Si, W. Analysis on key problems of oil-paper insulation state evaluation of power transformer based on partial discharge. High Volt. Eng. 2017, 43, 2558–2565. [Google Scholar]
- Duan, L.; Hu, J.; Zhao, G.; Chen, K.; He, J.; Wang, S. Identification of partial discharge defects based on deep learning method. IEEE Trans. Power Deliv. 2019, 34, 1557–1568. [Google Scholar] [CrossRef]
- Liao, R.; Yang, L.; Li, J.; Grzybowski, S. Aging condition assessment of transformer oil-paper insulation model based on partial discharge analysis. IEEE Trans. Dielectr. Electr. Insul. 2011, 18, 303–311. [Google Scholar] [CrossRef]
- Hussein, R.; BashirShaban, K.; El-Hag, A.H. Denoising of acoustic partial discharge signals corrupted with random noise. IEEE Trans. Dielectr. Electr. Insul. 2016, 23, 1453–1459. [Google Scholar] [CrossRef]
- Mondal, M.; Kumbhar, G.B. Detection, measurement, and classification of partial discharge in a power transformer: Methods, trends, and future research. IETE Tech. Rev. 2018, 35, 483–493. [Google Scholar] [CrossRef]
- Hussain, M.R.; Refaat, S.S.; Abu-Rub, H. Overview and partial discharge analysis of power transformers: A literature review. IEEE Access 2021, 9, 64587–64605. [Google Scholar] [CrossRef]
- Ji, S.; Zhao, D.; Jia, Y. Research status and prospects of development characteristics and detection methods of transformer insulation defect discharge. High Volt. Eng. 2024, 50, 4297–4314. [Google Scholar]
- Zhang, L.; Li, Q.; Wang, W.; Siew, W.H. Electromagnetic interference analysis in HV substation due to a static Var compensator device. IEEE Trans. Power Deliv. 2011, 27, 147–155. [Google Scholar] [CrossRef]
- Zhao, Z.; Qi, S.; Wang, Q.; Siew, W.H. Research on the Electromagnetic Disturbance Source Considering the Effect of Valve Tower Stray. In Proceedings of the 2010 Asia-Pacific International Symposium on Electromagnetic Compatibility, Beijing, China, 12–16 April 2010; pp. 409–413. [Google Scholar]
- Jacob, N.D.; McDermid, W.M.; Kordi, B. On-line monitoring of partial discharges in a HVDC station environment. IEEE Trans. Dielectr. Electr. Insul. 2012, 19, 925–935. [Google Scholar] [CrossRef]
- Fang, Z.; Liu, H. Research on Peak Denoising of Partial Discharge Signals Based on Wavelet Transform. Power Capacit. React. Power Compens. 2022, 43, 102–105. [Google Scholar]
- Yang, D.; Zhang, W.; Xu, G.; Li, T.; Shen, J.; Yue, Y.; Li, S. Partial Discharge Pulse Segmentation Approach of Converter Transformers Based on Higher Order Cumulant. Energies 2022, 15, 415. [Google Scholar] [CrossRef]
- Janani, H.; Shahabi, S.; Kordi, B. Separation and classification of concurrent partial discharge signals using statistical-based feature analysis. IEEE Trans. Dielectr. Electr. Insul. 2020, 27, 1933–1941. [Google Scholar] [CrossRef]
- Alvarez, F.; Ortego, J.; Garnacho, F.; Sánchez-Urán, M.A. A clustering technique for partial discharge and noise sources identification in power cables by means of waveform parameters. IEEE Trans. Dielectr. Electr. Insul. 2016, 23, 469–481. [Google Scholar] [CrossRef]
- Cunha, C.F.F.C.; Carvalho, A.T.; Petraglia, M.R.; Lima, A.C.S. A new wavelet selection method for partial discharge denoising. Electr. Power Syst. Res. 2015, 125, 184–195. [Google Scholar] [CrossRef]
- Zhu, M.-X.; Zhang, J.-N.; Li, Y.; Wei, Y.-H.; Xue, J.-Y.; Deng, J.-B.; Mu, H.-B.; Zhang, G.-J.; Shao, X.-J. Partial discharge signals separation using cumulative energy function and mathematical morphology gradient. IEEE Trans. Dielectr. Electr. Insul. 2016, 23, 482–493. [Google Scholar] [CrossRef]
- Zhang, S.; Li, C.; Wang, K.; Li, J.; Liao, R.; Zhou, T.; Zhang, Y. Improving recognition accuracy of partial discharge patterns by image-oriented feature extraction and selection technique. IEEE Trans. Dielectr. Electr. Insul. 2016, 23, 1076–1087. [Google Scholar] [CrossRef]
- Huang, L.; Tang, J.; Ling, C. Pattern recognition for partial discharge based on multi-feature fusion technology. High Volt. Eng. 2015, 41, 947–955. [Google Scholar]
- Ma, J.; Yang, G.; Cao, P. Feature selection and dimensionality reduction of discharge acoustic signal based on correlation and between-class difference. High Volt. Eng. 2023, 49, 1194–1204. [Google Scholar]
- Ma, H.; Chan, J.C.; Saha, T.K.; Ekanayake, C. Pattern recognition techniques and their applications for automatic classification of artificial partial discharge sources. IEEE Trans. Dielectr. Electr. Insul. 2013, 20, 468–478. [Google Scholar] [CrossRef]
- Zhou, D.; Zhang, X.; Zou, Y.; Ni, Y.; Wang, D. Study on partial discharge pattern recognition for distribution cable based on T-F clustering and PRPD spectrum analysis. J. Electr. Eng. Technol. 2022, 17, 235–242. [Google Scholar]
- Hua, X.; Mu, H.; Jin, L.; Ji, Y.; Zhan, J.; Shao, X.; Zhang, G. A novel adaptive parameter optimization method for denoising partial discharge ultrasonic signals. IEEE Trans. Dielectr. Electr. Insul. 2023, 30, 2734–2743. [Google Scholar] [CrossRef]


Disclaimer/Publisher’s Note: The statements, opinions and data contained in all publications are solely those of the individual author(s) and contributor(s) and not of MDPI and/or the editor(s). MDPI and/or the editor(s) disclaim responsibility for any injury to people or property resulting from any ideas, methods, instructions or products referred to in the content. |
© 2025 by the authors. Licensee MDPI, Basel, Switzerland. This article is an open access article distributed under the terms and conditions of the Creative Commons Attribution (CC BY) license (https://creativecommons.org/licenses/by/4.0/).