Article

Improvement of Self-Consumption Rates by Cogeneration and PV Production for Renewable Energy Communities

Tools and Services for Critical Infrastructures and Renewable Energy Communities Division, Energy Technologies and Renewable Sources Department, ENEA—National Agency for New Technologies, Energy and Sustainable Economic Development, Via dei Mille 21, 40121 Bologna, Italy
*
Author to whom correspondence should be addressed.
Electronics 2025, 14(9), 1755; https://doi.org/10.3390/electronics14091755
Submission received: 14 March 2025 / Revised: 17 April 2025 / Accepted: 18 April 2025 / Published: 25 April 2025
(This article belongs to the Special Issue Smart Energy Communities: State of the Art and Future Developments)

Abstract

:
The goal of decarbonization has driven the adoption of several intervention strategies across Europe, including the promotion of Renewable Energy Communities (RECs). This study analyses an electric REC in Italy to explore the performance of different potential energy mixes combining a biogas-based cogeneration (CHP) system and photovoltaic (PV) plants. The analysis is based on a real REC composed of 53 members (mainly companies) with a Self-Sufficiency Rate (SSR) of 92% and a Self-Consumption Rate (SCR) of 60%. Adding 550 residential consumers (apartments) to the REC, the total production matches total consumption, and both SSR and SCR converge to 84%. Compared to RECs that rely solely on PV systems, this case study shows that biogas integration leads to an increase of around 40 percentage points in both SSR and SCR—equivalent to an average gain of 0.4 to 0.6 percentage points for each percentage point increase in the CHP share of the CHP-PV production mix. The analysis quantifies how SSR and SCR vary not only with different biogas/PV production ratios but, more importantly, with variations in the total annual production-to-consumption ratio of the RECs. These results can guide the design of RECs tailored to the specific characteristics of local contexts.

1. Introduction

The European Union has set the goal of reducing greenhouse gas emissions, aiming to reach net zero by 2050. To achieve this goal, several decisions have been taken, including the approval of the Clean Energy Package [1] and the RED II directive [2]. This directive promotes, among other things, Renewable Energy Communities (RECs), i.e., entities that bring together consumers and producers to share the energy they produce in the community. The goal is to place citizens at the heart of the ecological and energy transition, making them key players in community management. The study of possible business models linked to energy communities (ECBMs [3,4]) allows to identify the expected advantages, both economic and non-economic ones, that push users to participate in the community.
The concept of self-consumption is therefore fundamental to the set-up (i.e., the composition of its different members and the mix production technologies), operation (e.g., demand-response management), and sustainability of Energy Communities (ECs). It lies at the core of optimization models and systems designed to maximize local electricity exchanges (e.g., [5,6]), national energy policies that, despite their differences, aim to promote it (see, for instance [7], for approaches in Italy and Portugal), and corporate business models for local energy markets [4].
Italy has recently implemented the European directives with a model that promotes the “virtual” exchange of electricity: the energy shared in a community (defined as the minimum, every hour, between withdrawal and injection from the electricity grid by the community members) is economically incentivized, with a maximum extension that coincides with the border of the High-Voltage/Medium-Voltage (HV/MV) substation. This approach allows for the promotion of local self-consumption without requiring costly new infrastructure.
RECs are therefore one of the tools implemented to promote the energy transition towards more sustainable production and consumption models. In recent years, numerous articles on RECs have been published, with different approaches and application domains (economic, social, energy or environmental). Some recent reviews highlight the strengths and weaknesses of RECs, the benefits and the barriers still existing to their diffusion, adopting for them different Key Performance Indicators (KPIs) to be optimized depending on the identified objectives [8,9,10,11,12,13,14].
Paper [15] explores the concepts, benefits, and challenges of ECs while offering recommendations to policymakers, researchers, and industry professionals to support sustainable, community-driven energy systems; in [16] a review of the state of the art in ECs is carried out, addressing trends, energy system modeling, business models, and optimization objectives, while advocating for multidisciplinary approaches, including social considerations.
RECs can be developed upon a variety of different technologies for energy production, which in turn are mixed and composed depending on context characteristics, opportunities and design choices, and can be compared from both an energy and economic point of view: energy from photovoltaic (PV), on-shore and off-shore wind, biomass plants, hydroelectric, geothermal. Now, according to the European Electricity Review 2024 [17], PV is the fastest growing technology and, together with wind, is driving the energy transition (combined, the two renewable sources represent 13.4% of the electricity mix in Europe in 2023). In this context, in [17] it is also highlighted that Germany and Italy are the leading producers of bioenergy, primarily from biogas, which accounts for approximately 5% of electricity generation in the EU. Each of these sources has different characteristics and specific behaviors that can influence production profiles. The study and creation of RECs therefore involve the analysis and identification of the best available energy mix (the study in [18] presents a hybrid solar and biogas heating system for a rural area) and the right match between producers and consumers [19] to maximize self-consumption and the energy independence of a community; in this, not only production profiles are taken into consideration, but also consumption profiles, which differ depending on the subjects involved (residential or public structures, large/medium/small businesses, etc.).
In this context, the concept of NZE (Net Zero Energy) was born: the idea of buildings, districts, or communities with very high energy performances, in which the energy requirement is covered largely or totally by energy from renewable sources, including that produced on site or nearby, thus also having a nearly zero greenhouse gas (GHG) emission balance [20]. Several activities have been oriented towards achieving this objective, and several case studies have been analyzed [21] to identify the strategies and technologies suitable for mitigating impacts and achieving the NZE objective, also highlighting the factors that have led to the failure to achieve the desired result (for example, inadequate energy generation, lack of storage or control systems). Some of these have focused on communities that are characterized by the existence of biomass plants [22] and others have led to the creation of simulation models to study the exploitation of both PV production and the organic fraction of municipal solid waste collected by the community [23]. The analysis in [24] tries to estimate in a use case the best configuration for a system based on PV and biomass to supply energy to a community of 94 residential buildings, using energy and economic indicators and evaluating the sizing of the system.
Another study conducted on an EC based on biomass, PV, and hydroelectric production is present in [25]: in this case a model for the analysis and optimization of system configurations serving energy communities has been adapted to evaluate the economic aspects of a REC in Tirano, considering both electrical and thermal aspects. This study highlighted the contribution of biomass plants and the economic feasibility of such RECs. The research also highlights how such configurations can contribute to the development of initiatives aimed at promoting all renewable technologies to enhance the local resources of each territory. The authors of [26] instead report a preliminary design for a hybrid system that combines PV and biogas serving an off-grid community, highlighting the potential and flexibility of the system in meeting energy needs both within seasonal and daily periods.
In Italy, according to a mapping carried out by the Italian Ministry and GSE (the Italian manager for energy services), at the end of 2024, approximately 800 different forms of ECs (including remote self-consumption) were established [27]. Most of these (i.e., 94% of the power installed in the communities) are based on PV production systems. PV technology has now spread in Italy and represents, at the end of 2023, 9.8% of the gross national electricity consumption [28]. Installation prices are now relatively low (typically 1000–2000 Euros/kWp), but, producing energy only during daytime hours, the average self-consumption rate is only about 48.6% in Italy (2023). In the Veneto region, the average self-consumption rate is approximately 42% for the residential and agricultural sectors and 57–60% for the industrial and tertiary sectors [29]. However, the comparison of self-consumption rates across different users and RECs is not straightforward because, as will be highlighted later, the self-consumption rate strongly depends on the ratio between (daily and annual) production and the consumption, which is often not specified in the literature. In the residential sector, when the installed system produces an annual amount of energy equal to that consumed, the typical self-consumption values are 30–40% [30]. Simulations of different combinations of users (residential houses, restaurants, offices) and total PV rated power (kWp), even achieving high self-consumption rates (higher than 30–40%), cannot achieve self-sufficiency rates higher than 42% [31,32].
The study presented in this article is based on a REC whose main energy production is yield from a biogas-fueled plant in Combined Heat and Power (CHP) configuration. The REC is being established in Villafranca Padovana (Veneto, Italy)—one of the very few in Italy to include a CHP system, as most consist solely of PV installations.
The present analysis aims to calculate the most relevant energy quantities of this REC, such as shared energy, direct self-consumption, electric self-consumption and self-sufficiency rates, to support an assessment of its energy performance and economic sustainability. The novelty of this paper lies in the quantification of the variation in self-consumption and self-sufficiency for different energy production mixes from biogas and PV plants, as a function of the REC production-to-consumption ratio. Although it is widely demonstrated in the literature that biogas can achieve significantly higher self-consumption than PV, to the best of our knowledge, no study has analyzed how self-consumption and self-sufficiency vary with different biogas/PV production mixes and with variations in the annual REC production-to-consumption ratio. In practice, total energy consumption, PV production, and biogas production are sometimes fixed parameters—or at least not entirely free variables—due to external constraints such as the available surface area for PV installations and the limited amount of organic waste for biogas production. This approach allows for a deep understanding of the REC energy behavior and enables the right management, planning, and forecasting of KPI trends when integrating consumption (i.e., adding members) into community or when analyzing RECs with similar production/consumption profiles. The description of REC KPIs using the total production-to-consumption ratio has not been previously applied for analysing RECs based on biomass and PV energy. This method, based on production-to-consumption ratio, remains valid as long as the production profile and the consumption profile of the RECs keep the same shape, albeit with varying magnitude.
The approach presented here builds upon the methodology we previously introduced in [33], which focused exclusively on RECs based on PV power plants.
In general, the efficiency of a CHP system is strictly related to the simultaneous use of electricity and heat. According to the Italian regulations for biogas plants within RECs, the thermal energy produced must be recovered and primarily self-consumed on-site to support business processes or alternatively feed an efficient district heating system. Within the Italian REC framework, only the electricity produced and fed into the grid is eligible for incentives. Therefore, thermal energy is not considered in this study.

2. Materials and Methods

A comprehensive review of energy systems modelling, objective functions, and optimization methods applicable to ECs was conducted in [12,16]. The methodologies found in the literature differ primarily in two aspects: (1) the objectives and KPIs to be optimized—either individually or in combination, and (2) the optimization algorithms employed.
Regarding the first aspect, KPIs can be energy-related (e.g., self-consumption in [34,35]), economic (e.g., Net Present Value in [36]), environmental (e.g., CO2 reduction in [37]), or social (e.g., job creation in [38]). In this paper, we focus on energy-related KPIs, as they represent the core rationale behind the creation of RECs. In addition, many of the other indicators are directly influenced by energy ones—for example, CO2 reduction depends on the level of REC self-sufficiency. This paper focuses on two main KPIs:
  • Self-Consumption Rate (SCR), which indicates the extent to which the electricity generated by local power plants is used within the REC. This also results in a reduced impact on the electricity grid.
  • Self-Sufficiency Rate (SSR), which reflects the level of energy independence of the REC. Low SSR values indicate a greater dependence on external—often fossil-based—energy sources.
These two KPIs should be evaluated jointly, as they exhibit opposite behaviors [39].
The algorithms used to optimize these KPIs can be either exact or heuristic (providing a “feasible” solution rather than an optimal one). Some examples are presented in Table 1. Among these, the most commonly used is the Mixed-Integer Linear Programming (MILP) algorithm, which follows an exact approach. For a more in-depth discussion of these methods, see [13,16], as well as our previous work [33].
The approach adopted in this paper is not to optimize one or two KPIs, but rather to explore how these indicators depend on the REC production-to-consumption ratio and on the renewable energy mix, by conducting a sensitivity analysis.
The assessment of the REC and the calculations reported in this study are obtained thanks to the SIMUL-REC tool developed by ENEA (version 2.0 of 15 November 2024), based on the mathematical model extensively depicted in [33]. Starting from detailed load profiles, this paper reports the variation of some KPIs (see Section 2.2 below) for hybrid RECs who rely on CHP—PV energy production, considering total production and consumption as the main independent variables, with their ratio influencing electric self-consumption and self-sufficiency.

2.1. The SIMUL-REC Tool

The SIMUL-REC tool was designed for modeling RECs starting from the consumption profiles of users (with a time series data frequency of 15 min or one hour) and from the characteristics of the renewable energy production plants (such as rated power of PV plants, orientation, tilt, etc.), thus creating a “digital twin” of the same community. In the event of unavailability of the consumption profiles, the tool uses standard curves provided by GSE modulated on real monthly or annual consumption values in the time slots F1, F2, F3 (F1: Monday to Friday, 8:00–19:00. This represents peak-time consumption during daylight hours. F2: Monday to Friday, 7:00–8:00 and 19:00–23:00; 7:00–23:00 on Saturdays. These time slots generally represent “intermediate” consumption hours. F3: Monday to Saturday, 0:00–7:00 and 23:00:24:00; Sundays and national holidays: all day. These are typically off-peak hours, though for certain users (e.g., hotels and restaurants), Sundays may represent a significant share of consumption), used in Italy to distinguish the daily, night-time time slots and the days of the week [33,47]. Using the production and consumption profiles of all members, SIMUL-REC computes in detail all energy quantities and KPIs (such as self-consumption, self-sufficiency, etc., as described in the next section) for both each member and for the entire REC. Additionally, the tool calculates SCR and SSR as a function of the total production/consumption ratio. As demonstrated in [33], SCR and SSR have always the same values with the same annual total production/consumption value, provided that the consumption and production profiles of the REC remain similar across the various cases. These parameterization graphs, described in Section 3.3, are useful in the design phase, in the evaluation of alternative scenarios and in community management.

2.2. Calculation Methods and KPIs

The equations for the REC analysis were presented in detail in [33] and the definitions of the main quantities and KPIs can be summarized as follows:
  • Direct Self-consumption (SCdir): the share of electricity produced by the single PV system and physically used by the user directly connected to the PV system (prosumer user). It corresponds to the minimum between the energy produced (Pi) and the energy consumed (Ci) at any given moment by the single user i. It is the quantity that avoids the need to purchase energy from the grid.
  • Shared Energy (SE): the quantity of energy virtually exchanged within the perimeter of the REC; it corresponds to the minimum between the energy fed into the grid (F) and the energy withdrawn from the grid (W) every hour by the group of members involved in the EC. It is the quantity that, while not avoiding the purchase of energy from the grid, allows the energy produced to be exploited locally.
  • Total Consumption (Ctot) of the entire REC: can be calculated as the sum of the consumptions of all members of the REC. It corresponds also to the total direct self-consumption plus the total withdrawal of all the members (Ctot = SCdirtot + Wtot).
  • Total Production (Ptot) of the entire REC: it can be calculated as the sum of the productions of all members of the REC, and it corresponds also to the total direct self-consumption plus the total injection of all the members (Ptot = SCdirtot + Ftot).
  • Total Self-Consumption (SCtot), or the total amount of energy self-consumed locally, within the perimeter of the REC; it is obtained by adding the total direct self-consumptions and the shared energy (SCtot = SCdirtot +SEtot).
  • Total Self-Consumption Rates (SCRtot) of the REC:
    SCRtot = SCtot/Ptot, the ratio between total self-consumption and total production (Ptot) of the community in the considered period. It reflects the degree of local use of energy production.
  • Total Self-Sufficiency Rates (SSRtot) of the REC:
    SSRtot = SCtot/Ctot, the ratio between total self-consumption and total consumption (Ctot) of the community in the considered period. It shows the level of energy independence of the community.
  • In particular, considering a period of one day, SCR and SSR can be calculated for every day of the year:
    SCRtot,day = (SCdirtot,day + SEtot,day)/Ptot,day;
    SSR tot,day = (SCdirtot,day + SEtot,day)/Ctot,day.
These quantities and KPIs can be applied to actual REC configurations or to characteristic scenarios, such as the Net ZEC (Net Zero Energy Community) condition, where the total annual energy production equals the total annual energy consumption (Ptot/Ctot = 1), and thus, by definition, SCRtot equals SSRtot.
Figure 1 shows the flow chart of the methods and algorithms used to calculate and analyze the main KPIs (SSR, SCR, and Net ZEC) for different P/C ratios.

2.3. The REC of Villafranca Padovana

The REC under analysis is located in an inland area of Villafranca Padovana and is currently under development. It comprises a total of 53 users, 51 of whom are consumers only, as detailed in Table 2 and Table 3. The users (members) involved are mainly agricultural companies, processing companies, commercial activities, catering and residential homes. The reference period of the data collected for the analysis is one year, from 1 July 2023 to 30 June 2024.
The REC is based on the enhancement of an existing biogas system in CHP configuration. The plant’s electrical capacity has increased from 299 kW to 799 kW by adding a new 500 kW CHP plant.
In biogas plants the production is largely constrained by the availability of feedstock and the operation of the associated CHP system in our case study is maximized by exploiting the abundant availability of feedstock (organic waste) from the plant owner and nearby companies. As a result, the operational strategy is to run the biogas plant at full production without modulating it according to local consumption, feeding the generated electricity into the grid, and use the heat locally. The thermal power of the CHP system is used to heat livestock facilities, however, it does not influence the operation of the CHP.
The electricity produced by the new CHP plant (producer) is fully transferred to the grid and can be shared with the members of the community. Since the new plant was recently installed, its actual electricity production profile is not yet fully available. However, the power data of the existing biogas plant were combined with the newly available data to estimate the hourly electricity production of the new 500 kW CHP plant over a reference period of one year.
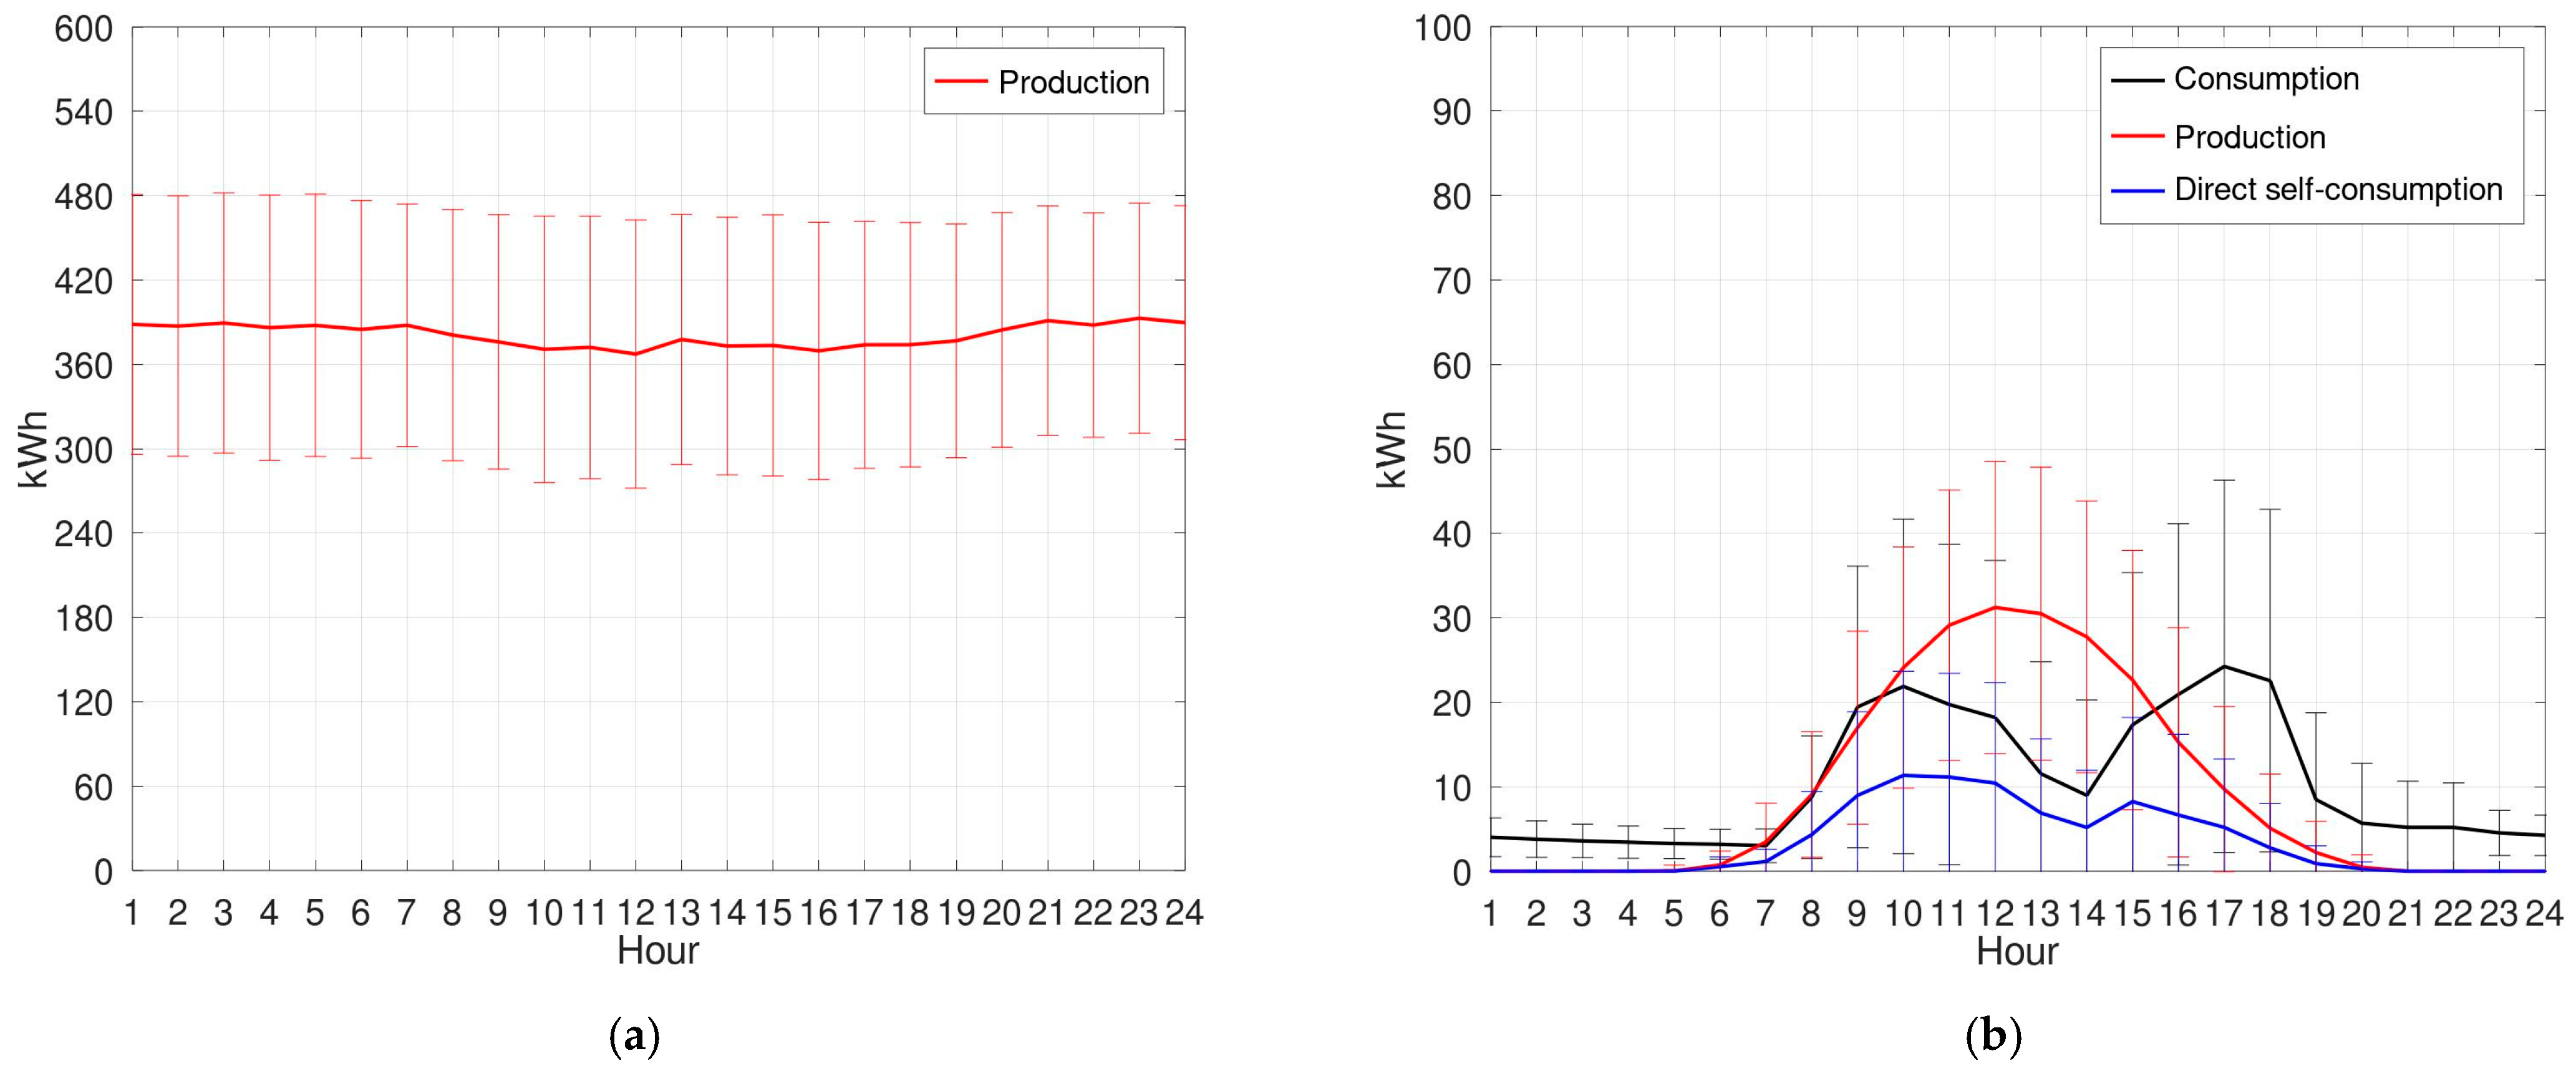
Figure 2, Figure 3 and Figure 4 show the daily average profiles, derived from the full hourly profiles of one year, which were then averaged for each hour of the day (averaging the 366 curves of the year). Figure 2a shows the daily average production profile of the new CHP plant. This profile is flat because the biogas plant operates at full production throughout the day and year, except for temporary interruptions due to maintenance or grid disconnections. To summarize, operating the plant at full production maximizes the performance of the CHP system and its associated electricity and heat production for the following reasons:
  • Electrical production is fed into the grid and sold.
  • A large supply of organic waste for the feedstock of the biogas plant is available from the plant owner and nearby companies.
  • The heat production is used for heating the livestock farm systems.
Under these operational conditions, the new 500 kW CHP plant generates nearly 98% of the electricity produced by the REC.
The production system for direct self-consumption (Prosumer) consists of a single PV system with an installed capacity of 64.5 kW, contributing approximately 2% of the REC’s total electricity production. The PV production for each hour was calculated based on actual weather conditions (i.e., solar irradiation, ambient temperature, and wind speed), assuming a PV panel with 30° of tilt, southerly direction and 10% system loss. The average daily hourly profile of production, consumption, and direct self-consumption by the prosumer is shown in Figure 2b.
The total installed capacity for this REC is approximately 564.5 kW, and no energy storage system is installed.
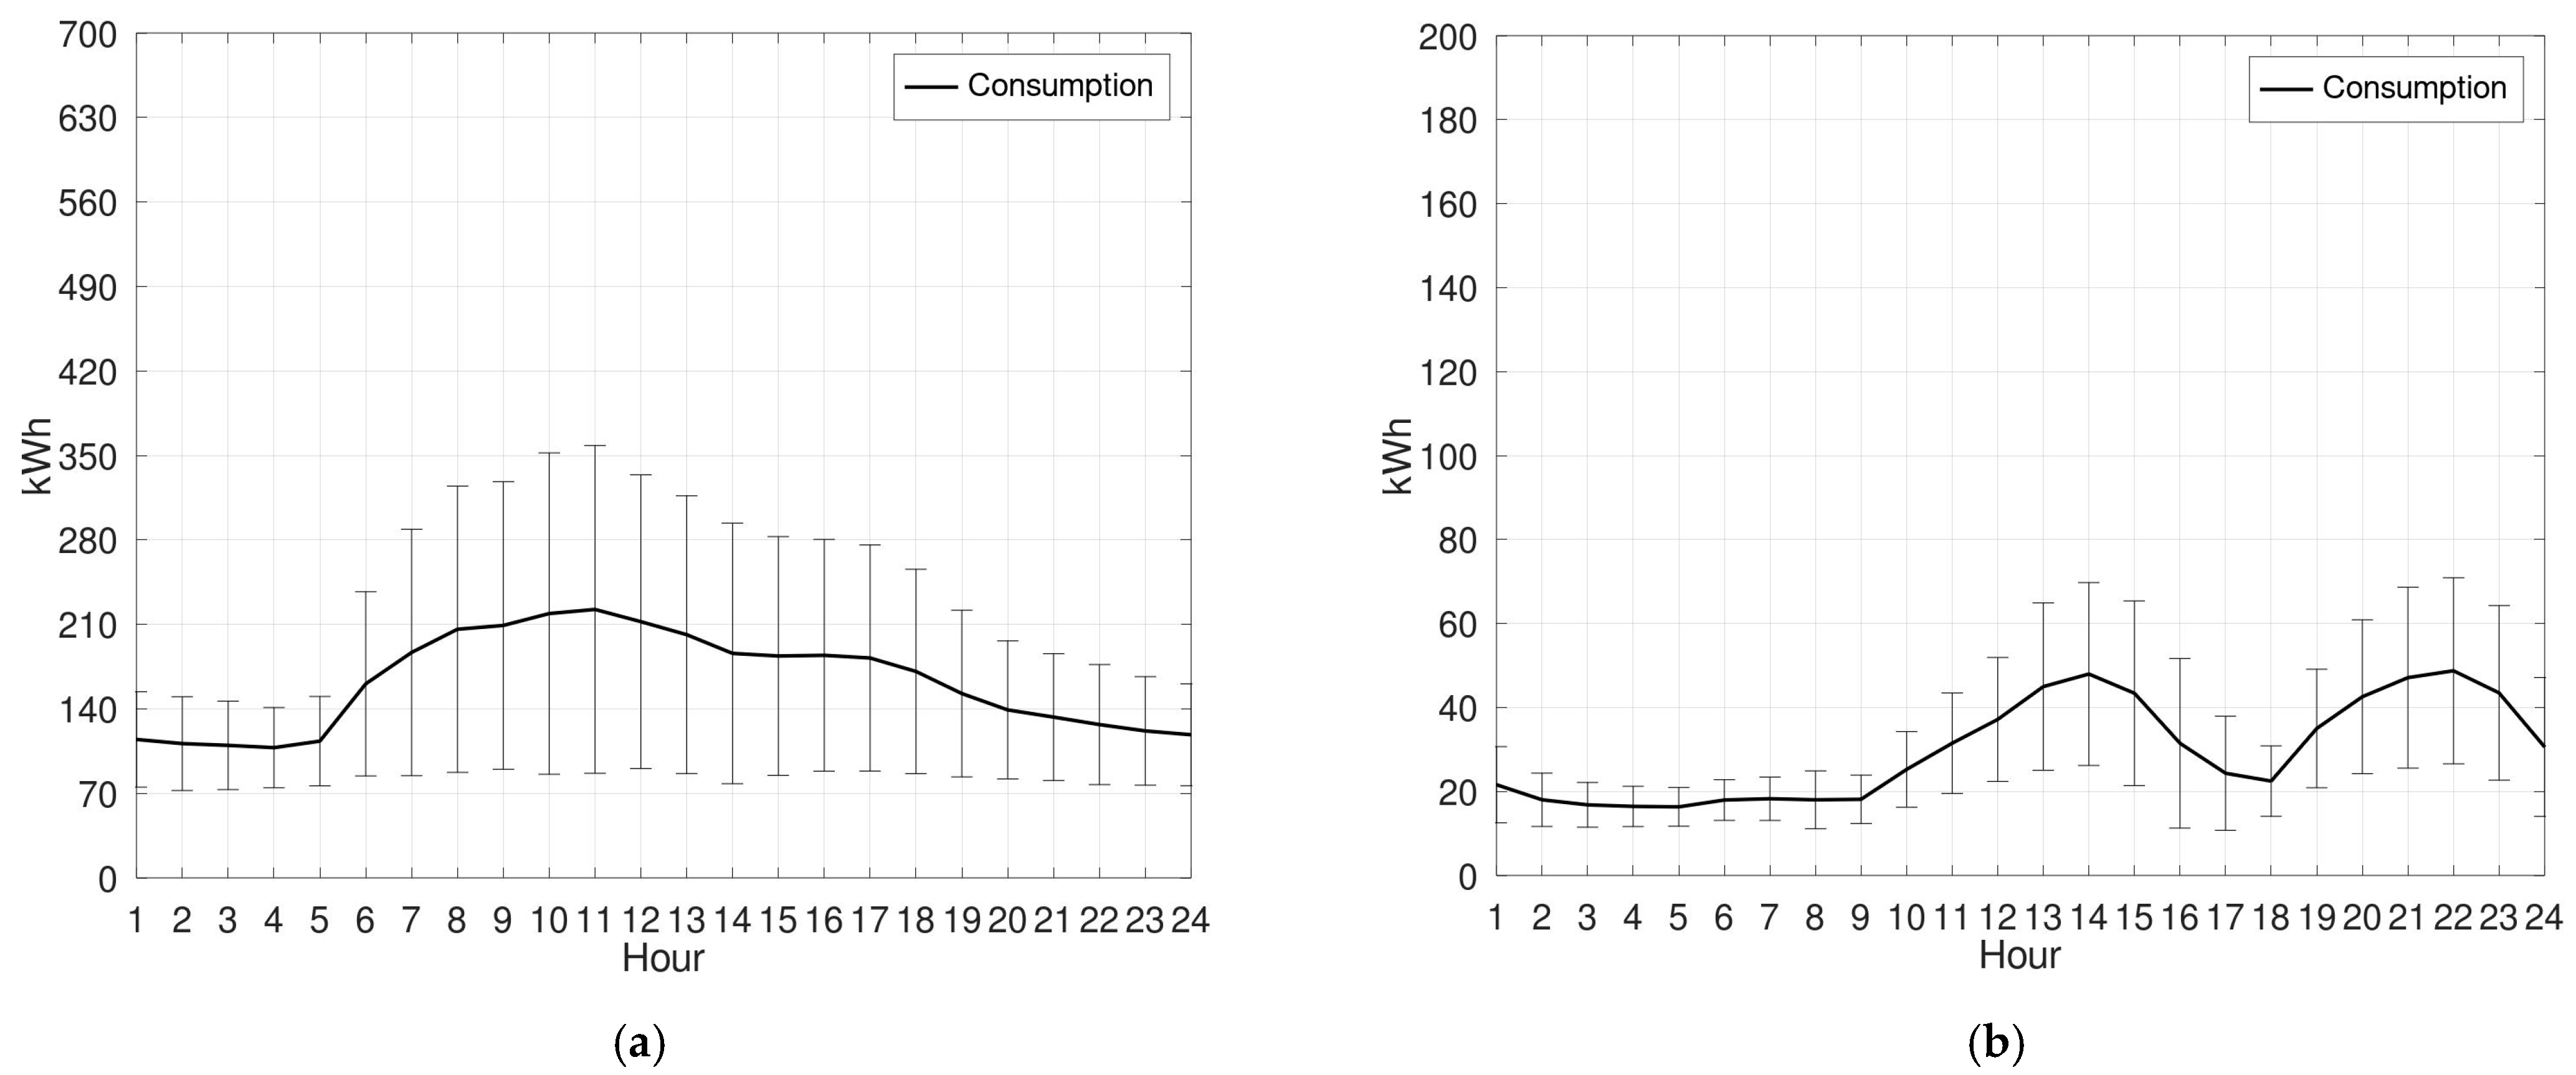
About 81% of the consumption taken into account in the analysis is due to six members for which the actual quarter-hourly consumption profile is available. The main consumer profiles of the community are represented in Figure 3a,b. The first profile has a flattened bell shape with a maximum at 11 am, while the second profile has a double bell shape with a maximum at hours 14 and 22.
The remaining 19% of the electricity consumption is derived from approximate (synthetic) profiles, calculated using a mix of standard GSE curves and actual electricity bill data. Figure 4 shows the average daily hourly consumption profiles of domestic and non-domestic users based on these GSE standard curves. In domestic users (Figure 4a) the highest values are in the 19.00–23.00 time slot, with the peak at 21.00, whereas, in non-domestic users (Figure 4b) there are on average two peaks of consumption at hour 12.00 and 18.00. In the reference configuration of the REC, these types of profiles are used to represent about 11.2% of total consumption in the reference REC, and they will be used in the following sections to simulate the different configuration scenarios.

3. Results

3.1. REC Main Results

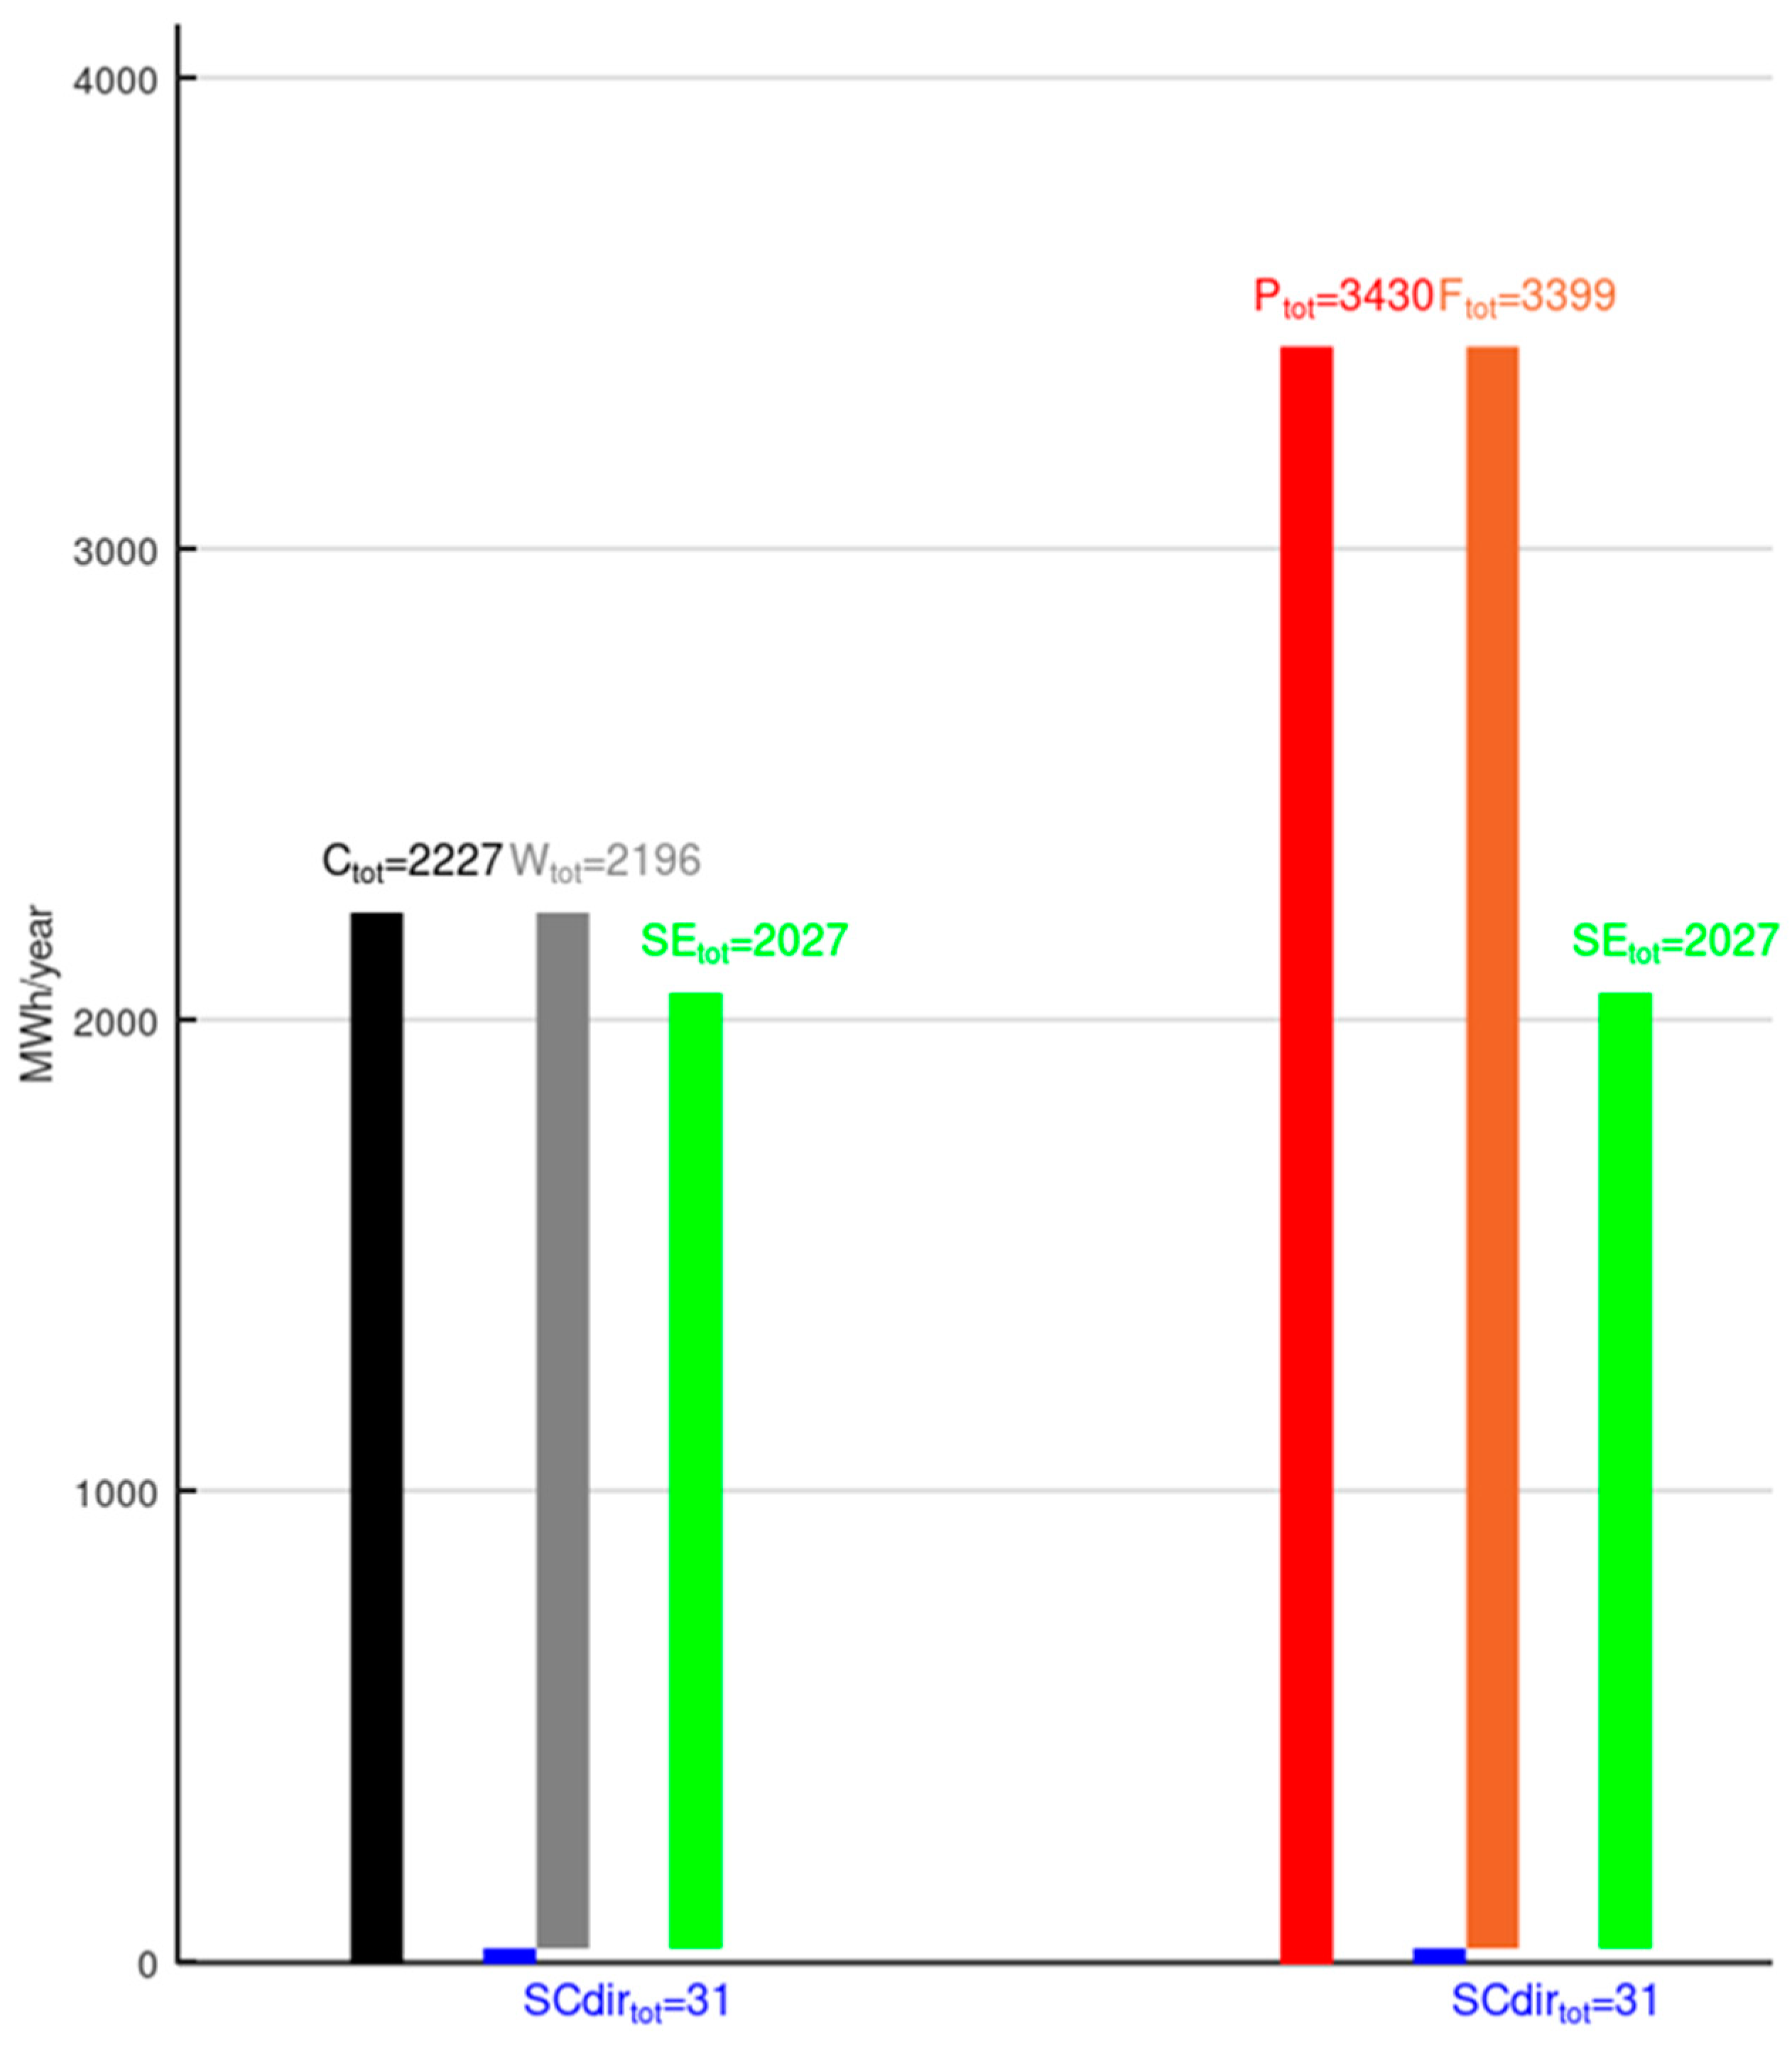
The results of the actual electricity production and consumption, and its breakdown, obtained from the SIMUL-REC tool for the entire REC over the whole year, are shown in Figure 5. On the left of the image, the energy demand of the entire REC is plotted as the sum of the energy produced and directly self-consumed, along with the energy purchased from external sources. On the right, the total production is assessed as the sum of the produced and directly self-consumed energy, plus the energy fed into the grid.
The shared energy (SEtot) consists of the portion of energy fed into the grid by some users that is simultaneously withdrawn, during the same hour, by other REC users.
The community’s production is approximately 50% higher than its consumption (Ptot/Ctot = 1.54). The total self-consumption (SCtot = SCdirtot + SEtot) amounts to 2,058,000 kWh/year.
Direct self-consumption accounts for only 1% of the produced energy, while shared energy represents about 59% of the produced energy. Consequently, 60% of the REC’s produced energy is used locally. The self-consumption and self-sufficiency rates of the REC are reported in Table 4. These values indicate that the produced energy allows the REC to be self-sufficient for approximately 92% of its total consumption.
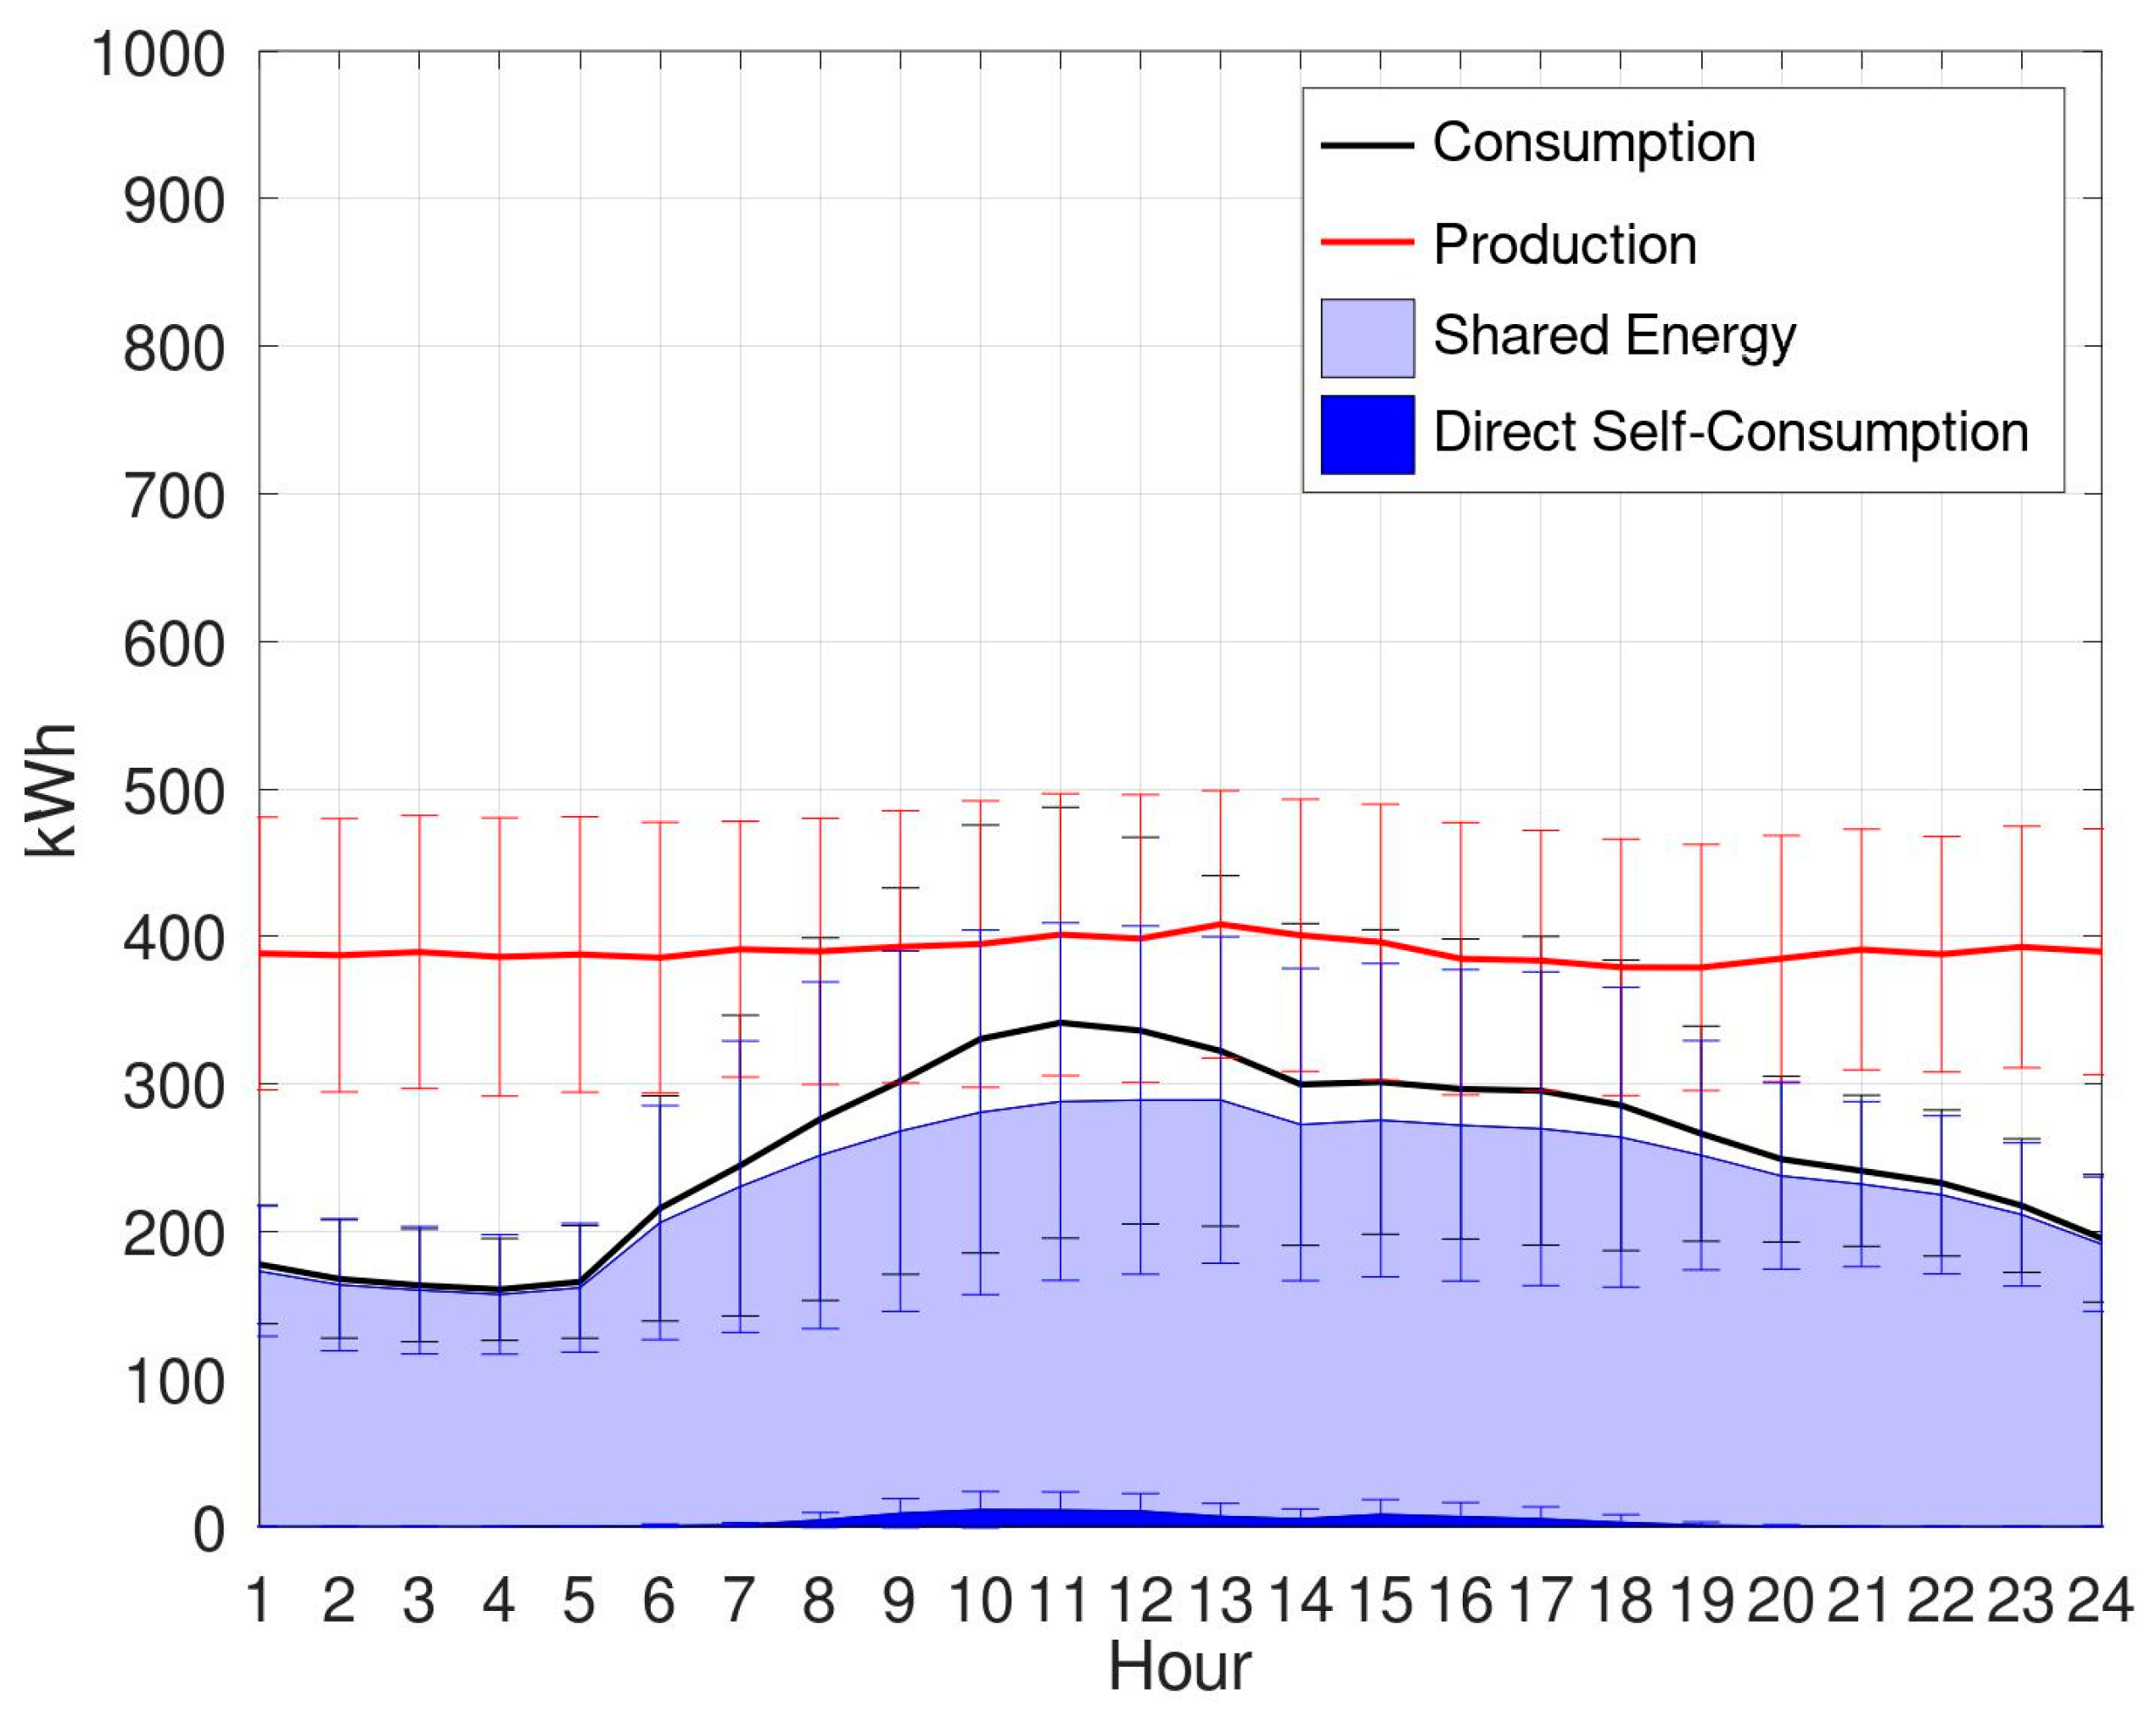
Using SIMUL-REC, the average daily hourly curves and their standard deviations (Figure 6) for consumption, production, shared energy, and direct self-consumption were calculated. The shape resembles a bell curve, peaking at 11 a.m., similar to the highest energy-consuming member of the REC (see the profile in Figure 3a). The area highlighted in violet shows that most of the consumed energy is shared energy.

3.2. Seasonality

The consumption exhibits both weekly and daily patterns, with peak values occurring on weekdays during daylight hours, when it exceeds production levels. Conversely, on holidays and during nighttime, consumption consistently remains lower than production. The seasonality of the electric self-consumption and self-sufficiency rates of the entire REC can be observed in Figure 7, which shows the daily trends of these rates throughout the year.
As highlighted above, the overall self-consumption has an annual average of 60%, but it fluctuates throughout the year depending on consumption and production during different periods, with daily rates ranging from a minimum of 30% to a maximum of 100%. The daily self-sufficiency rate (SSRtot,day) also reaches values close to 100% during periods of high energy production from the biogas plant.

3.3. The SCR-SSR-PC Curve

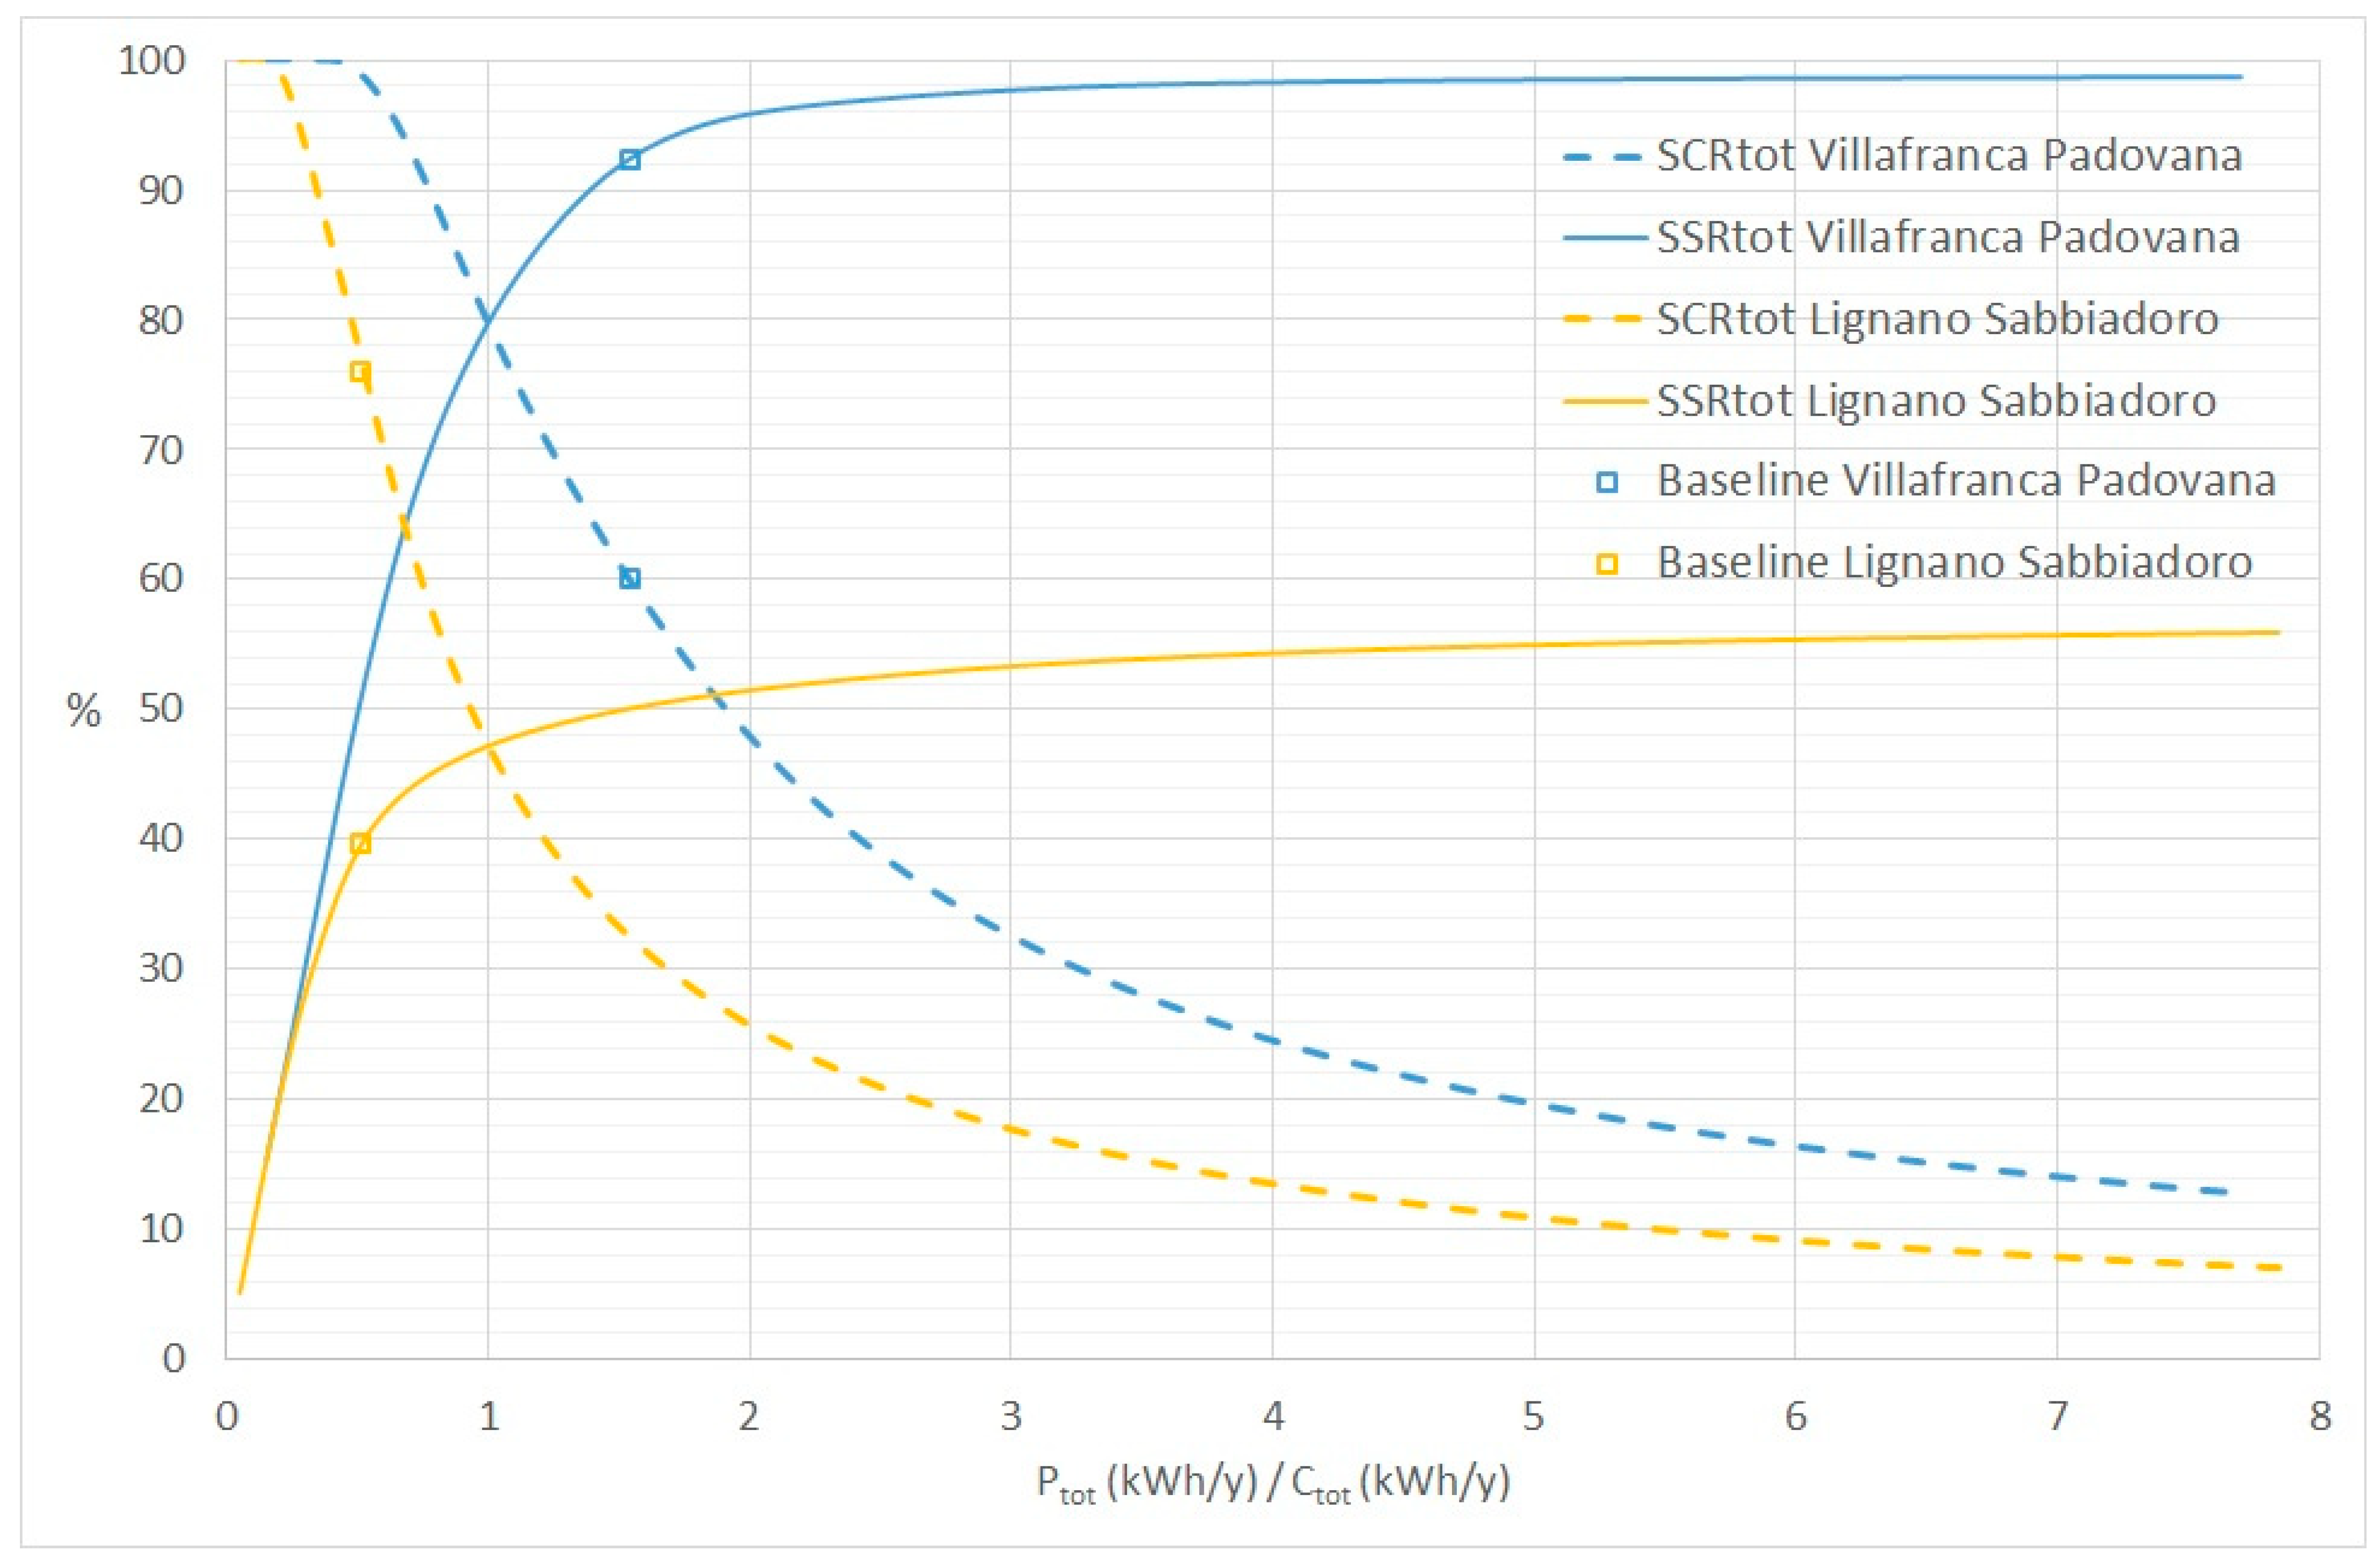
The analysed REC has an excellent self-sufficiency rate (92%) and a self-consumption rate (60%) which can be improved. A good method to predict the variation of these rates is to plot them as a function of the ratio between the value of the annual production (Ptot) and that of the annual consumption (Ctot) of the REC. This method was initially developed only for individual prosumers in [39] and was later extended and further developed for the analysis of an entire REC, as discussed in [33]. The trend of the graph remains valid for different RECs, provided that the total consumption and production profiles of the REC remain similar across the various cases. When the total consumption profile (or the total production profile) changes, for example due to the addition of new members, the graph remains a useful approximation to predict the SCRtot and SSRtot. Figure 8 shows the trend of this function, along with the position Ptot/Ctot of the analyzed REC. It is possible to predict the variation of these rates when production plants or consumers are added, provided that their profiles are similar to the average ones (so that the total curves remain comparable).
A good indicator to assess the efficient use of the production is the Net ZEC point, which is the SC (and SS) rate when the total annual production equals the total annual consumption (Ptot/Ctot = 1). By definition, this corresponds to the intersection point of the two curves in Figure 8. With these total consumption and production profiles, the Net ZEC point is 80% for this REC. This means that, by increasing the consumption of the Villafranca Padovana REC with users whose consumption profiles match the REC’s average profile until reaching 3.43 GWh/year (which corresponds to the Ptot value), values of about SCRtot = SSRtot ≈ 80% are expected. This would result in a 20-percentage-point increase in the SCRtot (which was 60%).
This value for the Net ZEC point is significantly higher compared to a previously analyzed REC in Lignano Sabbiadoro (Italy), where electricity production was entirely derived from PV systems, and the Net ZEC point was about 47% [33]. The comparison between the two curves is also shown in Figure 8. This difference could be due not only to a different total production profile but also to a different total consumption profile.
SCRtot = SSRtot = 100% can only be reached if the consumption profile exactly matches the production profile, which is theoretically possible but not feasible in practice with non-programmable energy sources, such as PV, wind, etc., and without the use of storage systems.
To isolate the effect of the production profile alone, a simulation was carried out for a hypothetical REC with the same consumption profile as Villafranca Padovana but with production entirely from PV panels instead of the cogenerator. The result is a Net ZEC point of 42%. The Net ZEC values are reported in Table 5. Therefore, the difference solely attributable to the change in the production curve (from PV to the constant profile of the cogenerator) is 38 percentage points.

3.4. REC Improvement

Several simulations were carried out to improve the reference REC and increase the self-consumption and self-sufficiency rates. To this end, the first step was to add members to the REC to increase the total consumption and reach Ctot = Ptot (in the reference configuration, there was a difference of (Ptot − Ctot) = 1203 MWh). Residential members were chosen for inclusion in the REC because householders can be involved in an easier way than companies. Since the average annual electricity consumption of an apartment in Italy is 2184 kWh [48], the addition of 550 apartments was simulated (i.e., addition of about 1.2 GWh). This adjustment achieves Ptot = Ctot and SCRtot = SSRtot = 83.9%, as reported in Table 6, which is close to the value predicted by Figure 8.
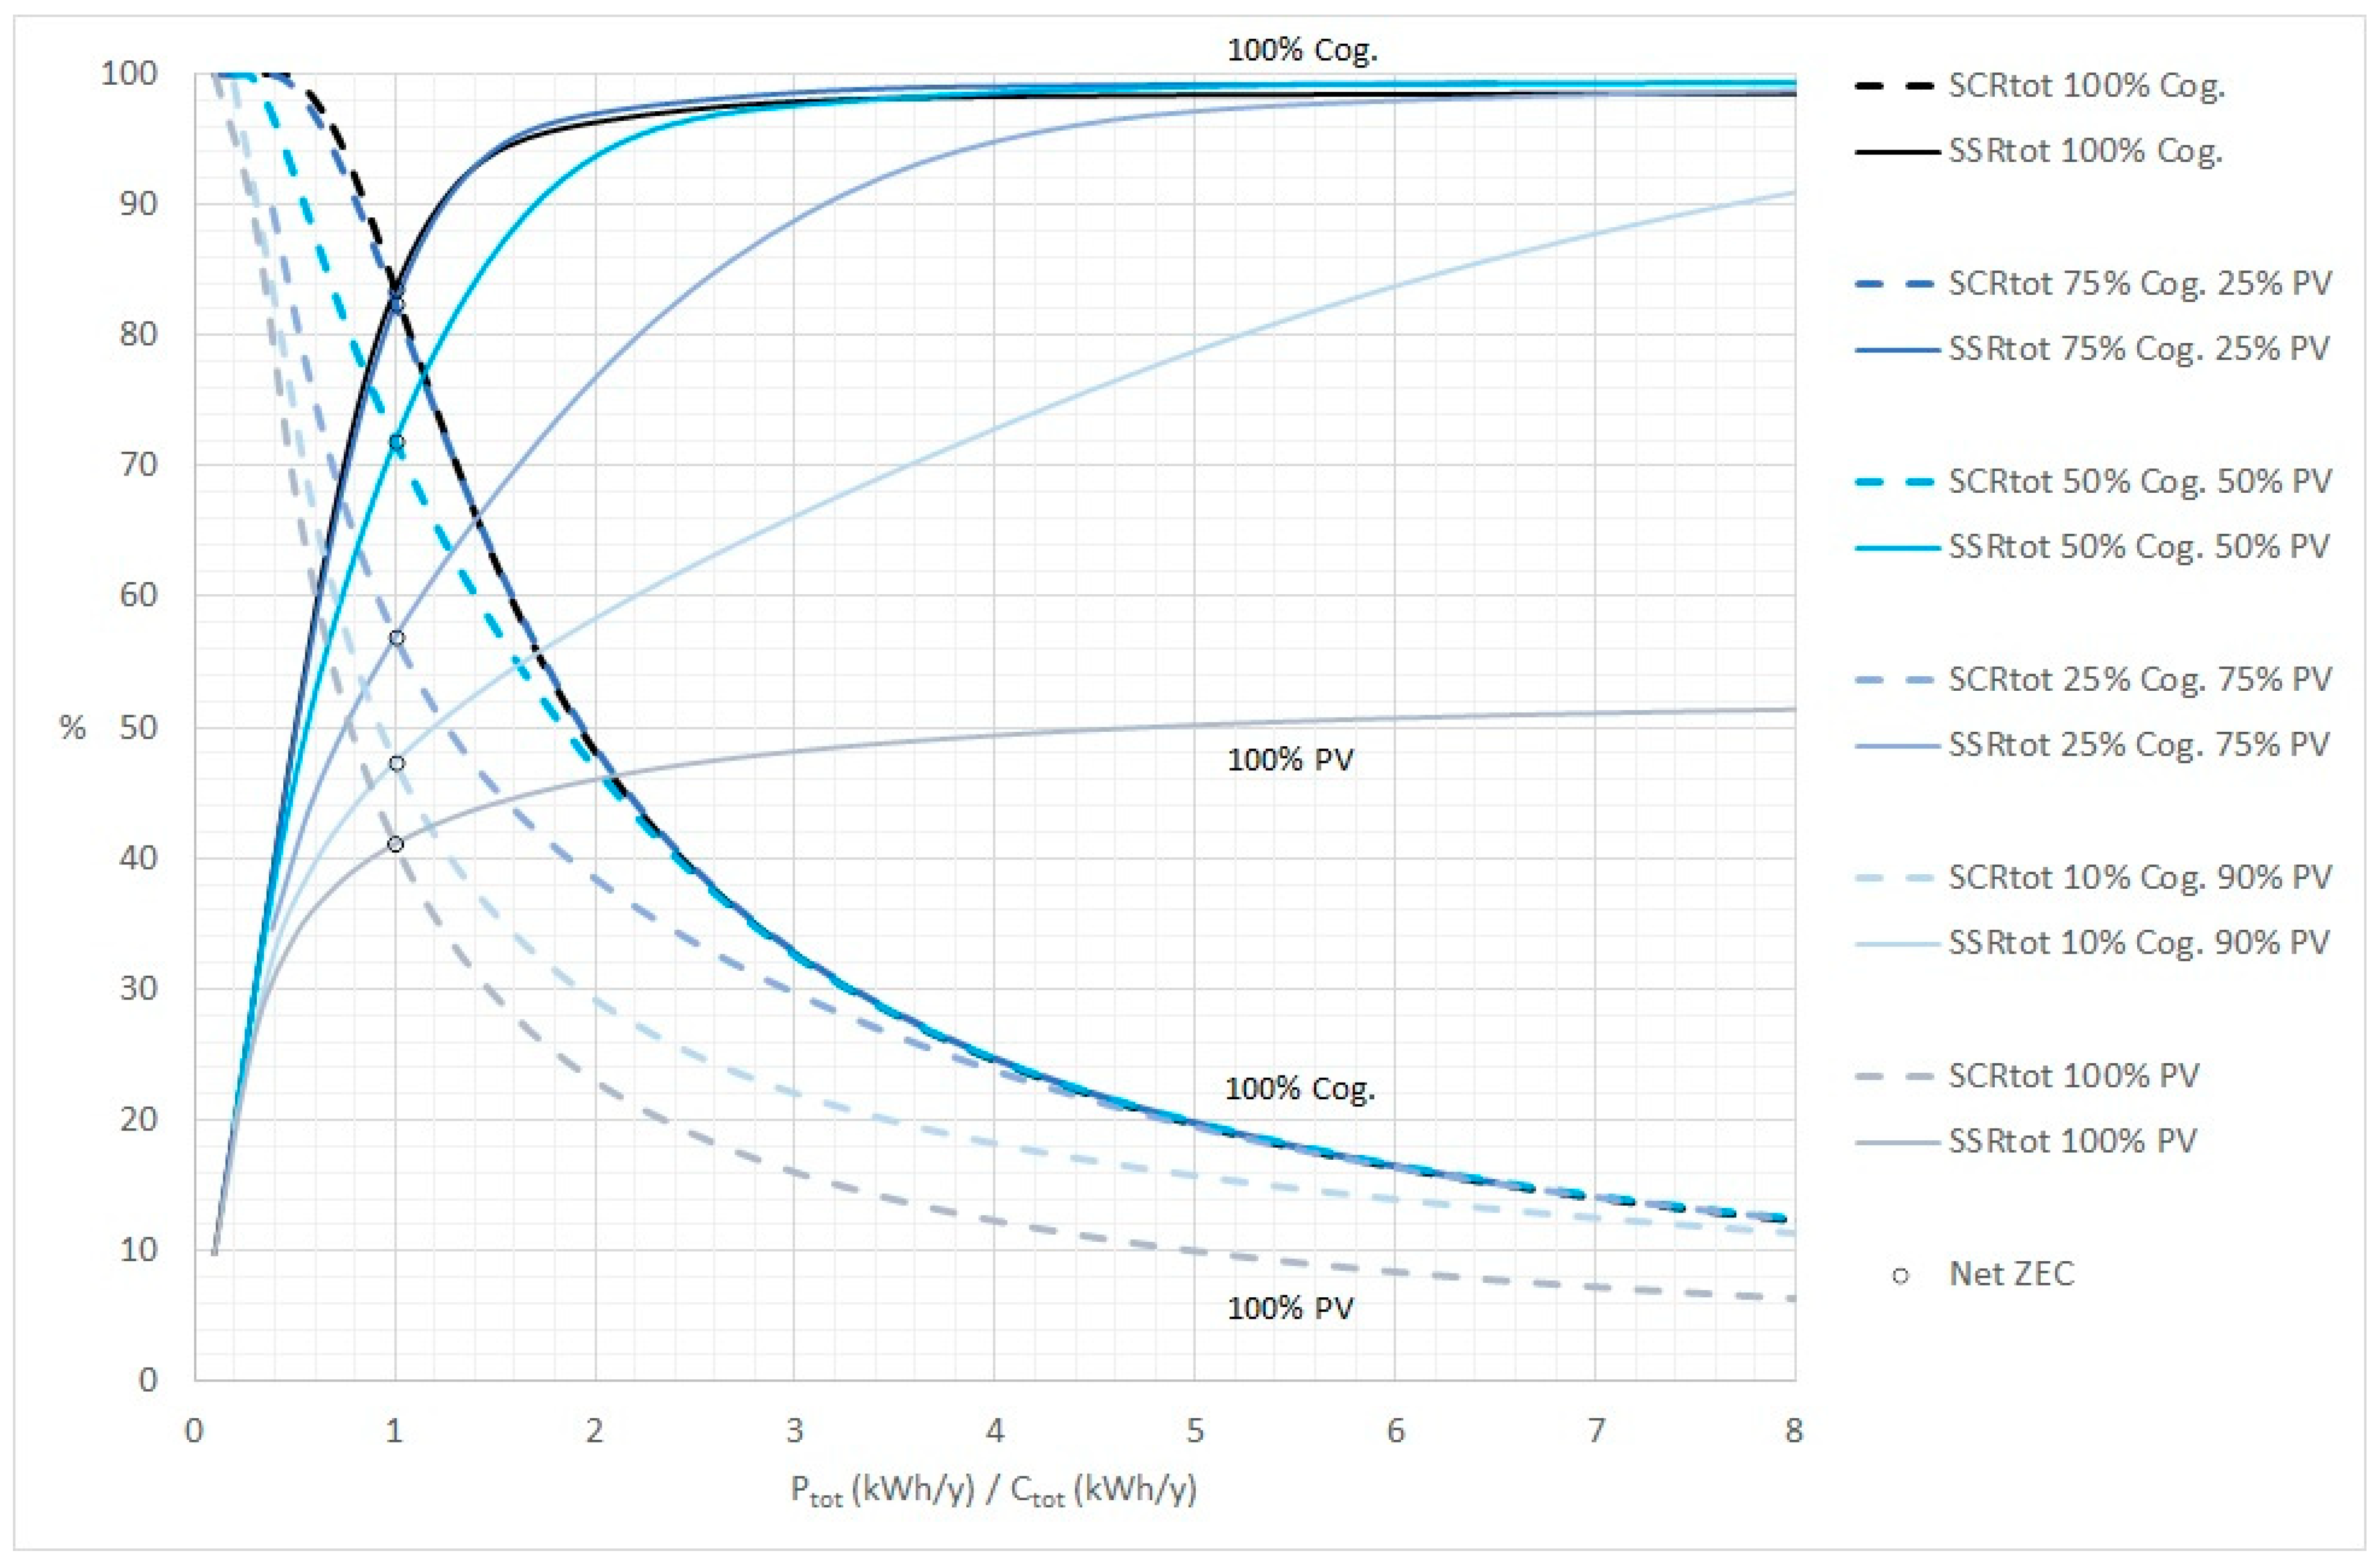
Given the significant improvement in the Net ZEC due to the CHP plant, several REC configurations were simulated, starting from conditions similar to those of Villafranca Padovana but with different production mixes from CHP and PV plants. These simulations make it possible to assess the impact of introducing PV systems into a REC configuration similar to that of Villafranca Padovana or, conversely, the introduction of CHP plants into REC configurations where electricity production comes from PV systems. The results are shown in Figure 9, which presents the trends of SSRtot and SCRtot as a function of Ptot/Ctot for different energy mixes, and for RECs ranging from 100% CHP production to RECs with 100% PV production. The curves labeled ‘SCRtot 100% Cog.’ and ‘SSRtot 100% Cog.’ approximately correspond to those in Figure 8, as expected.
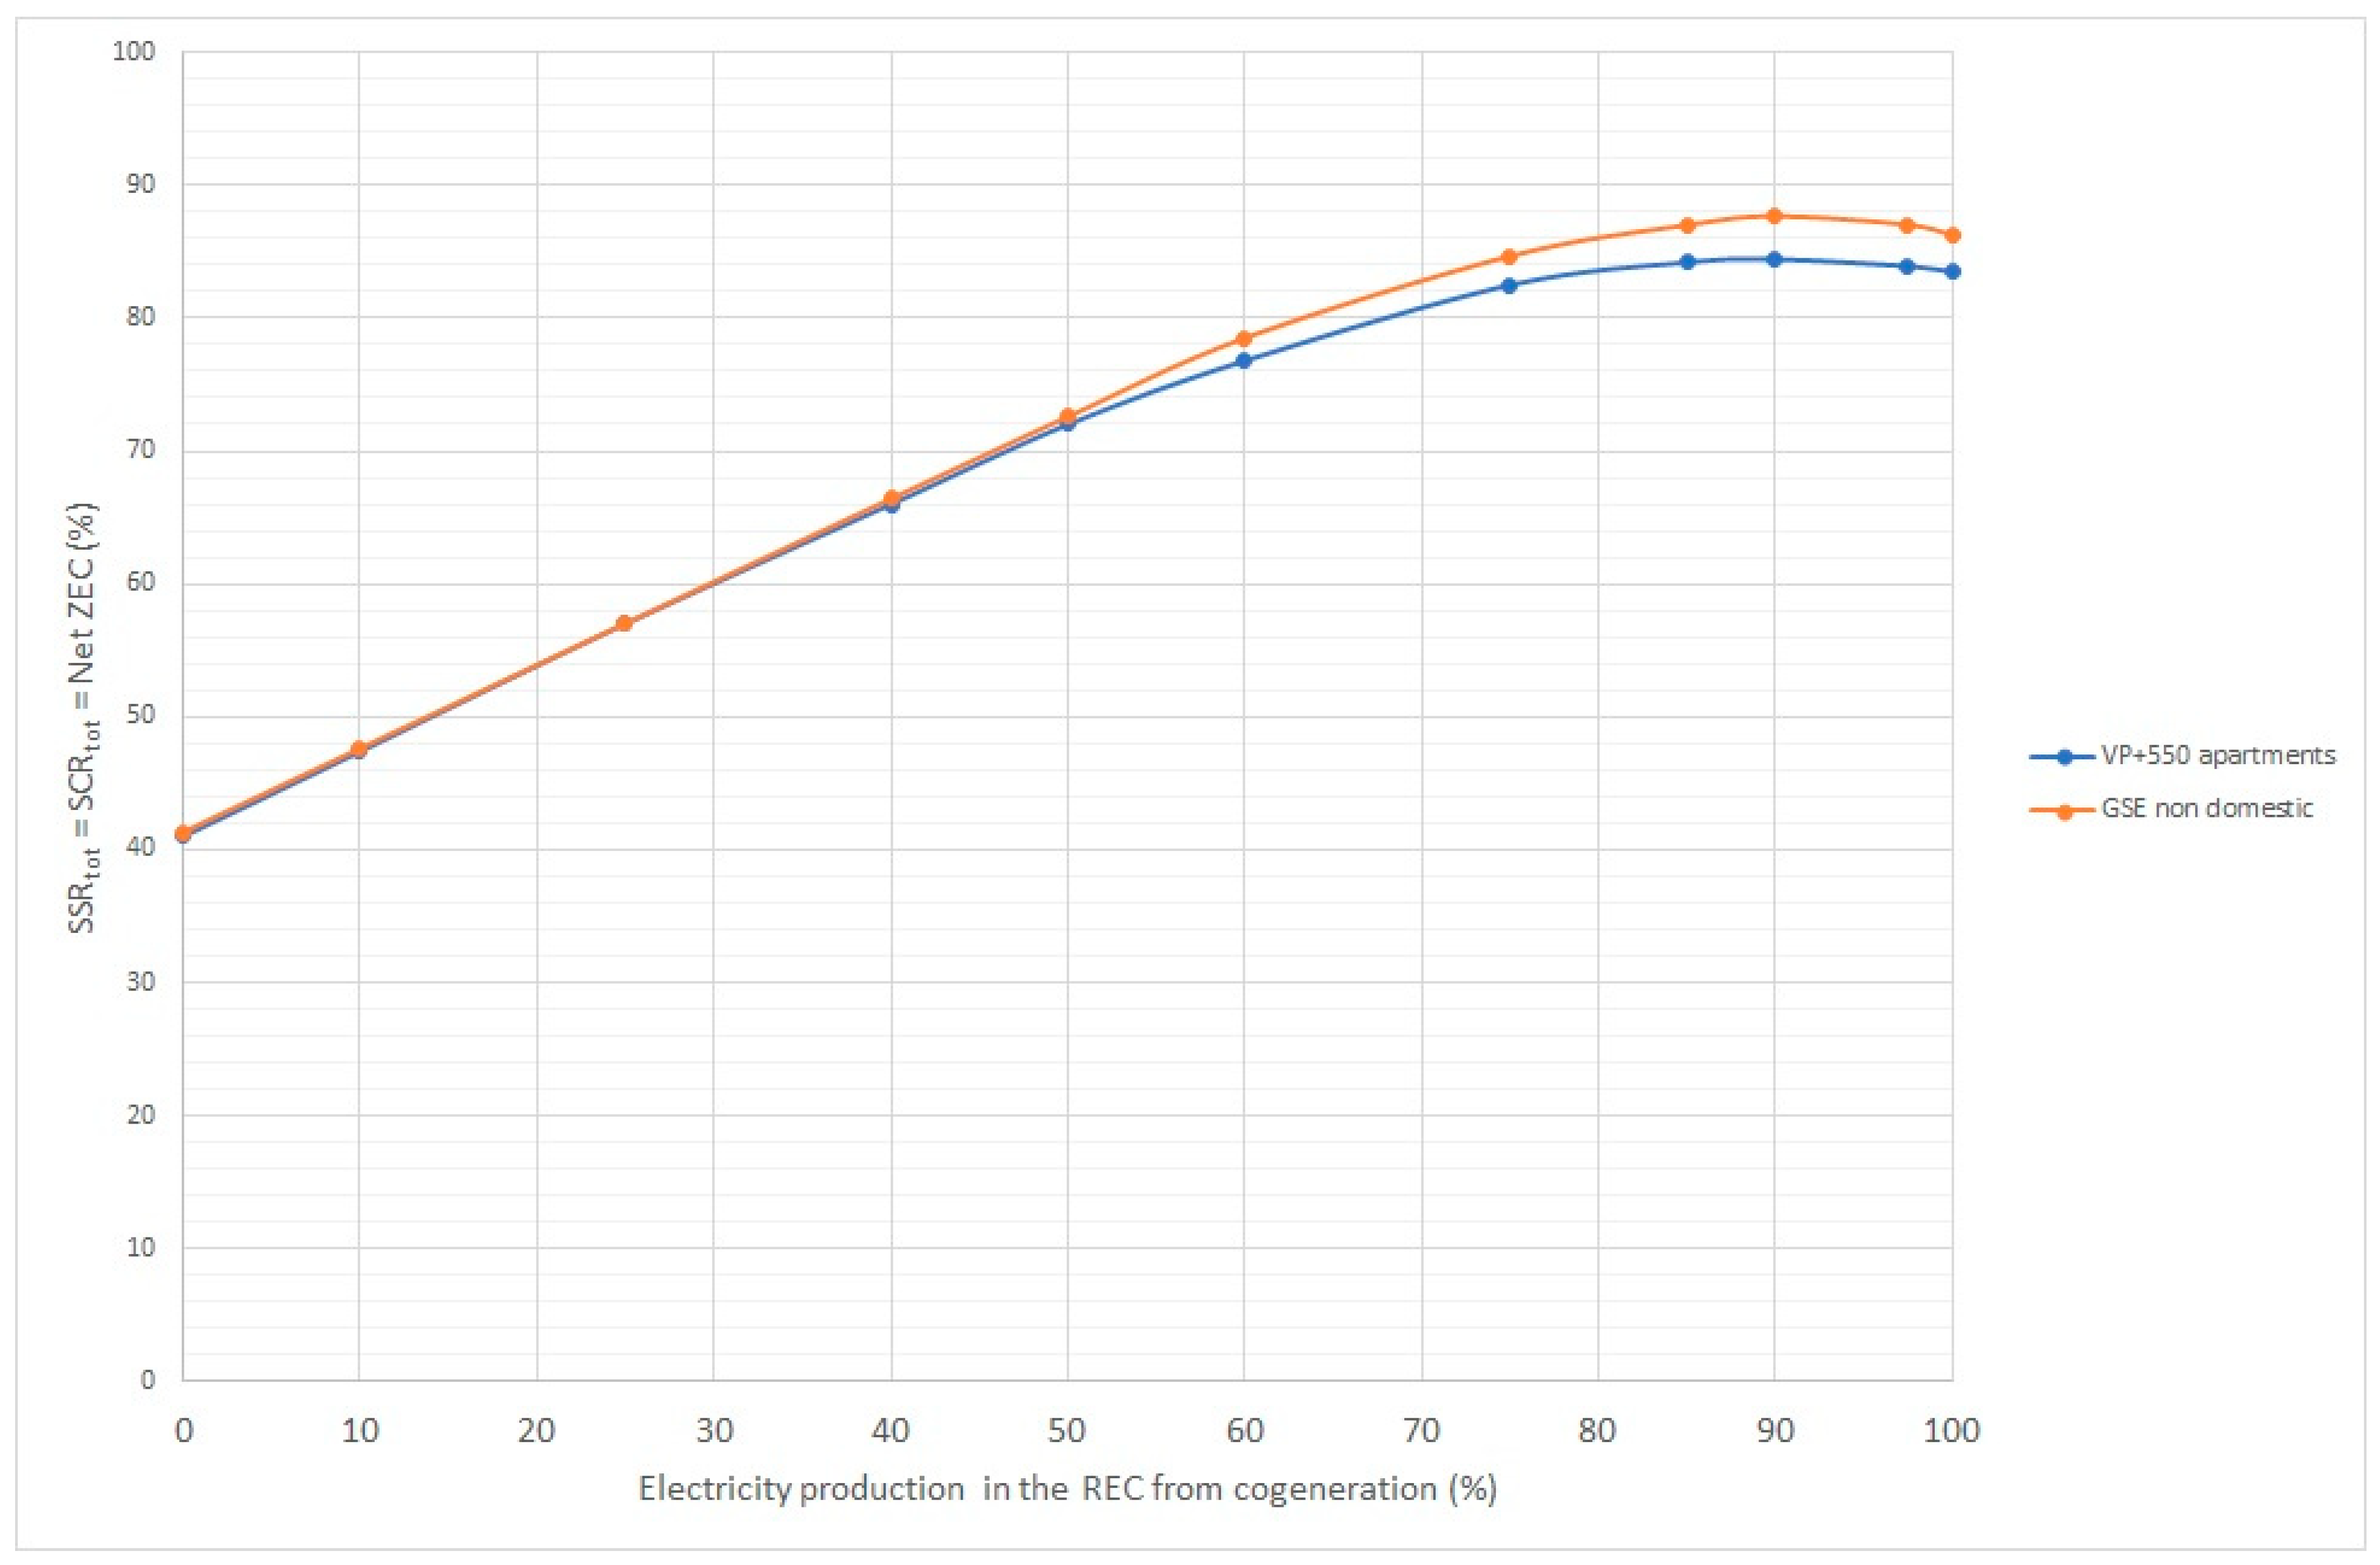
The trend of the intersection points of the SSRtot and SCRtot curves (the Net ZEC points) is shown more clearly in Figure 10. The curve is compared with the one obtained by using a national average load profile for non-domestic users (GSE curves [47]) instead of the measured load profiles of the REC members. The difference between the two curves is within 3 percentage points, indicating a good level of agreement. The maximum Net ZEC value (84.4%) is achieved in a REC with a 90% CHP and 10% PV mix. The average daily hourly trend for this REC is shown in Figure 11 and reported in Table 6.

4. Discussion

The results obtained allow to predict, in a first approximation, the behavior of a REC based on an energy mix composed of biogas with CHP setup and PV production. Furthermore, the behavior of SCR and SSR can be predicted based on varying the P/C ratio.
The analyzed reference configuration shows a high SCRtot (92%) and a good SSRtot (60%). Another good indicator of REC efficiency is the Net ZEC point, which indicates the trade-off between SCRtot and SSRtot and shows the behavior of the REC when total annual production equals total consumption: with this assumption, and maintaining the same consumption profile, for this REC, SCRtot and SSRtot would be about 80%. Therefore, 550 residential users were added to achieve Ctot = Ptot, with a limited change in the consumption profile. The configuration reaches a Net ZEC point of 83.9% (close to the predicted 80%). This value is particularly high, showing both a high SCRtot and SSRtot. The evolution of the REC in this direction is advantageous, as the members do not directly self-consume energy (only 2% of production is physical self-consumption), and almost all the production becomes shared energy, which is financially incentivized by Italian regulations.
The variation in the energy performance of the REC was then analysed for different percentages of contributions from PV and CHP electricity production. Varying the power source technologies, the Net ZEC point changes by more than 40 percentage points: Net ZEC point = 42% with 100% PV production, while Net ZEC point = 83.5% with 100% CHP production. This behavior is represented in the graph in Figure 10, that is characterized by 3 zones:
  • From 0 to 50% CHP. In the first zone, the cogenerator is very useful and significantly increases the Net ZEC, with linear behavior: an additional percentage point of CHP results in a Net ZEC increase of 0.62 points (SCRtot = SSRtot = 0.62x + 41.2, where x represents the mix percentage of CHP).
  • From 50% to 75% CHP. In the second zone, the Net ZEC continues to increase linearly, but at a weaker rate: an additional percentage point of CHP results in a Net ZEC increase of 0.42 points (SCRtot = SSRtot = 0.42x + 51.4).
  • From 75% to 100% CHP. In the final zone, the results vary slowly, first increasing and then decreasing. The best performance is achieved with 90% biogas and 10% PV, resulting in SCRtot = SSRtot = 84.4%.
This behaviour has been confirmed by using the average national curve for non-domestic users (see Figure 4b) instead of the actual load curves of the REC members.
Higher values than 84.4% are not reached because values close to 100% would require production profiles that are always (each hour) identical to consumption profiles. In this case, as seen in Figure 11, the average annual consumption between 5 pm and 9 pm is higher than during the 1 am to 8 am period, making the consumption profile generally asymmetric. The production profile, however, being composed of the sum of a constant profile (CHP) and a symmetric profile (PV), remains approximately symmetric. It is also noteworthy that in Figure 11, the average production and consumption profiles are very similar between 8 am and 4 pm. The shared energy value (the violet area), however, remains slightly lower, even though it represents the minimum between consumption and production at each moment, because the profiles in Figure 11 are average profiles, and the production and consumption profiles are not necessarily similar every day of the year, but only on average.
It is noteworthy in Figure 9 that the SSRtot curves can reach values close to 100% only when the cogenerator is present, which, when production increases (in the right-hand part of the graph, where P is much higher than C), is able to cover and allow self-consumption during nighttime hours. In the absence of a cogenerator (100% PV case), the SSRtot asymptote remains around 50%, and thus self-sufficiency does not increase, despite increased production, because nighttime consumption and daily consumption on cloudy days are not covered by production.
The difference in SCRtot and SSRtot across different REC configurations varies according to the Ptot/Ctot ratios. For example, when Ptot = Ctot, the difference between a 100% biogas-fueled REC and a 100% PV-fueled one, as previously mentioned, is around 40 percentage points. However, when Ptot/Ctot < 0.2, all mixed CHP-PV RECs achieve a SCRtot in the range 90–100%. Consequently, the variation in SCRtot across different REC configurations (with different PV-biogas mixes) drops to less than 10 percentage points, instead of the initial 40 in Net ZEC condition. Conversely, when Ptot/Ctot = 4, the SCRtot varies across different REC configurations within a range of 12.5–25.5%. Therefore, the variation is less than 13 percentage points.

5. Conclusions

This study analyses a REC currently under development in Villafranca Padovana (Italy), exploring possible combinations of CHP and PV production based on the real case. The aim is to improve energy performance and examine the behaviour of the REC in terms of SSR and SCR, for electric energy. The analysis quantifies the advantages of a REC based on a renewable source (biogas plant in a CHP configuration) capable of providing energy even during the night hours, thus meeting the base load of the involved members. This allows for high SSRtot, which, in this case, reaches about 92%. SCRtot turns out to be 60%. Such high values for both rates together are possible, using PV systems, only in the presence of storage systems.
The Net ZEC point, where total annual production equals total annual consumption, has then been identified as an important variable to show the performance of a REC and for REC comparative analysis. By the definition, SCRtot = SSRtot in Net ZEC point. The impact of different production mixes from CHP and PV sources was then analysed, showing that, for the configuration under study, each additional percentage point from CHP (in the energy production mix) results in an increase of 0.4–0.6 points in the Net ZEC point. Without CHP (i.e., with only PV production) the Net ZEC point is about 42%. This value increases by about 40 percentage points with the integration of CHP, reaching a maximum of 84.4% with a production mix of 10% PV and 90% CHP.
The Ptot/Ctot ratio is identified as another key parameter for describing the behavior of SCRtot and SSRtot across different REC configurations. The graphs presented in this paper can support the prediction of variations in SCRtot and SSRtot values.
These predictions can support the design of RECs based on the characteristics of available biogas plants and the surface potentially available for PV plants within the community. In practice, total consumption and total renewable production are often subject to specific constraints and are not necessarily equal (and therefore Ptot/Ctot is not necessarily = 1).
The results based on the Ptot/Ctot ratio remain valid for all the REC configurations where the total production profile and the total consumption profile do not change in shape, but only in magnitude. In particular, the results are based on typical PV production conditions of northern Italy (with a 30-degrees tilt angle and south-facing panels) and are therefore valid in this context. However, the methodology can be replicated for other geographic areas. Future studies will further generalize these results, define the level of approximation, and analyse the impact of additional renewable sources on the energy performance of RECs.

Author Contributions

Conceptualization, S.B. and C.P.; methodology, S.B. and C.P.; software, S.B. and C.P.; data curation, S.B., C.P. and N.G.; writing—original draft preparation, C.P., S.B. and N.G.; writing—review and editing, C.P., S.B., N.G. and G.D.; visualization, S.B.; supervision, G.D.; funding acquisition, G.D. All authors have read and agreed to the published version of the manuscript.

Funding

This research was funded by the Italian Ministry of the Environment and Energy Security (MASE), within the Program Agreement 22–24 “Electrical System Research” Programme Agreement between ENEA and MASE (Project 1.7 “Technologies for the efficient penetration of the electric vector in the final uses”).

Data Availability Statement

Third party data restrictions apply to the availability of these data. Data were obtained from Part-Energy co-operative and are available from the authors with the permission of Part-Energy cooperative.

Acknowledgments

The work was carried out in collaboration with the Part-Energy co-operative and LEGACOOP, in accordance with existing collaboration agreements.

Conflicts of Interest

The authors declare no conflicts of interest. The funders had no role in the design of the study; in the collection, analyses, or interpretation of data; in the writing of the manuscript; or in the decision to publish the results.

Abbreviations

The following abbreviations are used in this manuscript:
CHPCombined Heat and Power
CtotTotal Consumption
ECEnergy Communities
FtotTotal Feed-in
GSEGestore dei Servizi Energetici (the Italian Energy Services Managing Authority)
KPIKey Performance Indicators
LSLignano Sabbiadoro
Net ZECNet Zero Energy Communities
PtotTotal Production
PVPhotovoltaic
REC Renewable Energy Communities
SCSelf-Consumption
SCdirDirect Self-consumption
SCdirtotTotal Direct Self-consumption
SCRSelf-Consumption Rate
SCRtotTotal Self-Consumption Rate
SCtotTotal Self-Consumption
SEShared Energy
SEtotTotal Shared Energy
SSSelf-Sufficiency
SSRSelf-Sufficiency Rate
SSRtotTotal Self-Sufficiency Rate
VPVillafranca Padovana
WtotTotal Withdrawal

References

  1. Clean Energy for All Europeans; Publications Office of the European Union: Luxembourg, 2019; ISBN 978-92-79-99835-5. [CrossRef]
  2. Directive (EU) 2018/2001 of the European Parliament and of the Council of 11 December 2018 on the Promotion of the Use of Energy from Renewable Sources (Recast, PE/48/2018/REV/1). Available online: https://eur-lex.europa.eu/eli/dir/2018/2001/oj/eng (accessed on 12 September 2019).
  3. Vernay, A.-L.; Sebi, C.; Arroyo, F. Energy community business models and their impact on the energy transition: Lessons learnt from France. Energy Policy 2023, 175, 113473. [Google Scholar] [CrossRef]
  4. Schwidtal, J.M.; Piccini, P.; Troncia, M.; Chitchyan, R.; Montakhabi, M.; Francis, C.; Gorbatcheva, A.; Capper, T.; Mustafa, M.A.; Andoni, M.; et al. Emerging business models in local energy markets: A systematic review of peer-to-peer, community self-consumption, and transactive energy models. Renew. Sustain. Energy Rev. 2023, 179, 113273. [Google Scholar] [CrossRef]
  5. Stephant, M.; Abbes, D.; Hassam-Ouari, K.; Labrunie, A.; Robyns, B. Distributed optimization of energy profiles to improve photovoltaic self-consumption on a local energy community. Simul. Model. Pract. Theory 2021, 108, 102242. [Google Scholar] [CrossRef]
  6. Gianaroli, F.; Ricci, M.; Sdringola, P.; Ancona, M.A.; Branchini, L.; Melino, F. Development of dynamic sharing keys: Algorithms supporting management of renewable energy community and collective self consumption. Energy Build. 2024, 311, 114158. [Google Scholar] [CrossRef]
  7. Lage, M.; Castro, R.; Manzolini, G.; Casalicchio, V.; Sousa, T. Techno-economic analysis of self-consumption schemes and energy communities in Italy and Portugal. Sol. Energy 2024, 270, 112407. [Google Scholar] [CrossRef]
  8. Brummer, V. Community energy—Benefits and barriers: A comparative literature review of Community Energy in the UK, Germany and the USA, the benefits it provides for society and the barriers it faces. Renew. Sustain. Energy Rev. 2018, 94, 187–196. [Google Scholar] [CrossRef]
  9. Tushar, W.; Yuen, C.; Saha, T.K.; Morstyn, T.; Chapman, A.C.; Alam, M.J.E.; Hanif, S.; Poor, H.V. Peer-to-peer energy systems for connected communities: A review of recent advances and emerging challenges. Appl. Energy 2021, 282, 116131. [Google Scholar] [CrossRef]
  10. Gruber, L.; Bachhiesl, U.; Wogrin, S. The current state of research on energy communities. Elektrotech. Inftech. 2021, 138, 515–524. [Google Scholar] [CrossRef]
  11. Yiasoumas, G.; Psara, K.; Georghiou, G.E. A review of Energy Communities: Definitions, Technologies, Data Management. In Proceedings of the 2nd International Conference on Energy Transition in the Mediterranean Area (SyNERGY MED), Thessaloniki, Greece, 17–19 October 2022; pp. 1–6. [Google Scholar]
  12. López, I.; Goitia-Zabaleta, N.; Milo, A.; Gómez-Cornejo, J.; Aranzabal, I.; Gaztañaga, H.; Fernandez, E. European energy communities: Characteristics, trends, business models and legal framework. Renew. Sustain. Energy Rev. 2024, 197, 114403. [Google Scholar] [CrossRef]
  13. Lazdins, R.; Mutule, A.; Zalostiba, D. PV Energy Communities—Challenges and Barriers from a Consumer Perspective: A Literature Review. Energies 2021, 14, 4873. [Google Scholar] [CrossRef]
  14. Ceglia, F.; Marrasso, E.; Pallotta, G.; Roselli, C.; Sasso, M. The State of the Art of Smart Energy Communities: A Systematic Review of Strengths and Limits. Energies 2022, 15, 3462. [Google Scholar] [CrossRef]
  15. Ahmed, S.; Ali, A.; D’Angola, A. A Review of Renewable Energy Communities: Concepts, Scope, Progress, Challenges, and Recommendations. Sustainability 2024, 16, 1749. [Google Scholar] [CrossRef]
  16. Barabino, E.; Fioriti, D.; Guerrazzi, E.; Mariuzzo, I.; Poli, D.; Raugi, M.; Razaei, E.; Schito, E.; Thomopulos, D. Energy Communities: A review on trends, energy system modelling, business models, and optimisation objectives. Sustain. Energy Grids Netw. 2023, 36, 101187. [Google Scholar] [CrossRef]
  17. Brown, S.; Jones, D. European Electricity Review 2024; Ember: London, UK, 2024. [Google Scholar]
  18. Chen, Y.; Guo, M.; Liu, Y.; Wang, D.; Zhuang, Z.; Quan, M. Energy, exergy, and economic analysis of a centralized solar and biogas hybrid heating system for rural areas. Energy Convers. Manag. 2023, 276, 116591. [Google Scholar] [CrossRef]
  19. Volpato, G.; Carraro, G.; Cont, M.; Danieli, P.; Rech, S.; Lazzaretto, A. General guidelines for the optimal economic aggregation of prosumers in energy communities. Energy 2022, 258, 124800. [Google Scholar] [CrossRef]
  20. EU Directive 2010/31/UE—European Parliament and Council. 19 May 2010. Available online: https://eur-lex.europa.eu/eli/dir/2010/31/oj/eng (accessed on 7 May 2024).
  21. Ullah, K.R.; Prodanovic, V.; Pignatta, G.; Deletic, A.; Santamouris, M. Technological advancements towards the net-zero energy communities: A review on 23 case studies around the globe. Sol. Energy 2021, 224, 1107–1126. [Google Scholar] [CrossRef]
  22. Thrän, D.; Adetona, A.; Borchers, M.; Cyffka, K.F.; Daniel-Gromke, J.; Oehmichen, K. Potential contribution of biogas to net zero energy systems—A comparative study of Canada and Germany. Biomass Bioenergy 2025, 193, 107561. [Google Scholar] [CrossRef]
  23. Calise, F.; Cappiello, F.L.; Cimmino, L.; Vicidomini, M. A Dynamic Analysis of Biomethane Reforming for a Solid Oxide Fuel Cell Operating in a Power-to-Heat System Integrated into a Renewable Energy Community. Energies 2024, 17, 3160. [Google Scholar] [CrossRef]
  24. Al-Najjar, H.; Pfeifer, C.; Al Afif, R.; El-Khozondar, H.J. Performance Evaluation of a Hybrid Grid-Connected Photovoltaic Biogas-Generator Power System. Energies 2022, 15, 3151. [Google Scholar] [CrossRef]
  25. Ceglia, F.; Marrasso, E.; Roselli, C.; Sasso, M.; Coletta, G.; Pellegrino, L. Biomass-Based Renewable Energy Community: Economic Analysis of a Real Case Study. Energies 2022, 15, 5655. [Google Scholar] [CrossRef]
  26. Tamoor, M.; Bhatti, A.R.; Hussain, M.I.; Miran, S.; Kiren, T.; Ali, A.; Lee, G.H. Optimal sizing and technical assessment of a hybrid renewable energy solution for off-grid community center power. Front. Energy Res. 2023, 11, 1283586. [Google Scholar] [CrossRef]
  27. Ministero dell’Ambiente e della Sicurezza Energetica—Monitoraggio PNIEC. Available online: https://www.pniecmonitoraggio.it/Dimensioni/Rinnovabili/FER%20Elettriche/Pagine/Incentivi-e-altre-misure.aspx#CACER (accessed on 20 February 2025).
  28. TERNA, Dati Statistici Sull’energia Elettrica in Italia 2023. Available online: https://www.terna.it/it/sistema-elettrico/statistiche/pubblicazioni-statistiche (accessed on 7 May 2024).
  29. GSE, Rapporto Statistico Fotovoltaico 2023—Solare Fotovoltaico. May 2024. Available online: https://www.gse.it/dati-e-scenari/statistiche (accessed on 15 May 2024).
  30. Branchetti, S.; Petrovich, C.; Naldi, R.; Paponetti, I.M.; Paolucci, F.; Nigliaccio, G. PV Self-Consumption and Self-Sufficiency for Household and Office Users: The Lockdown Effects During the COVID-19 Pandemic. Int. J. Sustain. Dev. Plan. 2022, 17, 2–659. [Google Scholar] [CrossRef]
  31. Vecchi, F.; Berardi, U. Mixed-use neighbourhood to maximise urban energy community potential. E3S Web Conf. 2024, 523, 05002. [Google Scholar] [CrossRef]
  32. Mutani, G.; Santantonio, S.; Beltramino, S. Indicators and Representation Tools to Measure the Technical-Economic Feasibility of a Renewable Energy Community. The Case Study of Villar Pellice (Italy). Int. J. Sustain. Dev. Plan. 2021, 16, 1. [Google Scholar] [CrossRef]
  33. Petrovich, C.; Branchetti, S.; D’Agosta, G. Parametrization of self-consumption and self-sufficiency in Renewable Energy Communities: A case study application. Energy Ecol. Environ. 2025. [Google Scholar] [CrossRef]
  34. Simoiu, M.S.; Fagarasan, I.; Ploix, S.; Calofir, V. Sizing and Management of an Energy System for a Metropolitan Station with Storage and Related District Energy Community. Energies 2021, 14, 5997. [Google Scholar] [CrossRef]
  35. Todeschi, V.; Marocco, P.; Mutani, G.; Lanzini, A.; Santarelli, M. Towards energy self-consumption and self-sufficiency in urban energy communities. Int. J. Heat Technol. 2021, 39, 1–11. [Google Scholar] [CrossRef]
  36. Cutore, E.; Volpe, R.; Sgroi, R.; Fichera, A. Energy management and sustainability assessment of renewable energy communities: The Italian context. Energy Convers. Manag. 2023, 278, 116713. [Google Scholar] [CrossRef]
  37. Cosic, A.; Stadler, M.; Mansoor, M.; Zellinger, M. Mixed-integer linear programming based optimization strategies for renewable energy communities. Energy 2021, 237, 121559. [Google Scholar] [CrossRef]
  38. Gribiss, H.; Aghelinejad, M.M.; Yalaoui, F. Configuration Selection for Renewable Energy Community Using MCDM Methods. Energies 2023, 16, 2632. [Google Scholar] [CrossRef]
  39. Luthander, R.; Widén, J.; Nilsson, D.; Palm, J. Photovoltaic self-consumption in buildings: A review. Appl. Energy 2015, 142, 80–94. [Google Scholar] [CrossRef]
  40. Braeuer, F.; Kleinebrahm, M.; Naber, E.; Scheller, F.; McKenna, R. Optimal system design for energy communities in multi-family buildings: The case of the German tenant Electricity Law. Appl. Energy 2022, 305, 117884. [Google Scholar] [CrossRef]
  41. Schito, E.; Taverni, L.; Conti, P.; Testi, D. Optimization of the composition of residential buildings in a renewable energy community based on monitored data. Optim. Eng. 2024. [Google Scholar] [CrossRef]
  42. Xiao, J.; Yang, Y.; Cui, S.; Liu, X. A new energy storage sharing framework with regard to both storage capacity and power capacity. Appl. Energy 2022, 307, 118171. [Google Scholar] [CrossRef]
  43. Li, L.; Zhang, S.; Cao, X.; Zhang, Y. Assessing economic and environmental performance of multi-energy sharing communities considering different carbon emission responsibilities under carbon tax policy. J. Clean. Prod. 2021, 328, 129466. [Google Scholar] [CrossRef]
  44. Weckesser, T.; Dominković, D.F.; Blomgren, E.M.V.; Schledorn, A.; Madsen, H. Renewable Energy Communities: Optimal sizing and distribution grid impact of photo-voltaics and battery storage. Appl. Energy 2021, 301, 117408. [Google Scholar] [CrossRef]
  45. Ebrahimi, M. Storing electricity as thermal energy at community level for demand side management. Energy 2020, 193, 116755. [Google Scholar] [CrossRef]
  46. Derakhshan, G.; Shayanfar, H.A.; Kazemi, A. The optimization of demand response programs in smart grids. Energy Policy 2016, 94, 295–306. [Google Scholar] [CrossRef]
  47. GSE. GRUPPI DI AUTOCONSUMATORI DI ENERGIA RINNOVABILE CHE AGISCONO COLLETTIVAMENTE E COMUNITÀ DI ENERGIA RINNOVABILE, Modalità di profilazione dei dati di misura e relative modalità di utilizzo ai sensi dell’articolo 9 dell’Allegato A alla Delibera 318/2020/R/eel, Versione n. 1—04/04/2022. Available online: https://www.gse.it/servizi-per-te/autoconsumo/gruppi-di-autoconsumatori-e-comunita-di-energia-rinnovabile/documenti (accessed on 5 December 2023).
  48. Branchetti, S.; Petrovich, C.; Nigliaccio, G.; Paolucci, F. The Lockdown and Smart Working Effects on Electric Energy Consumption: The Analysis For A Group Of Employees. TECNICA ITALIANA-Ital. J. Eng. Sci. 2021, 65, 2–292. [Google Scholar] [CrossRef]
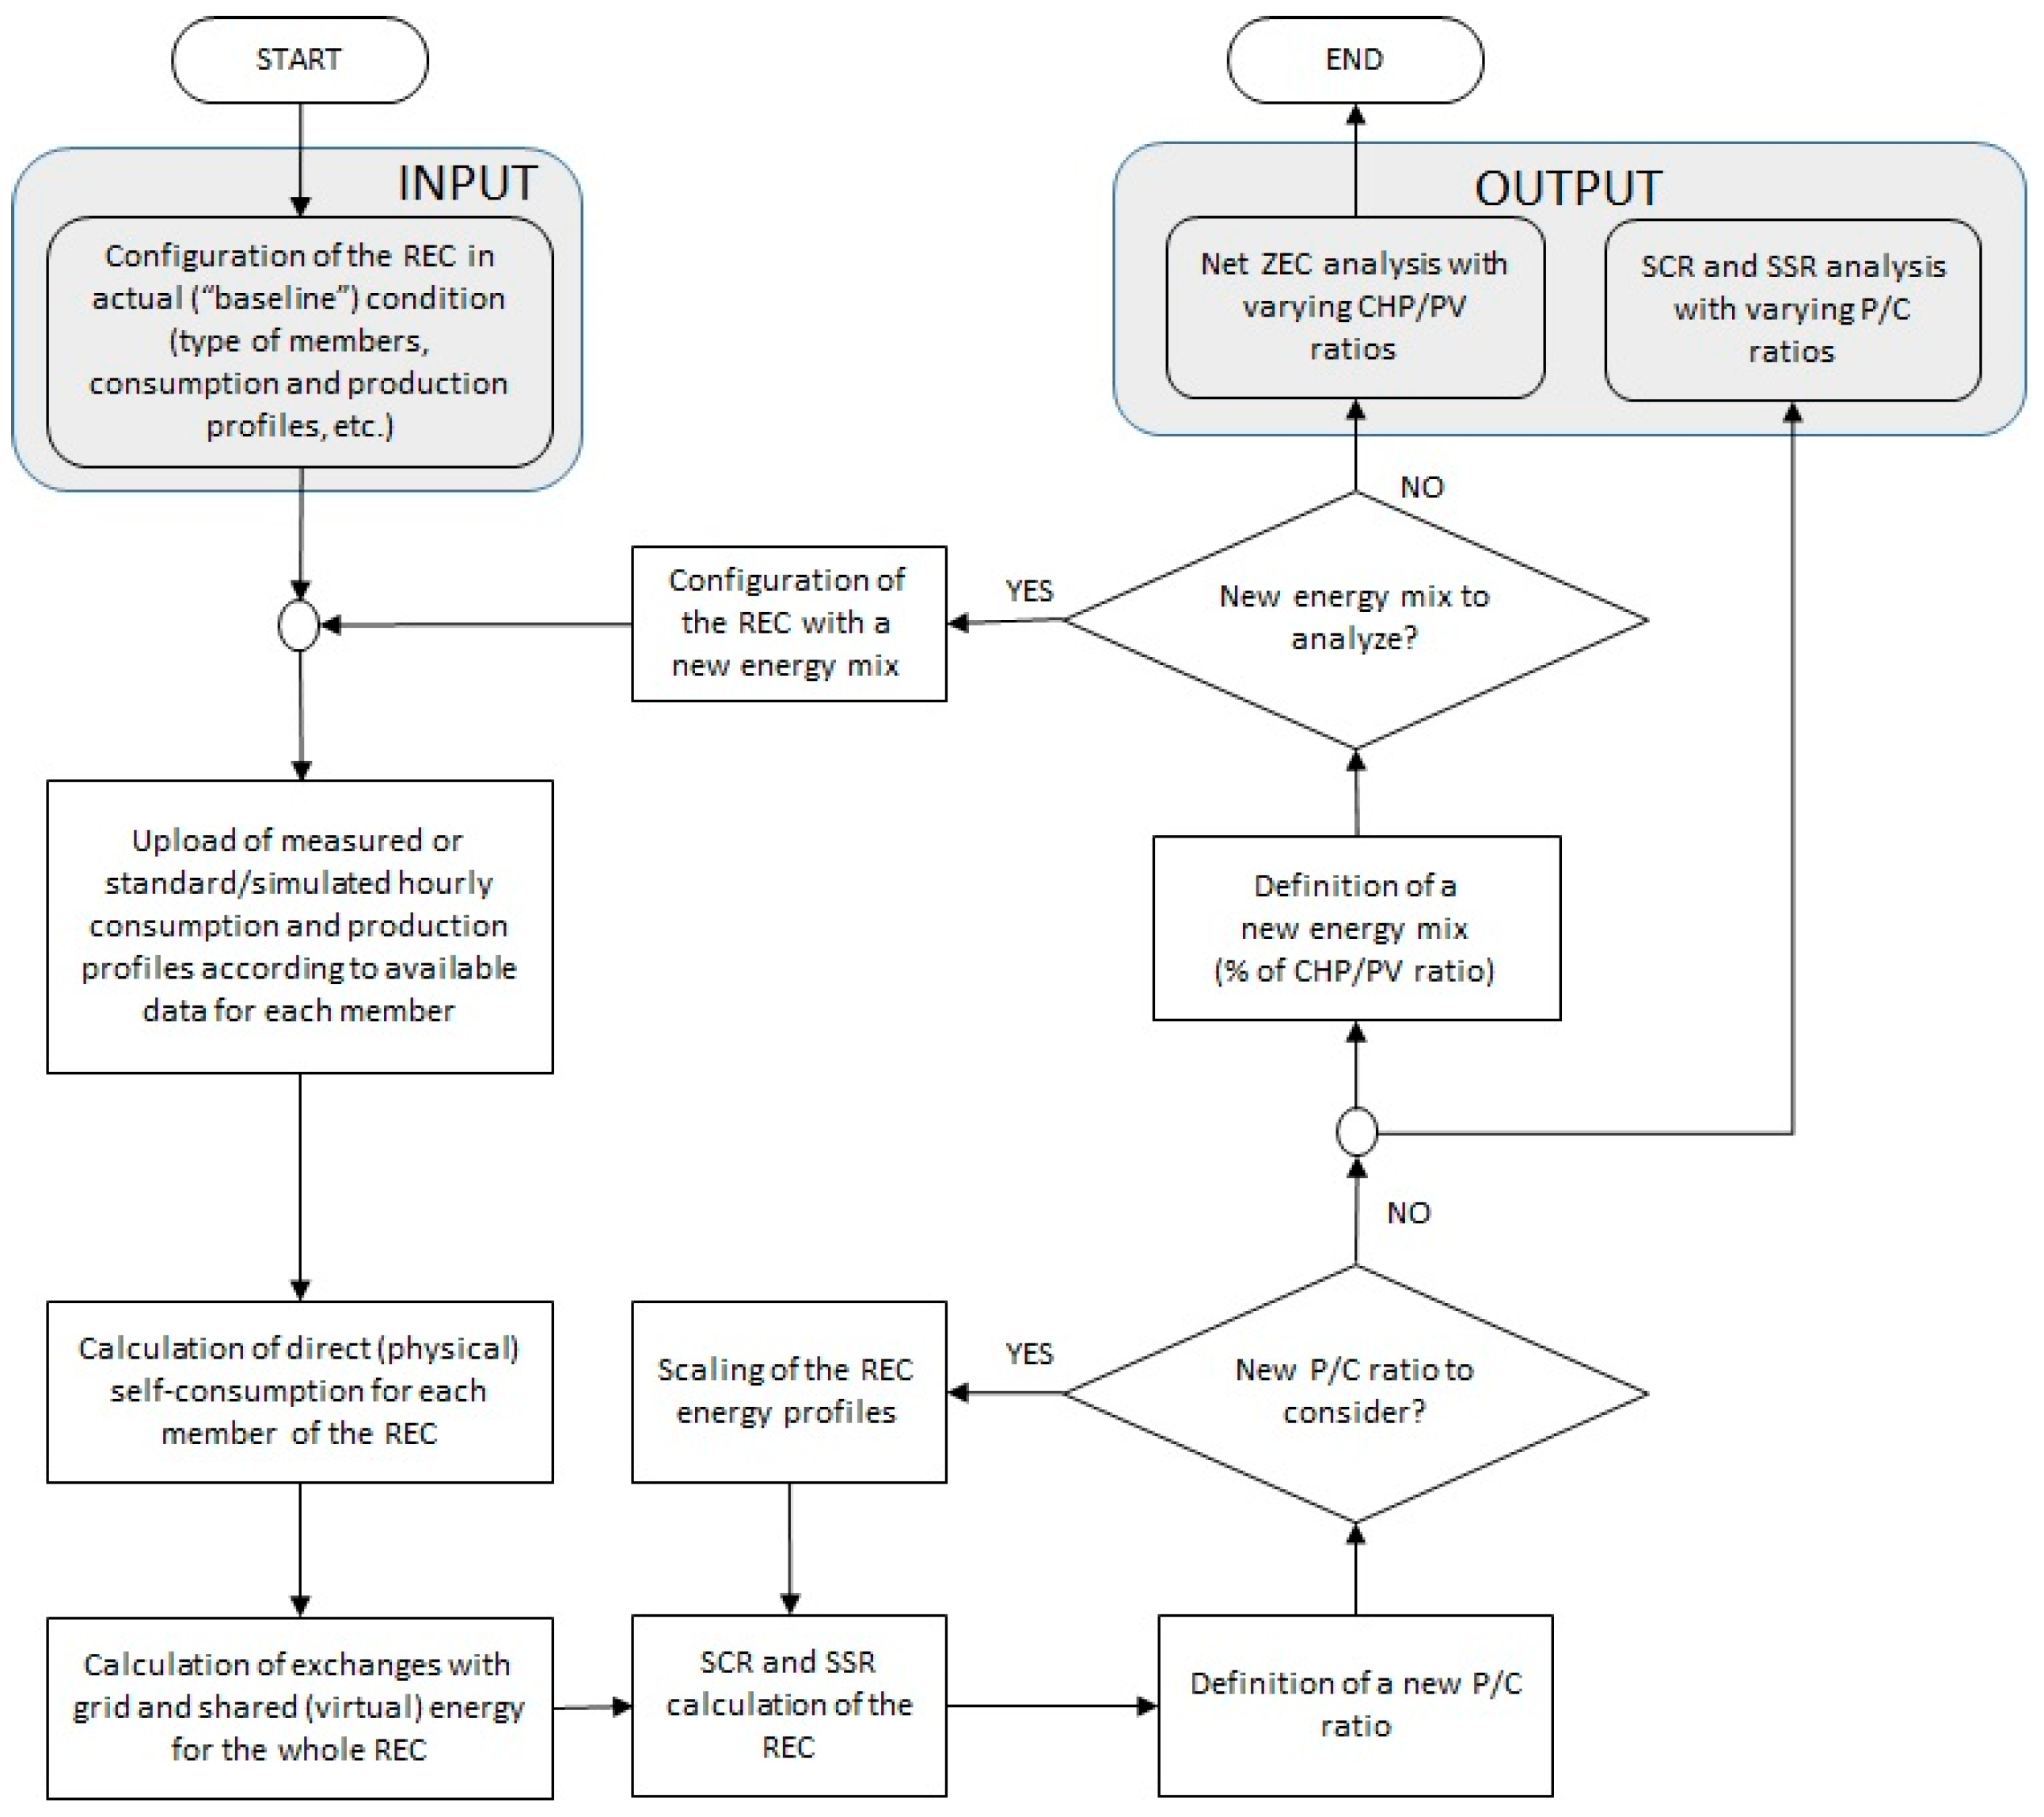
Figure 1. Flow chart of the algorithms and methods used.
Electronics 14 01755 g001
Figure 2. Average daily hourly profile of: (a) electricity production by the 500 kW cogeneration biogas plant; (b) consumption, production and direct self-consumption by the prosumer.
Electronics 14 01755 g002
Figure 3. Average daily hourly profile: (a) consumption of member which accounts for 64% of the total electricity consumption; (b) consumption of member which accounts for 12% of the total electricity consumption.
Electronics 14 01755 g003
Figure 4. Average daily hourly profile developed using the GSE standard curves: (a) domestic synthetic consumption of 3000 kWh/year (b) non-domestic synthetic consumption of 20,000 kWh/year.
Electronics 14 01755 g004
Figure 5. Breakdown of consumption and production for the entire REC over one year.
Electronics 14 01755 g005
Figure 6. Average hourly daily trend of consumption, production, direct self-consumption, and shared energy.
Electronics 14 01755 g006
Figure 7. Daily rates and moving average of the self-consumption and self-sufficiency rates of the entire REC.
Electronics 14 01755 g007
Figure 8. SCRtot and SSRtot as functions of the Ptot/Ctot ratio (parametric curves) for the Villafranca Padovana and Lignano Sabbiadoro RECs.
Electronics 14 01755 g008
Figure 9. Parametric curves of SCRtot and SSRtot as a function of the Ptot/Ctot ratio for Villafranca Padovana REC, integrated with 550 apartments, and for different mixes of CHP and PV.
Electronics 14 01755 g009
Figure 10. Variation of Net ZEC (the point where Ptot = Ctot and SCRtot = SSRtot) as a function of the percentage of CHP in the REC’s electricity production.
Electronics 14 01755 g010
Figure 11. Average daily hourly trend of consumption, production, direct self-consumption, and shared energy in a configuration similar to that of Villafranca Padovana, enhanced with 550 additional residential users. The electricity generation mix is composed of 90% from CHP (500 kW and 3346 kWh/year) and 10% from PV (284.5 kWp and 369 kWh/year).
Electronics 14 01755 g011
Table 1. Some optimization algorithms used in the literature for RECs.
AlgorithmReference
MILP (Mixed-Integer Linear Programming)[37,40]
Genetic optimization[41]
ADMM (Alternating Direction Method of Multipliers)[42,43]
Linear Programming[44]
Particle Swarm Optimisation[45]
TLBO (Teaching & Learning based Optimization)[46]
Table 2. Classification of REC users by type.
Types of UsersQuantity of UtilitiesConsumption
MWh
Production
MWh
Power
kW
Consumer-only512135 --
Producer1-3346 500
Prosumer 1 192 8464.5
Total 5322273430 564.5
1 Production plants connected to a consumer with direct self-consumption.
Table 3. Breakdown of all REC members by category of utilities.
Categories of Utilities Quantity of UtilitiesConsumptionPower
Companies1189%564.5 kW
Residential213%-
Municipal218%-
Total53100%564.5 kW
Table 4. Self-consumption and self-sufficiency rates of the REC over the whole year.
RateKPICalculated Value
Self-ConsumptionSCRtot = (SCdirtot + SEtot)/Ptot 60.0%
Self-SufficiencySSRtot = (SCdirtot + SEtot)/Ctot92.4%
Table 5. RECs configurations and results.
REC ConfigurationProductionConsumptionBaseline Condition
(Ptot/Ctot Ratio)
Net ZEC (Ptot/Ctot = 1)
Lignano Sabbiadoro (LS)0% Cogen.Profile of LS REC0.5247%
100% PVin baseline condition
Villafranca Padovana (VP)97.5% Cogen.Profile of VP REC 1.5480%
2.5% PVin baseline condition
VP with only PV production *0% Cogen.
100% PV
Profile of VP REC0.6242%
* Hypothetical (not actual) configuration.
Table 6. Improvement of REC configurations.
REC ConfigurationProductionConsumptionSimulated Condition
(Ptot/Ctot Ratio)
Net ZEC (Ptot/Ctot = 1)
VP with addition of 550 apartments97.5% Cogen.Profile of VP REC1.0083.9
2.5% PV+ 550 apartments
VP with addition of 550 apartments
and PV (64.5 + 220 = 284.5 kWp)
90% Cogen.Profile of VP REC1.0884.4
10% PV+ 550 apartments
Disclaimer/Publisher’s Note: The statements, opinions and data contained in all publications are solely those of the individual author(s) and contributor(s) and not of MDPI and/or the editor(s). MDPI and/or the editor(s) disclaim responsibility for any injury to people or property resulting from any ideas, methods, instructions or products referred to in the content.