A Novel Ten Check Maximum Power Point Tracking Algorithm for a Standalone Solar Photovoltaic System

Abstract
:1. Introduction
- (1)
- no parameter tuning is required,
- (2)
- track GMPP faster than any existing technique/algorithm,
- (3)
- zero oscillations around MPP,
- (4)
- track GMPP accurately and efficiently.
2. Ten Check Algorithm
2.1. Effects of Partial Shading Weather Conditions
2.2. Problem Formulation
2.3. Ten Check Algorithm
3. Simulation and Results
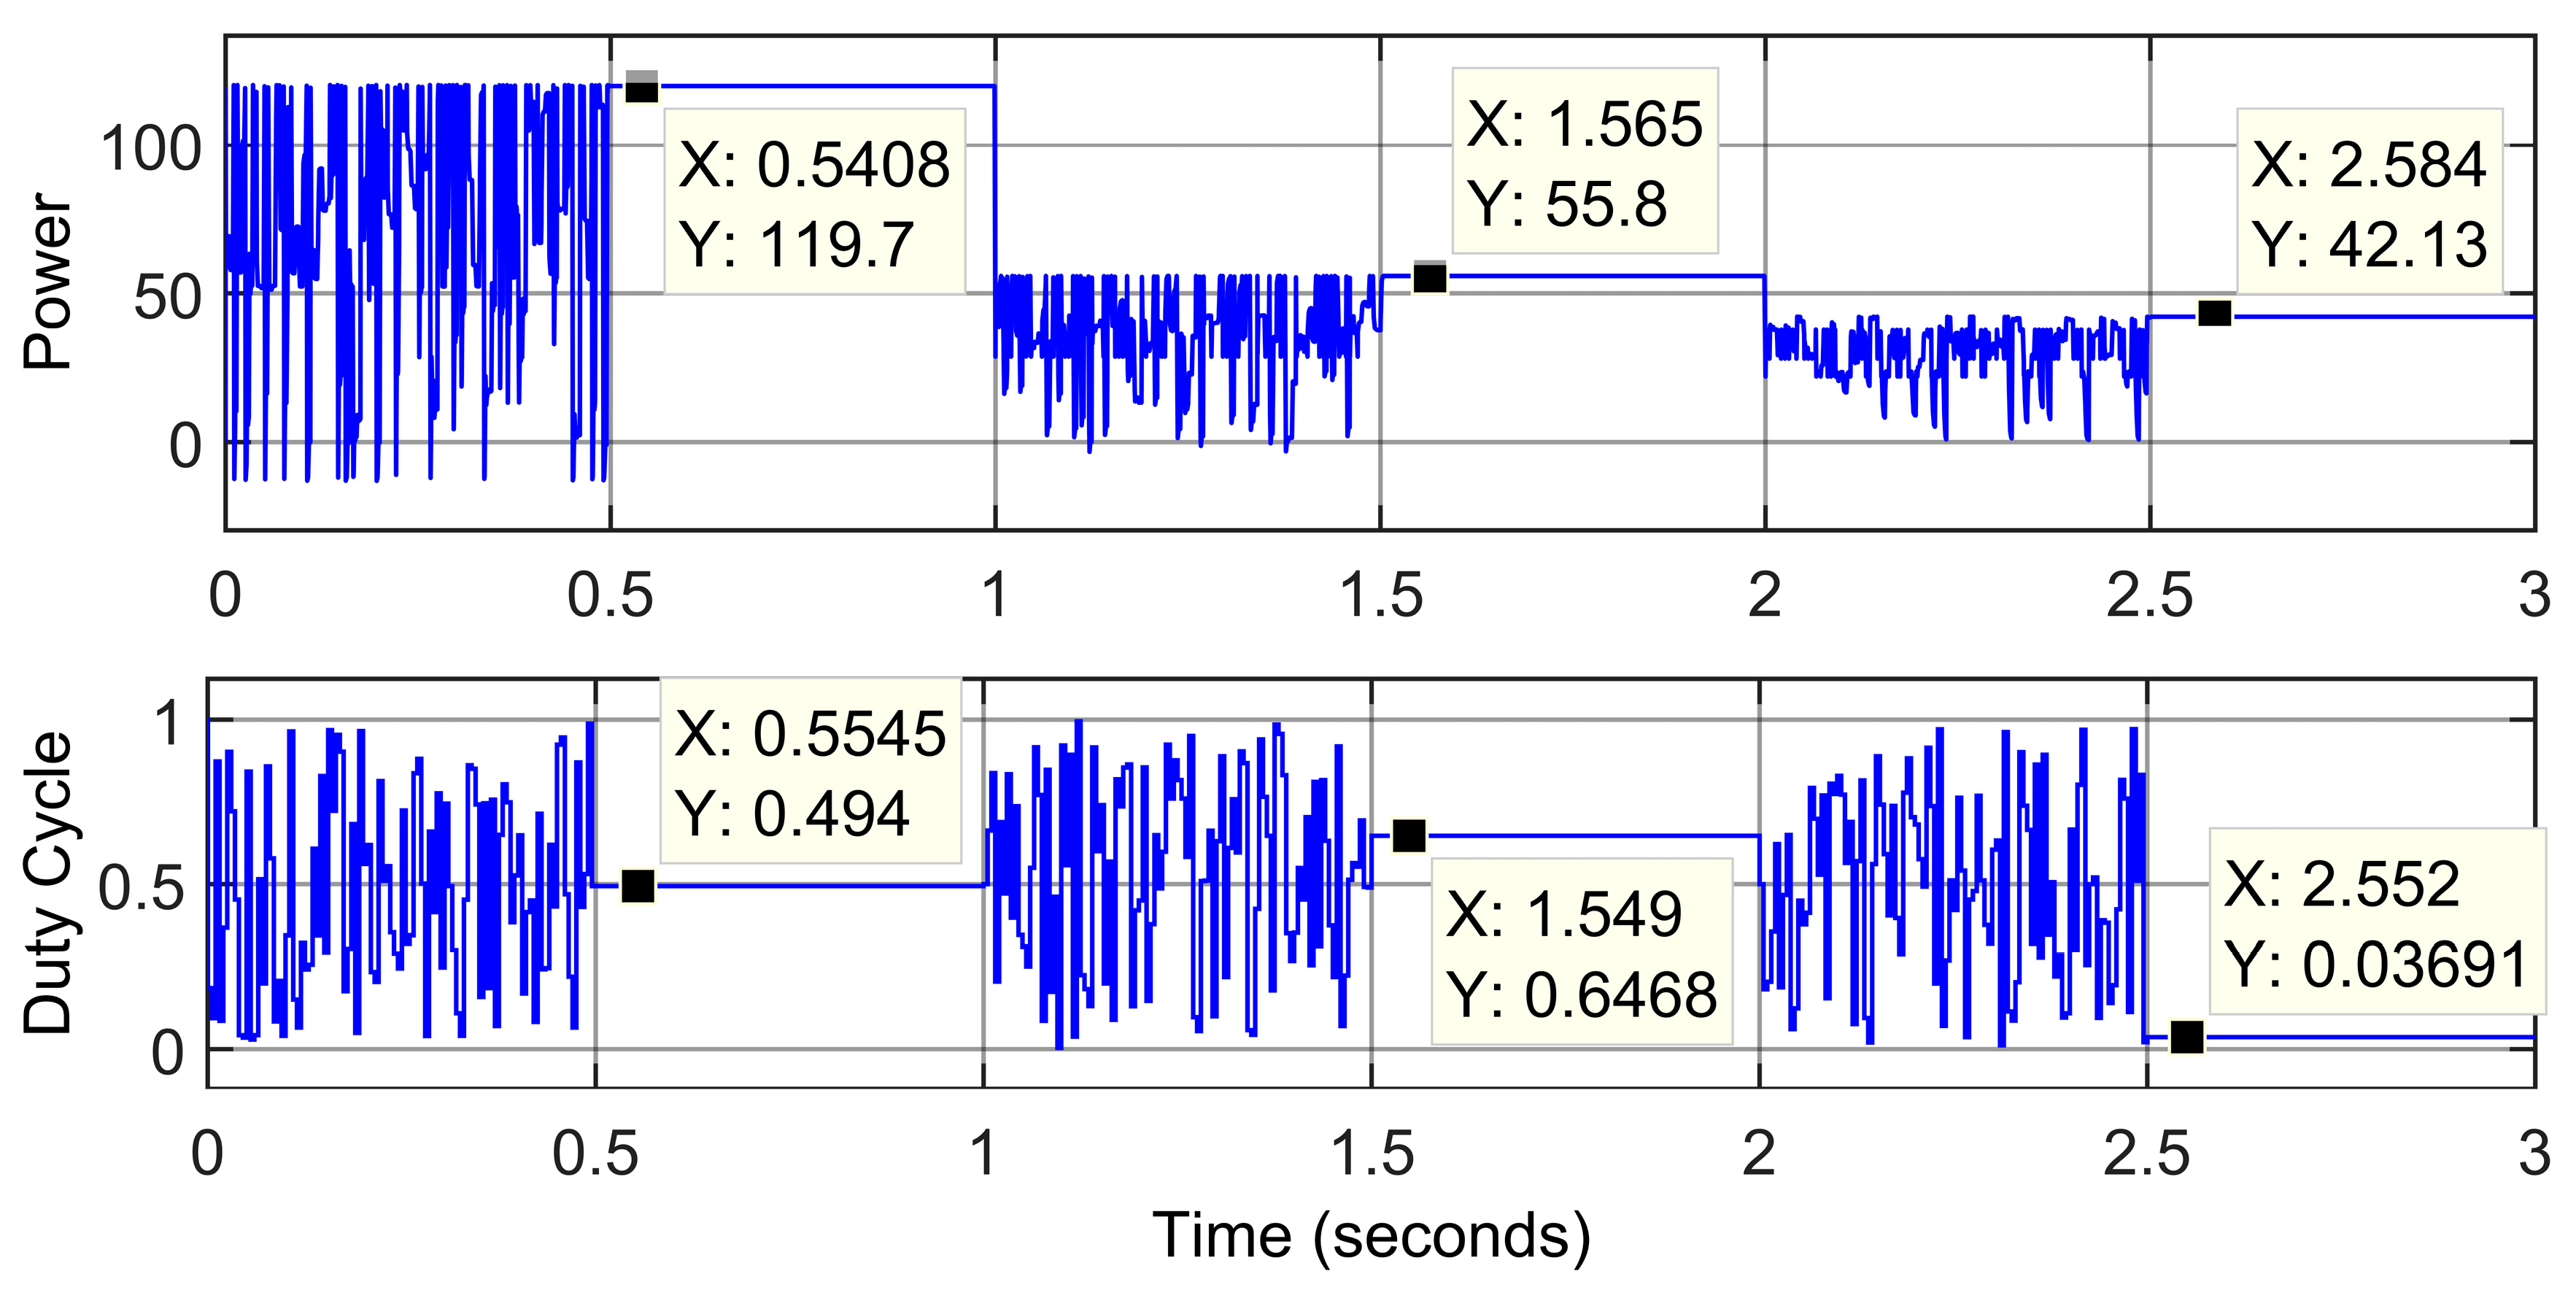
3.1. Case-1: Zero Shading
Discussion of Figure 5
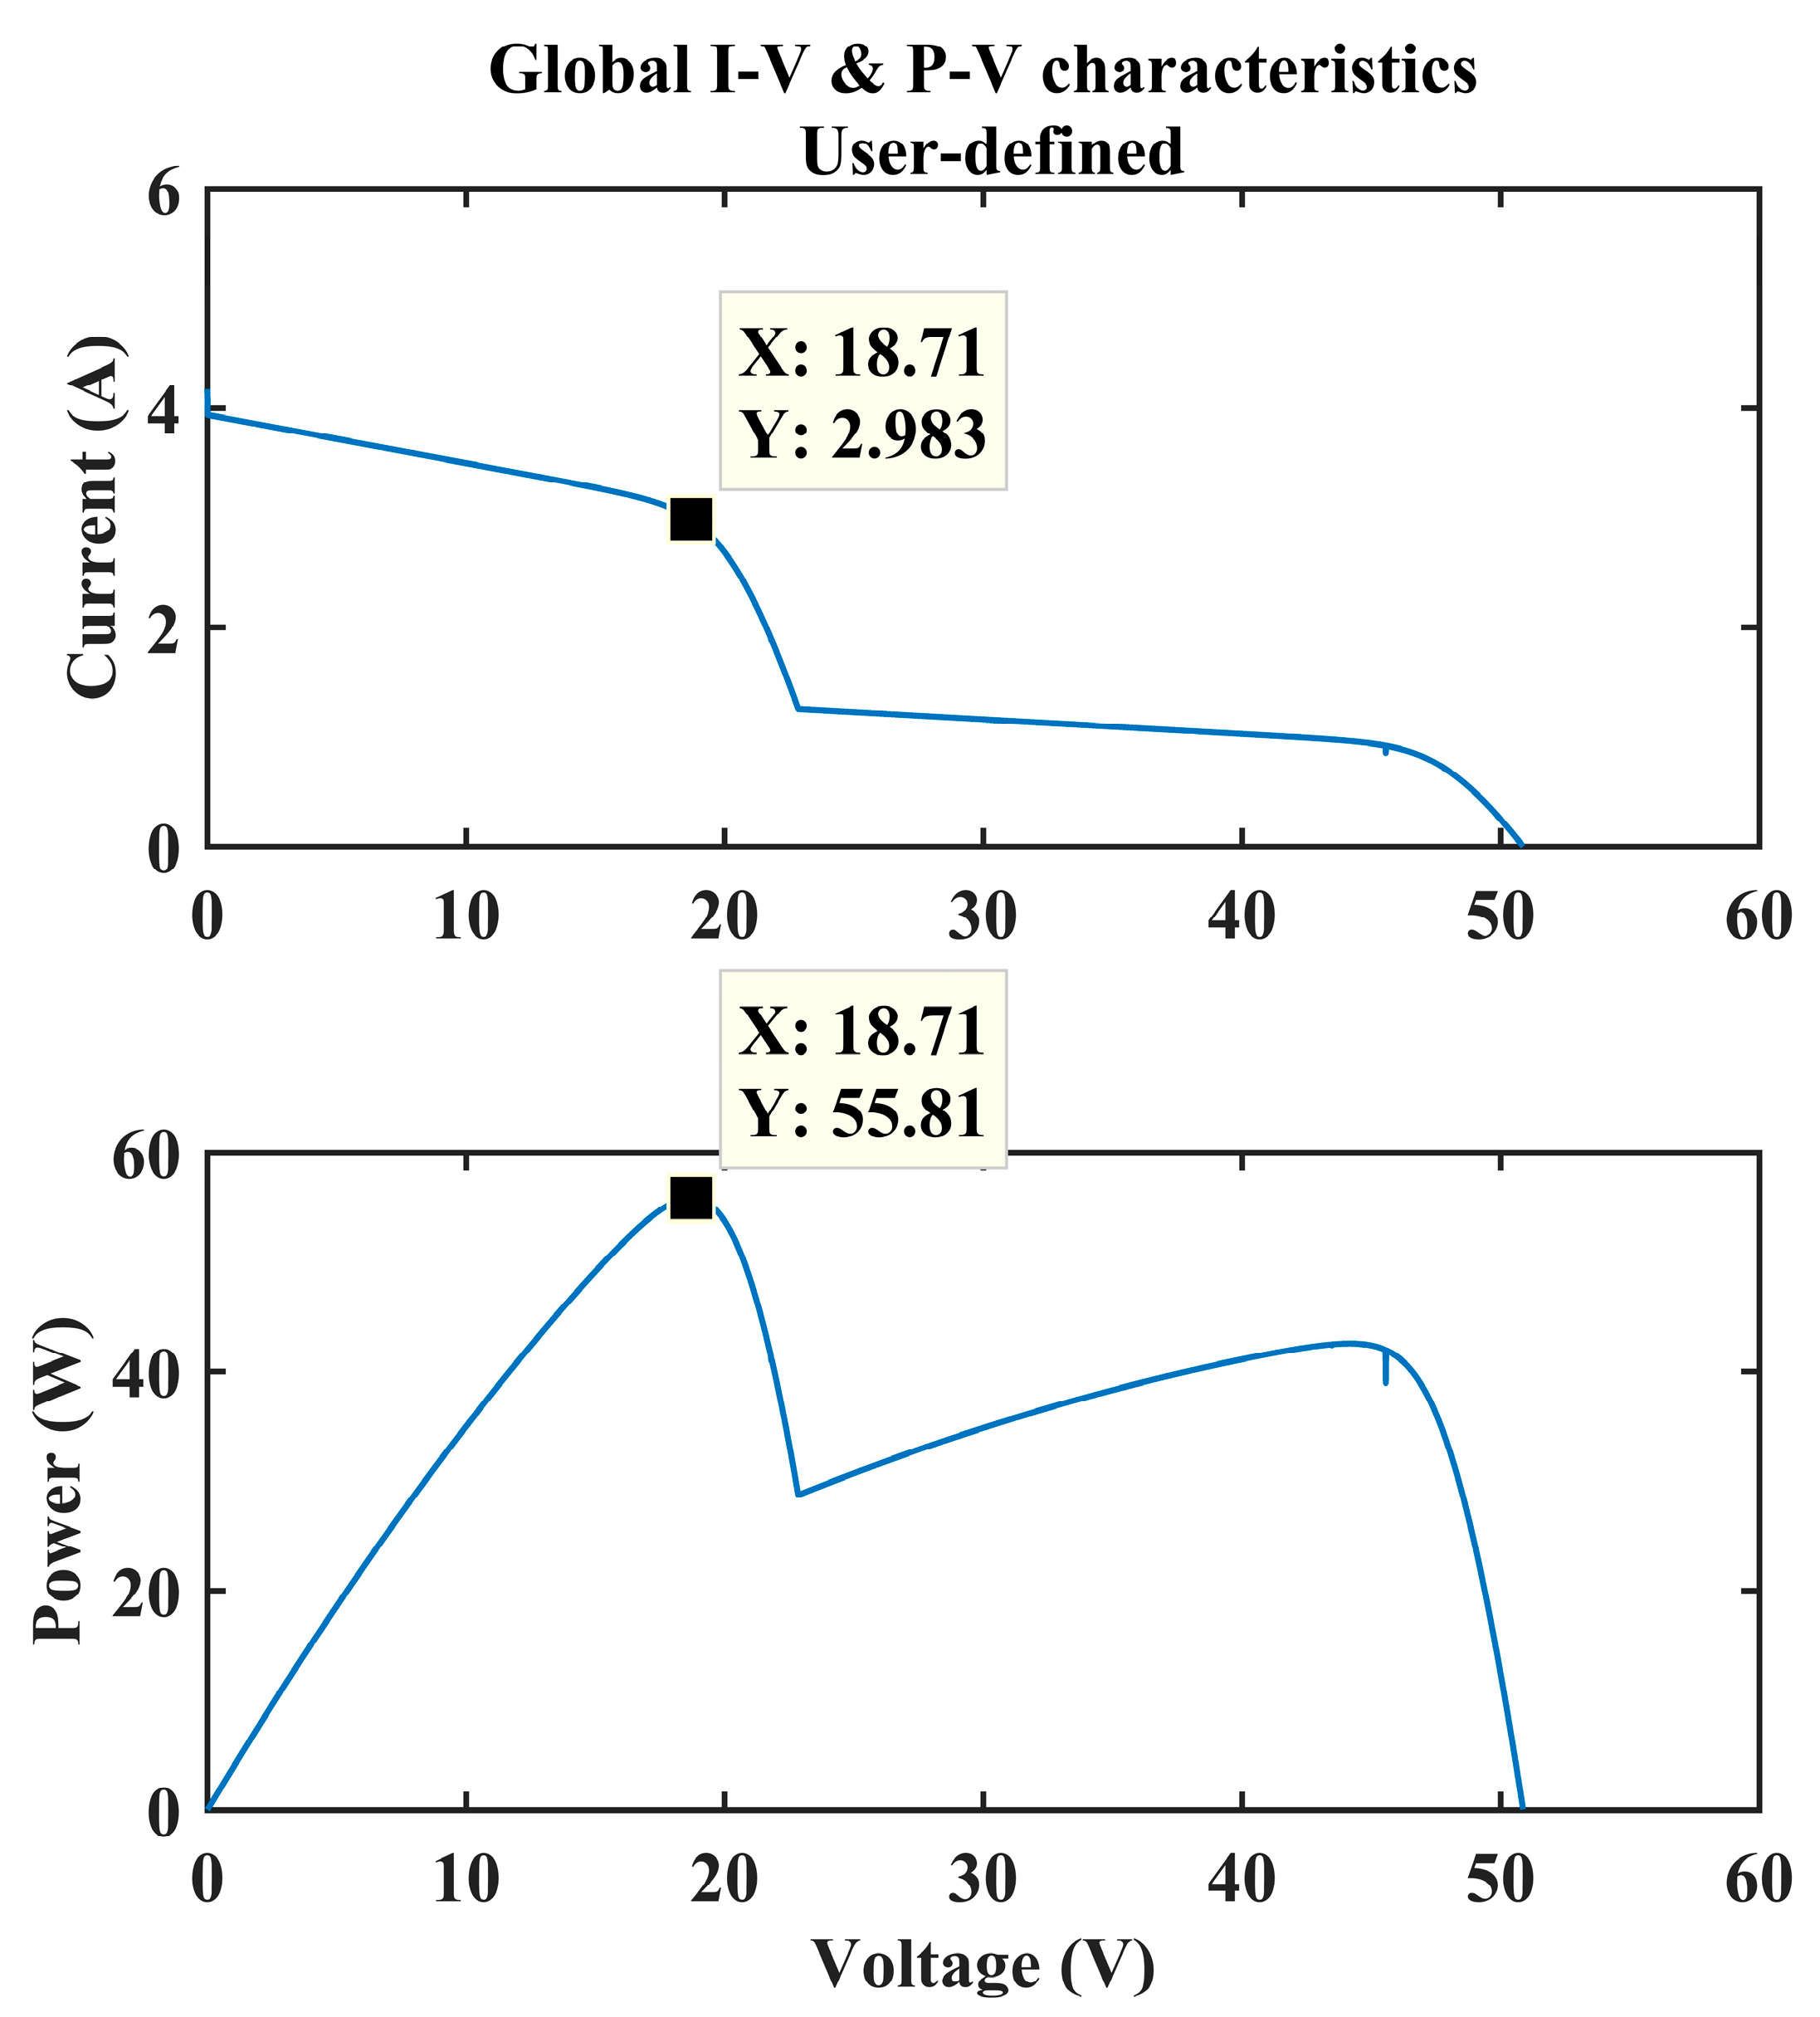
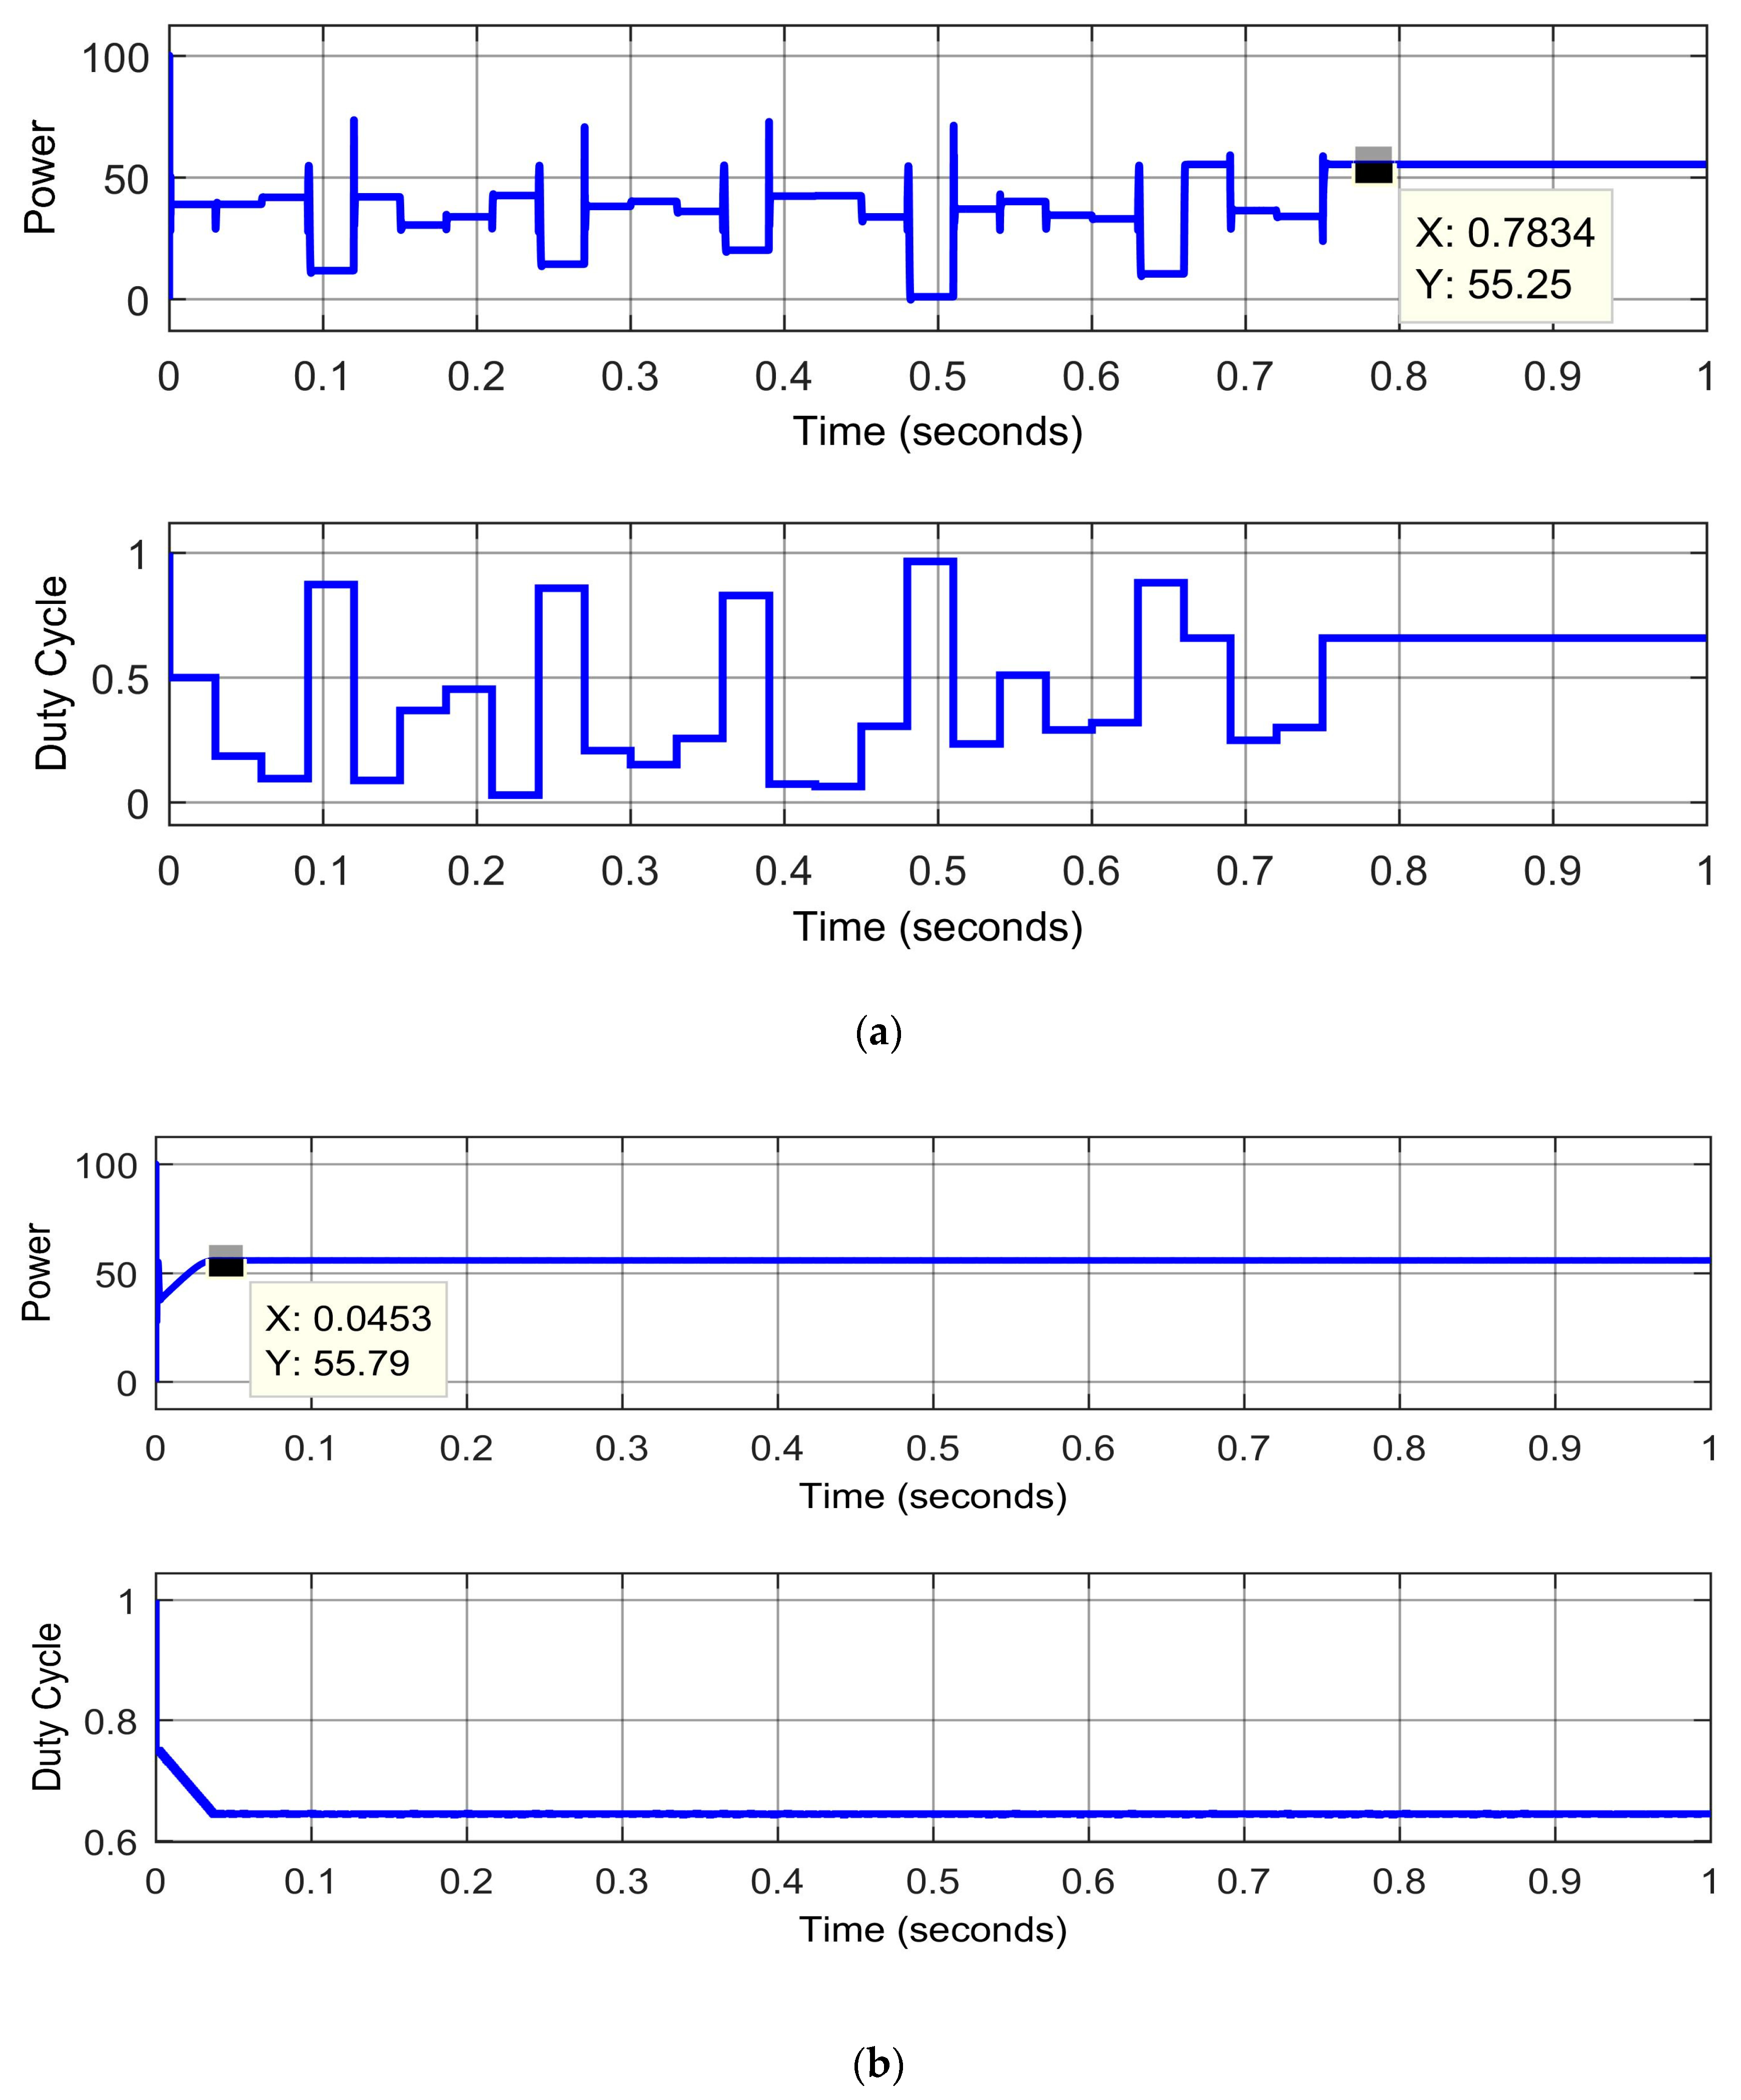
3.2. Case-2: Weak Partial Shading
Discussion of Figure 7
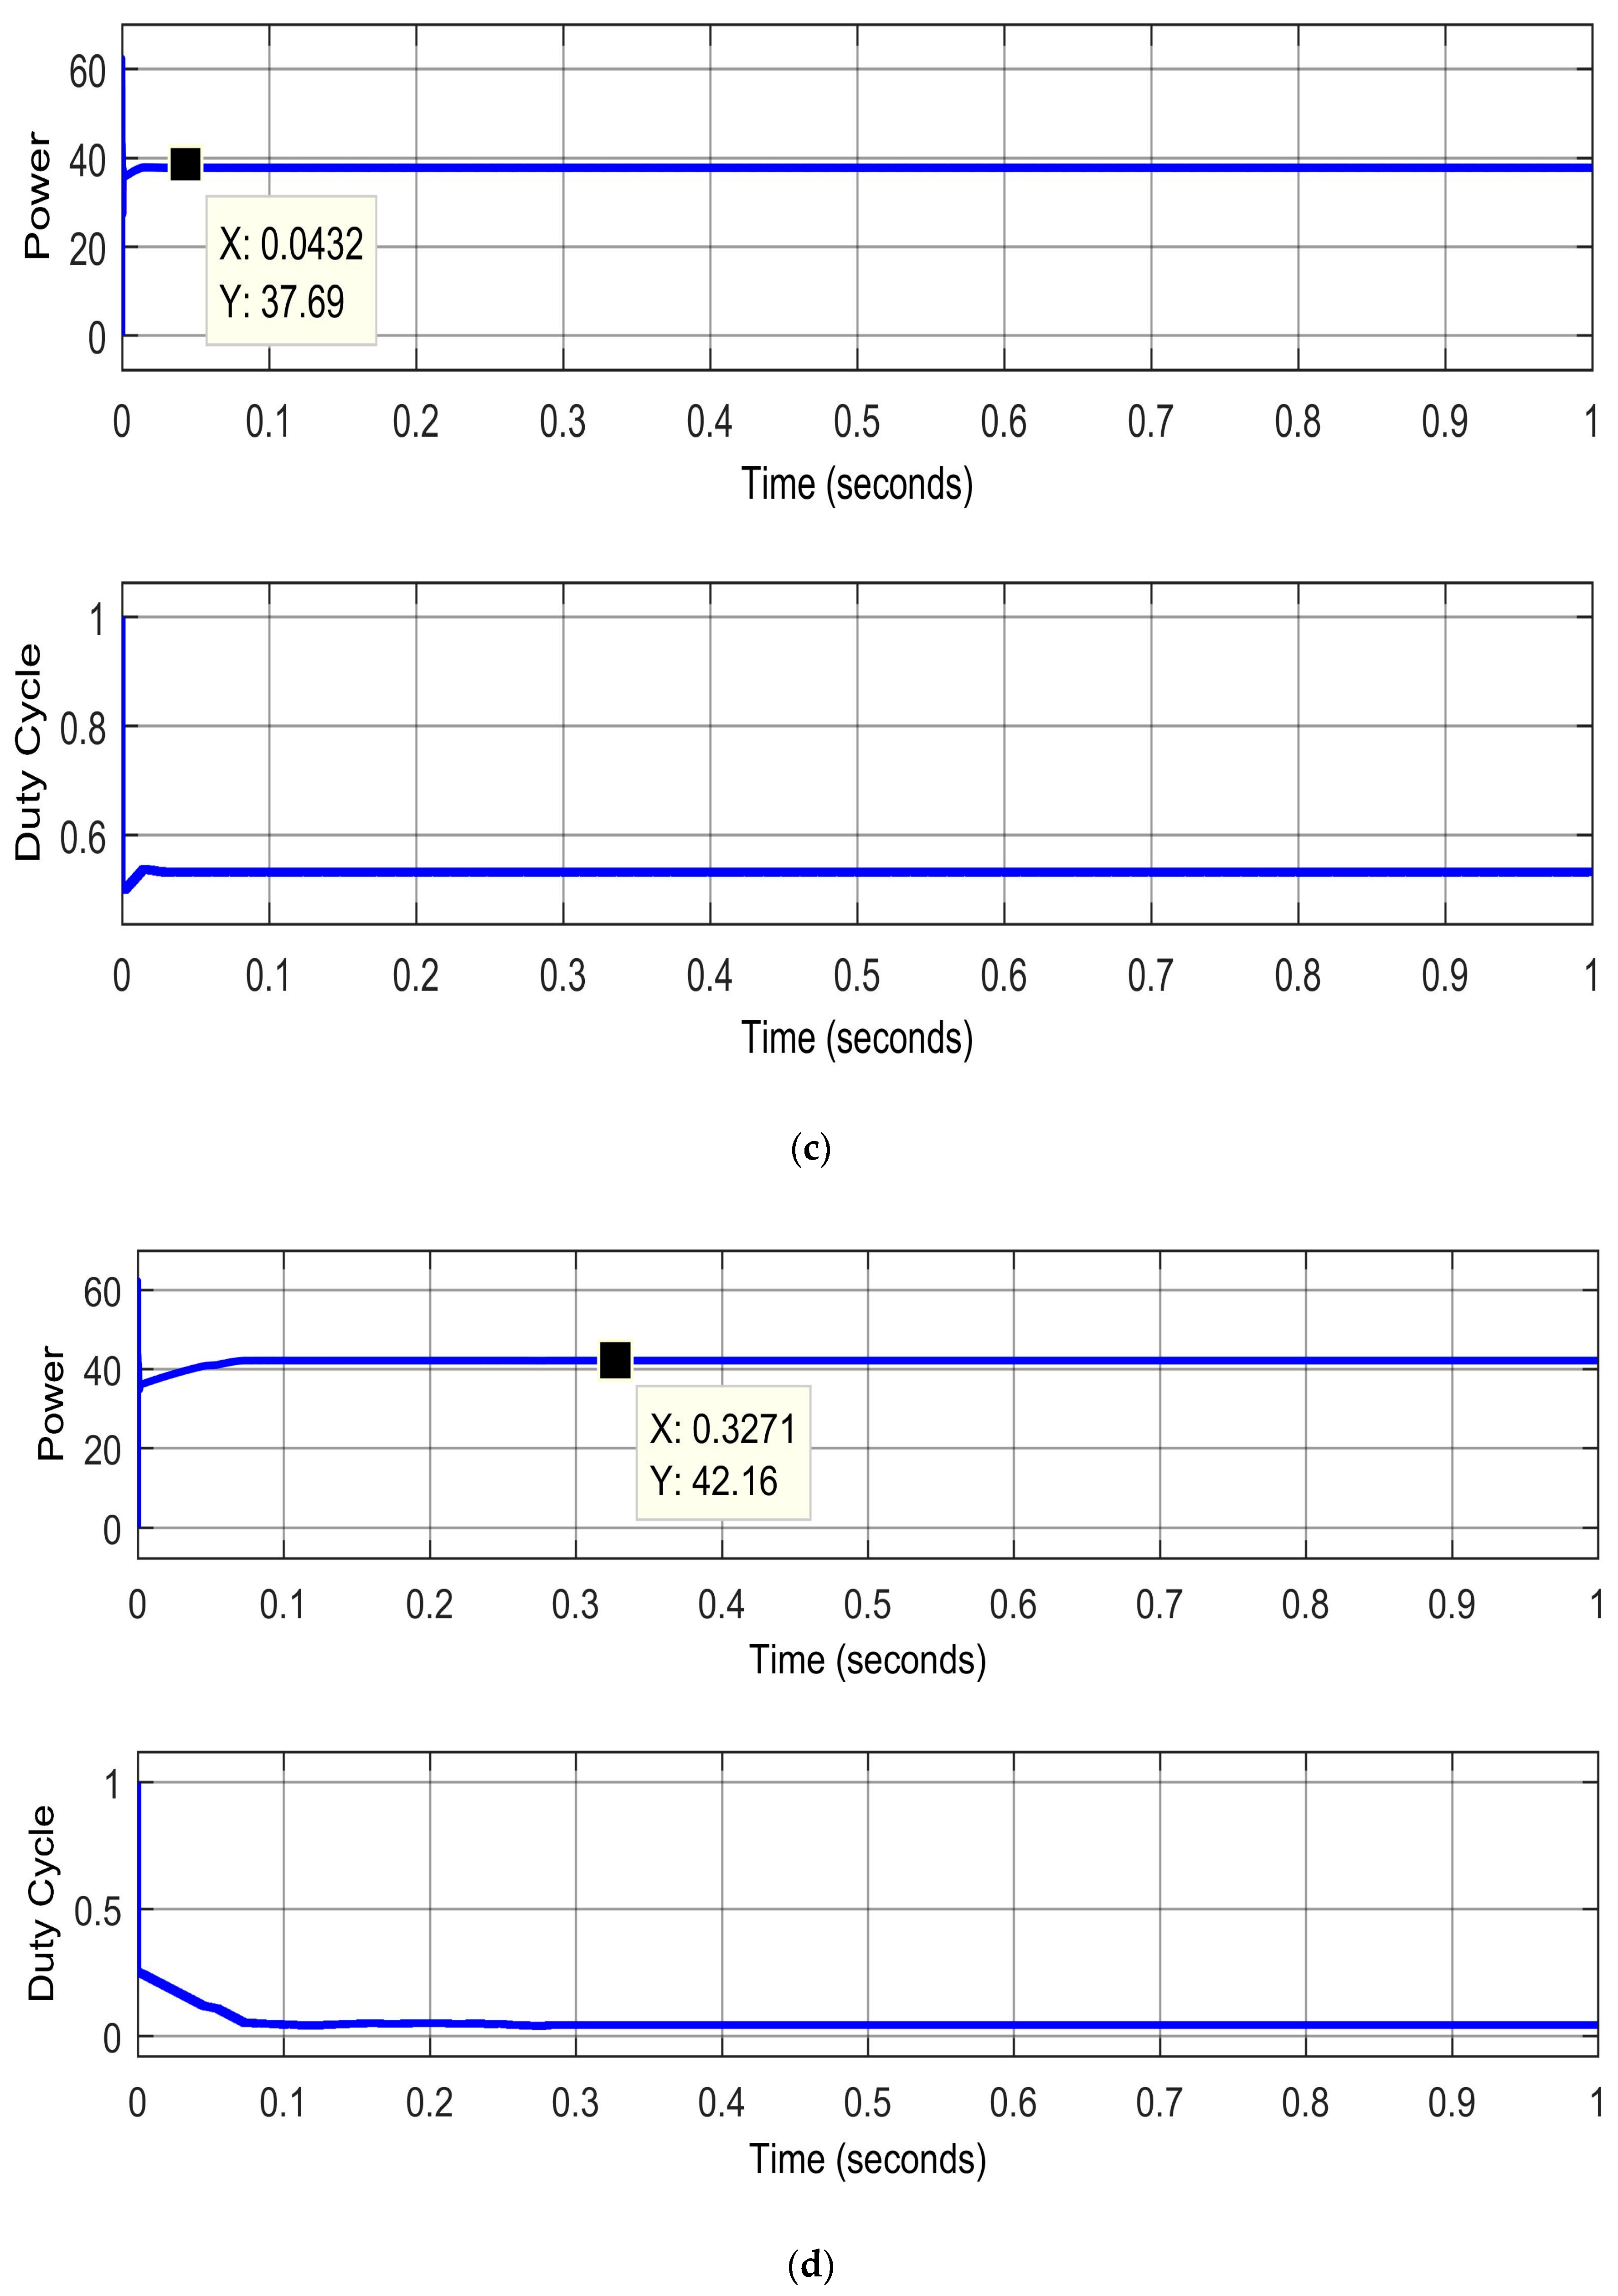
3.3. Case-3: Strong Shading
Discussion of Figure 9
4. Comparison
4.1. Analysis of TC for Partial Shading
Discussion of Figure 10
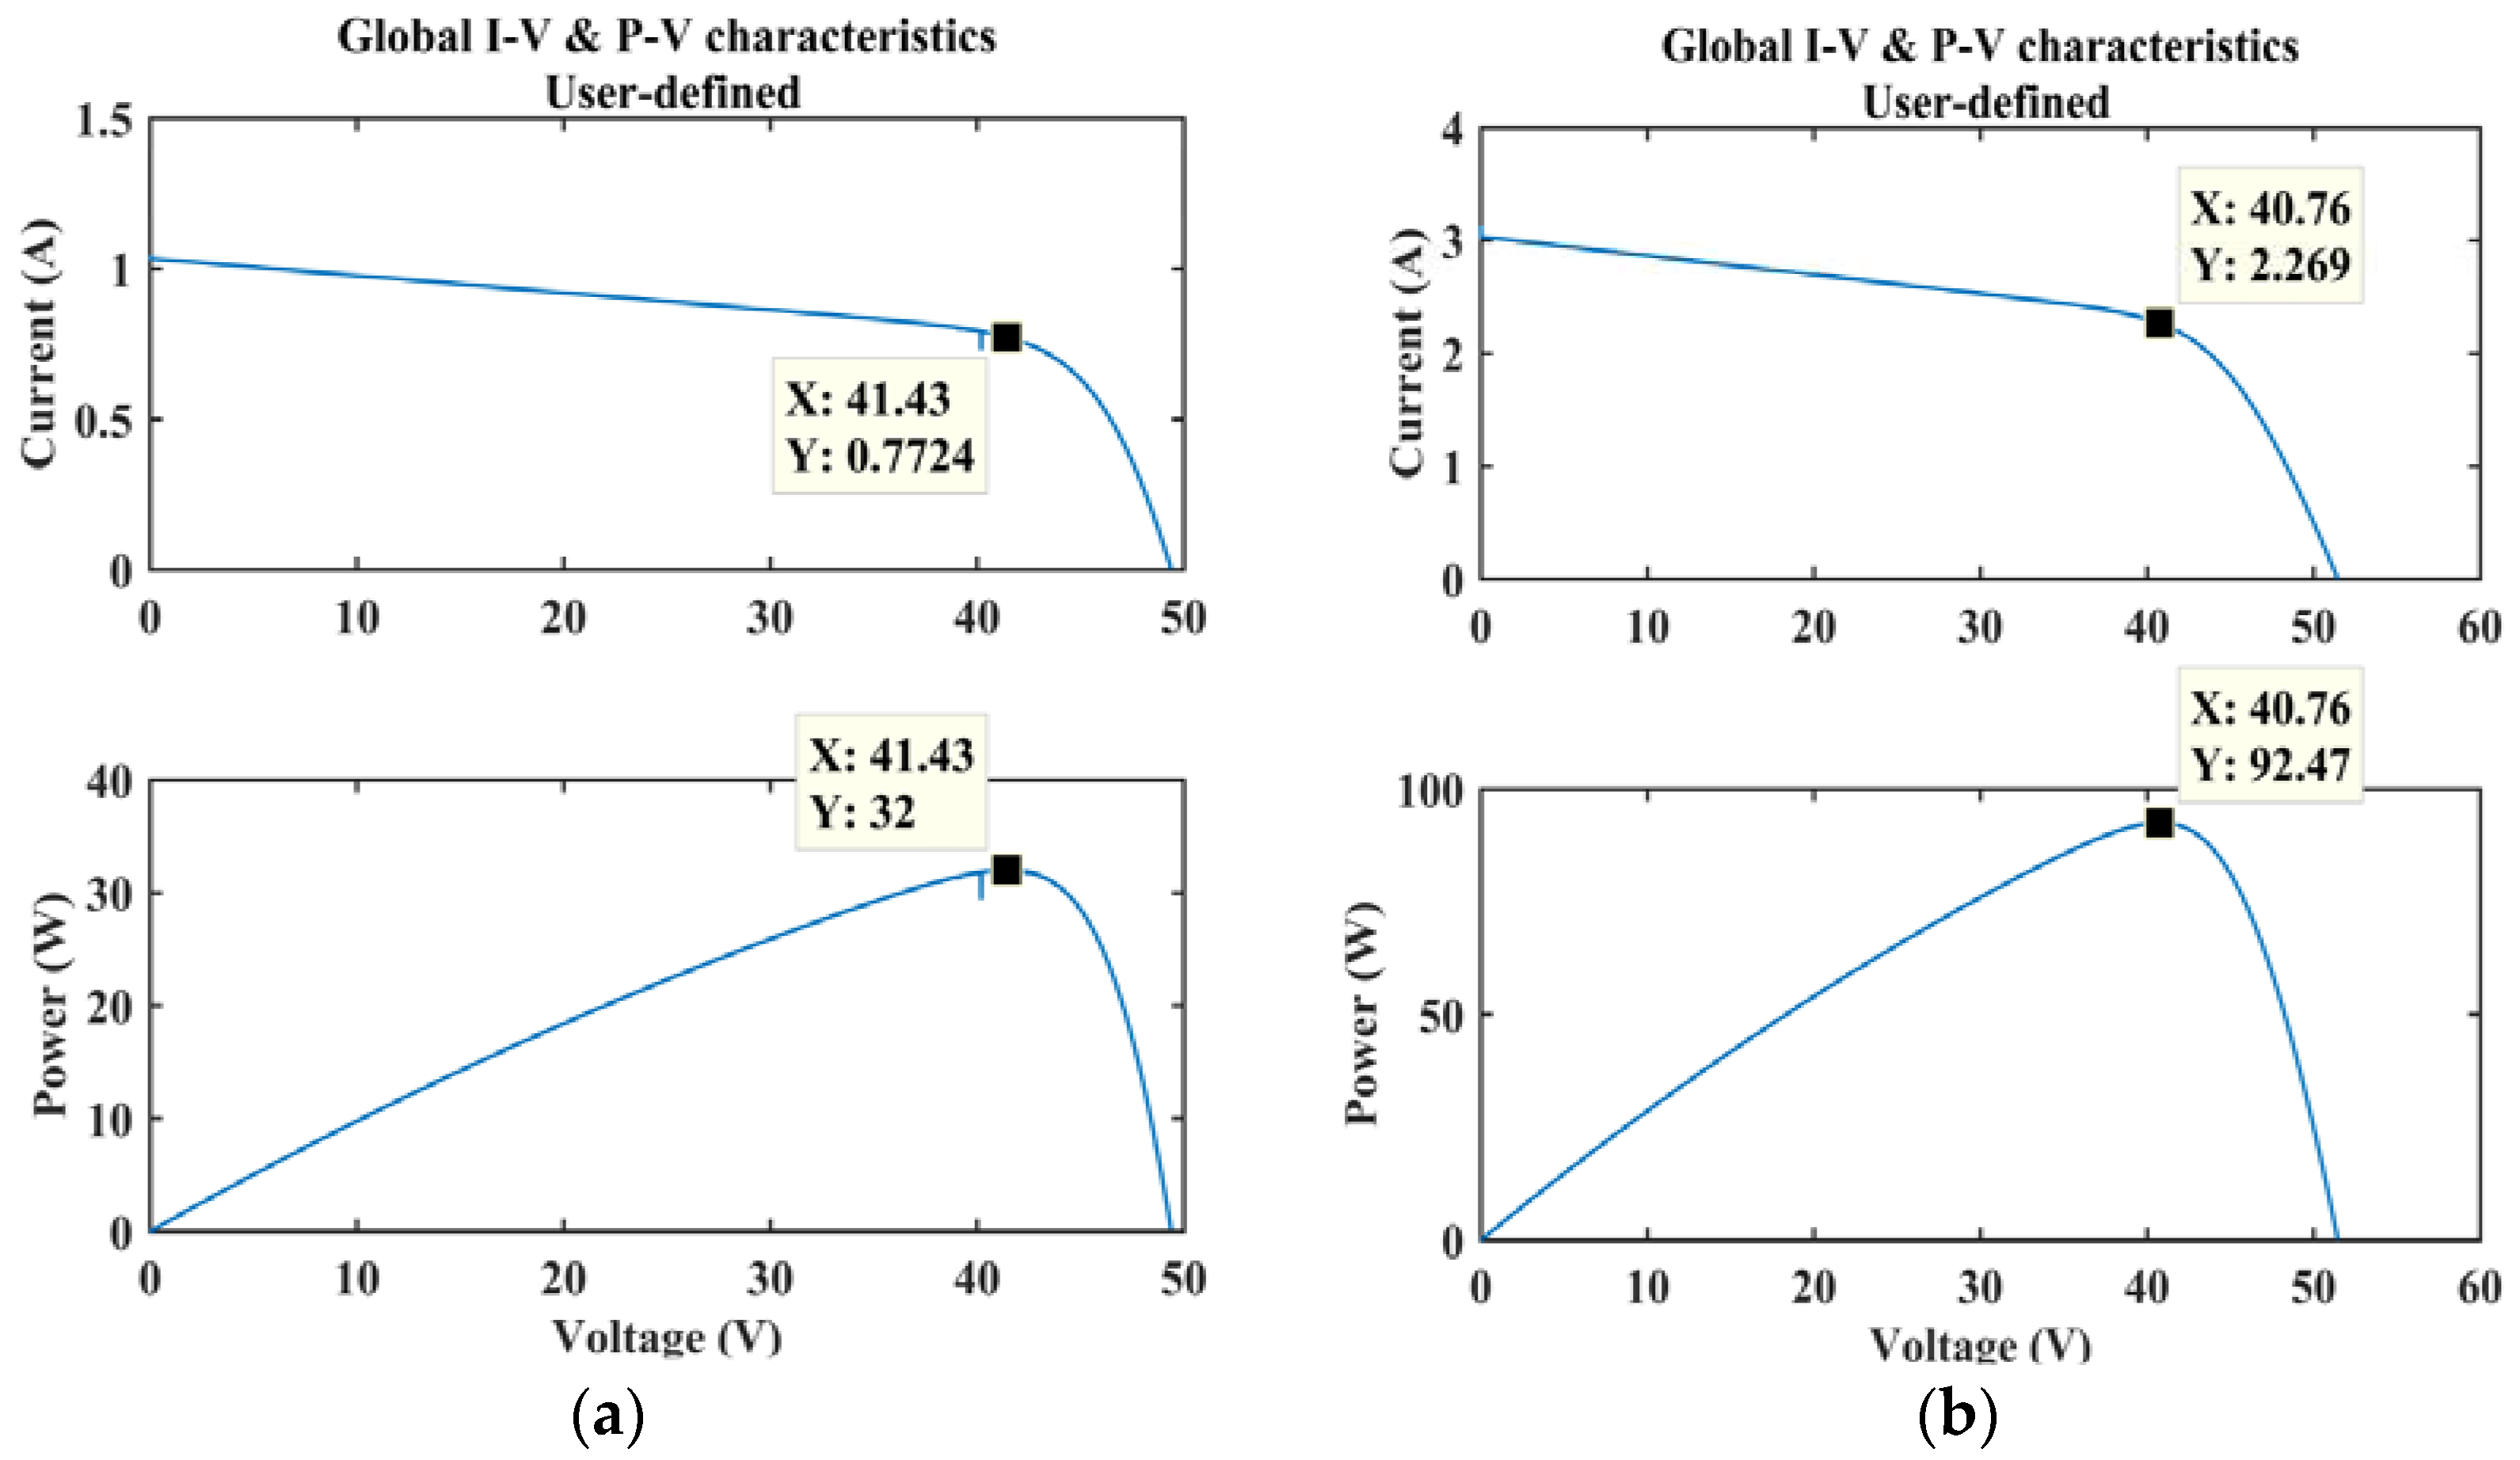
4.2. Uniform Shading Test
Discussion of Figure 11
5. More Configurations Test
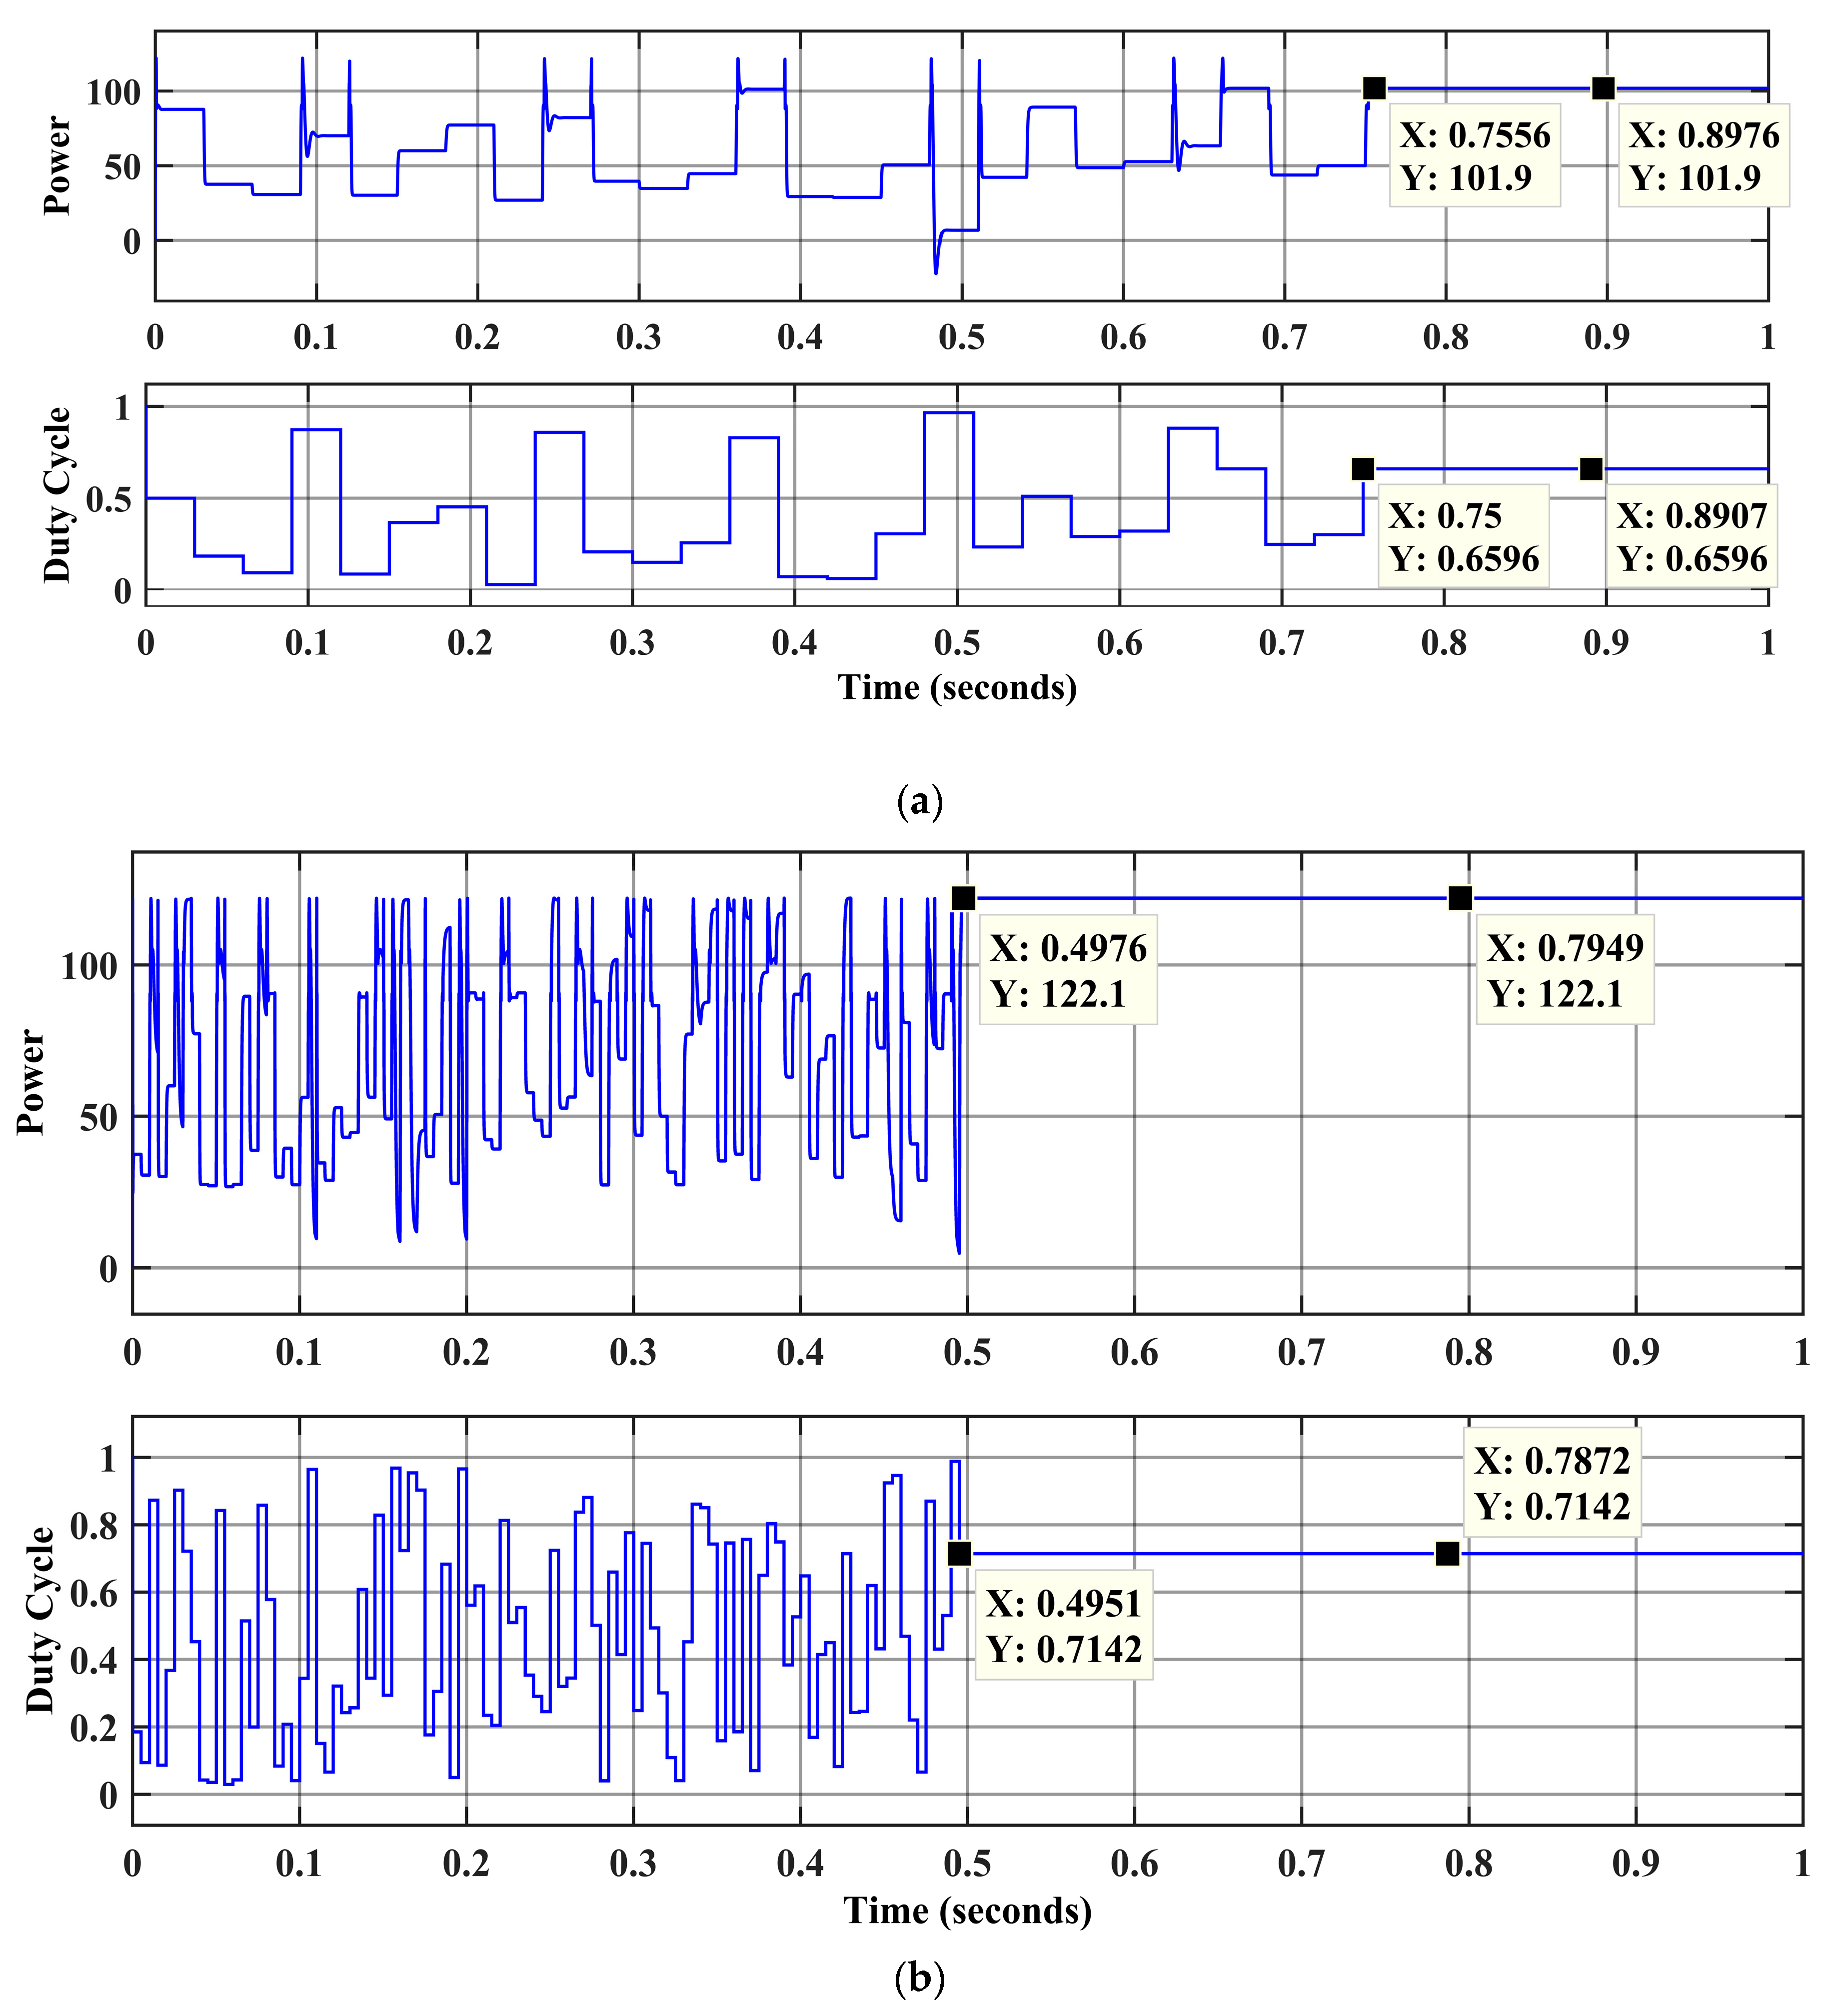
5.1. Case-(a), Shading of 4S2P
5.2. Case-(b), Shading of 4S2P
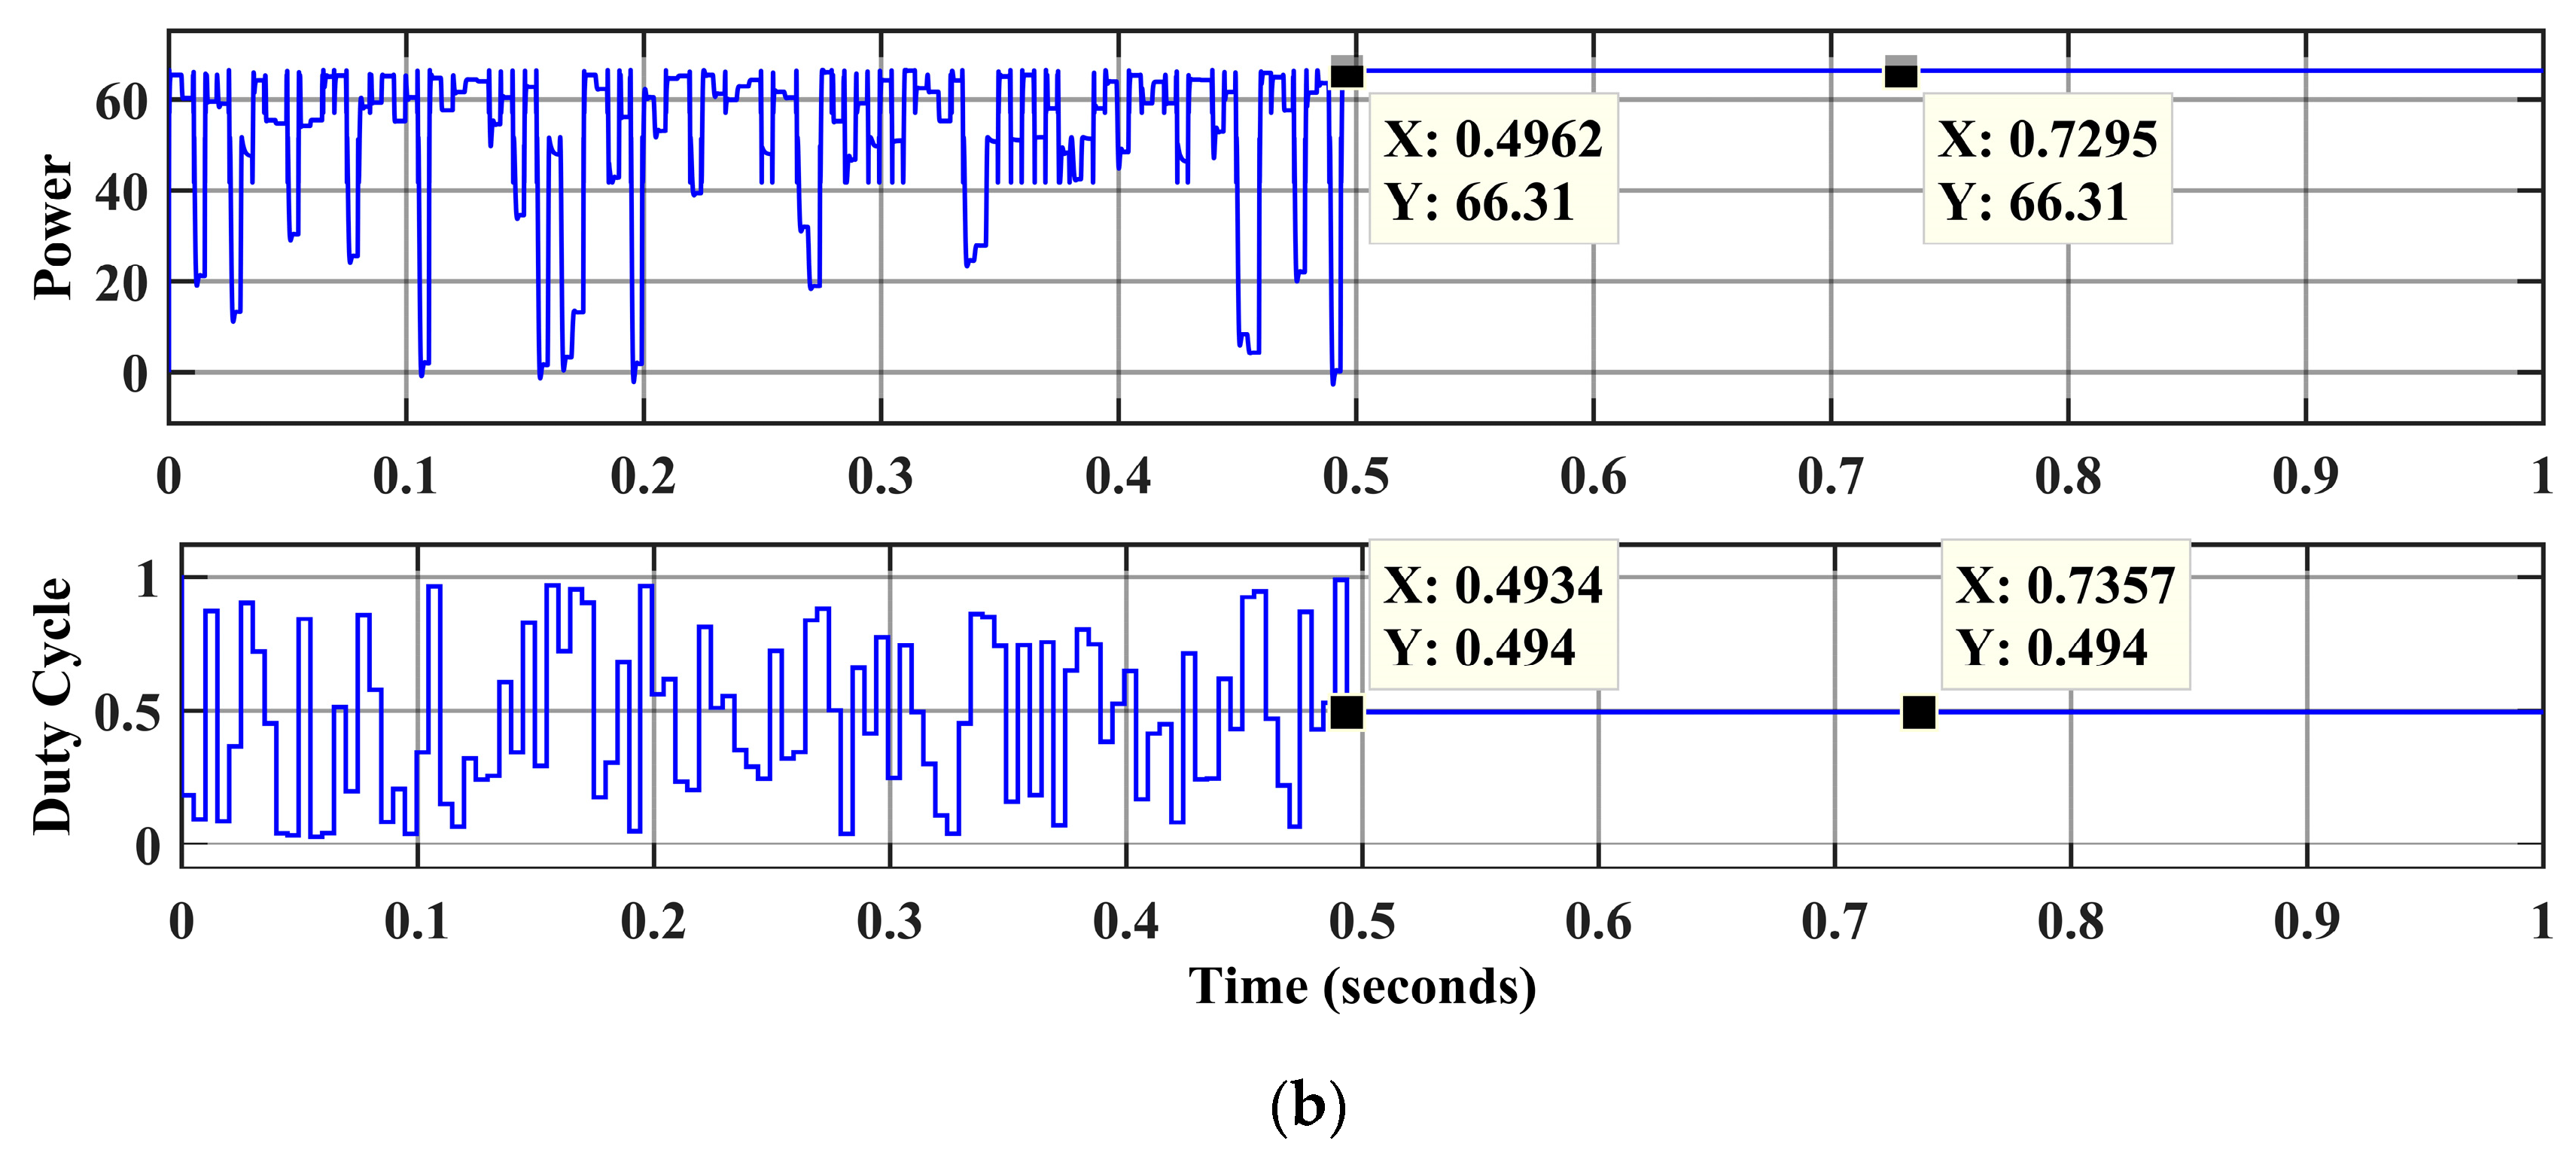
5.3. Case-(c), Shading of 6S
5.4. Case-(d), Shading of 6S
6. Conclusions
- The structure of the TC algorithm is simple and does not allow the changing weather conditions to affect its performance.
- Unlike the FPA algorithm, the TC algorithm avoids complex procedures for generating random numbers.
- Unlike the P&O algorithm, the TC algorithm does not waste time in comparing current power with the previous power at each step. These plus points have increased the tracking speed and accuracy of the TC algorithm.
- The TC algorithm achieved GMPP accurately and efficiently in all weather conditions and in record time.
Author Contributions
Funding
Acknowledgments
Conflicts of Interest
Appendix A. Modeling and Characteristics of Photovoltaic Cell


References
- Bastidas-Rodriguez, J.D.; Franco, E.; Petrone, G.; Ramos-Paja, C.A.; Spagnuolo, G. Maximum power point tracking architectures for photovoltaic systems in mismatching conditions: A review. IET Power Electron. 2014, 7, 1396–1413. [Google Scholar] [CrossRef]
- Ramyar, A.; Iman-Eini, H.; Farhangi, S. Global Maximum Power Point Tracking Method for Photovoltaic Arrays Under Partial Shading Conditions. IEEE Trans. Ind. Electron. 2017, 64, 2855–2864. [Google Scholar] [CrossRef]
- Stojcevski, A.; Rahim, N.A.; Chaniago, K.; Selvaraj, J. Single-phase seven-level grid-connected inverter for photovoltaic system. IEEE Trans. Ind. Electron. 2011, 58, 2435–2443. [Google Scholar]
- Bruendlinger, R.; Bletterie, B.; Milde, M.; Oldenkamp, H. Maximum power point tracking performance under partially shaded PV array conditions. In Proceedings of the 21st European Photovoltaic Solar Energy Conference and Exhibition, Dresden, Germany, 4–8 September 2006. [Google Scholar]
- Villalva, M.G.; Gazoli, J.R. Comprehensive approach to modelling and simulation of photovoltaic arrays. IEEE Trans. Power Electron. 2009, 24, 1198–1208. [Google Scholar] [CrossRef]
- Safari, A.; Mekhilef, S. Simulation and hardware implementation of incremental conductance MPPT with direct control method using Cuk converter. IEEE Trans. Ind. Electron. 2011, 58, 1154–1161. [Google Scholar] [CrossRef]
- Sher, H.A.; Murtaza, A.F.; Noman, A.; Addoweesh, K.E.; Al-Haddad, K.; Chiaberge, M. A new sensor less hybrid MPPT algorithm based on fractional short-circuit current measurement and P&O MPPT. IEEE Trans. Sustain. Energy 2015, 6, 1426–1434. [Google Scholar]
- Enslin, J.H.R.; Wolf, M.S.; Snyman, D.B.; Swiegers, W. Integrated photovoltaic maximum power point tracking converter. IEEE Trans. Ind. Electron. 1997, 44, 769–773. [Google Scholar] [CrossRef] [Green Version]
- Ram, J.P.; Babu, T.S.; Rajasekar, N. A comprehensive review on solar PV maximum power point tracking techniques. Renew. Sustain. Energy Rev. 2017, 67, 826–847. [Google Scholar] [CrossRef]
- Femia, N.; Petrone, G.; Spagnuolo, G.; Vitelli, M. A technique for improving P&O MPPT performances of double-stage grid-connected photovoltaic systems. IEEE Trans. Ind. Electron. 2009, 56, 3456–3467. [Google Scholar]
- Nguyen, T.L.; Low, K.S. A global maximum power point tracking scheme employing DIRECT search algorithm for photovoltaic systems. IEEE Trans. Ind. Electron. 2010, 57, 4473–4482. [Google Scholar] [CrossRef]
- Syafaruddin, E.; Hiyama, K.T. Artificial neural network-polar coordinated fuzzy controller based maximum power point tracking control under partially shaded conditions. IET Renew. Power Gener. 2009, 3, 239–253. [Google Scholar] [CrossRef]
- Chiu, C.-S.; Fuzzy, T.-S. Maximum power point tracking control of solar power generation systems. IEEE Trans. Energy Convers. 2010, 25, 1123–1132. [Google Scholar] [CrossRef]
- Mohamed, A.A.S.; Berzoy, A.; Mohammed, O. Optimized-fuzzy MPPT controller using GA for stand-alone photovoltaic water pumping system. In Proceedings of the IECON 2014—40th Annual Conference of the IEEE Industrial Electronics Society, Dallas, TX, USA, 29 October–1 November 2014; pp. 2213–2218. [Google Scholar]
- Miyatake, M.; Veerachary, M. Maximum power point tracking of multiple photovoltaic arrays: APSO approach. IEEE Trans. Aerosp. Electron. Syst. 2011, 47, 367–380. [Google Scholar] [CrossRef]
- Price, K.V.; Storn, R.M.; Lampinen, J.A. Differential Evolution: A Practical Approach to Global Optimization; Springer-Verlag: Berlin, Germany, 2005. [Google Scholar]
- Sundareswaran, K.; Peddapati, S.; Palani, S. Application of random search method for maximum power point tracking in partially shaded photovoltaic systems. IET Renew. Power Gener. 2014, 8, 670–678. [Google Scholar] [CrossRef]
- Sundareswaran, K.; Sankar, P.; Nayak, P.S.R.; Simon, S.P.; Palani, S. Enhanced Energy Output from a PV System Under Partial Shaded Conditions Through Artificial Bee Colony. IEEE Trans. Sustain. Energy 2015, 6, 198–209. [Google Scholar] [CrossRef]
- Ram, J.P.; Rajasekar, N. A new global maximum power point tracking technique for solar photovoltaic (PV) system under partial shading conditions (PSC). Energy 2017, 118, 512–525. [Google Scholar]
- Lukasik, S.; Kowalski, P.A. Study of Flower Pollination Algorithm for Continuous Optimization. In Intelligent Systems’ 2014; Springer: Cham, Switzerland, 2015; pp. 451–459. [Google Scholar]
- Koad, R.B.A.; Zobaa, A.F.; El-Shahat, A. A Novel MPPT Algorithm Based on Particle Swarm Optimization for Photovoltaic Systems. IEEE Trans. Sustain. Energy 2017, 8, 468–476. [Google Scholar] [CrossRef]
- Shongwe, S.; Hanif, M. Comparative analysis of different single-diode PV modeling methods. IEEE J. Photovolt. 2015, 5, 938–946. [Google Scholar] [CrossRef]
- Rajasekar, N.; Neeraja, K.K.; Venugopalan, R. Bacterial foraging algorithm based solar PV parameter estimation. Sol. Energy 2013, 97, 255–265. [Google Scholar] [CrossRef]
- Koran, A.; LaBella, T.; Lai, J.-S. High efficiency photovoltaic source simulator with fast response time for solar power conditioning systems evaluation. IEEE Trans. Power Electron. 2014, 29, 1285–1296. [Google Scholar] [CrossRef]
- Niranjan, D.S.; Bhaskar, D.S.; Shekar, M.J.; Sudhakar, B.T.; Rajasekar, N. Solar PV array reconfiguration under partial shading conditions for maximum power extraction using genetic algorithm. Renew. Sustain. Energy Rev. 2015, 43, 102–110. [Google Scholar]
- Rani, B.I.; Ilango, G.S.; Nagamani, C. Enhanced power generation from PV array under partial shading conditions by shade dispersion using Su Do Ku configuration. IEEE Trans. Sustain. Energy 2013, 4, 594–601. [Google Scholar] [CrossRef]
- Ishaque, K.; Salam, Z. A deterministic particle swarm optimization maximum power point tracker for photovoltaic system under partial shading condition. IEEE Trans. Ind. Electron. 2013, 60, 3195–3206. [Google Scholar] [CrossRef]
- Babu, T.S.; Rajasekar, N.; Sangeetha, K. Modified particle swarm optimization technique based maximum power point tracking for uniform and under partial shading condition. Appl. Soft Comput. 2015, 34, 613–624. [Google Scholar] [CrossRef]
- Ram, J.P.; Rajasekar, N. A Novel Flower Pollination Based Global Maximum Power Point Method for Solar Maximum Power Point Tracking. IEEE Trans. Power Electron. 2017, 32, 8486–8499. [Google Scholar]
- Sundareswaran, K.; Peddapati, S.; Palani, S. MPPT of PV systems under partial shaded conditions through a colony of flashing fireflies. IEEE Trans. Energy Convers. 2014, 29, 463–472. [Google Scholar]


| P&O | FPA | TC |
|---|---|---|
| D = 0.75 | P = 0.8 | - |
| ΔD = 3 × 10⁻⁴ | ϒ = 1.5 | - |
| Shading Patterns | Algorithms | PMPP (w) | Rated Power (W) | Efficiency (%) | Tracking Time (s) | Best Algorithm for the Case |
|---|---|---|---|---|---|---|
| Case-1 (Zero Shading) | TC | 119.7 | 120 | 99.75 | 0.497 | TC & P&O |
| FPA | 119.2 | 99.3 | 0.75 | |||
| P&O | 120 | 100 | 0.09 | |||
| Case-2 (Weak Shading) | TC | 55.78 | 55.81 | 99.95 | 0.497 | TC |
| FPA | 55.25 | 98.99 | 0.78 | |||
| P&O | Failed | Zero “0” | Failed | |||
| Case-3 (Strong Shading) | TC | 42.16 | 42.16 | 100 | 0.497 | TC |
| FPA | 42.05 | 99.74 | 0.79 | |||
| P&O | Failed | Zero “0” | Failed |
| Sr. No. | Parameter | Perturb and Observe [5] | Fuzzy [13] | PSO [15] | RSM [17] | FPA [29] | TC |
|---|---|---|---|---|---|---|---|
| 1 | Steady State Oscillations | Huge | Less | Nil | Nil | Nil | NIL |
| 2 | Speed of Tracking | Slow | Reasonable | Reasonable | Fast | Fast | FASTEST |
| 3 | Complications | Few | Reasonable | Huge | Few | Reasonable | NO |
| 4 | Procedural Complications | Few | Reasonable | Reasonable | Few | Reasonable | NO |
| 5 | Memorizing Necessity | Few | Large | Few | Few | Few | FEW |
| 6 | Computational Complications | Few | Large | Reasonable | Few | Reasonable | FEW |
| 7 | Performance Under PSC | Fail | Few | Reasonable | Good | Good | EXCELLENT |
| 8 | Execution Time | High | Reasonable | Reasonable | Low | Low | VERY LOW |
| 9 | Array Dependent | Yes | Yes | No | No | No | N0 |
| 10 | Steps | 2 | 4 | 4 | 3 | 2 | 1 |
| 11 | Parameters Tuning | Yes | Yes | Yes | Yes | Yes | NO |
| 12 | Efficiency | Lower in PSC | Low in PSC | Average | Average | Average | HIGH |
| 13 | Simple and Short | Yes | No | No | No | No | YES |
| Cases | PMPP (W) | Rated Power (W) | Efficiency (%) |
|---|---|---|---|
| Case-1 | 119.7 | 120 | 99.75 |
| Case-2 | 55.8 | 55.81 | 99.98 |
| Case-3 | 42.13 | 42.16 | 99.93 |
| Illumination (W/m2) | PMPP (W) | Rated Power (W) | Efficiency (%) |
|---|---|---|---|
| 1000 | 119.7 | 120 | 99.75 |
| 250 | 31.61 | 32 | 99.78 |
| 750 | 92.45 | 92.47 | 99.98 |
| Shading Patterns | Algorithms | PMPP (w) | Rated Power (W) | Efficiency (%) | Efficiency Improvement (%) | Tracking Time (s) | Tracking Time Improvement (s) |
|---|---|---|---|---|---|---|---|
| Case (a) (4S2P) | TC | 122.1 | 122.1 | 100 | 16.54 | 0.4976 | 0.258 s 34% |
| FPA | 101.9 | 83.46 | 0.7556 | ||||
| P&O | Failed | Zero “0” | Failed | ||||
| Case (b) (4S2P) | TC | 110.8 | 111.6 | 99.28 | Same | 0.5016 | 0.2586 s 34% |
| FPA | 110.8 | 99.28 | 0.7602 | ||||
| P&O | Failed | Zero “0” | Failed | ||||
| Case (c) (6S) | TC | 66.31 | 66.45 | 99.8 | 0.4 | 0.4962 | 0.2564 s 34.1% |
| FPA | 66.05 | 99.4 | 0.7526 | ||||
| P&O | Failed | Zero “0” | Failed | ||||
| Case (d) (6S) | TC | 69.58 | 69.58 | 100 | Same | 0.4829 | 0.2681 s 35.7% |
| FPA | 69.58 | 100 | 0.751 | ||||
| P&O | Failed | Zero “0” | Failed |
© 2018 by the authors. Licensee MDPI, Basel, Switzerland. This article is an open access article distributed under the terms and conditions of the Creative Commons Attribution (CC BY) license (http://creativecommons.org/licenses/by/4.0/).
Share and Cite
Afzal Awan, M.M.; Mahmood, T. A Novel Ten Check Maximum Power Point Tracking Algorithm for a Standalone Solar Photovoltaic System. Electronics 2018, 7, 327. https://doi.org/10.3390/electronics7110327
Afzal Awan MM, Mahmood T. A Novel Ten Check Maximum Power Point Tracking Algorithm for a Standalone Solar Photovoltaic System. Electronics. 2018; 7(11):327. https://doi.org/10.3390/electronics7110327
Chicago/Turabian StyleAfzal Awan, Muhammad Mateen, and Tahir Mahmood. 2018. "A Novel Ten Check Maximum Power Point Tracking Algorithm for a Standalone Solar Photovoltaic System" Electronics 7, no. 11: 327. https://doi.org/10.3390/electronics7110327
APA StyleAfzal Awan, M. M., & Mahmood, T. (2018). A Novel Ten Check Maximum Power Point Tracking Algorithm for a Standalone Solar Photovoltaic System. Electronics, 7(11), 327. https://doi.org/10.3390/electronics7110327