Article

Empirical Modeling of Radiowave Angular Power Distributions in Different Propagation Environments at 60 GHz for 5G

by
Manuel García Sánchez
*,
Edgar Lemos Cid
and
Ana Vázquez Alejos
Signal Theory and Communications Department, University of Vigo, 36310 Vigo, Spain
*
Author to whom correspondence should be addressed.
Electronics 2018, 7(12), 365; https://doi.org/10.3390/electronics7120365
Submission received: 18 October 2018 / Revised: 17 November 2018 / Accepted: 26 November 2018 / Published: 1 December 2018
(This article belongs to the Section Microwave and Wireless Communications)

Abstract

:
The design of 5th generation (5G) wireless systems requires the description and modeling of the radio channel where communication will take place. As 5G will employ massive multiple input–multiple output (MIMO) to cope with the high data rates, the channel models should include the description of radiowave angular power distribution (APD) around the terminals. In this paper, we present the results of a measurement campaign of these APDs in four different environments and provide their main parameters. This will facilitate the incorporation of these results into current 5G channel models. We also analyze the maximum received power improvement that could be achieved by combining the power reaching the terminal from different angles and provide the improvement values for the four scenarios. The research was conducted at 60 GHz, one of the frequency bands proposed for 5G systems.

1. Introduction

Despite 5th generation (5G) wireless communications are not fully standardized yet, the industry has already identified a set of eight requirements these systems should meet [1,2]:
  • 1–10 Gbps connections to end points in the field
  • 1 ms end-to-end round-trip delay (latency)
  • 1000x bandwidth per unit area
  • 10–100x connected devices
  • (Perception of) 99.999% availability
  • (Perception of) 100% coverage
  • 90% reduction in network energy usage
  • Up to ten years of battery life for low power, machine-type devices
These requirements come from different applications and services that would not need all these capabilities simultaneously. For example, car safety applications may require low latency time and 100% coverage, but not a reduction of network energy usage, while network would require low power consumption but may not need high data rate connections or low latency.
Several frequency bands are being considered for 5G communications [3]. While some frequency bands are being licensed below 6 GHz (700 MHz, 3.4 GHz), full 5G features will require larger bandwidths only available at millimeter wave frequencies. Technologies are being developed both at licensed (26/28 GHz, 38/39 GHz) and unlicensed (60 GHz) frequency bands. Among these candidate bands, the one where a larger bandwidth is available is 60 GHz. This is the frequency band considered in our study.
The high propagation losses at these frequencies, compared to frequencies below 6 GHz, will reduce the received power, while the large bandwidths used will yield high noise levels. In order to improve the signal-to-noise ratio (SNR) at the receiver (Rx) and to enable the required high data rate transmission, the use of directional steerable antennas has been proposed [4,5,6]. Directional patterns will also mitigate the effect of inter-symbol interference, improve spatial selectivity, and, hence, increase the spatial frequency reuse. Massive multiple-input–multiple-output (MIMO) techniques [7,8] will have to be implemented in 5G systems to deal with the data traffic growth. Base stations are expected to be equipped with a very high number (even hundreds) of antennas [9] that will serve simultaneously several terminals, which will be also equipped with a number of antennas.
The evaluation of these systems will not be possible using classical techniques because of the high number of antennas to be connected or because the integrated antenna ports would not be accessible [10]. New over-the-air (OTA) testing techniques have been proposed to overcome this problem. These OTA techniques require detailed channel models that should describe the angular power distribution (APD) of the radiowave energy around the base and terminal antennas [11,12,13]. In this way, the improvement of the radio link performance due to combining the energy received through different propagation paths can be assessed. This has raised the interest on measuring, analyzing, and modelling the APDs under different propagation conditions.
Propagation studies at 60 GHz show that, in most situations, several propagation paths, with different propagation delays, attenuation, angles of departure (AODs), and angles of arrival (AOAs), may exist [14,15,16,17,18,19,20,21,22]. Early 60 GHz propagation studies [14,15,16,17,18] already used directional antenna steering measurements to resolve propagation paths and to gain some insight on the main scattering mechanisms. It was soon clear [14] that directional antenna steering could partially compensate the high propagation losses, providing a considerable link improvement. This raised the interest on the knowledge of the radio channel APDs. At first, most of the studies concentrated on indoor radio channels and azimuth (horizontal) APDs [14,16,17,18]. It was with the proposal of the millimeter wave band for 5G communications [4] that the characterization of APDs in outdoor urban radio channels at 60 GHz attracted the attention of researchers [19,20,21,22].
As 5G communications will work using a wide set of frequency ranges, on almost every possible scenario, and using a variety of new techniques such as massive-MIMO, a considerable number of channel models have been developed. Recent surveys on 5G channel models can be found in [23,24]. Channel models are classified as deterministic, map-based (like METIS [25,26]), and stochastic. These can be further classified as geometry-based stochastic models, like COST2100 [27], WINNER II [28], 3GPP [29], or non-geometry-based stochastic models, such as Saleh–Valenzuela model [30]. However, this is not a clear-cut division, as some models incorporate both deterministic and stochastic characteristics.
If we take a closer look at models that consider millimeter wave frequencies, we find that most of them describe an angular spread and clustering that add to the spread and clustering in the time domain. The modified Saleh–Valenzuela model [31] considers angular clustering where the AOAs of rays within an angular cluster are described using a Laplacian distribution. The 3GPP model [29] describes the azimuthal APD as wrapped Gaussian, while the zenithal spread is described using a Laplacian distribution. In the model developed by T.S. Rappaport [32], the azimuth APD is considered to have a normal distribution, while the elevation AOA is Laplacian. This model introduces the concept of spatial lobe (SL) that will be used later in this paper. Some other distributions may also be considered in describing the APDs [33].
Beam-switching and beamforming techniques were first proposed in [5,34] as a solution to compensate the high propagation losses, which include free space propagation losses and human body link blockage, in the 60 GHz frequency band. As these techniques try to combine the angular spread energy, the combining improvement depends on the scattering of the radio channel [35]. Coherent and non-coherent beam-combining techniques are compared in recent works [36,37]. Results show that beam-combining improvement increases with the number of beams combined, and this improvement is larger for coherent than for non-coherent combining. Improvements up to 11.2 dB and 24.9 dB are reported at 73 GHz and 28 GHz, respectively. Later publications even present some millimeter-wave beamforming prototypes [6].
These studies mainly focus on urban environments, where a dense use of 5G communication systems is expected. However, as 5G communication systems would provide a global coverage in a large variety of scenarios, other environments should be considered. In this paper, in addition to the traditional urban environment, we extended the study to three other propagation scenarios: open, wooded, and suburban areas, where multipath conditions may differ. We obtained the APDs and quantified the angular spread for the four environments. This will help to incorporate these propagation environments to millimeter-wave 5G channel models. We also calculated the maximum improvement that could be achieved by combining the different angular contributions and analyzed its dependency on the number of combined lobes. We provide the values for the combining improvement in the four environments.
The rest of the paper is organized as follows: In Section 2, we describe the measurement system and measurement environments. We used a wideband sounder with angular scanning capabilities at the mobile end to be able to obtain the APDs in four different types of macrocellular scenarios. We present the results in Section 3 and discuss the APDs modelling and the improvement by angular combining in Section 4. Finally, in Section 5 we summarize the main results.

2. Experimental Set-Up

2.1. Measurement System

We used a sweep time delay cross-correlation channel sounder. This sounder consists of a signal transmitter (Tx) and a signal receiver (Rx). The sounder transmitted an m = 213 − 1 bit long pseudorandom binary sequence (PRBS) at a chip rate of fc = 500 Mbps. This sequence was used to phase-modulate a frequency carrier of 60.48 GHz fed to a standard gain horn antenna. The signal was received using a similar antenna, down-converted to an intermediate frequency (IF) of 500 MHz, sampled at a rate of fs = 5 Gs/s and stored in a computer for offline analysis. This offline processing consisted of down-converting the signal from IF to baseband and then correlating it with an exact replica of the transmitted PRBS sequence to obtain the time-varying radio channel impulse response (CIR).
Pictures of the Tx and Rx ends of the sounder are given in Figure 1, and the details of the sounder characteristics in Table 1 and in references [38,39].

2.2. Measurement Scenarios

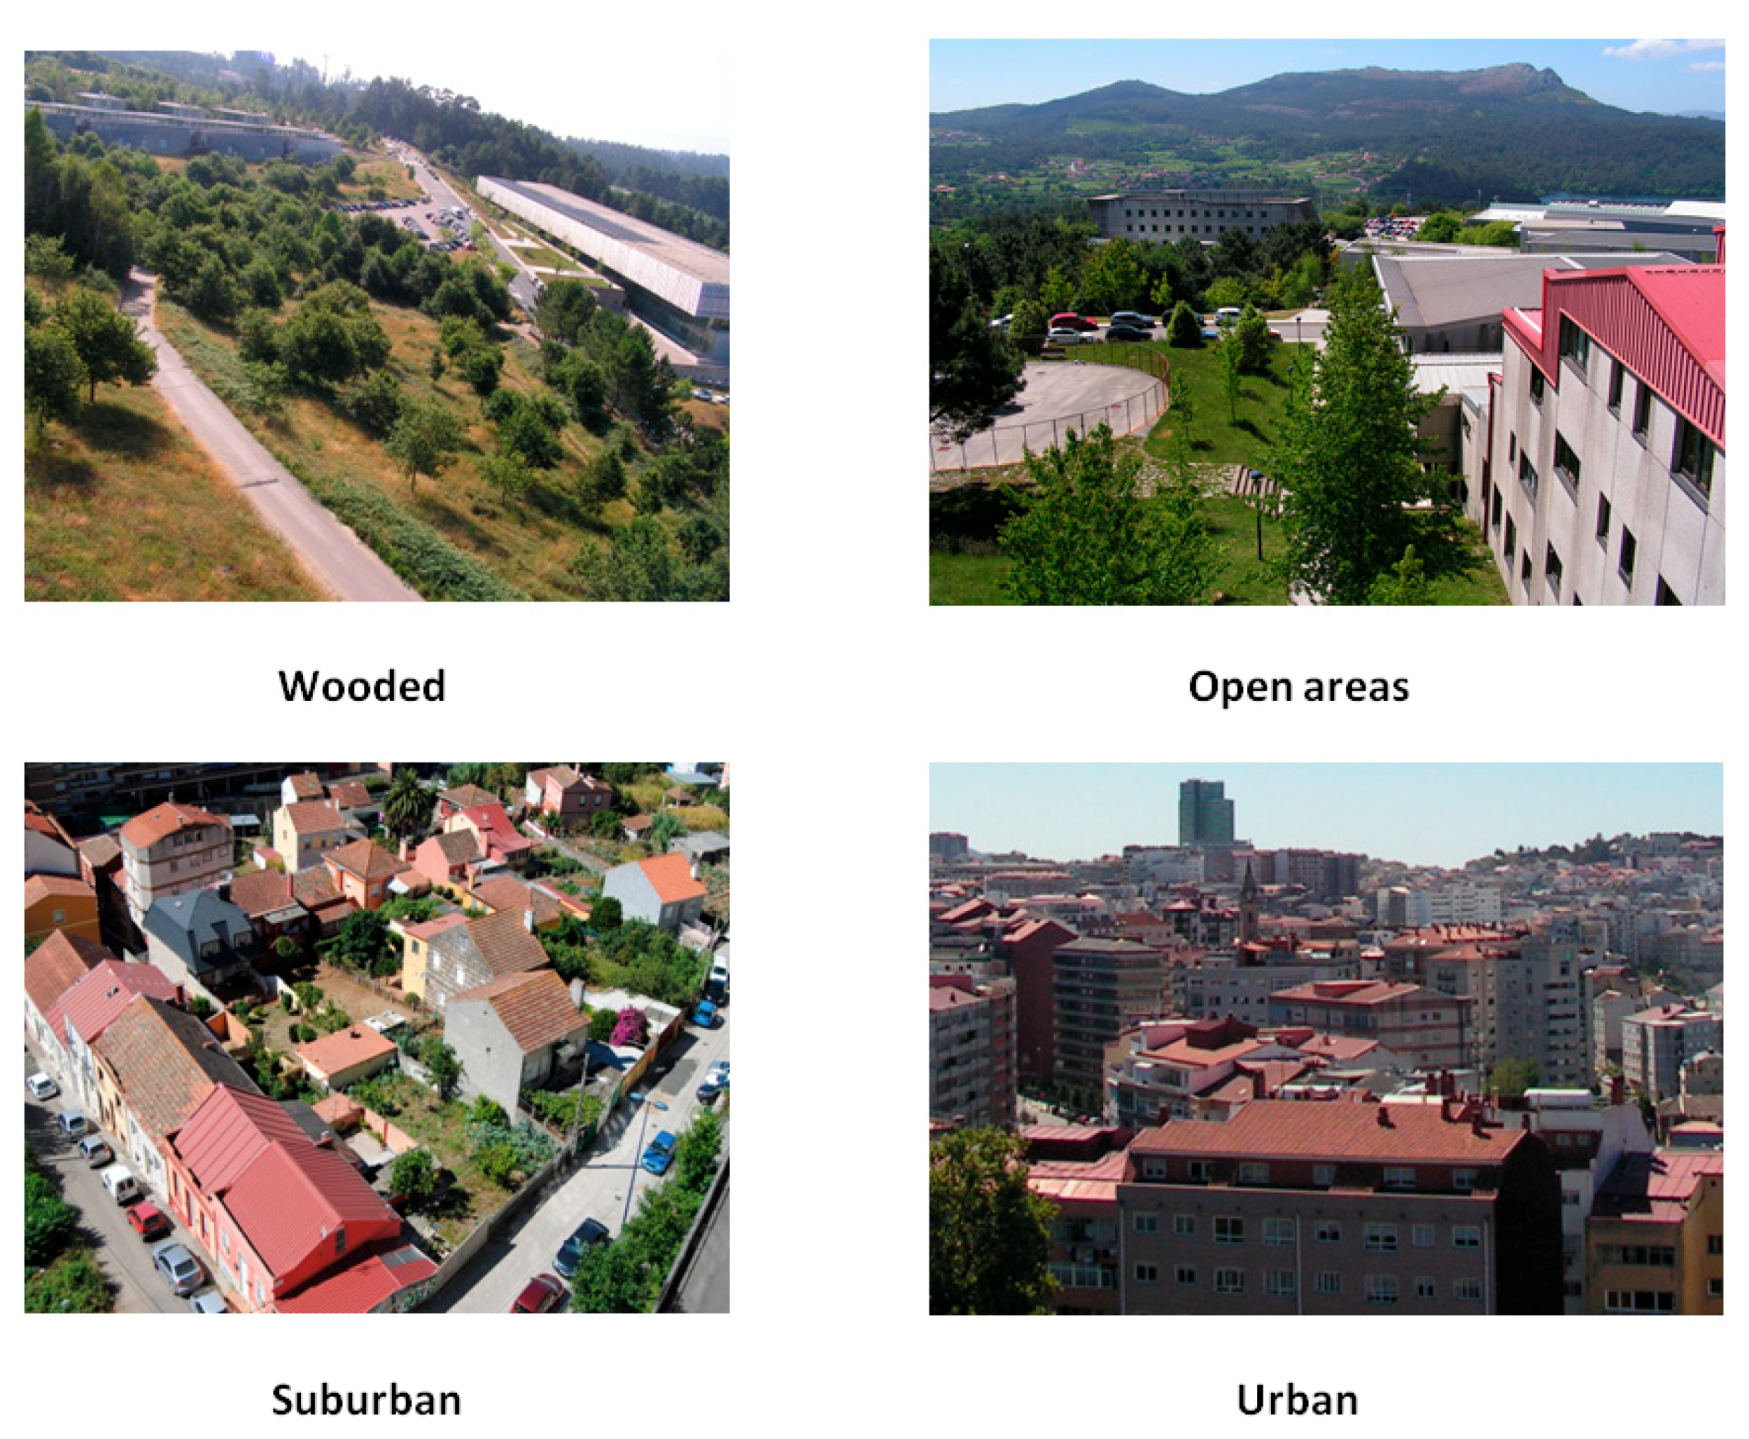
We carried out measurements in four types of macrocell environments: open, wooded, suburban, and urban areas (Figure 2). These zones could be typical environments for 5G cellular deployments. The open areas selected were located on the Campus of the University of Vigo. In the wooded environment we could find different types of trees between the Tx and Rx that could cause minimal or strong signal shadowing. The wooded environment could show the effects of the radio link blockage by the vegetation. The suburban environment consisted of typical streets and roads with two- to three-story houses and buildings that lined the streets. The urban scenario was characterized by the presence of street canyons with buildings of 5–10 floors.
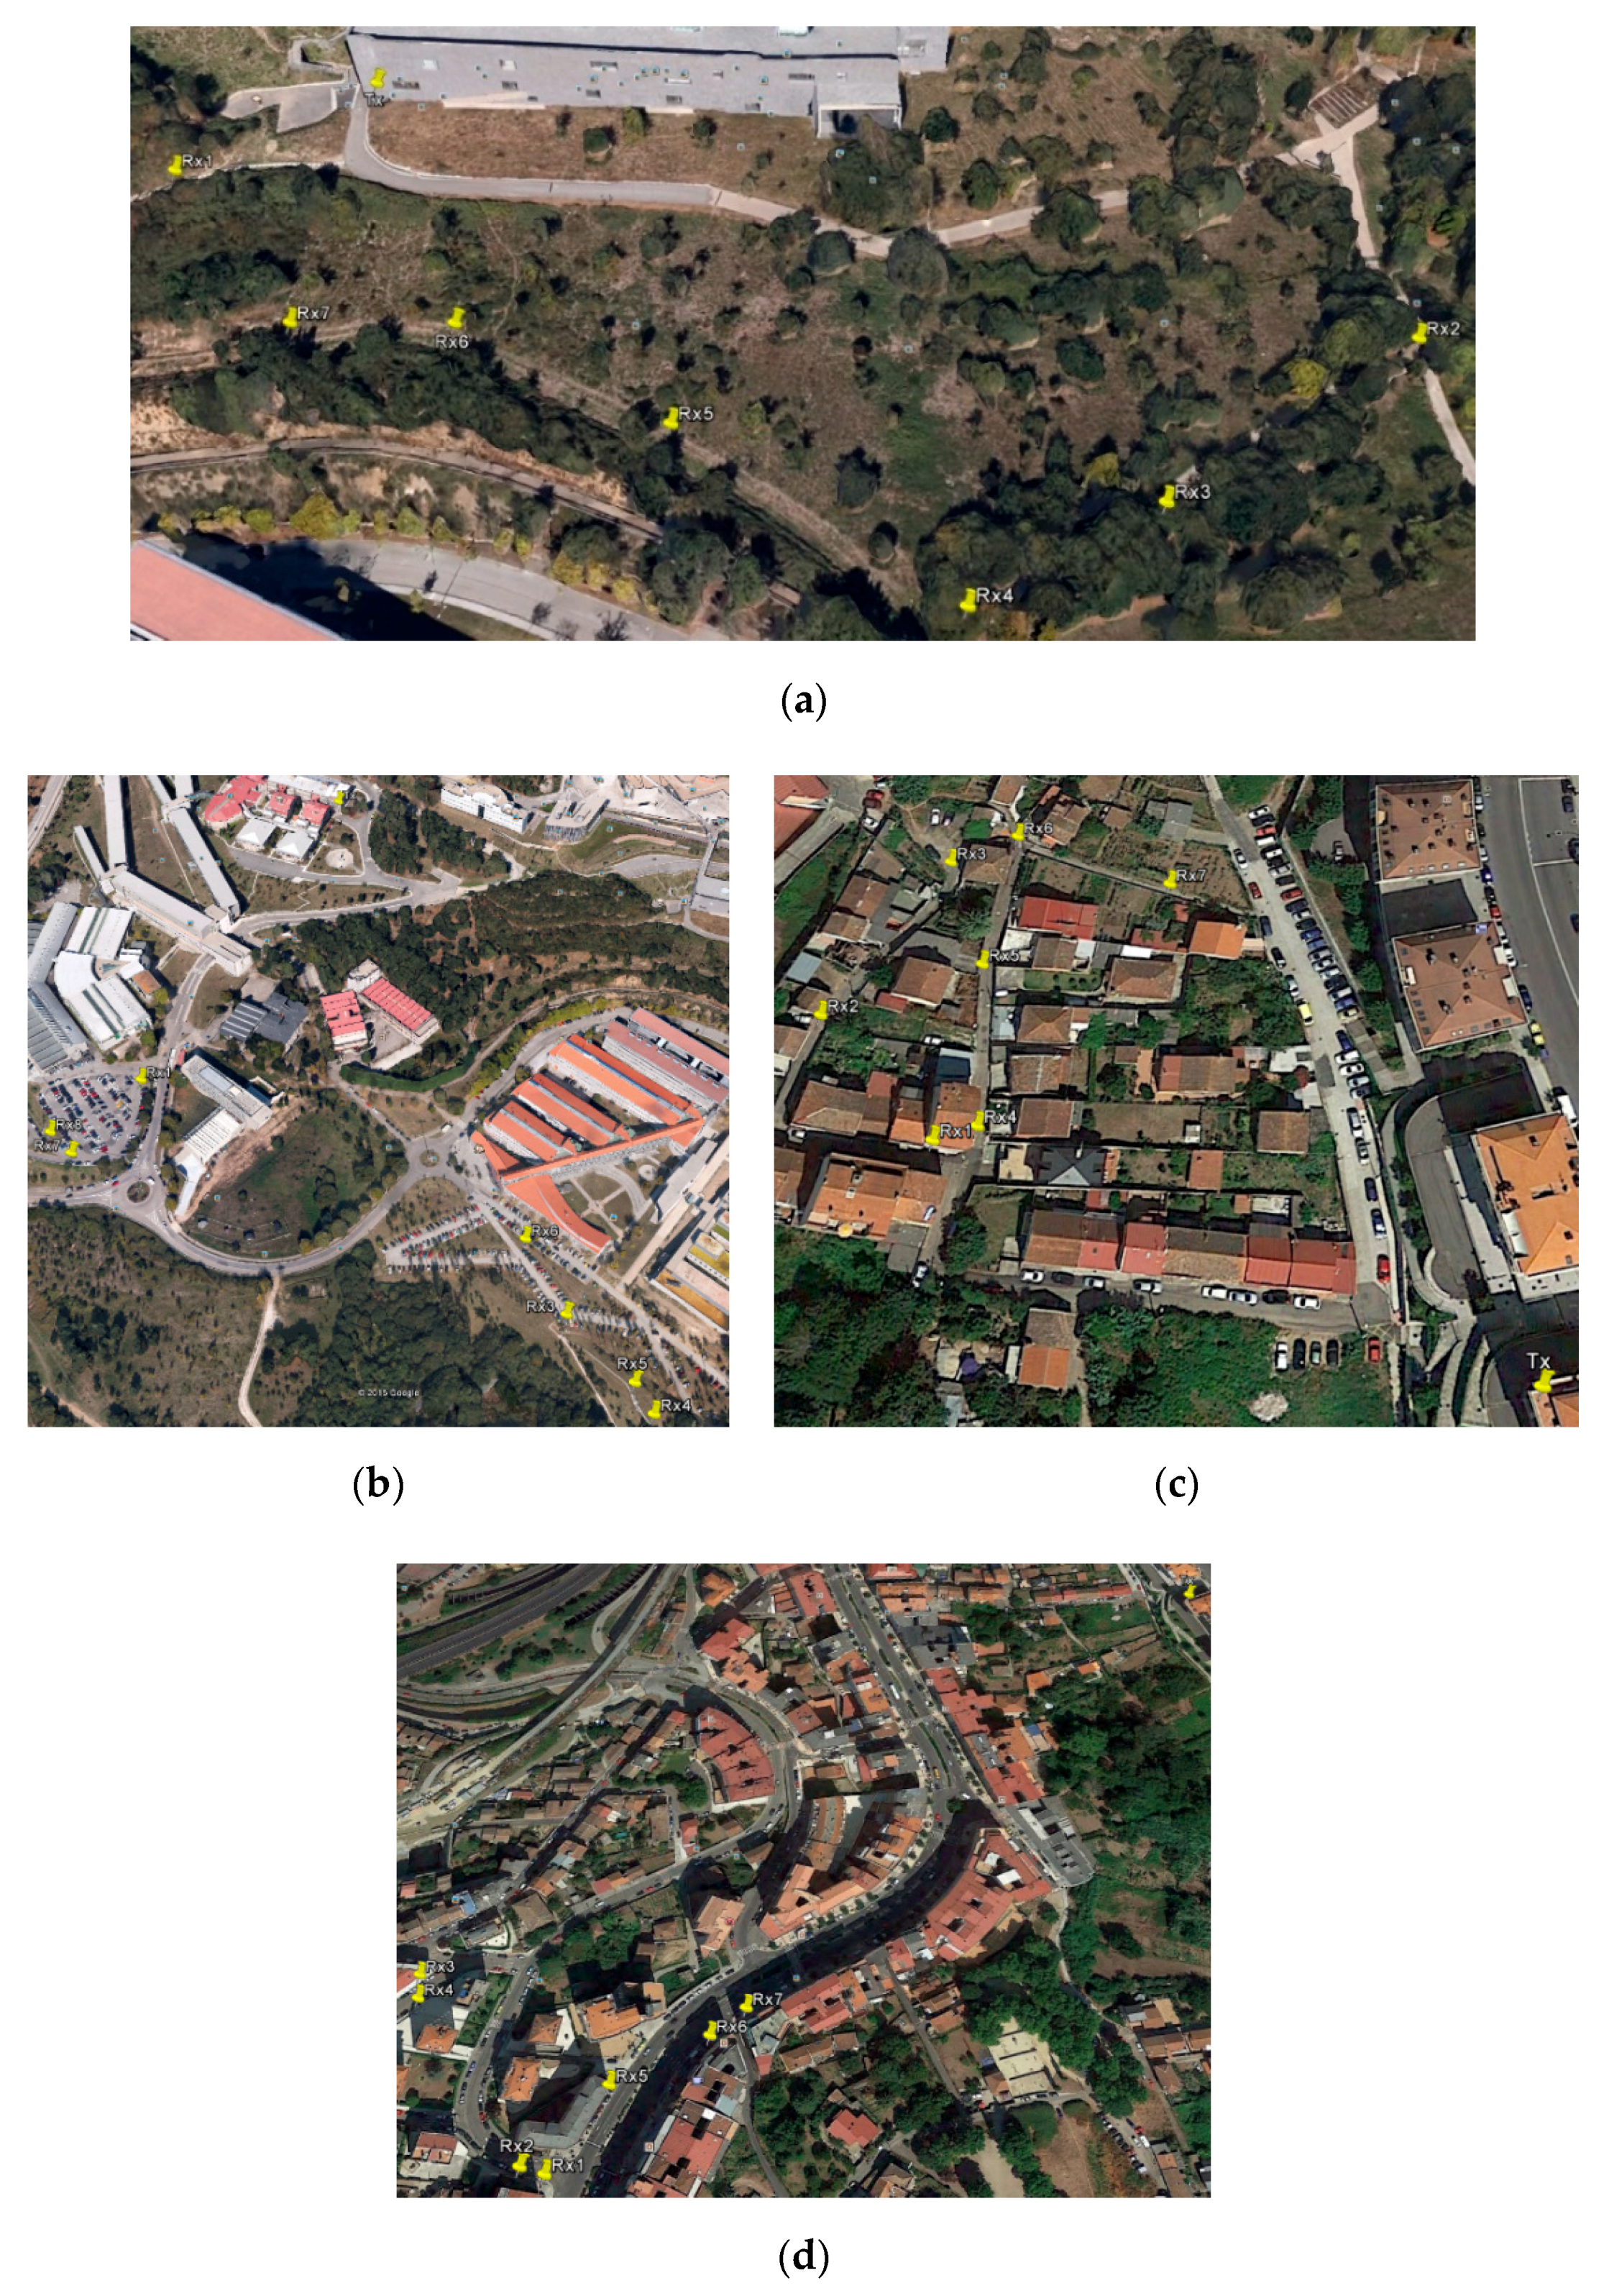
During the measurement, we kept the Rx end at a fixed position over the environment obstacles while we moved the Tx end to several locations. These are given in Figure 3. For the open environment, the line-of-sight (LOS) condition was met at all measurement locations, while, for the other three environments, we had both LOS and non-line-of-sight (NLOS) locations.
A schematic illustration of the measurement set-up if given in Figure 4, and the distance details are given in Table 2.
At each location of the mobile end, we carried out an angular scanning by placing the antenna on a pan-&-tilt system. We scanned 360° in azimuth with steps of 15° and five elevation AOAs relative to the horizon: 8°, 24°, 40°, 64°, and 72°.
For each Tx position, elevation, and azimuth AOA, three of these CIRs were averaged to estimate the Power Delay Profile (PDP).

3. Results: APDs

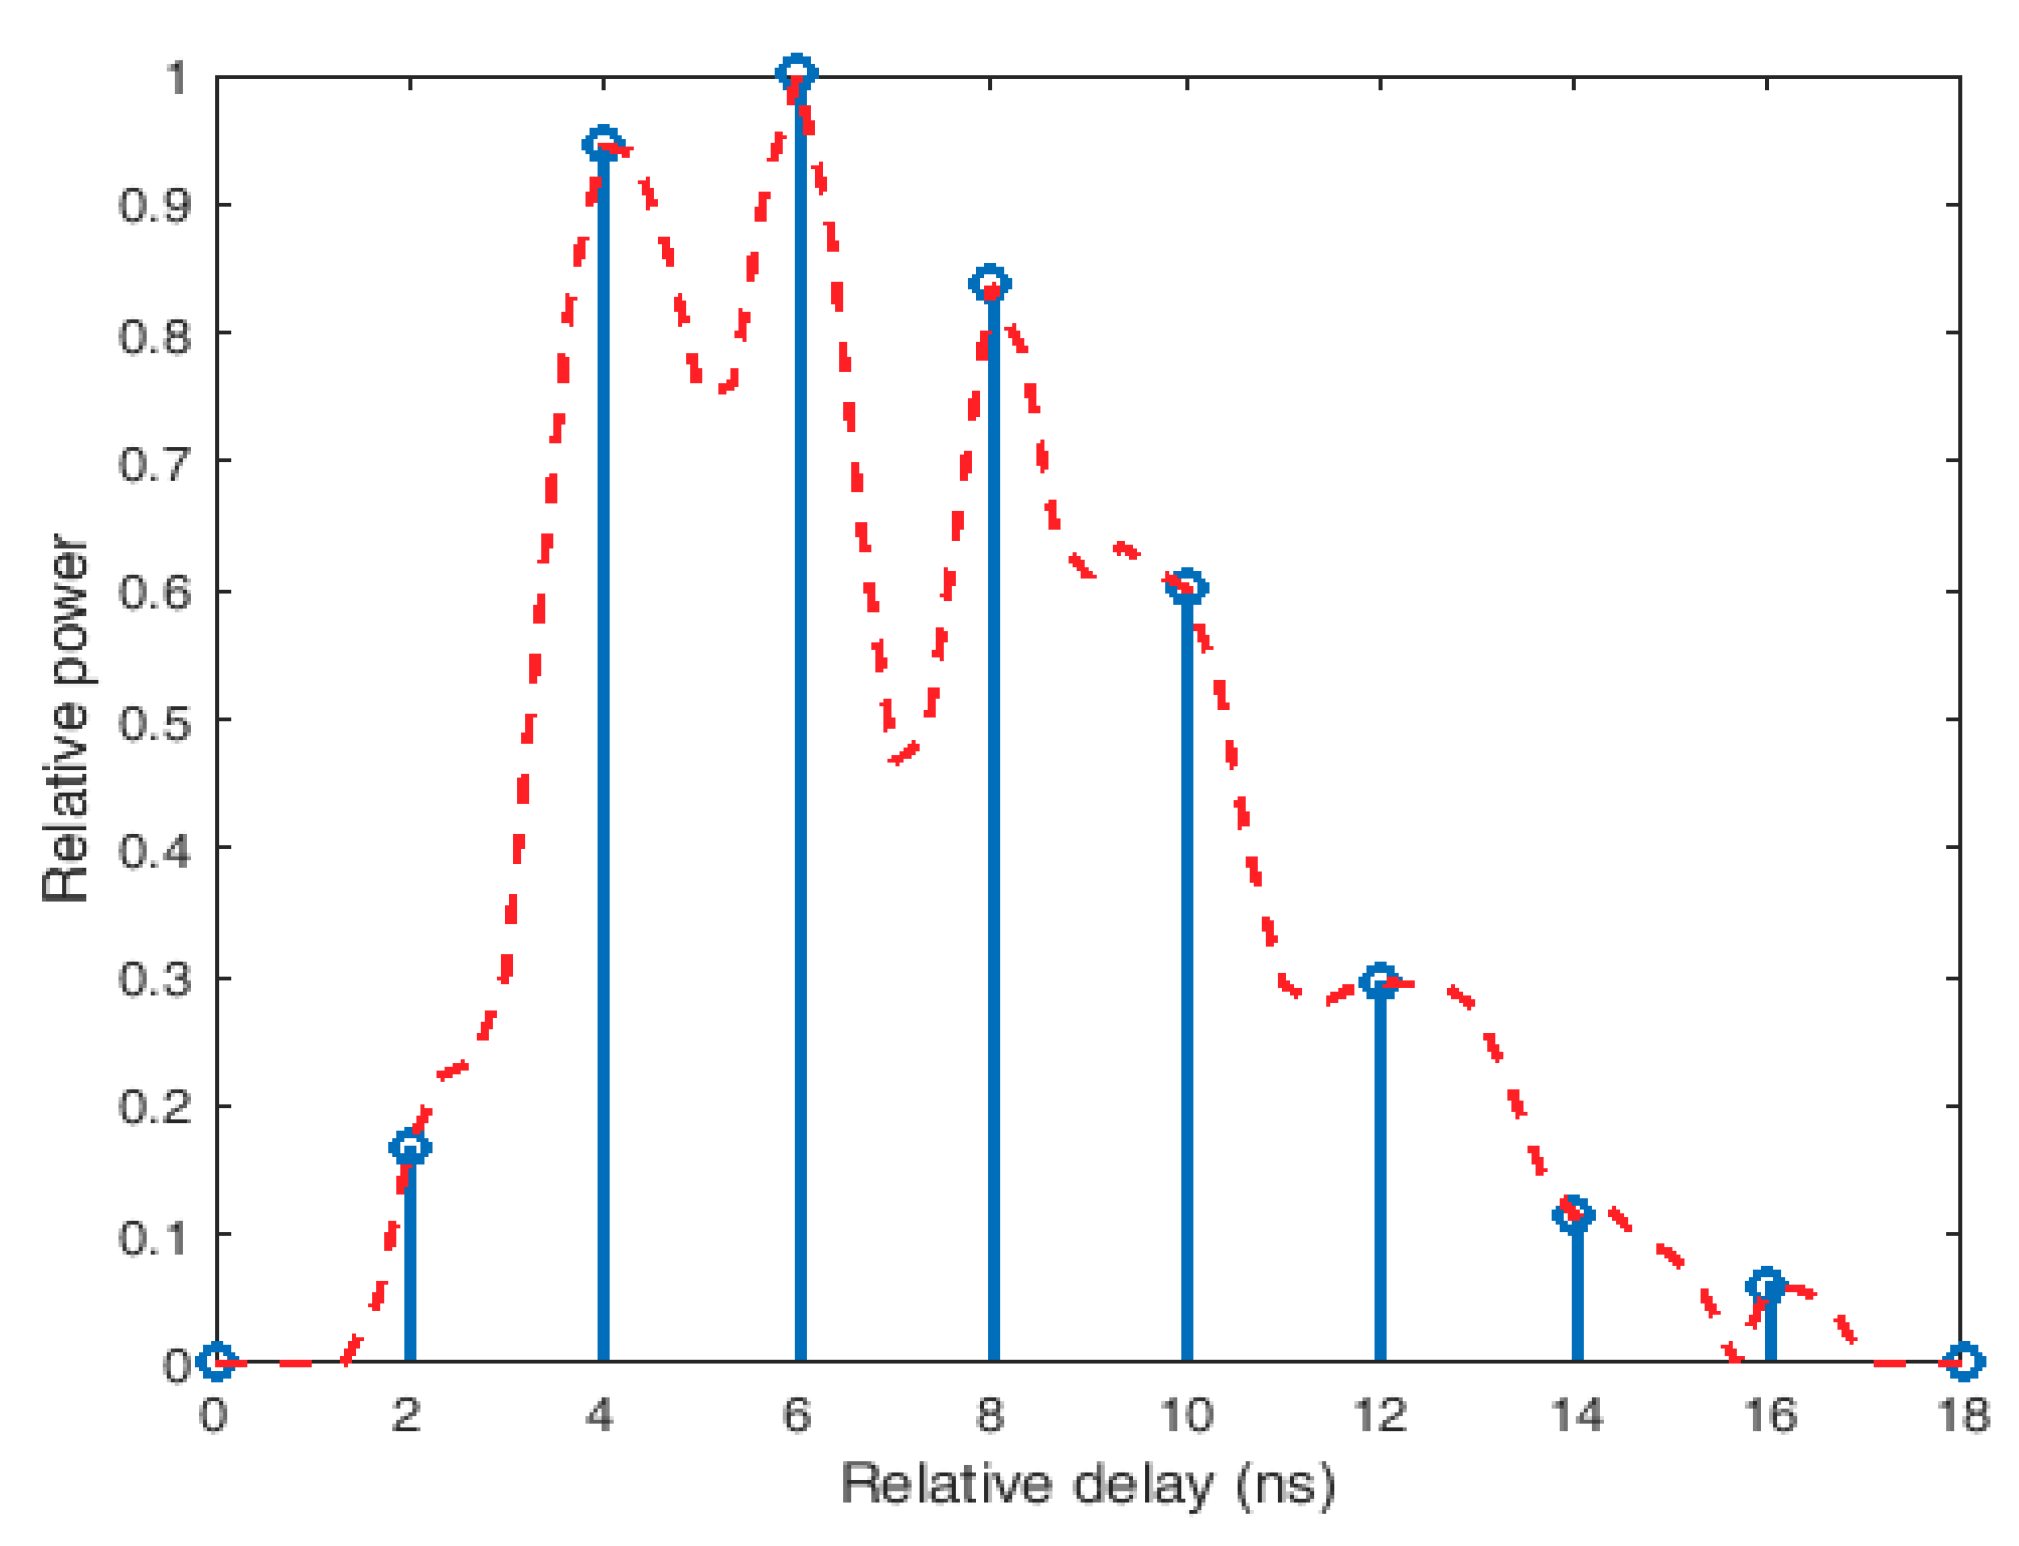
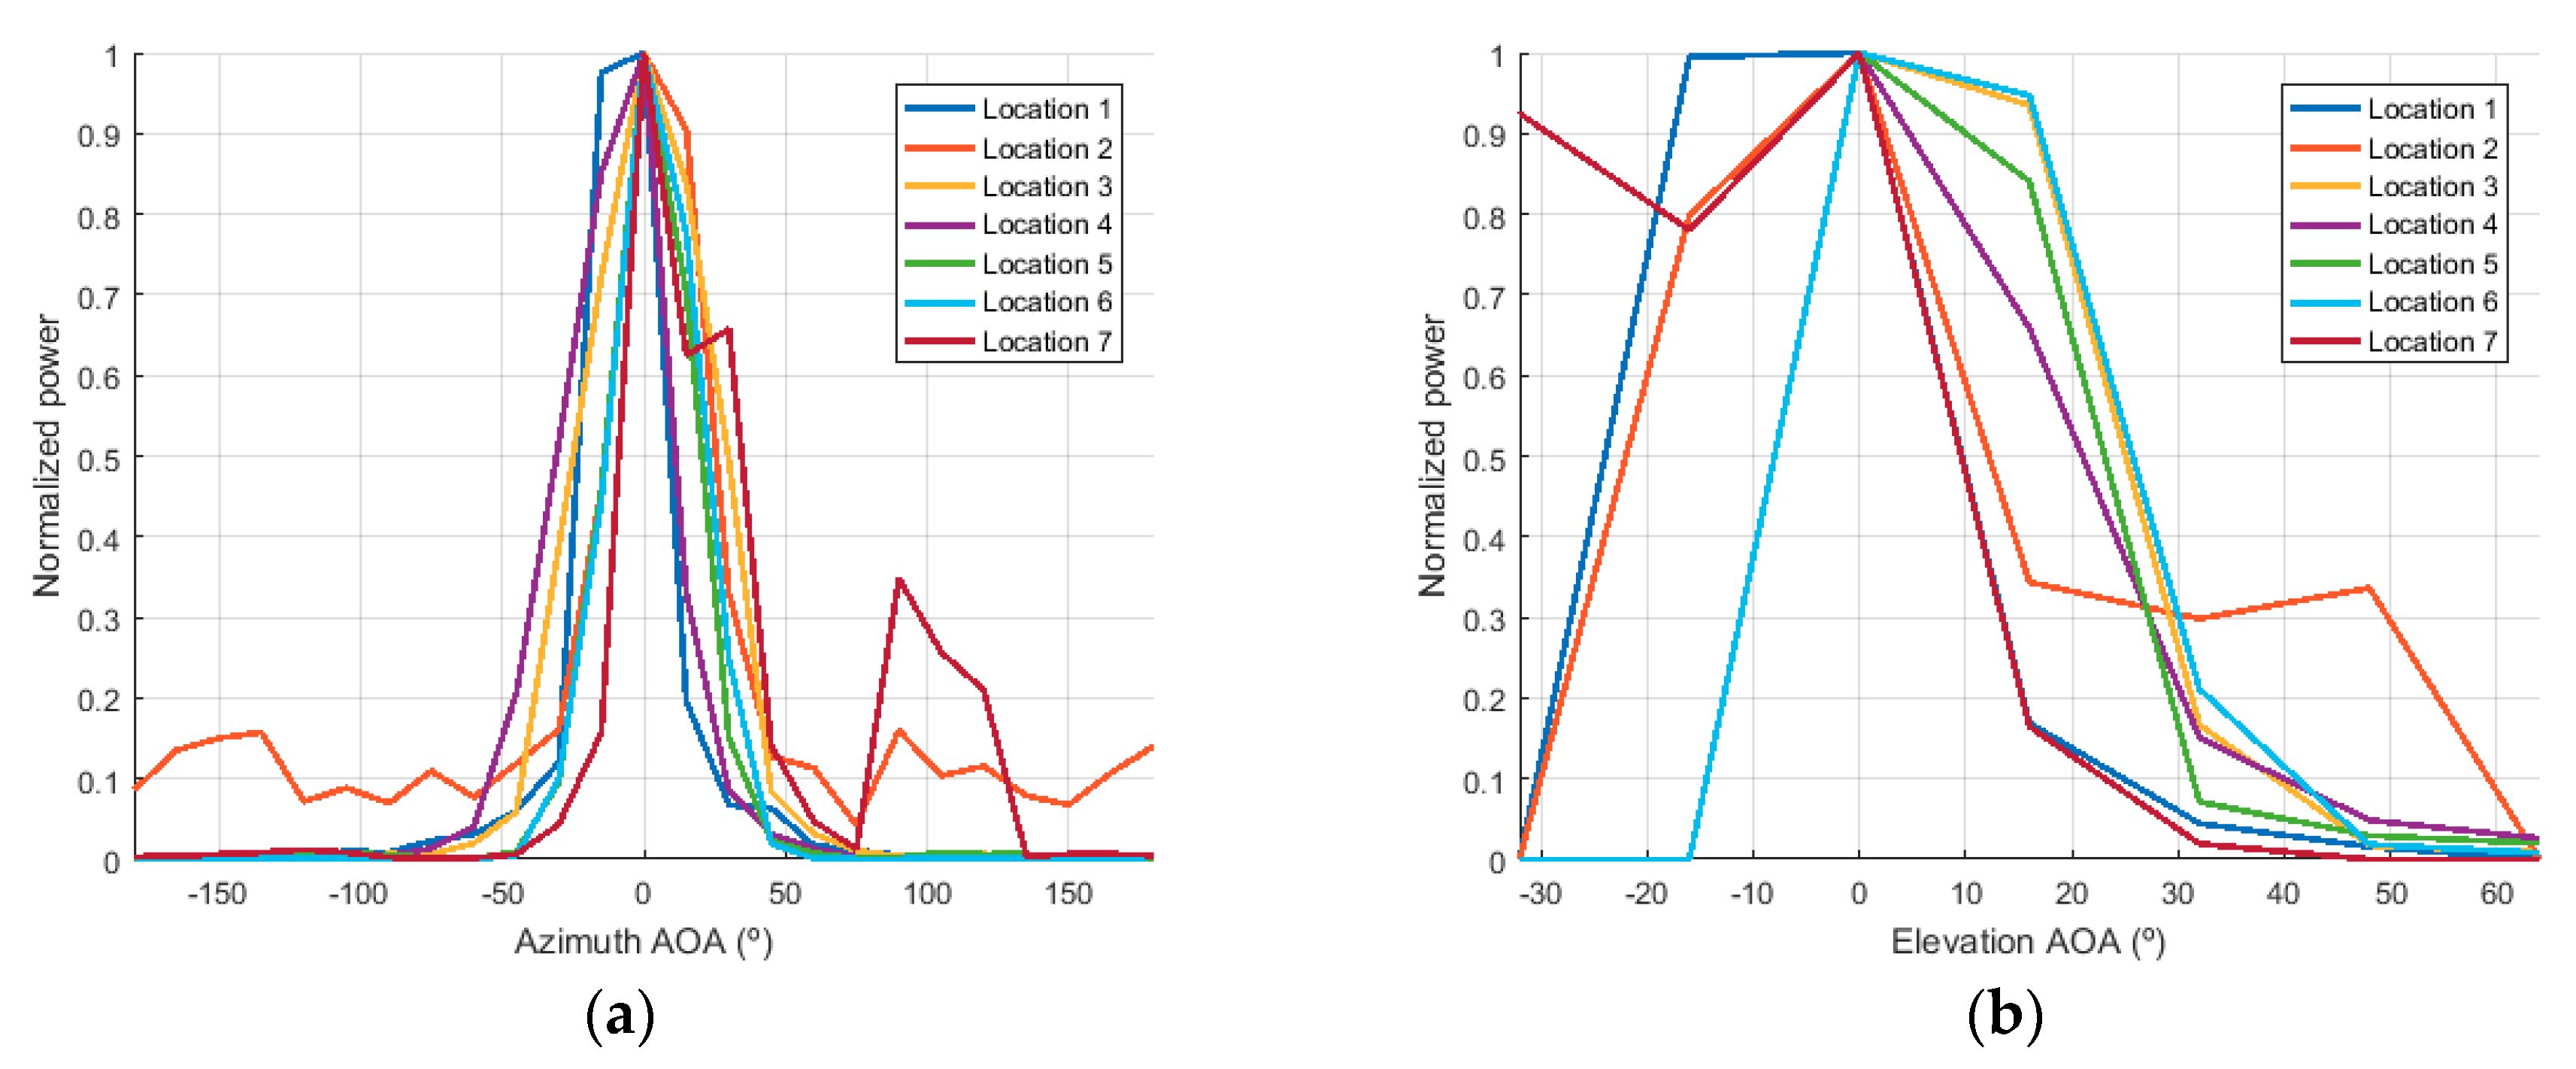
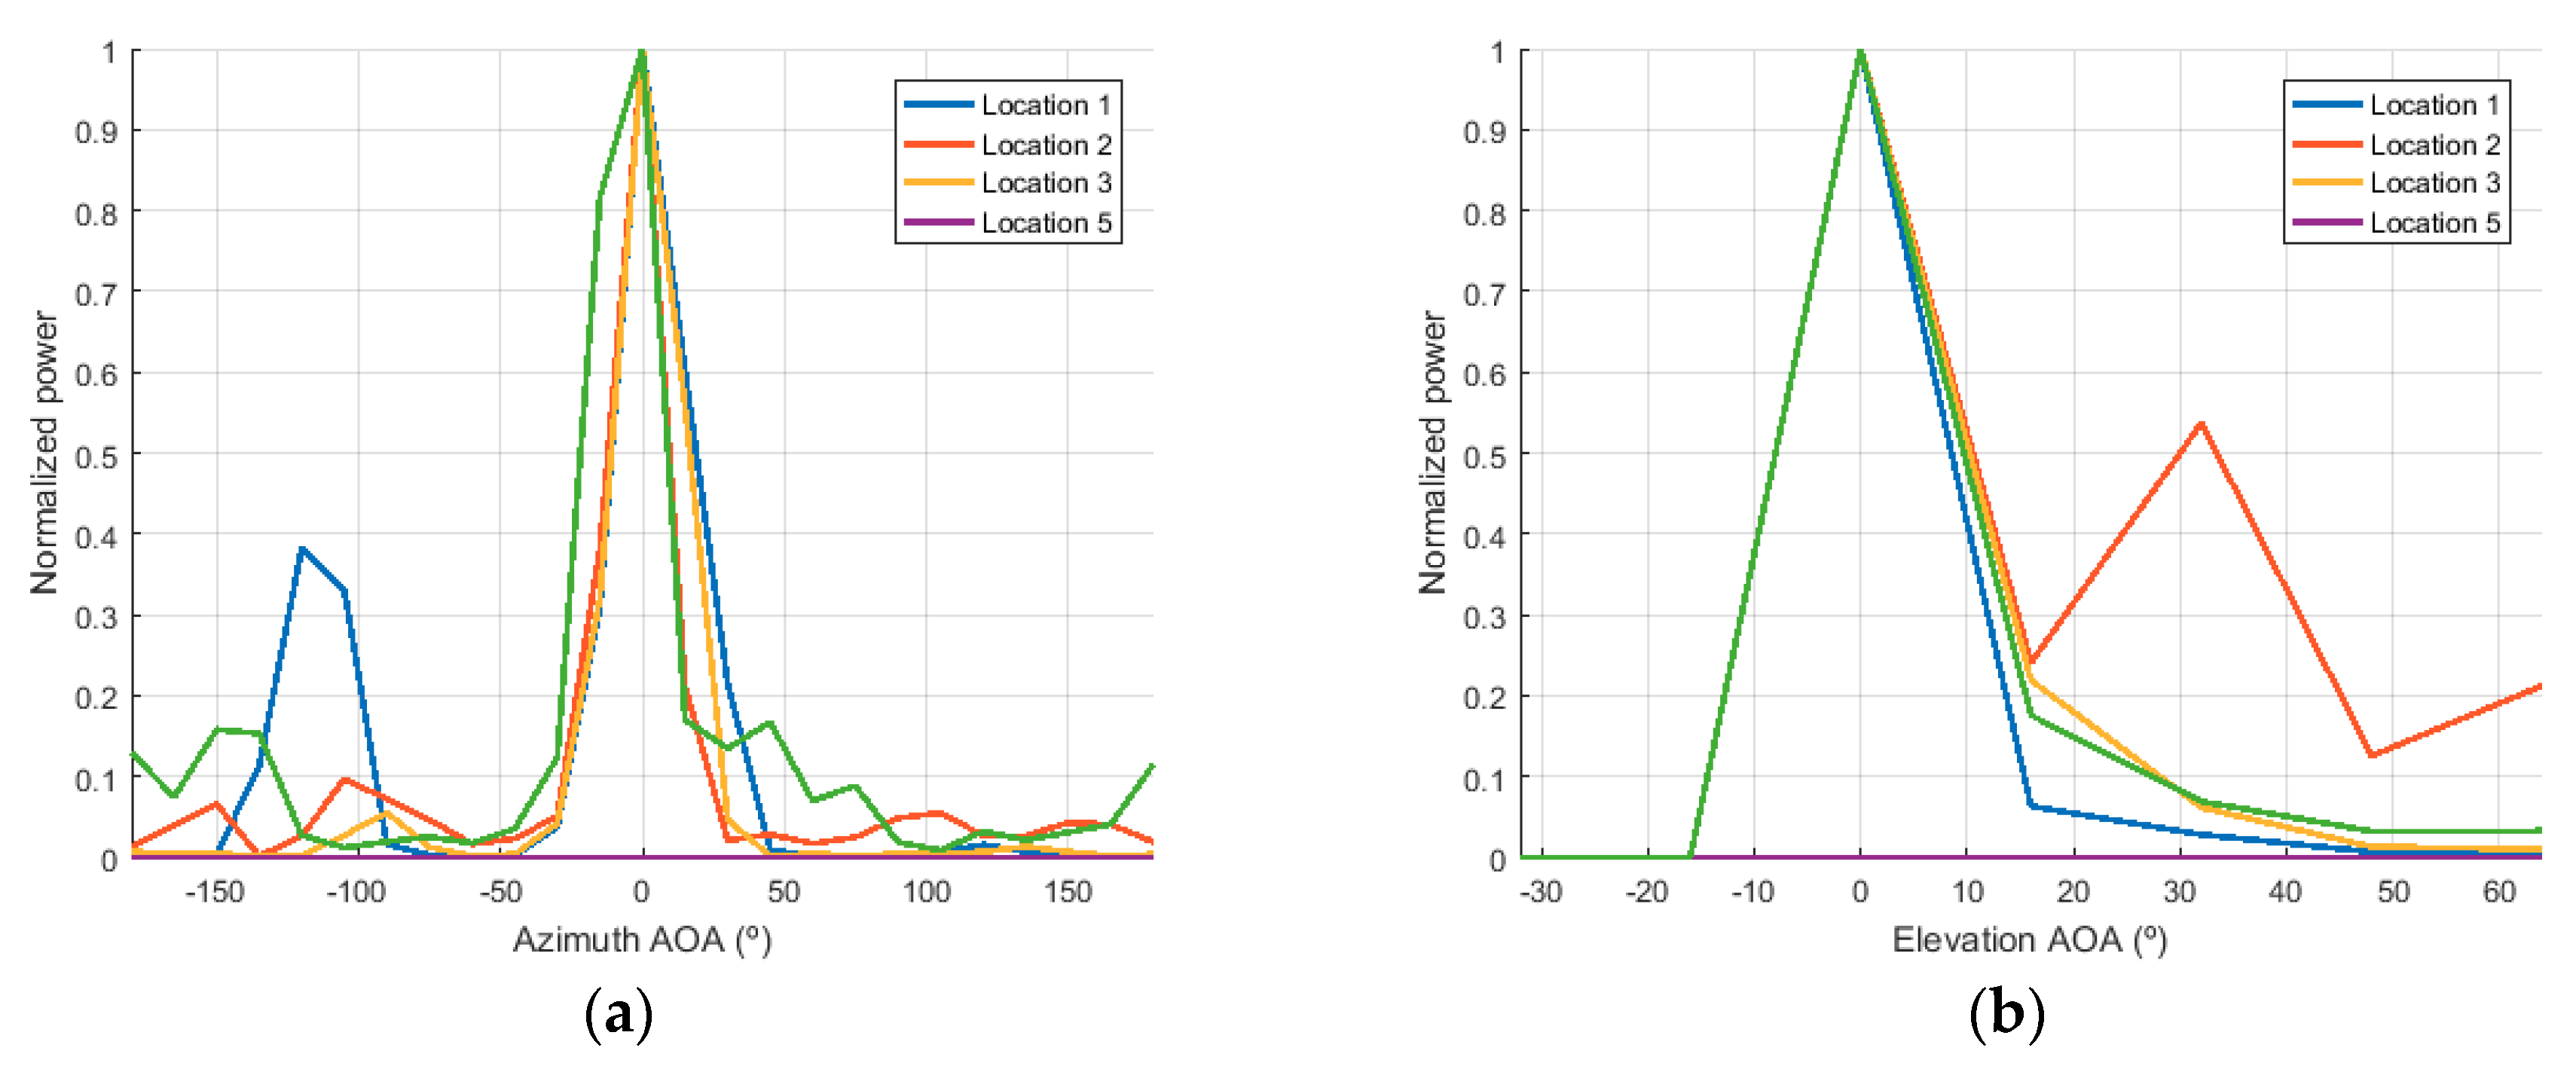
We obtained the APD at each location of each environment by, first, averaging the measured CIR for each antenna pointing direction to obtain the PDP and, then, by incoherently integrating the PDP over the delay. As an example, we show in dashed red line in Figure 5 the result of averaging the measured CIRs. As our sampling interval was shorter than the sounder resolution, we had to down-sample to get the PDP (Figure 5, blue solid line). We also show in Figure 6, Figure 7, Figure 8 and Figure 9 examples of the azimuth and elevation APDs at several locations from the four environments. The higher received power level corresponded to the Tx antenna pointed towards the Rx (0°).
In Figure 6, Figure 7, Figure 8 and Figure 9, we can clearly see that the power is clustered in the angular domain in the form of SLs, defined in reference [40] as the contiguous spread of energy arriving in the azimuth and elevation directions. The number of SLs was low. For most cases, there was a single SL both in the azimuth and in the elevation planes. In Table 3, we summarize the angular results of the four environments, where we just considered signals up to 10 dB below the maximum peak power. We first give the mean, μ, and standard deviation, σ, of the number of SLs found in each environment. For the open environment, the total number of SLs was just 1 in all the cases. The mean number of SLs increased from 1 to 1.4 and 1.71 in the suburban, urban, and wooded environments, respectively. This indicates that the number of different propagation paths between Tx and Rx increased as the environment complexity increased, with the presence of more obstacles where radiowaves could be scattered. The standard deviation also exhibited this trend, as it increased with the complexity of the environment. The mean number of SLs in the urban environment was similar to the 1.6 value reported in reference [32] for NLOS at 28 GHz, but less than the 2.5 value reported at 73 GHz.

4. Discussion

4.1. APD Model

As stated in the introduction section, 5G channel models should describe the APDs. There is a number of functions that the different models use to shape the APDs. These include the Laplacian, Gaussian, von Misses, and logistics functions [33], as the shape of the SLs has been modeled using different functions. In reference [22], we found that in an urban microcell at 60 GHz, there were several SLs present in most of the measured APDs, so we proposed a Gaussian mixture model for them. However, for almost all the locations of the four macrocellular environments that we studied in this paper, there was a single SL in the APD. A (modified) Gaussian model should be adequate to describe the azimuthal APDs, while a Laplacian model may shape the elevation APD. The rms lobe angular spread (LAS), that is the standard deviation of the APD function, was calculated for all locations in all the environments and its mean, μ, and standard deviation, σ, are given in Table 3. This will help to incorporate these four macrocellular models to current 5G channel models. We also give in this table the lobe angular spread between nulls, defined in reference [40] as the angular span of an SL above a given threshold.
The azimuth rms LAS was slightly over 11° for all the environments, except for the wooded one, where it increased to 14.6°. The elevation rms LAS values were lower for the open environment and higher for the wooded one. The rms LAS value found in the urban environment, corresponding to 9.7°, was between the 7.8° and 10° reported by other studies [32,40], from measurements at 28 GHz in Manhattan. It is not far from the values proposed by the Winner II model [28], which are between 11° and 15° for channels at 60 GHz. The values found for 73 GHz, i.e., 6° in reference [32], are smaller.

4.2. Improvement by Angular Combining

Because of the very high propagation losses at millimeter-wave frequencies, angular combining techniques, as far as they may help to enhance link quality, are quite relevant for 5G communications at 60 GHz. Using the measurement results presented in this paper, we could estimate the maximum improvement that could be reached by an ideal combining system. Signals received through each propagation path may be combined to improve the total received signal power. Two different combining methods have been studied in the literature: coherent combining and non-coherent combining [24,36,41]. For coherent combining, the total received power would be:
P C C = ( i = 1 N r P i ) 2
where Nr is the number of beams used for combining, and Pi is the received power on each beam. For non-coherent combining:
P N C C = i = 1 N r P i
Without loss of generality, we can consider that P1 corresponds to the power received through the beam with maximum power and define the combining improvement for the coherent and non-coherent cases as:
g C C = ( 1 + i = 2 N r P i P 1 ) 2
g N C C = 1 + i = 2 N r P i P 1
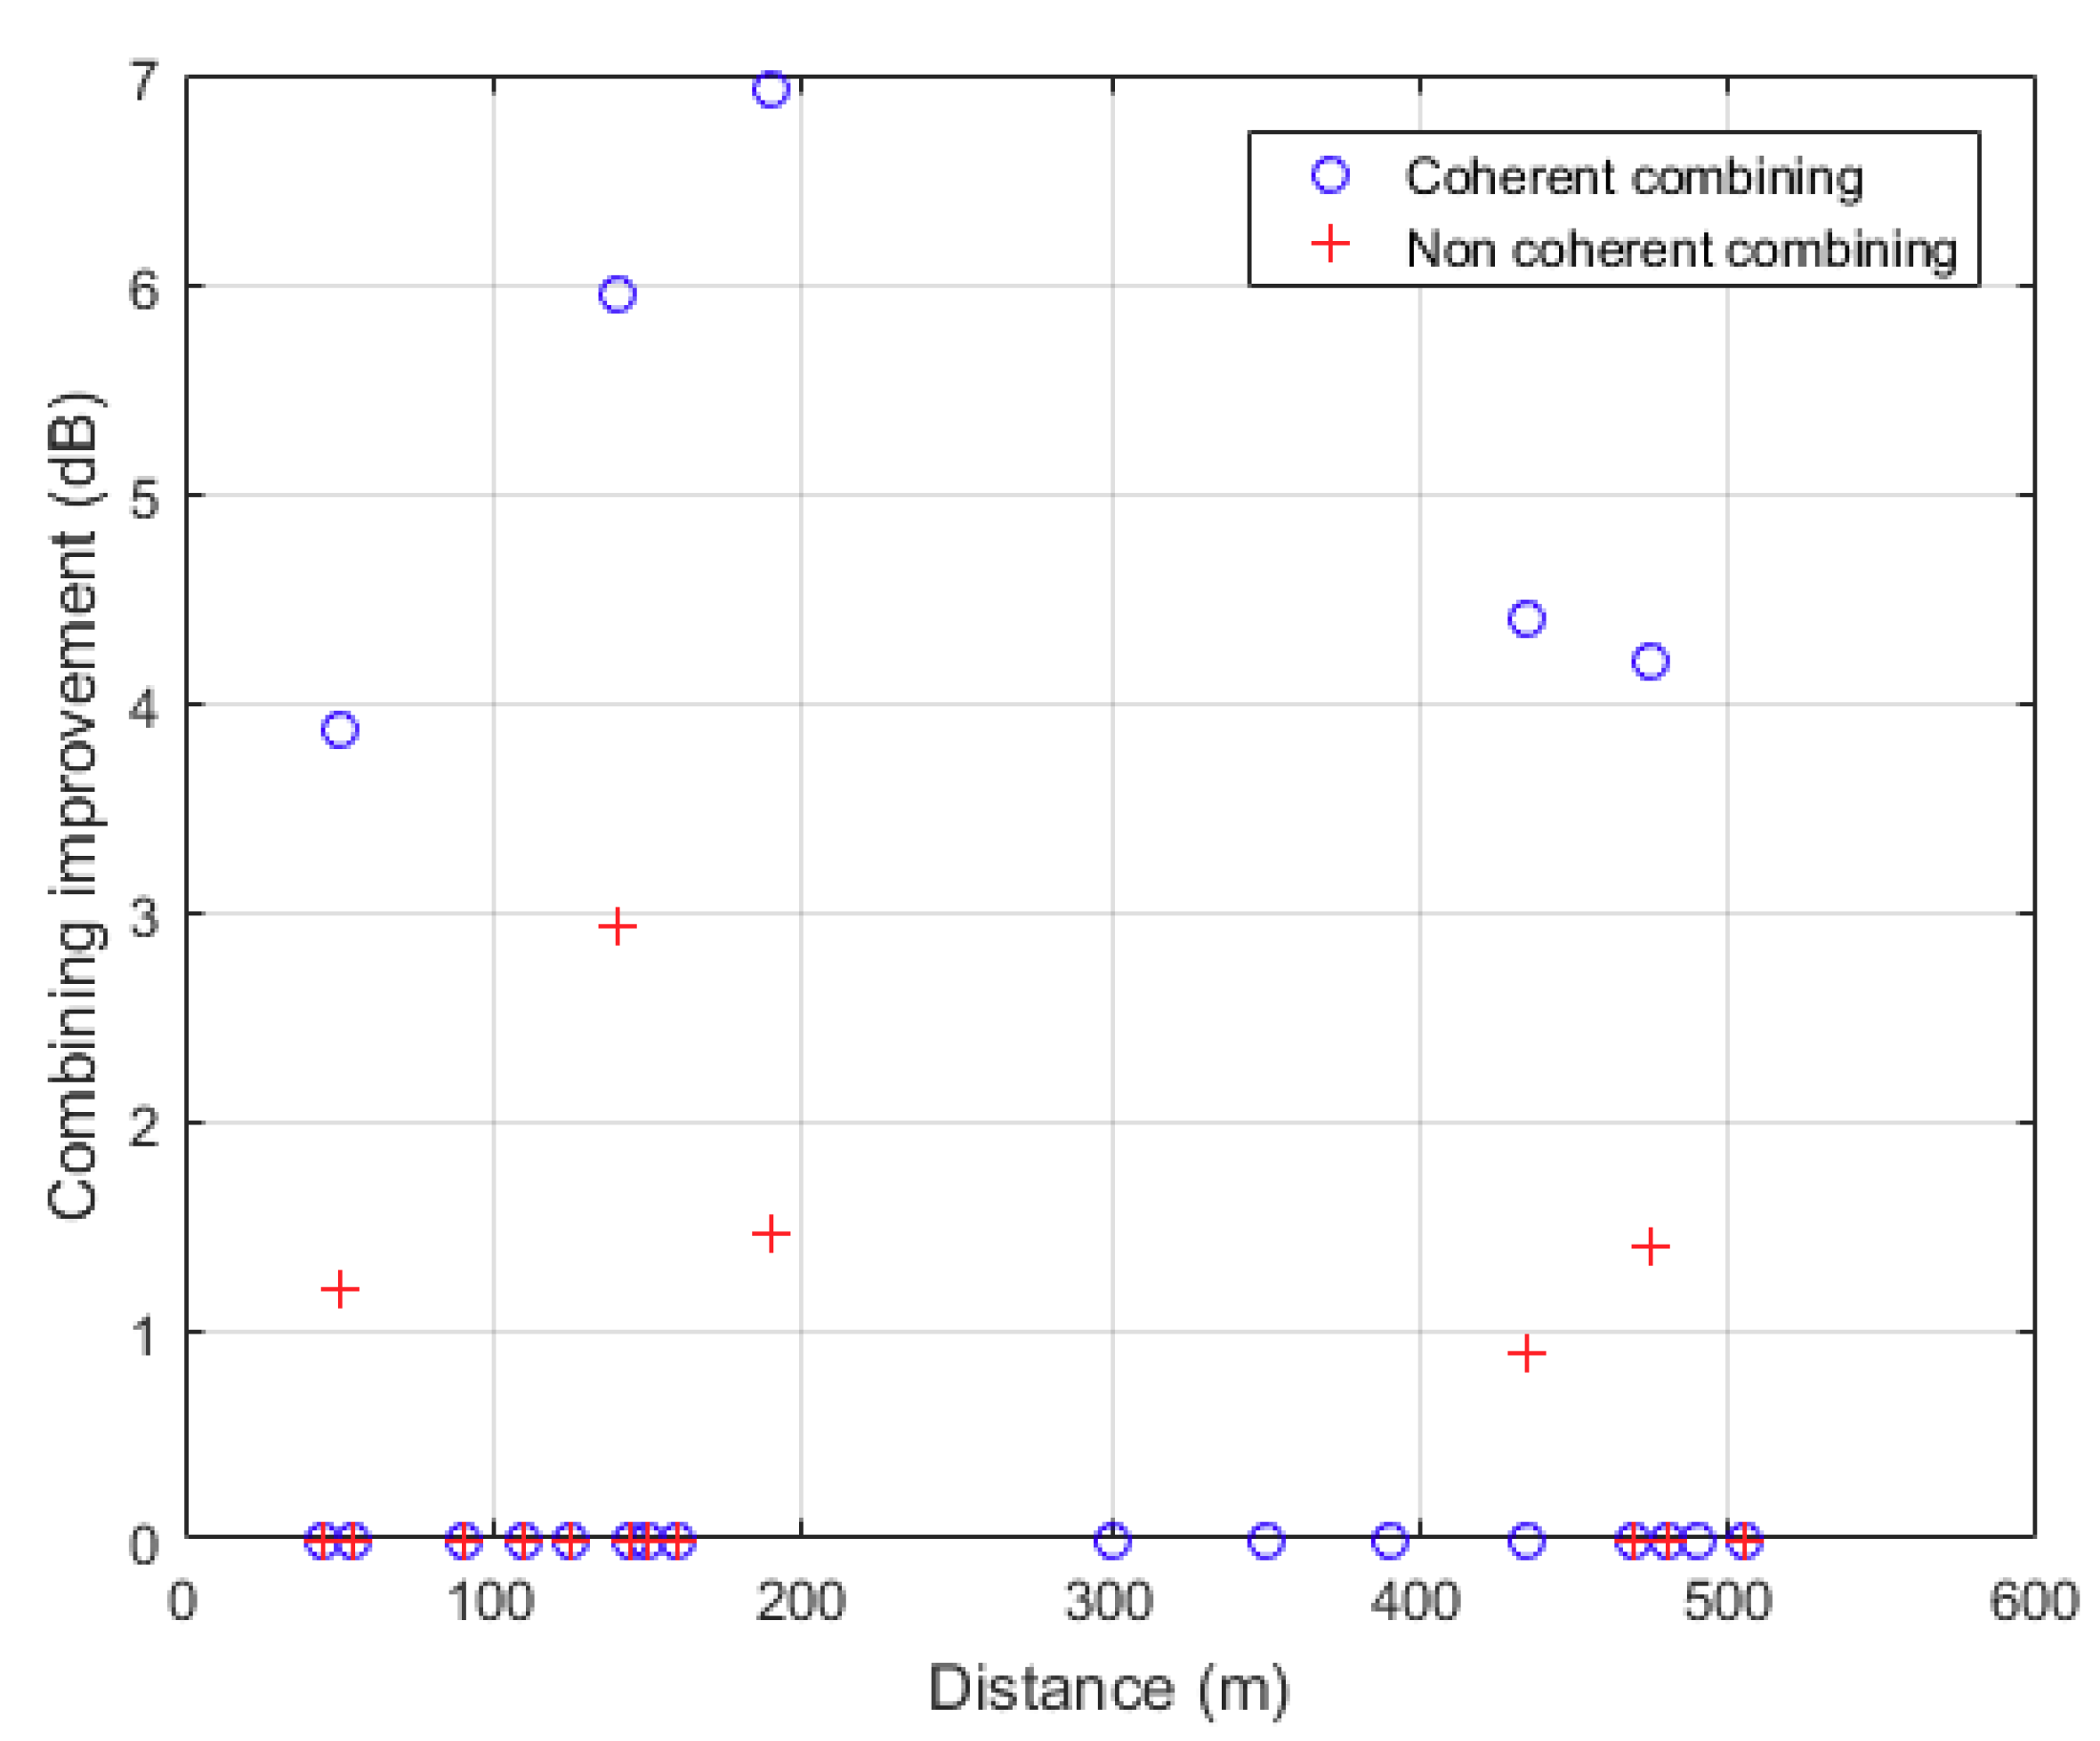
We give in Table 4 the mean, μ, and standard deviation, σ, of the improvement (in dB) for coherent (GCC) and non-coherent (GNCC) combining in the four environments considered. For the open environment, with a low number of lobes per location, the combining improvement was low. The combining improvement increased from open to suburban areas, from suburban to wooded areas, and from wooded to urban areas. GCC values up to 7 dB f were reached in the urban environment. We can also observe that the coherent combining values were larger than the non-coherent combining ones, which agrees with previous results in the literature.
Te values for the urban environment were lower than the values given in reference [36] for 28 GHz, where the mean improvement of the combined signal relative to the best single signal ranged from 2.3 dB to 4.7 dB for non-coherent combining and from 5.1 dB to 10.6 dB for coherent combining. However, the higher attenuation at 60 GHz reduced the number of beams available for combining, and, consequently, the combining improvements were lower.
The results in Table 4 agree with what could be expected a priori. If there is a dominant propagation path with much higher power, like under LOS conditions, or even just one propagation path, then:
P i P 1 , i = 2 , ,   N r
and
g C C 1
g N C C 1
therefore, there will be no combining improvement. However, under NLOS conditions, if there is no dominant propagation path and:
P i = P 1 , i = 2 , ,   N r
then the combining improvement will be maximum and equal to:
g C C   m a x = N r 2
g N C C   m a x = N r
Equations (9) and (10) indicate that there is a maximum value for the combining improvement that depends exclusively on the number of combined beams. Results given in Table 4 and in reference [36] comply with these limits. These equations also explain why higher combining improvement can be achieved by coherent combining. As Nr ≥ 1, then:
g C C   m a x g N C C   m a x
It should also be noted that, when omnidirectional antennas are used at the mobile end, the existence of a dominant propagation path, i.e., under LOS conditions, will yield a fast fading with a Rice distribution [42] with a high K factor. On the other hand, if there is no dominant path, i.e., under NLOS conditions, the K factor will be lower, and eventually the fast fading distribution will be Rayleigh. Higher combining improvements could be expected under Rayleigh fading conditions (NLOS) than under Rice fading ones (LOS). This makes angular combining techniques so interesting, as, usually, propagation losses are higher under NLOS conditions.
In Figure 10, we plotted the combining improvement as a function of the distance between Tx and Rx. We can clearly see the higher coherent combining values but we cannot appreciate a clear trend of the combining improvement with respect to the distance.
Previous studies [15] of radiowave propagation at millimeter wave frequencies in city streets showed Rice fading with a K factor that decreased from a high value to 1 as the distance between the Rx and the Tx increased. Consequently, we expected that the combining improvement would increase with the distance, from near to 1 (0 dB) to the maximum value given by (9) and (10). Probably, a larger number of measurements and distances would be needed to observe such a trend.

5. Conclusions

Despite the growing interest on modelling radiowave propagation at 60 GHz for future 5G systems, there are only a few models that incorporate this frequency band. The ones that do are limited to urban propagation environments and take the fitting parameters from a small number of measurement campaigns. In this paper, we present the measured APD for four different environments. These include the urban environment and, for the first time, three other environments: open, suburban, and wooded.
We analyzed the measurement results and found that they varied significantly from one environment to the other. We have calculated the APD parameters that would allow incorporating these three environments to 5G millimeter-wave models. We also compared the urban environment results with previous results in the literature and found they agreed.
We also analyzed the angular combining improvement and showed again that it depends on the environment multipath characteristics. Higher combing improvements are found precisely in the environment where higher propagation losses could be expected, which makes these techniques interesting to improve millimeter-wave 5G link performance. We also demonstrated that the combining improvement depends on the number of combined SLs and analytically calculated the maximum combining improvement, both for coherent and non-coherent combining. Both our results and previous results in the literature fulfill this limit.
Finally, we conducted a study to determine how the combining improvement would vary with the Tx–Rx distance and concluded that it would increase till reaching the limit we calculated. However, more experimental results are needed to confirm this point.

Author Contributions

Channel sounder set-up E.L.C.; Measurement campaign, all; Data processing, graphs M.G.S.; Results discussion, all; writing—review and editing, M.G.S.

Funding

This research was partially funded by the Ministerio de Ciencia, Innovación y Universidades (Spain), under grant number TEC2017-85529-C3-3-R.

Conflicts of Interest

The authors declare no conflict of interest.

References

  1. GSMA Intelligence Analysis. Understanding 5G: Perspectives on Future Technological Advancements in Mobile; White Paper: London, UK, 2014. [Google Scholar]
  2. Andrews, J.G.; Buzzi, S.; Choi, W.; Hanly, S.V.; Lozano, A.; Soong, A.C.K.; Zhang, J.C. What will 5G be? IEEE J. Sel. Areas Commun. 2014, 32, 1065–1082. [Google Scholar] [CrossRef]
  3. International Wireless Industry Consortium. Evolutionary & Disruptive Visions Towards Ultra High Capacity Networks; White Paper: Doylestown, PA, USA, 2014. [Google Scholar]
  4. Rappaport, T.S.; Sun, S.; Mayzus, R.; Zhao, H.; Azar, Y.; Wang, K.; Wong, G.N.; Schulz, J.K.; Samimi, M.; Gutierrez, F. Millimeter wave mobile communications for 5G cellular: It will work! IEEE Access 2013, 1, 335–349. [Google Scholar] [CrossRef]
  5. An, X.; Sum, C.; Prasad, R.V.; Wang, J.; Lan, Z.; Wang, J.; Hekmat, R.; Harada, H.; Niemegeers, I. Beam switching support to resolve link-blockage problem in 60 GHz WPANs. In Proceedings of the 2009 IEEE 20th International Symposium on Personal, Indoor and Mobile Radio Communications, Tokyo, Japan, 13–16 Septemper 2009; pp. 390–394. [Google Scholar]
  6. Roh, W.; Seol, J.; Park, J.; Lee, B.; Lee, J.; Kim, Y.; Cho, J.; Cheun, K.; Aryanfar, F. Millimeter-wave beamforming as an enabling technology for 5G cellular communications: Theoretical feasibility and prototype results. IEEE Commun. Mag. 2014, 52, 106–113. [Google Scholar] [CrossRef]
  7. Larsson, E.; Edfors, O.; Tufvesson, F.; Marzetta, T. Massive MIMO for next generation wireless Systems. IEEE Commun. Mag. 2014, 52, 186–195. [Google Scholar] [CrossRef]
  8. Hassan, N.; Fernando, X. Massive MIMO Wireless Networks: An Overview. Electronics 2017, 6, 63. [Google Scholar] [CrossRef]
  9. Pinchera, D.; Migliore, M.D.; Schettino, F.; Panariello, D. Antenna Arrays for Line-of-Sight Massive MIMO: Half Wavelength Is Not Enough. Electronics 2017, 6, 57. [Google Scholar] [CrossRef]
  10. Fan, W.; Carton, I.; Kyosti, P.; Karstensen, A.; Jamsa, T.; Gustafsson, M.; Pedersen, G.F. A step toward 5G in 2020: Low-cost OTA performance evaluation of massive MIMO base stations. IEEE Antennas Propag. Mag. 2017, 59, 38–47. [Google Scholar] [CrossRef]
  11. Hur, S.; Baek, S.; Kim, B.; Park, J.; Molisch, A.F.; Haneda, K.; Peter, M. 28 GHz channel modeling using 3D ray-tracing in urban environments. In Proceedings of the 9th EuCAP, Lisbon, Portugal, 12–17 April 2015. [Google Scholar]
  12. Hur, S.; Baek, S.; Kim, B.; Chang, Y.; Molisch, A.F.; Rappaport, T.S.; Haneda, K.; Park, J. Proposal on millimeter-wave channel modeling for 5G cellular system. IEEE J. Sel. Top. Signal Process. 2016, 10, 454–469. [Google Scholar] [CrossRef]
  13. Kyösti, P.; Jämsä, T.; Nuutinen, J.P. Channel modelling for multiprobe over-the-air MIMO testing. Int. J. Antennas Propag. 2012. [Google Scholar] [CrossRef]
  14. Smulders, P.F.M.; Correia, L.M. Characterisation of propagation in 60 GHz radio channels. Electron. Commun. Eng. J. 1997, 9, 73–80. [Google Scholar] [CrossRef]
  15. Hammoudeh, A.M.; Sánchez, M.G.; Grindrod, E. Experimental analysis of propagation at 62 GHz in suburban mobile radio microcells. IEEE Trans. Veh. Technol. 1999, 48, 576–588. [Google Scholar] [CrossRef]
  16. Xu, H.; Kukshya, V.; Rappaport, T.S. Spatial and temporal characteristics of 60-GHz indoor channels. IEEE J. Sel. Areas Commun. 2002, 20, 620–630. [Google Scholar] [CrossRef] [Green Version]
  17. Smulders, P.F.M. Statistical characterization of 60-GHz indoor radio channels. IEEE Trans. Antennas Propag. 2009, 57, 2820–2829. [Google Scholar] [CrossRef]
  18. Geng, S.; Kivinen, J.; Zhao, X.; Vainikainen, P. Millimeter-wave propagation channel characterization for short-range wireless communications. IEEE Trans. Veh. Technol. 2009, 58, 3–13. [Google Scholar] [CrossRef]
  19. Ben-Dor, E.; Rappaport, T.S.; Qiao, Y.; Lauffenburger, S.J. Millimeter-wave 60 GHz outdoor and vehicle AOA propagation measurements using a broadband channel sounder. In Proceedings of the IEEE GLOBECOM, Houston, TX, USA, 5–9 December 2011; pp. 1–6. [Google Scholar]
  20. Rappaport, T.S.; Ben-Dor, E.; Murdock, J.N.; Qiao, Y. 38 GHz and 60 GHz angle-dependent propagation for cellular & peer-to-peer wireless communications. In Proceedings of the 2012 IEEE International Conference on Communications (ICC), Ottawa, ON, Canada, 10–15 June 2012; pp. 4568–4573. [Google Scholar]
  21. Lu, J.S.; Cabrol, P.; Steinbach, D.; Pragada, R.V. Measurement and characterization of various outdoor 60 GHz diffracted and scattered paths. In Proceedings of the IEEE MILCOM, San Diego, CA, USA, 18–20 November 2013. [Google Scholar]
  22. Lemos, E.; Táboas, M.P.; Sánchez, M.G.; Alejos, A.V. Microcellular Radio Channel Characterization at 60 GHz for 5G communications. IEEE Antennas Wirel. Propag. Lett. 2017, 16, 1476–1479. [Google Scholar]
  23. Wang, C.; Bian, J.; Sun, J.; Zhang, W.; Zhang, M. A survey of 5G channel measurements and models. IEEE Commun. Surv. Tutor. 2018, 20, 3142–3168. [Google Scholar] [CrossRef]
  24. Sun, S.; Rappaport, T.S.; Shafi, M.; Tang, P.; Zhang, J.; Smith, P.J. Propagation models and performance evaluation for 5G millimeter-wave bands. IEEE Trans. Veh. Technol. 2018, 67, 8422–8439. [Google Scholar] [CrossRef]
  25. METIS. METIS Channel Models. ICT-317669 METIS Project. 2015. Available online: https://www.metis2020.com/wp-content/uploads/METIS_D1.4_v3.pdf (accessed on 27 November 2018).
  26. Medbo, J.; Kyosti, P.; Kusume, K.; Raschkowski, L.; Haneda, K.; Jamsa, T.; Nurmela, V.; Roivainen, A.; Meinila, J. Radio propagation modeling for 5G mobile and wireless communications. IEEE Commun. Mag. 2016, 54, 144–151. [Google Scholar] [CrossRef]
  27. Liu, L.; Oestges, C.; Poutanen, J.; Haneda, K.; Vainikainen, P.; Quitin, F.; Tufvesson, F.; de Doncker, P. The COST 2100 MIMO channel model. IEEE Wirel. Commun. Mag. 2012, 19, 92–99. [Google Scholar] [CrossRef] [Green Version]
  28. IST-WINNER II Deliverable 1.1.2 v.1.2. WINNER II Channel Models. IST-WINNER2, Technical Report. 2007. Available online: https://www.cept.org/files/8339/winner2 - final report.pdf (accessed on 27 November 2018).
  29. 3GPP. Study on Channel Model for Frequencies from 0.5 to 100 GHz. Technical Report 3GPP TR 38.901 V15.0.0 (2018-06), Release 15. Available online: www.3gpp.org/DynaReport/38901.htm (accessed on 27 November 2018).
  30. Saleh, A.A.M.; Valenzuela, R. A statistical model for indoor multipath propagation. IEEE J. Sel. Areas Commun. 1987, 5, 128–137. [Google Scholar] [CrossRef]
  31. Spencer, Q.H.; Jeffs, B.D.; Jensen, M.A.; Swindlehurst, A.L. Modeling the statistical time and angle of arrival characteristics of an indoor multipath channel. IEEE J. Sel. Areas Commun. 2000, 18, 347–360. [Google Scholar] [CrossRef] [Green Version]
  32. Samimi, M.K.; Rappaport, T.S. 3-D millimeter-wave statistical channel model for 5G wireless system design. IEEE Trans. Microw. Theory Tech. 2016, 64, 2207–2225. [Google Scholar] [CrossRef]
  33. Ziolkowski, C.; Kelner, J.M. Empirical models of the azimuthal reception angle—Part I: Comparative analysis of empirical models for different propagation environments. Wirel. Pers. Commun. 2016, 91, 771–791. [Google Scholar] [CrossRef]
  34. Perget, F. Performance evaluation on beamforming solutions for mmwave wireless systems. In Proceedings of the 2011 IEEE Global Telecommunications Conference—GLOBECOM 2011, Houston, TX, USA, 5–9 December 2011. [Google Scholar]
  35. Wyne, S. Beamforming effects on measured mm-wave channel characteristics. IEEE Trans. Wirel. Commun. 2011, 10, 3553–3559. [Google Scholar] [CrossRef]
  36. Sun, S.; Rappaport, T.S. Multi-beam antenna combining for 28 GHz cellular link improvement in urban environments. In Proceedings of the 2013 IEEE Global Telecommunications Conference—GLOBECOM 2013, Atlanta, GA, USA, 9–13 December 2013; pp. 3754–3758. [Google Scholar]
  37. Sun, S.; MacCartney, G.R.; Samimi, M.K.; Nie, S.; Rappaport, T.S. Millimeter wave multi-beam antenna combining for 5G cellular link improvement in New York City. In Proceedings of the 2014 IEEE International Conference on Communications (ICC), Sydney, NSW, Australia, 10–14 June 2014; pp. 5468–5472. [Google Scholar]
  38. Lemos, E.; Sánchez, M.G.; Alejos, A.V. High speed transmission at 60 GHz for 5G communications. In Proceedings of the IEEE APS-URSI, Vancouver, BC, Canada, 19–24 July 2015; pp. 1007–1008. [Google Scholar]
  39. Sánchez, M.G.; Portela, M.; Lemos, E. Millimeter wave radio channel characterization for 5G vehicle-to-vehicle communications. Measurements 2017, 95, 223–229. [Google Scholar]
  40. Samimi, M.; Wang, K.; Azar, Y.; Wong, G.N.; Mayzus, R.; Zhao, H.; Schulz, J.K.; Sun, S.; Gutierrez, F.; Rappaport, T.S. 28 GHz angle of arrival and angle of departure analysis for outdoor cellular communications using steerable beam antennas in New York City. In Proceedings of the 77th IEEE VTC (Spring), Dresden, Germany, 2–5 June 2013. [Google Scholar]
  41. Sulyman, A.I.; Alwarafy, A.; MacCartney, G.R.; Rappaport, T.S. Directional radio propagation path loss models for millimeter-wave wireless networks in the 28-, 60-, and 73-GHz bands. IEEE Trans. Wirel. Commun. 2016, 15, 6939–6947. [Google Scholar] [CrossRef]
  42. ITU-R P.1057-5, Probability Distributions Relevant to Radiowave Propagation Modelling. December 2017. Available online: https://www.itu.int/rec/R-REC-P.1057-5-201712-I (accessed on 27 November 2018).
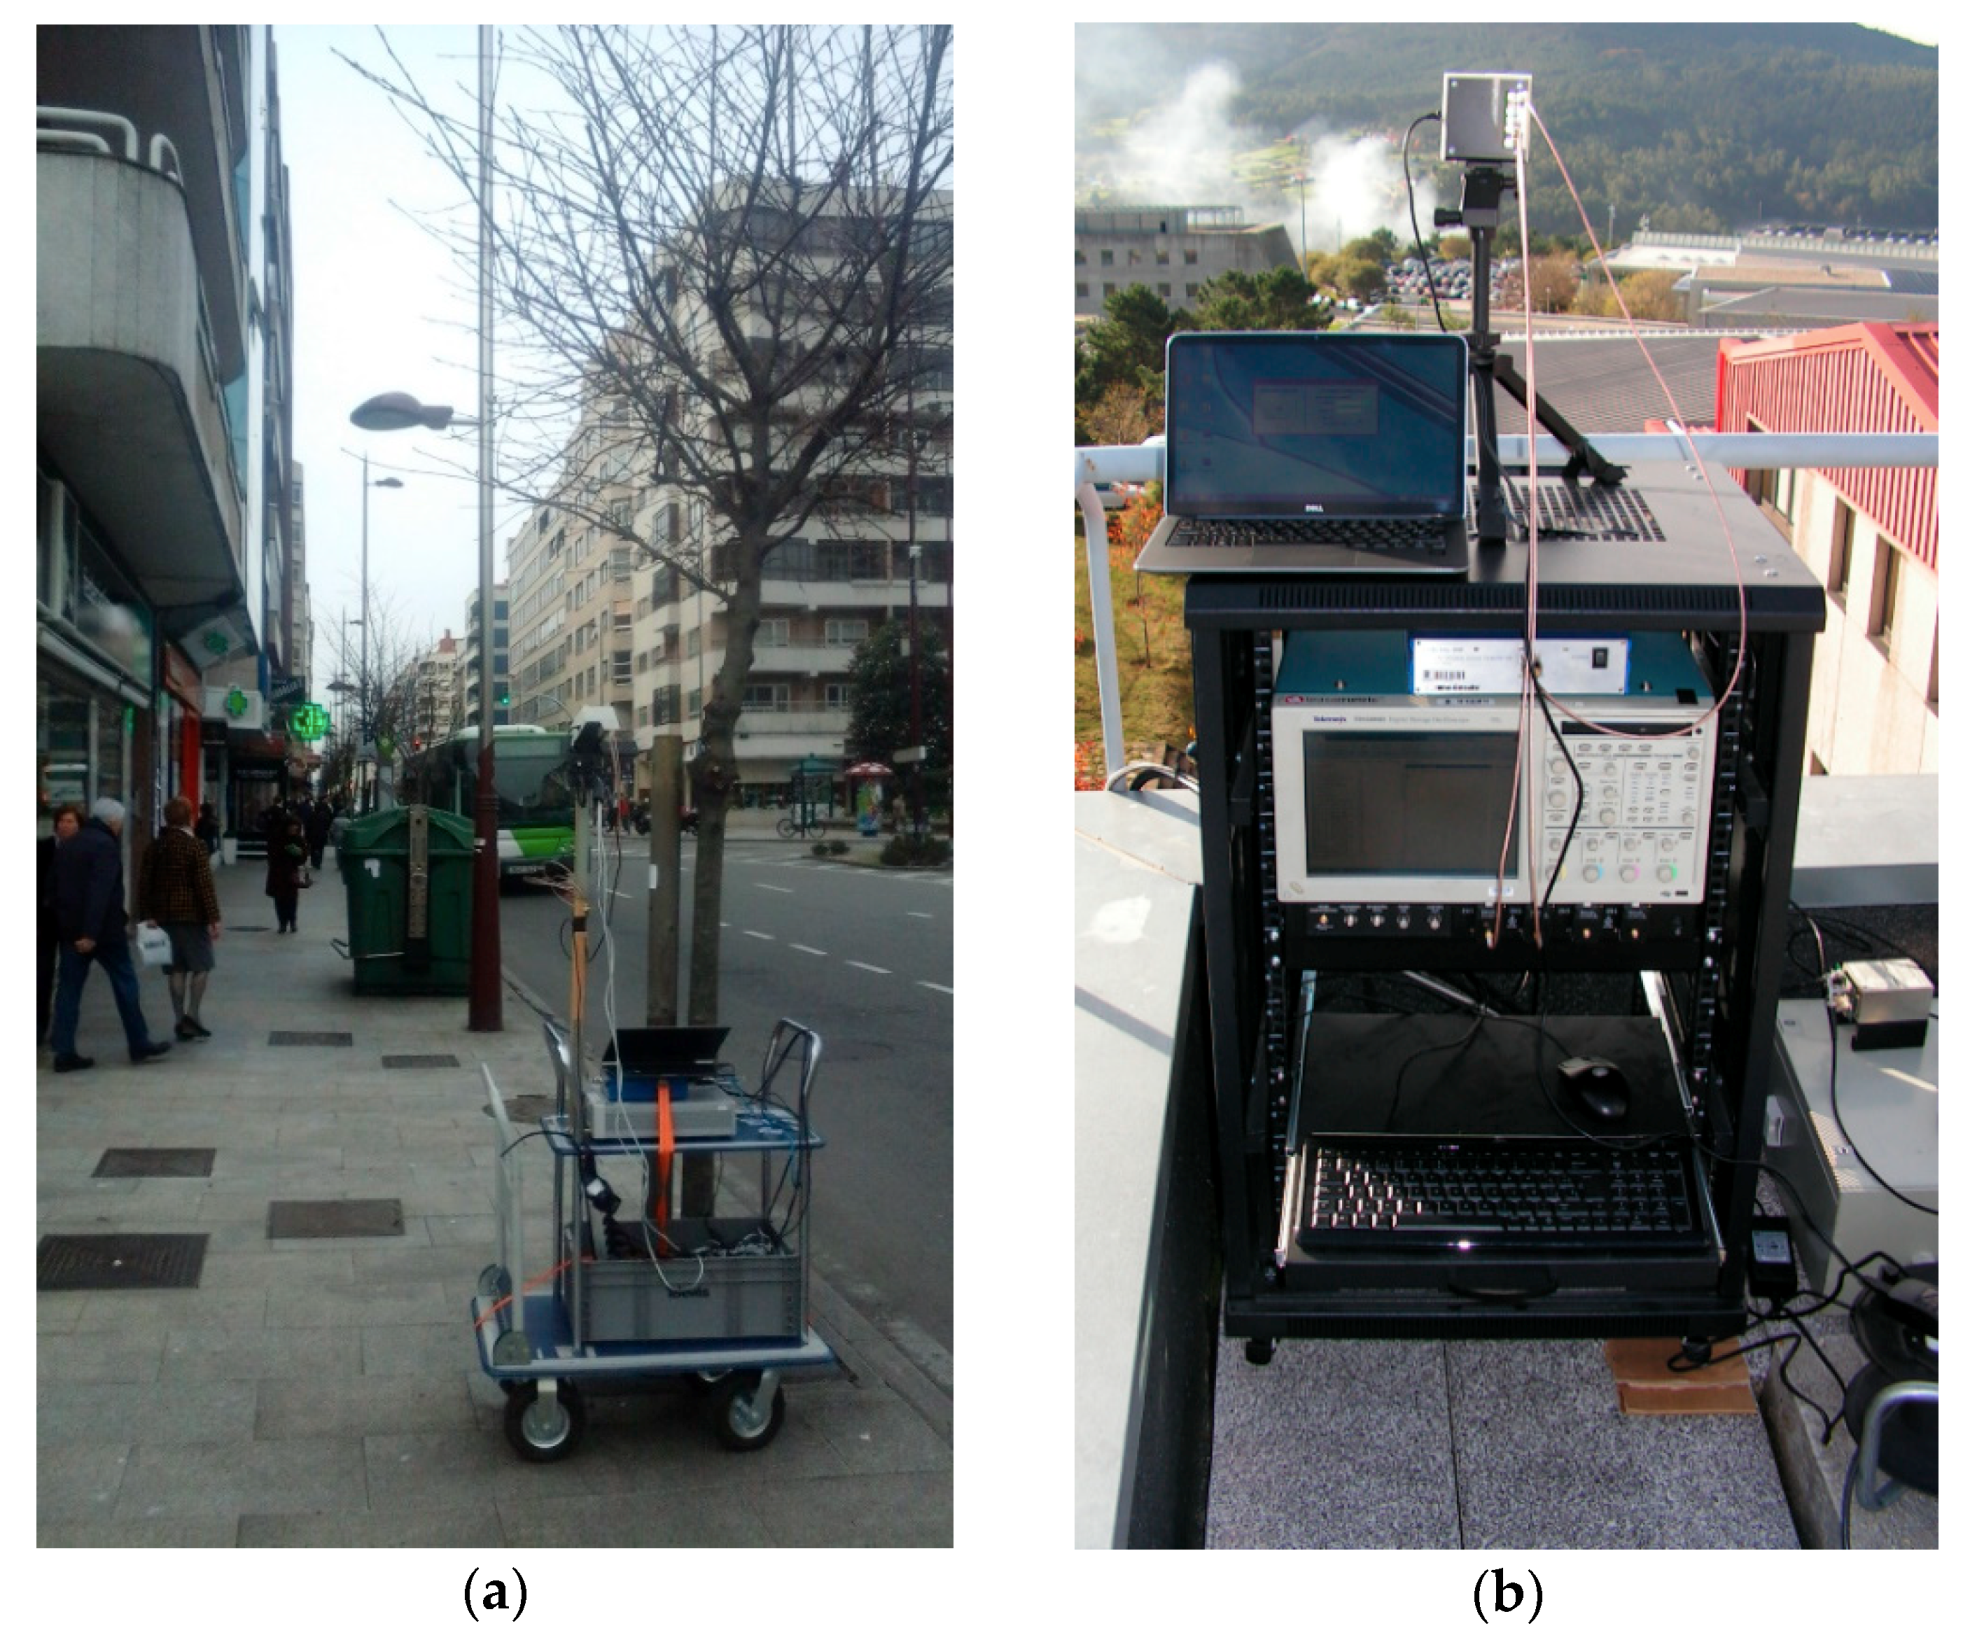
Figure 1. Pictures of the (a) Tx and (b) Rx.
Electronics 07 00365 g001
Figure 2. Measurement scenarios.
Electronics 07 00365 g002
Figure 3. Location of Tx and Rx in the various environments: (a) wooded; (b) open; (c) suburban; (d) urban. Maps from Google, TerraMetrics.
Electronics 07 00365 g003
Figure 4. Pan–tilt element at the mobile end.
Electronics 07 00365 g004
Figure 5. Example of Power Delay Profile (PDP).
Electronics 07 00365 g005
Figure 6. Angular power distribution (APDs) for open environment (a) azimuth and (b) elevation.
Electronics 07 00365 g006
Figure 7. APDs for wooded environment (a) azimuth and (b) elevation.
Electronics 07 00365 g007
Figure 8. APDs for suburban environment (a) azimuth and (b) elevation.
Electronics 07 00365 g008
Figure 9. APDs for urban environment (a) azimuth and (b) elevation.
Electronics 07 00365 g009
Figure 10. Combining improvement as a function of the distance.
Electronics 07 00365 g010
Table 1. Sounder specifications. PRBS: pseudorandom binary sequence; Tx: signal transmitter; Rx: signal receiver.
ParameterValue
Frequency60.48 GHz
PRBS chip rate (fc)500 Mbps
RF bandwidth (null-to-null)1 GHz
Code length213 − 1 bit
Multipath time resolution2 ns
Max. Tx power15 dBm
Max. measurable path loss (10 dB SNR)150 dB
Tx/Rx antenna polarizationVertical
Tx/Rx antenna gain20 dBi
Tx/Rx antenna azimuth 3 dB beamwidth18°
Tx/Rx antenna elevation 3 dB beamwidth19°
Table 2. Measurement Scenarios.
EnvironmentOpenWoodedSuburbanUrban
Tx–Rx distance range (m)[250, 550][50, 200][30, 200][350, 500]
Rx height (m)12143333
Tx height (m)1.81.81.81.8
Tx–Rx angle range[6°, 10°][13°, 32°][11°, 36°][5°, 7°]
Table 3. Angular spread parameters.
EnvironmentOpenWoodedSuburbanUrban
Number of SLsμ11.7111.4
σ01.500.631.14
AoAAz.El.Az.El.Az.El.Az.El.
LAS (degrees)μ49.323.658.849.352.533.747.137.5
σ7.38.029.014.38.27.523.626.0
rms LAS (degrees)μ11.53.214.612.911.88.711.69.7
σ0.93.04.63.81.51.73.87.5
Table 4. Angular combining improvement (in dB). GCC: coherent combining; GNCC: non-coherent combining.
EnvironmentOpenWoodedSuburbanUrban
GCC (dB)μ01.51.22.2
σ02.82.72.5
GNCC (dB)μ00.40.60.6
σ00.71.30.7