1. Introduction
High precision of a flight height measurement is required at low altitude, mainly in the phase of aircraft approaching for landing and landing. For this purpose, an FMCW airborne radio altimeter (radar altimeter) is used for measuring the low altitudes [
1]. When the flight height is measured, the principle of radiolocation with the evaluation of the time delay
τ between the transmitted and received signal of a radio altimeter is used [
2,
3].
It can be presented that the flight altitude H directly corresponds to the delay of a received signal. The time delay is not evaluated directly for radio altimeters, but it is performed indirectly through the differential frequency Fd. The differential frequency is created between the immediate value of the frequency of the transmitted and time-delayed received signal. The dependence is linear and it can be presented that the flight altitude indirectly corresponds also to the differential frequency.
In this way, the complex measurement of the very short times when measuring the small heights is transformed into a simple measurement of the differential frequency. The relation between the measured altitude and the differential frequency is defined by a so-called “basic formula of radio altimeter”
where Δ
f is the frequency deviation,
FM is the modulation frequency
c is the speed of light.
For a classical altitude measurement method, the measurement accuracy is defined by the value of so-called critical altitude Δ
H of a radio altimeter. The critical altitude presents a minimal altitude range which can be registered by a radio altimeter and displayed for a pilot. The critical altitude is also connected with the radio altimeter measurement accuracy ±Δ
H. It is possible to derive mathematically that the critical altitude depends on the frequency deviation of a transmitted high-frequency signal according to the following formula [
3].
The dependence can also be presented graphically [
4,
5] (
Figure 1).
From
Figure 1 we can see that at the low frequency deviation of 10–20 MHz the critical altitude of 4–2 m takes place. This value is relatively significant. Therefore the oldest radio altimeters (ALT 1 in
Figure 1) provided the measurement accuracy of about ±2.2 m only. The medium frequency deviation of 20–40 MHz provides a relatively lower critical altitude of 2–1 m. Some older types of radio altimeters, used until recently (ALT 2), provided the accuracy of about ±1.5 m. Recent radio altimeters use the rather high frequency deviation of about 50 MHz at which the critical altitude is about 0.75 m that is rather low. Therefore, the recent types of radio altimeters (ALT 3) provide the measurement accuracy of about ±0.75 m [
6,
7].
From a historical viewpoint, the accuracy is increased for approximately fifty percent at each stage of radio altimeters development. Going the same way, to decrease the critical altitude of the ALT 3 stage in twice to 0.375 m the frequency deviation of 100 MHz is required to reach a new stage (ALT 4) for the measurement accuracy of about ±0.375 m. From this viewpoint, the paper offers a more simple solution on how to obtain the precision of the ALT 4 stage maintaining the recently used value of frequency deviation of 50 MHz [
8,
9].
2. Materials and Methods
Critical altitude is presented by minimal altitude difference which the radio altimeter can recognize. As the measurement accuracy depends on the value of the critical altitude, it should be considered in more detail.
One stable height pulse
N permanently develops (at increase) or terminates (at decrease) in the range of measurement of the critical altitude. A total number of permanent height pulses
N carries the information about the measured altitude. It can be understood so that if we divide the total measured altitude
H into the critical altitude sections; their number will correspond to the measured altitude as
N =
H/Δ
H. The presented number of pulses
N develops (or terminates) within one modulation period
TM and modulation frequency
FM. The resulting evaluated differential frequency
Fd is proportional to measured altitude and given by the multiplication of the number of pulses and modulation frequency
Fd =
N ×
FM. A discrete (step-like) change of the number of permanent height pulses is shown in
Figure 2 by a thick line. Five changes of the number of permanent height pulses are shown within the presented altitude range in
Figure 2.
It is possible to derive a harmonic course of a differential low-frequency signal [
1] from mathematical analysis of mutual ratios, two high-frequency frequency-modulated signals, transmitted and time-delayed received signal of a radio altimeter.
From the viewpoint of a radio altimeter operation principle, the harmonic differential signal, which carried the information about measured height in processing circuits, changes into an orthogonal discreet differential signal. Height pulses, which are the object of this paper’s analysis, are shaped by this discreet differential signal. Height pulses are shaped—alternatively creating and ceasing, from the orthogonal differential signal, each time the time course of the differential signal passes a zero point. The number of height pulses
k remains constant at the constant height. Their number increases with increasing height, and alternatively, their number decreases with decreasing a height. The increase of a measured height is considered. From the mathematical analysis [
1], the height of the creation pulses
Hv and the height of the cessation pulses H
z can be derived
where
λ0 is the carrier wavelength,
ξ is the relative value of the frequency deviation,
ξ = Δ
f/
f0.
A height range of the duration of relevant height pulse
S is determined as the difference between the height the cessation and creation pulses
From Equation (4) it can be seen that the height range increases with increasing the number of height pulses.
A height range of the creation of different pulses
F is defined as the difference of heights between two consecutive creating pulses
where
Hv1 is the height of the creation of the first pulse,
Hv2 is the height of creation of the second pulse.
A height range of the cessation of different pulses
E is defined as the difference of heights between two consecutive ceasing pulses
By defining the relations for the height of the creation and cessation of pulses, it is possible to display the shaping of different height pulses in the general height range
H (
Figure 3). In the height range 1Δ
H, it can be seen that with increasing the height of one unstable pulse, the height range of duration continually grows, permanently creates and ceases.
It can also be observed from
Figure 3 that the height sections of creating pulses have a constant value similarly to the height pulses of cessation of the height pulses. The height interval of the creation of pulses is smaller than the height interval of the cessation of pulses. The difference produces the parameter ±ξ.
The result of this fact is that from a certain height the pulses start to mutually overlap. At the height where the pulses start to overlap, one permanent pulse is created in the height range 2ΔH. But at the same time, with further height growth, one (number two in the row) unstable pulse is created. After crossing the height range 2ΔH, the situation repeats in the range 3ΔH. The only difference is that there are two permanent pulses and one (number three in the row) unstable pulse in the range 3ΔH.
In order to be able to portray two overlapping pulses in a more simple way, the height pulses in the bottom part of the figure have a different amplitude. (The size of the portrayed amplitude is not connected with the amplitude of the actual height impulse, which is constant.)
At a fluent change of measured altitude within the range of critical altitude, the creation of the permanent height pulses is accompanied by the development and termination of unstable height pulse
NV (within all ranges of the critical altitude). The unstable height pulse does not carry the measured altitude but vice versa causes inaccuracy in the altitude measurement. Discreet change of the number of unstable height pulses is presented by a thin line in
Figure 2. There are seven changes of the unstable height pulses in the range of critical altitude in the presented altitude range. This phenomenon is based on a physical principle used in the airborne FMCW radio altimeters [
2,
10].
Based on a thorough mathematical analysis of the creation of permanent and unstable height pulses [
2], it is possible to suggest and realize a new method for increasing the altitude measurement accuracy. This method is a so-called double-channel radio altimeter which uses an appropriate procedure of assembling two differential signals mutually phase-shifted and created by the same radio altimeter. In this way, more frequent change of two unstable pulses into one permanent height pulse can be secured. As a result, the original value of the radio altimeter critical altitude decreases in twice. The basics of the double-channel method are based on the theory of the creation of critical altitude, as a result of the alternating creation and termination of unstable height pulses.
The presented law of the unstable pulses creation in a low altitude range can be used in the design and realization of a double-channel radio altimeter, when the methodological error of the altitude measurement decreases in twice (
Figure 4) [
11].
The double-channel radio altimeter has two equal and parallel working channels of processing the differential signal from which one has an artificially time delay of processing signal by the value of
λ0/4. Both channels must be technically designed in a way that the same signal on the input shapes the same height pulses on the output. A time delay of the processed signal by value
λ0/8 in the second channel causes a mutual shift of the creation of those two unstable height pulses. Alternation of the creation and termination of unstable pulses within both channels mutually fit within. When the height within the range of critical altitude Δ
H1 grows, both pulses within the range of the first half of Δ
H1/2 fit within each other and within the range of the second half of Δ
H1/2, they start to mutually overlap. This is the result of increasing the height interval of lasting of the unstable pulse. In this way, the original critical altitude Δ
H1 divides into two halves Δ
H1/2. The original value of Δ
H1 divided into two halves actually present two new values of critical altitude Δ
H2 in a double-channel radio altimeter. The height pulses creation in a double-channel radio altimeter and the logic of the decrease of its methodological error are illustrated in
Figure 4.
3. Results and Discussion
Experimental double-channel radio altimeter has been constructed in a laboratory with the use of two classical one-channel radio altimeters operating at the carrier frequency
f0 = 444 MHz with the frequency deviation Δ
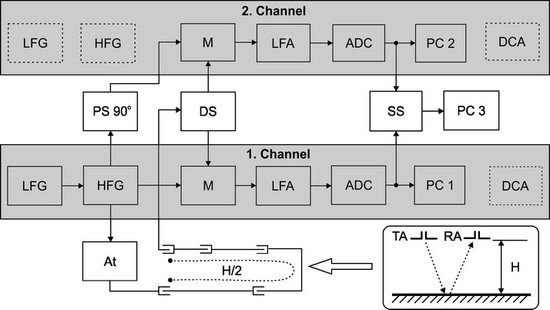
f = 17 MHz. For the purpose of experimental measurement, those radio altimeters have been disassembled mechanically and re-configured. A block diagram of those two radio altimeters connection into one double-channel radio altimeter is shown in
Figure 5. The first altimeter (1st channel) worked as a complete construction in the original connection. The second altimeter (2nd channel) was adjusted so that to use only the circuit of a high-frequency converter, the circuit of a low-frequency amplifier, and the circuit of shaping the height pulses of differential frequency.
Both channels have the common transmitter and high frequency (HF) outputs, one for transmitting and the other for receiving antennas. To create a double-channel radio altimeter, other blocks have been made, such as the high-frequency signal attenuator of the transmitter, the delay line into the second channel, the high-frequency attenuator of a received signal as well as the merger of an output low-frequency differential signal [
12].
A real altitude measurement has not been performed between the transmitting and receiving antennas. That HF line has been replaced by a coaxial line, the input of which has been connected instead of the transmitting antenna, and the output instead of the receiving antenna. The attenuator, which imitated a signal attenuation in realistic conditions, has been connected into a HF route. The change of measured altitude during the laboratory measurements has been realized up to the basic altitude of 7.54 m by adding the coaxial sections of 0.5 m length. Six sections of coaxial lines with the following length have been realized: 0.5 m, 1 m, 2 m, 4 m, 8 m, and 16 m. By their mutual connection, it was possible to create an additional measuring route of 31.5 m length with a 0.5 m step.
Considering the shortening coefficient of 0.8 for the line, and the fact that the line replaces the route of the signal to the ground and back, the 25.2 m coaxial line imitated measured altitude of 12.6 m with a 0.2 m step. The measuring results with the double-channel radio altimeter are shown in
Figure 6.
From the viewpoint of the laboratory experiments, the evaluation of the measured altitude through the differential frequency is more precise and objective than using a pointer height indicator. The altitude evaluation could be done by recording the value of the differential frequency on three readers: the 1st channel, 2nd channel, and common channel. The differential frequency value of the common channel was divided by two after reading. The measured altitude
Hm =
Fd/34 could be evaluated through the constant of radio altimeter (
K = 34) by dividing the measured value of the differential frequency [
13].
Figure 6 presents three curves of measured values of the differential frequency: the 1st channel (blue curve), the 2nd channel (red curve), and the common channel (green curve). The differential frequency value corresponds with the altitude so that the number of height pulses shaped during the time of the modulation period is multiplied by the modulation frequency. A discrete increase of the number of pulses by one pulse within one modulation period means a discreet increase of the differential frequency by the value of modulation frequency. In this way, the differential frequency increase has a discreet course which can be observed in the presented graphs. The step-like course of measured altitude is created.
Two straight lines can be constructed on the presented “steps” of each graph: one, which connects tops—“tips” of minimal values of altitude on a constant level of the differential frequency (upper straight line A–B); another one, which connects the tops—“heels” of maximum values of altitude on a constant level of the differential frequency (unmarked bottom straight line). Those two leaning straight lines are connected by a horizontal line on a constant value of the differential frequency of 300 Hz.
The plan of horizontal line cross point with both full straight lines into the horizontal altitude axis expresses the critical altitude Δ
H1 measured by a classical single-channel radio altimeter. In case of the critical altitude of one of the channels of a double-channel radio altimeter, the value Δ
H1 = 2.7 m has been measured. A theoretical value of the critical altitude of the experimental radio altimeters is 2.2 m. From the presented results, it can be seen that due to construction changes and interconnections of the original radio altimeters, their critical altitude Δ
H1 has increased from 2.2 m to 2.7 m [
14,
15].
Created “steps” of the first and second channel height pulses (blue and red curves) are mutually shifted so that it is possible to create a sum of height pulses of both channels. The created sum of pulses of the differential frequencies of both channels has a double value and their graphic curve could get out of the area of single-channel dependences. Therefore, each following sum value of the differential frequencies pulses of both channels is divided by two. It is shown by the green curve of the height dependence between both channels courses.
This course also has a step-like character of the graph on which two similar, but chain-dotted straight lines have been constructed. At a constant value of the differential frequency of 400 Hz, there are also two inclined chain-dotted straight lines connected by a horizontal line. The plan of the cross points of this horizontal line with both chain-dotted straight lines into the horizontal altitude axis expresses the measured critical altitude ΔH2 of the double-channel radio altimeter. In case of the methodological error of a double-channel radio altimeter, a critical altitude of 1.3 m has been evaluated.
The value of the critical altitude ΔH1 of each original single-channel radio altimeters was 2.7 m. So, the “new” double-channel radio altimeter should have the critical altitude of 1.35 m. However, a better value of 1.3 m has been obtained during the experiment.

 ,
, 


 are the original blocks of a one-channel radio altimeter not used in the laboratory double-channel radio altimeter.

