Article

A Modified Adaptive Neuro-Fuzzy Inference System Using Multi-Verse Optimizer Algorithm for Oil Consumption Forecasting

by
Mohammed A. A. Al-qaness
1,
Mohamed Abd Elaziz
2,
Ahmed A. Ewees
3 and
Xiaohui Cui
4,*
1
School of Computer Science, Wuhan University, Wuhan 430072, China
2
Department of Mathematics, Faculty of Science, Zagazig University, Zagazig 44519, Egypt
3
Department of Computer, Damietta University, Damietta 34511, Egypt
4
School of Cyber Science and Engineering, Wuhan University, Wuhan 430072, China
*
Author to whom correspondence should be addressed.
Electronics 2019, 8(10), 1071; https://doi.org/10.3390/electronics8101071
Submission received: 22 August 2019 / Revised: 16 September 2019 / Accepted: 18 September 2019 / Published: 21 September 2019
(This article belongs to the Special Issue Fuzzy Systems and Data Mining)

Abstract

:
Oil is the primary source of energy, therefore, oil consumption forecasting is essential for the necessary economic and social plans. This paper presents an alternative time series prediction method for oil consumption based on a modified Adaptive Neuro-Fuzzy Inference System (ANFIS) model using the Multi-verse Optimizer algorithm (MVO). MVO is applied to find the optimal parameters of the ANFIS. Then, the hybrid method, namely MVO-ANFIS, is employed to forecast oil consumption. To evaluate the performance of the MVO-ANFIS model, a dataset of two different countries was used and compared with several forecasting models. The evaluation results show the superiority of the MVO-ANFIS model over other models. Moreover, the proposed method constitutes an accurate tool that effectively improved the solution of time series prediction problems.

1. Introduction

In the past three decades, energy consumption in developing countries has increased more than fourfold and, as expected, it may increase rapidly in the upcoming years. The rapid growth of population and continuous economic development are the main reasons for increasing energy consumption in developing countries. The population is expected to increase by 15% by 2040 [1] in the developing countries, in which the energy consumption will increase rapidly.
According to the Organization of the Petroleum Exporting Countries (OPEC), oil is still the main energy resource. The recent statistics show that oil consumption is estimated to increase from 86.5 mobe/d (million barrel of oil equivalent per day) to 92.3 mobe/d in 2020. It is estimated to increase to 97.9 mobe/d and 100.7 mobe/d in 2030 and 2040, respectively. Coal consumption in 2015, 2020, 2030, and 2040 are expected be 87.8 mobe/d, 80.7 mobe/d, 85.8 mobe/d, and 86.2 mobe/d, respectively. Gas consumption in 2015, 2020, 2030, and 2040 are expected to be 59.2 mobe/d, 65.2 mobe/d, 79.9 mobe/d and 93.2 mobe/d, respectively. Thus, oil can be considered as the main energy resource in the world. Therefore, it is very critical to forecast a country’s oil consumption to fomulate the necessary strategies for the major economic and social problems. From 2015 to 2040, the global population is estimated to increase by 1.8 billion people (from 7.3 billion in 2015 to 9.2 billion in 2040). This increased population will mainly come from developing countries, specifically from Middle East countries, African countries, and India [1].
Oil consumption is a strategic problem because it is not only related to the issue of economic strategies and plans, but the the environmental impact is also a critical issue. It plays a vital role in environmental issues such as air pollution problems and green energy solutions. Many studies have been presented to estimate oil consumption in different countries. Yu et al. [2] presented an online big data driven model to forecast oil consumption by using the power of Google trend. The proposed model contains two steps: the relationship investigation and the prediction improvement. They also used the Granger causality analysis to test the power of Google trend. They concluded that Google trend improves forecasting results. Azadeh et al. [3] presented a Fuzzy regression model for forecasting oil consumption in the US, Japan, Australia, and Canada. They used the analysis of variance method to select the conventional regression or fuzzy regression to estimate the future demand. Their proposed method achieved the minimum absolute percentage error. Li et al. [4] used a combination of artificial intelligence algorithms to predict oil consumption in China. They concluded that the combination model outperforms traditional forecasting models in terms of performance and forecasting results.
Moreover, the Adaptive Neuro-Fuzzy Inference System (ANFIS) has received more attention since it is a universal model and a hybrid intelligent system, which combines the learning and modeling power of the fuzzy inference system (FIS), and neural networks into an adaptive inference system. Furthermore, ANFIS outperforms nonlinear mathematical prediction models, such as those in [5,6]. Therefore, ANFIS can be applied to more advanced applications such as recommender systems [7] and image segmentation [8]. Moreover, ANFIS has been successfully applied to several time series prediction applications such as water consumption prediction [9], used cars price prediction [10], water treatment [11], forecasting the success of tourism services [12], and wind power forecasting [13]. Yurdusev et al. [9] used several predicting methods including ANFIS to forecast water consumption. Wu et al. [10] proposed an ANFIS forecasting model for used cars prices. The proposed model was compared to a neural network model and the evaluation results showed that ANFIS had more possibilities to predict used car prices. Mandal et al. [11] presented an ANFIS based forecasting method for the removal of Hexavalent chromium and arsenite from water. The proposed method achieved good accuracy with small average absolute relative percentage error. Atsalakis et al. [12] presented an ANFIS model to forecast the success of tourism services. They collected data through a questionnaire related to tourism services development. The evaluation results show that ANFIS provided an intelligent way to find the relationships of input and output variables that improved forecasting results. Liu et al. [13] proposed a combination model of ANFIS and neural network to forecast wind power in China. The evaluation showed that the combination model outperforms traditional forecasting models.
However, ANFIS is influenced by the approaches that are used to learn its parameters. The consequent and premise parameters are the two sets of ANFIS adjustable parameters. Some methods have been employed to determine the optimal parameter values of ANFIS such as the least square method (LSM). However, LSM can get stuck at a local optimal point. Thus, a hybrid between LSM and back-propagation (BP) is presented [14].
Recently, meta-heuristics (MH) algorithms have been used to train ANFIS parameters such as Particle Swarm Optimization (PSO) [15], Genetic Algorithm (GA) [16], and Sine–Cosine Algorithm (SCA) [17].
In [15], a PSO model is adopted to train ANFIS to forecast the biochar yield. However, the main drawback of PSO is its sensitivity to neighborhood topology. In [16], a modified GA is used to optimize the modeling parameters for membership functions and fuzzy rules in ANFIS. However, GA suffers from its slow convergence speed.
In [17], an SCA method is presented to train the ANFIS model to build an oil consumption prediction model. Although SCA outperforms GA and PSO, it has some drawbacks such as its exploration ability is higher than its exploitation in the search domain. Moreover, the No Free Lunch (NFL) theorem [18] assumes that no optimization approach can be applied to solve different problems with the same accuracy. In the same context, the Multi-verse Optimizer (MVO) is an MH algorithm [19]. Three basic concepts inspired MVO: white hole, black hole, and wormhole. These three concepts are improved to enhance exploration, exploitation, and local search, respectively. As described in [19], MOV outperformed several optimization algorithms in five real engineering problems. Therefore, MVO has been successfully applied in different applications. Faris et al. [20] employed MVO to select the optimal features and to optimize the parameters of the Support Vector Machine (SVM) algorithm. They found that, by applying MVO, the number of features is reduced but the prediction is still high. Wang et al. [21] also applied MVO to optimize the parameters of SVM to build a prediction model for energy consumption in China. In this paper, we present an oil consumption forecasting model, namely MVO-ANFIS. The proposed method leverages the power of ANFIS to make the prediction and the power of MVO to select the accurate parameters. MVO is employed for optimizing ANFIS parameters to improve ANFIS prediction performance. The MVO-ANFIS method was evaluated by forecasting oil consumption in two countries: Korea and Italy. Moreover, MVO-ANFIS was compared to other modified ANFIS models, such as SCA-ANFIS, PSO-ANFIS, GA-ANFIS, and Whale Optimization Algorithm (WOA-ANFIS).
The main contribution of this study can be summarized as follows:
  • We present a novel time series prediction model, namely MVO-ANFIS. To the best of our knowledge, this is the first study that applies MVO for optimizing ANFIS.
  • The proposed model was employed to forecast oil consumption in two countries and achieved a robust prediction result.
  • We compared the proposed method with other modified ANFIS models, and the proposed method outperformed them in prediction result and speed.
The paper is organized as follows. Section 2 presents the basic structure of the MVO-ANFIS algorithm. Section 3 describes the dataset and experiments. The evaluated results and the conclusion are described in Section 4 and Section 5, respectively.

2. Preliminaries

2.1. Adaptive Neuro-Fuzzy Inference System

The Adaptive Neuro-Fuzzy Inference System (ANFIS) model is introduced in [22] as a modification of traditional neural networks (NN) by combining it with fuzzy logic. Additionally, this model produces a nonlinear map between the input and output using the fuzzy IF-THEN rules. Basic ANFIS model is given in Figure 1, in which there are two inputs x and y and the output is out. The ANFIS model has five layers, each with a specific task. The first layer receives the x and y and computes the output of each node ( O 1 i ) using the generalized Gaussian membership functions ( μ ) as follows:
O 1 i = μ A i ( x ) , i = 1 , 2 , O 1 i = μ B i 2 ( y ) , i = 3 , 4
μ ( x ) = e ( x ρ i α i ) 2 ,
In Equation (1), the two parameters ρ i and α i are the premise parameters set. A i and B i are the membership values of μ . The next process in ANFIS is to compute the output of each node in the second layer (the firing strength of a rule) using Equation (3):
O 2 i = μ A i ( x ) × μ B i 2 ( y )
Thereafter, the node in the third layer (normalized firing strength) computes its output using Equation (4):
O 3 i = w ¯ i = ω i ( i = 1 ) 2 ω i ,
The adaptive nodes in the fourth layer compute their output depending on the O 3 i as:
O 4 , i = w ¯ i f i = w ¯ i ( p i x + q i y + r i )
In Equation (5), the parameters r i , q i , and p i are the consequent parameters of the ith node. The output of the ANFIS o u t is calculated as:
O u t = i w ¯ i f i

2.2. Multi-Verse Optimizer Algorithm

In [19], the Multi-verse Optimizer (MVO) is introduced as a meta-heuristic algorithm inspired by the multi-verses theory in physics. The MVO algorithm simulates the theory’s depiction of the interplay among universes depending on the concept of moving objects between them through white holes, black holes and wormholes. The mathematical model of the MVO algorithm can be defined by considering N universes and the jth object of the ith universe ( x i j , i = 1 , 2 , . . . , N ) can be updated as [19]:
x i j = x k j i f r 1 < N F ( x i ) x i j o t h e r w i s e
where x k j is the jth object of the kth universe, which is selected using the roulette wheel mechanism; r 1 [ 0 , 1 ] is a random value; and N F ( x i ) represents the normalized fitness value of the ith universe. According to the wormholes, the objects of each universe can be updated as defined in Equation (8):
x i j = Y i j r 2 < W E P x i j r 2 W E P
where
Y i j = x j b + T D R × ( ( u b j l b j ) × r 4 + l b j ) r 3 < 0 . 5 x j b T D R × ( ( u b j l b j ) × r 4 + l b j ) r 3 0 . 5
with x j b the best solution at the jth object, and l b j the lower bound and u b j the upper bound of at the dimension j. The parameters r 2 , r 3 , , and r 4 represent random numbers. Meanwhile, T D R is the coefficient of the traveling distance rate to allow objects to move to x b through a wormhole and it is defined as:
T D R = 1 i t e r 1 / p m a x _ i t e r 1 / p
where i t e r is the current iteration, m a x i t e r is the total number of iterations, and the parameter p = 6 , which is used to control the exploitation ability.
Meanwhile, W E P is the wormhole existence probability, which is increased linearly over repetitions and defined as:
W E P = W E P m i n + i t e r × W E P m a x W E P m i n m a x i t e r
where W E P m i n and W E P m a x represent constant values set to 0.2 and 1, respectively. The steps of MVO algorithm are illustrated in Algorithm 1.
Algorithm 1 Multi-verse Optimizer (MVO) algorithm
1:
Input: the population size (N)and the maximum number of iterations ( m a x _ i t e r ).
2:
Set the initial value for W E P , T D R , and i t e r .
3:
Generate a random universes X and save its sorted value in S U .
4:
repeat
5:
 Calculate the fitness of each x i .
6:
 Compute the normalization of the fitness values of the universes ( N I ).
7:
 Determine the best solution x b which has the best fitness value.
8:
for i = 1 : N do
9:
  Update W E P and T D R using Equations (11) and (10), respectively.
10:
   B l a c k _ h o l e _ i n d e x = i ;
11:
  for j = 1 : D i m do
12:
   generate random value r 1 from the interval [0, 1];
13:
   if r 1 < N I ( x i ) then
14:
     W h i t e _ h o l e _ i n d e x = R o u l e t t e W h e e l S e l e c t i o n ( N I ) ;
15:
     x B l a c k _ h o l e _ i n d e x j = S U W h i t e _ h o l e _ i n d e x j
16:
   end if
17:
   generate random value r 2 , r 3 and r 4 from the interval [0, 1];
18:
   Update x i j using Equation (8) based on the value of r 2 , r 3 and r 4 .
19:
  end for
20:
end for
21:
i t e r = i t e r + 1 .
22:
until i t e r < m a x i t e r
23:
Return: X b .

3. The Proposed Method

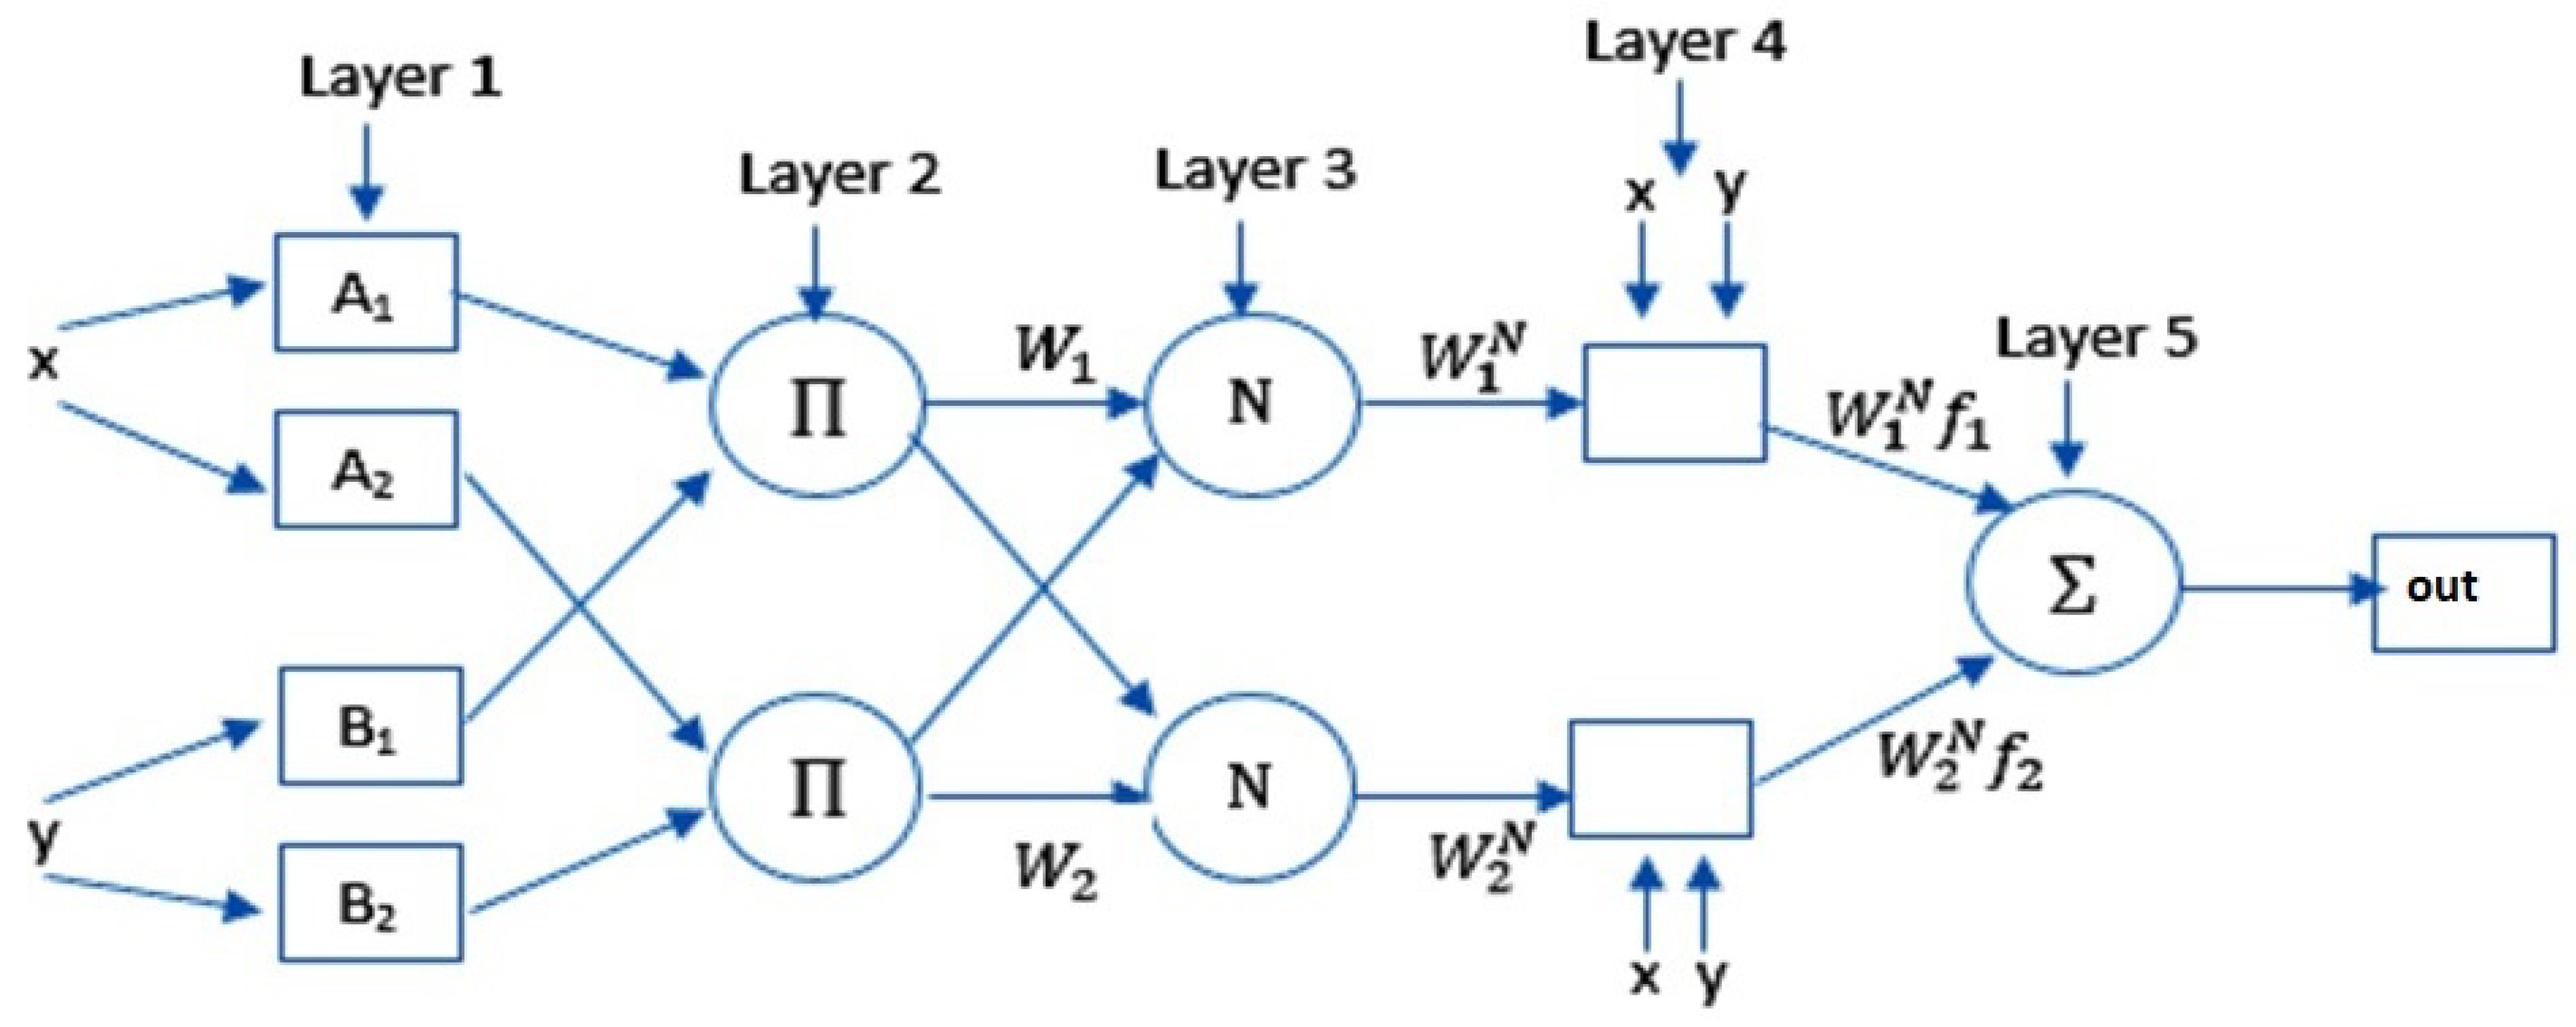
The proposed oil consumption forecasting model based on the modified ANFIS model using MVO is introduced in this section. The proposed MVO-ANFIS approach aims to find the set of ANFIS’s parameters using MVO that leads to minimizing the RMSE between the target and its prediction. The structure of MVO-ANFIS is similar to the traditional ANFIS model, which contains five layers, as discussed in Section 2.1. The first layer aims to receive the historical consumption of the oil then its output to the second layer. The nodes in the second layer compute their output using Equation (3) and the fuzzy logic rules at the third layer compute the output of this layer using Equation (4). Meanwhile, the Takagi–Sugeno–Kang model is used in the fourth layer by using the consequent parameters. The last layer computes the prediction of oil consumption using Equation (5). The MVO-ANFIS model starts by preprocessing the historical oil consumption by using the auto-correlation function (ACF) to determine the suitable features for using them during the forecasting process. The next step is to randomly split the dataset into training and testing, which represent 70% and 30% of the dataset, respectively. Then, MVO-ANFIS, using the fuzzy c-mean, selects the suitable number of membership functions by clustering the dataset into different groups. Thereafter, MVO (as discussed in Section 2.2) is used to find the two types of ANFIS parameters through considering a set of solutions, each of them representing a different ANFIS model. To evaluate the quality of each solution, the Root Mean Square Error (RMSE) is used, as defined in the following equation:
F i t i = i = 1 N ( T i P i ) 2 N
where T and P represent the actual training oil consumption and its prediction value, respectively. Thereafter, the best solution is determined, which has the smallest fitness value ( F i t b ). This best solution represents the optimal ANFIS model at the current iteration. Then, other solutions are updated based on this solution and this process is repeated until reaching the maximum number of iterations, which represents the stop condition. The next step in MVO-ANFIS is to test the quality of the best ANFIS model by applying the testing set and evaluate the prediction value using a set of measures. The last step in MVO-ANFIS is to predict oil consumption (forecasting process) for the next month. The stages of the proposed model are given in Figure 2.

4. Experiment

The proposed method MVO-ANFIS was evaluated by forecasting oil consumption in two countries: Korea and Italy. The description of the dataset and the setting of all experiments are given. In addition, the results of MVO-ANFIS were compared with original ANFIS, PSO-ANFIS, GA-ANFIS, WOA-ANFIS, and SCA-ANFIS. In addition, Wilcoxon’s test was applied.

4.1. Dataset Description

The dataset contains real data of oil consumption in Korea and Italy. The dataset was retrieved from The U.S. Energy Information Administration, which records monthly the number of oil barrels consumed by those countries (in thousands) during the 10 years from September 2007 to August 2017. Figure 3 and Figure 4 illustrate these data over months.
Korea oil consumption varied from 1982 to 2842 thousand barrels, whereas in Italy the consumption varied between 1107 and 1797 thousand barrels.

4.2. Performance Measures

The performance of the proposed method was evaluated by four measures: Mean Absolute Error (MAE), Root Mean Square Error (RMSE), Root Mean Squared Relative Error (RMSRE), and Mean Absolute Percentage Error (MAPE). The definitions of these measures are given in Table 1. In these measures, the lowest value is the best value.
In Table 1, P is the predicted value, T denotes the target value, and N s defines the size of the sample.

4.3. Parameter Settings

The experimental setting of all algorithms’ parameters is presented in Table 2.
The global parameters setting were set to 25 for the population size, 100 for iterations number, and −5 and 5 for the upper and the lower limits, respectively. The algorithms were evaluated during 20 independent runs and the average was taken. These values were chosen based on their good performance in previous studies (e.g., [17,23,24,25,26,27]).

4.4. Results and Discussion

The forecasting results of the oil consumption of Korea and Italy are listed in Table 3 in terms of MAE, RMSE, MAPE, and RMSRE, while the forecasted values for 12 months are shown in Table 4.
Table 3 shows that the results of the proposed method MVO-ANFIS in forecasting Korea’s oil consumption outperformed the other methods in all measures. GA-ANFIS ranked second followed by PSO-ANFIS, WOA-ANFIS, and SCA-ANFIS, respectively, while ANFIS came in last. For Italy’s oil consumption, Table 3 shows the superiority of MVO-ANFIS, which ranked first in all measures. In terms of RMSE and RMSRE, SCA-ANFIS is ranked second followed by PSO-ANFIS, GA-ANFIS, and WOA-ANFIS, respectively, while the original ANFIS ranked last. In terms of MAE and MAPE, GA-ANFIS is ranked second followed by SCA-ANFIS, PSO-ANFIS, WOA-ANFIS, and ANFIS, respectively.
In general, MVO-ANFIS improved the original ANFIS 14% and 25% in Korea and Italy, respectively, based on the results of RMSE measure. Figure 5 illustrates the forecasting RMSE values of all algorithms in Korea and Italy.
The results of MVO-ANFIS for Korea and Italy in forecasting the new consumption for the 12 months from September 2017 to August 2018 are listed in Table 4. In this table, we can notice that the forecasted values seem to be similar to the observation values, which can be trusted. Moreover, Figure 6 and Figure 7 illustrate the real consumption values and the forecasted values of MVO-ANFIS for Korea and Italy, respectively. In these figures, the last 12 values show the forecasted curve of oil consumption.

4.5. Statistical Analysis

To evaluate the performance of MVO-ANFIS, Wilcoxon’s test was applied to test if there was a significant difference between MVO-ANFIS and the other methods. Since it does not suppose the normality of the dataset, when the parametric test (such as t-test) is not suitable, Wilcoxon’s test can be used. However, to use Wilcoxon’s test, three assumptions must be checked. In the first assumption, the dependent variable must be measured at a continuous (or ordinal) level. Moreover, the independent variable must contain two categories (i.e., “matched pairs” or “related groups”). In this study, related groups were used, which refers to the same cases being used in the two groups. The third assumption supposes that the distribution of the differences between the two related groups is symmetrical. This test was calculated using RMSE and MAPE measures with a significant threshold equal to 0 . 05 ; therefore, there is a significant difference if p-value < 0.05 and MVO-ANFIS improved ANFIS more than other methods. Table 5 shows the results of the test. These results indicate that, in terms of Korean data, MVO-ANFIS has significant differences with ANFIS, PSO-ANFIS, WOA-ANFIS, and SCA-ANFIS, whereas, there are no significant differences with GA-ANFIS. In terms of Italian data, MVO-ANFIS has significant differences with all methods except for PSO-ANFIS. In general, MVO-ANFIS was able to effectively forecast the oil consumption for both countries.

5. Conclusion and Future Work

This paper proposes an alternative forecasting approach for time series of oil consumption. The proposed method depends on a modified version of the Adaptive Neuro-Fuzzy Inference System (ANFIS) using the Multi-verse Optimizer algorithm (MVO). The proposed MVO-ANFIS combines the main advantages of the ANFIS model as a regression model and MVO as global optimization meta-heuristic algorithm. The main aim of using MVO is to search about the suitable parameters of the ANFIS using a set of training historical oil consumption, and then applying the best model, which has the smallest fitness function (i.e., RMSE), to the testing set. To assess the quality of the proposed forecasting MVO-ANFIS, the dataset of oil consumption from two different countries was used. Moreover, the results of MVO-ANFIS were compared with ANFIS, PSO-ANFIS, GA-ANFIS, WOA-ANFIS, and SCA-ANFIS. From the experiment results and statistical analysis, the high quality of MVO-ANFIS over other methods can be observed. From the promising accuracy of the MVO-ANFIS method for predicting the historical oil consumptions, it can be used in many other fields, for example: (1) quantity structure adaptive regression (QSAR) model; (2) yield production/consumption; and (3) solar radiation.

Author Contributions

Formal analysis, M.A.A.A.-q., M.A.E. and A.A.E.; Funding acquisition, X.C.; Methodology, M.A.A.A.-q., M.A.E. and A.A.E.; Supervision, X.C.; Validation, M.A.E.; Visualization, A.A.E.; Writing—original draft, M.A.A.A.-q.; and Writing—review and editing, X.C.

Funding

This research was supported by the National Key R&D Program of China (No. 2018YFC1604000).

Conflicts of Interest

The authors declare no conflict of interest.

References

  1. OPEC. 2017 OPEC World Oil Outlook. 2017. Available online: http://www.opec.org (accessed on 1 May 2018).
  2. Yu, L.; Zhao, Y.; Tang, L.; Yang, Z. Online big data-driven oil consumption forecasting with Google trends. Int. J. Forecast. 2019, 35, 213–223. [Google Scholar] [CrossRef]
  3. Azadeh, A.; Khakestani, M.; Saberi, M. A flexible fuzzy regression algorithm for forecasting oil consumption estimation. Energy Policy 2009, 37, 5567–5579. [Google Scholar] [CrossRef]
  4. Li, J.; Wang, R.; Wang, J.; Li, Y. Analysis and forecasting of the oil consumption in China based on combination models optimized by artificial intelligence algorithms. Energy 2018, 144, 243–264. [Google Scholar] [CrossRef]
  5. Wang, Y.; Sui, Y.; Wu, J.; Jiao, J. Research on nonlinear model predictive control technology for ship dynamic positioning system. In Proceedings of the 2012 IEEE International Conference on Automation and Logistics, Zhengzhou, China, 15–17 August 2012; pp. 348–351. [Google Scholar]
  6. Kovari, A. Effect of leakage in electrohydraulic servo systems based on complex nonlinear mathematical model and experimental results. Acta Polytech. Hung. 2015, 12, 129–146. [Google Scholar]
  7. Adnan, M.N.M.; Chowdury, M.R.; Taz, I.; Ahmed, T.; Rahman, R.M. Content based news recommendation system based on fuzzy logic. In Proceedings of the 2014 International Conference on Informatics, Electronics & Vision (ICIEV), Dhaka, Bangladesh, 23–24 May 2014; pp. 1–6. [Google Scholar]
  8. Othman, A.A.; Tizhoosh, H.R.; Khalvati, F. EFIS—Evolving fuzzy image segmentation. IEEE Trans. Fuzzy Syst. 2014, 22, 72–82. [Google Scholar] [CrossRef]
  9. Yurdusev, M.A.; Fırat, M.; Turan, M.E.; Gultekin Sinir, B. Neural networks and fuzzy inference systems for predicting water consumption time series. Stoch. Environ. Res. Risk Assess. 2009, 23, 1225. [Google Scholar] [CrossRef]
  10. Wu, J.D.; Hsu, C.C.; Chen, H.C. An expert system of price forecasting for used cars using adaptive neuro-fuzzy inference. Expert Syst. Appl. 2009, 36, 7809–7817. [Google Scholar] [CrossRef]
  11. Mandal, S.; Mahapatra, S.; Patel, R. Neuro fuzzy approach for arsenic (III) and chromium (VI) removal from water. J. Water Process Eng. 2015, 5, 58–75. [Google Scholar] [CrossRef]
  12. Atsalakis, G.S.; Atsalaki, I.G.; Zopounidis, C. Forecasting the success of a new tourism service by a neuro-fuzzy technique. Eur. J. Oper. Res. 2018, 268, 716–727. [Google Scholar] [CrossRef]
  13. Liu, J.; Wang, X.; Lu, Y. A novel hybrid methodology for short-term wind power forecasting based on adaptive neuro-fuzzy inference system. Renew. Energy 2017, 103, 620–629. [Google Scholar] [CrossRef]
  14. Cao, H.; Xin, Y.; Yuan, Q. Prediction of biochar yield from cattle manure pyrolysis via least squares support vector machine intelligent approach. Bioresource Technol. 2016, 202, 158–164. [Google Scholar] [CrossRef] [PubMed]
  15. El Aziz, M.A.; Hemdan, A.M.; Ewees, A.A.; Elhoseny, M.; Shehab, A.; Hassanien, A.E.; Xiong, S. Prediction of biochar yield using adaptive neuro-fuzzy inference system with particle swarm optimization. In Proceedings of the IEEE PES PowerAfrica, Accra, Ghana, 27–30 June 2017; pp. 115–120. [Google Scholar]
  16. Sarkheyli, A.; Zain, A.M.; Sharif, S. Robust optimization of ANFIS based on a new modified GA. Neurocomputing 2015, 166, 357–366. [Google Scholar] [CrossRef]
  17. Al-Qaness, M.A.; Elaziz, M.A.; Ewees, A.A. Oil Consumption Forecasting Using Optimized Adaptive Neuro-Fuzzy Inference System Based on Sine Cosine Algorithm. IEEE Access 2018, 6, 68394–68402. [Google Scholar] [CrossRef]
  18. Wolpert, D.H.; Macready, W.G. No free lunch theorems for optimization. IEEE Trans. Evolut. Comput. 1997, 1, 67–82. [Google Scholar] [CrossRef] [Green Version]
  19. Mirjalili, S.; Mirjalili, S.M.; Hatamlou, A. Multi-verse optimizer: a nature-inspired algorithm for global optimization. Neural Comput. Appl. 2016, 27, 495–513. [Google Scholar] [CrossRef]
  20. Faris, H.; Hassonah, M.A.; Ala’M, A.Z.; Mirjalili, S.; Aljarah, I. A multi-verse optimizer approach for feature selection and optimizing SVM parameters based on a robust system architecture. Neural Comput. Appl. 2018, 30, 2355–2369. [Google Scholar] [CrossRef]
  21. Wang, X.; Luo, D.; Zhao, X.; Sun, Z. Estimates of energy consumption in China using a self-adaptive multi-verse optimizer-based support vector machine with rolling cross-validation. Energy 2018, 152, 539–548. [Google Scholar] [CrossRef]
  22. Jang, J.S. ANFIS: adaptive-network-based fuzzy inference system. IEEE Trans. Syst. Man Cybern. 1993, 23, 665–685. [Google Scholar] [CrossRef]
  23. Ahmed, K.; Ewees, A.A.; El Aziz, M.A.; Hassanien, A.E.; Gaber, T.; Tsai, P.W.; Pan, J.S. A Hybrid Krill-ANFIS Model for Wind Speed Forecasting. In Proceedings of the International Conference on Advanced Intelligent Systems and Informatics, Cairo, Egypt, 24–26 October 2016; pp. 365–372. [Google Scholar]
  24. Ewees, A.A.; El Aziz, M.A.; Hassanien, A.E. Chaotic multi-verse optimizer-based feature selection. Neural Comput. Appl. 2019, 31, 991–1006. [Google Scholar] [CrossRef]
  25. El Aziz, M.A.; Ewees, A.A.; Hassanien, A.E. Whale Optimization Algorithm and Moth-Flame Optimization for multilevel thresholding image segmentation. Expert Syst. Appl. 2017, 83, 242–256. [Google Scholar] [CrossRef]
  26. El Aziz, M.A.; Ewees, A.A.; Hassanien, A.E.; Mudhsh, M.; Xiong, S. Multi-objective Whale Optimization Algorithm for Multilevel Thresholding Segmentation. In Advances in Soft Computing and Machine Learning in Image Processing; Springer: Berlin, Germany, 2018; pp. 23–39. [Google Scholar]
  27. El Aziz, M.A.; Ewees, A.A.; Hassanien, A.E. Multi-objective whale optimization algorithm for content-based image retrieval. Multimed. Tools Appl. 2018, 77, 26135–26172. [Google Scholar] [CrossRef]
Figure 1. The structure of the Adaptive Neuro-Fuzzy Inference System (ANFIS) model.
Electronics 08 01071 g001
Figure 2. The forecasting MVO-ANFIS approach.
Electronics 08 01071 g002
Figure 3. Oil consumption of Korea from September 2007 to August 2017.
Electronics 08 01071 g003
Figure 4. Oil consumption of Italy from September 2007 to August 2017.
Electronics 08 01071 g004
Figure 5. RMSE results of forecasting oil consumption for Korea and Italy.
Electronics 08 01071 g005
Figure 6. Real and forecasting data of Korea’s oil consumptions.
Electronics 08 01071 g006
Figure 7. Real and forecasting data of Italy’s oil consumptions.
Electronics 08 01071 g007
Table 1. The formula of the performance measures.
MeasureFormula
Root Mean Square Error R M S E = 1 N s i = 1 N s ( P i T i ) 2
Mean Absolute Error M A E = 1 N s i = 1 N s | P i T i |
Mean Absolute Percentage Error M A P E = 1 N s i = 1 N s | P i T i P i |
Root Mean Squared Relative Error R M S R E = 1 N s i = 1 N s ( P i T i P i ) 2
Table 2. Parameters setting of the algorithms.
AlgorithmValues
MVO-ANFIS W E P m i n = 0 . 2 , W E P m a x = 1
ANFIS M a x . e p o c h = 100 , E r r . g o a l = 0 ,
I n i t i a l s t e p = 0 . 01 , D e c r e a s e r a t e = 0 . 9 ,
I n c r e a s e r a t e = 1 . 1
GA-ANFIS C r o s s o v e r t y p e = 1 ,
c r o s s o v e r p r o b . = 1 ,
m u t a t i o n p r o b . = 0 . 01
PSO-ANFIS C 1 = 2 , C 2 = 2 , w M i n = 0 . 2 , w M a x = 0 . 9
SCA-ANFIS a = 2
WOA-ANFIS a = 2 , l = 1
Table 3. Forecasting results of all method for Italy’s oil consumption and Korea’s oil consumption.
Korea RMSEMAEMAPERMSRE
Anfis131.4199.613.8220.0493
PSO112.6378.622.9830.0426
GA113.1576.572.8720.0423
WOA114.7678.923.1280.0458
SCA122.386.73.3960.0479
MVO112.4473.112.8670.0422
Italy RMSEMAEMAPERMSRE
Anfis82.4863.495.0370.064
PSO67.3348.813.8240.053
GA67.6844.943.5300.057
WOA72.4554.454.2090.057
SCA62.145.63.6140.050
MVO61.7244.603.4550.049
Table 4. MVO-ANFIS forecasting values of Korean and Italian oil consumption for 12 months (thousand barrels).
Month/YearKoreaItaly
September 20172280.111445.96
October 20172280.111273.87
November 20172280.111363.20
December 20172285.861445.96
January 20182333.021445.96
February 20182338.671360.79
March 20182338.671428.12
April 20182367.221445.96
May 20182367.221416.62
June 20182355.221445.96
July 20182367.221445.96
August 20182367.501412.74
Table 5. Wilcoxon’s test results between MVO-ANFIS and the other algorithms.
CountryANFISPSO-ANFISGA-ANFISWOA-ANFISSCA-ANFIS
Korea0.0000.5080.0110.0000.001
Italy0.0000.0780.0330.0000.049

