Article

Comparison of Microstrip W-Band Detectors Based on Zero Bias Schottky-Diodes

by
Jéssica Gutiérrez
1,
Kaoutar Zeljami
2,
Juan Pablo Pascual
3,*,
Tomás Fernández
3 and
Antonio Tazón
3
1
Erzia Technologies. C/Josefina de la Maza 4 - 2°, 39012 Santander, Spain
2
Information and Telecommunication Systems Laboratory, Université Abdelmalek Essaâdi, Tetouan 93020, Morocco
3
Department of Communications Engineering, University of Cantabria, Edificio I+D+I de Ingenieria de Telecomunicaciones, Plaza de la Ciencia, S/N 39005 Santander, Spain
*
Author to whom correspondence should be addressed.
Electronics 2019, 8(12), 1450; https://doi.org/10.3390/electronics8121450
Submission received: 17 October 2019 / Revised: 20 November 2019 / Accepted: 21 November 2019 / Published: 1 December 2019
(This article belongs to the Section Microwave and Wireless Communications)

Abstract

:
This paper presents and discusses three different low-cost microstrip implementations of Schottky-diode detectors in W Band, based on the use of the Zero Bias Diode (ZBD) from VDI (Virginia Diodes, Charlottesville, VA, USA). Designs are based on a previous work of modeling of the ZBD diode. Designs also feature low-cost, easy-to-use tooling substrates (RT Duroid 5880, 5 mils thickness) and even low-cost discrete SMD components such as SOTA resistances (State Of The Art TM miniaturized surface mount resistors), which are modeled to be used well above commercial frequency margins. Intensive use of 3D EM simulation tools such as HFSS TM is done to support microstrip board modeling. Measurements of the three designs fabricated are compared to simulations and discussed.

1. Introduction

Schottky diodes play an important role in several functions like rectification [1,2], mixing [3,4], and detection in all the range of microwave frequencies up to W band and beyond [4]. The detection of W-band signals (W-band is contained in the interval frequency from 75 GHz to 110 GHz) has become a crucial function for a wide range of applications, particularly related to imaging, radiometry, remote sensing, etc.
Antimony (Sb) heterostructure backward diodes offer superior noise performance and are easy to match to 50 Ohm [5], compared to GaAs Schottky diodes. However, they constitute proprietary technology (HRL: Hughes Research Laboratories, Malibu, CA, USA), which is not always easily accessible, and the Sb diodes are usually not available as discrete components [6]. Moreover, based on our own experience, we have doubts about their robustness in relatively rough assembly processes, with limited guarantees of electrostatic protection. This motivated us to consider microstrip hybrid technology, although its use in W band suffers from major limitations like inherent narrow band behavior of λ/4 lines and self-resonance problems of SMD (Surface Mount Devices) components [5].
Keysight HSCH 9161 and MACOM-Metelics MZBD 9161 diode models are common choices of diodes for hybrid detectors in Ka (Ka-band is contained in the interval frequency from 26.5 GHz to 40 GHz) and Q band (Q-band is contained in the interval frequency from 33 GHz to 50 GHz) [7,8,9], even for mixers [3], but detectors with 9161 devices have even been reported in W-band [10,11,12,13]. Power sensors using zero bias Schottky diodes from ACST (https://acst.de) have been reported in [14]. ZBD (Zero Bias Diodes) Schottky diodes from VDI (Virginia Diodes, Charlottesville, VA, USA) are used for W-band detection in [6,15,16]. In [6], a DC block and a high pass filter are embedded in the input network of the detector on an Al2O3 substrate suitable to implement thin film resistors. In [15], a waveguide to antipodal finline transition precedes the input matching network on Duroid 5880 substrate. In [17], the theoretical foundations of Schottky diode detection are presented and the main devices are reviewed and compared, including 9161 and VDI ZBD diodes, discussing their different characteristics. Implementation of W band detectors has been proposed in other technologies like 65 nm CMOS [18] and SiGe HBTs [19]. Self-Switching Diodes (SSD) fabricated with GaN have been proposed up to 200 GHz [20] and even 130 nm CMOS Schottky diodes have been proposed to operate at 280 GHz [21]. We have referred here to applications in the sub THz range, but when entering in the THz range and considering special applications (scientific, astronomical, etc. where there are no cost restrictions) diversity of technologies compete with Schottky diodes (micro-bolometers, Goolay cells, KIDs, etc.) [22,23]. To provide an overview of diode technology performance, in Table 1 common figures of merit of W band detectors are summarized (detailed definitions will be further provided).
In the present article, we focus on low-cost solutions in the low end of THz presenting three different detectors in W-band, which have been designed and measured. VDI ZBD device’s circuit models obtained using the procedures described in [24] and particularly in [25] have been employed for the simulations. One of the designs uses a SOTA resistor, which requires careful modeling because W band is well beyond the commercially specified band. The other two designs use microstrip lines to provide the required impedances. The comparison between the three different versions is presented. These proposed designs constitute a trade-off considering performance, robustness and general costs including, tooling, fabrication, availability of devices, etc.
In Section 2, ZBD diode and discrete resistance models are detailed. The modeling of the discrete resistance becomes quite relevant as it plays a role in the matching network. In Section 3, the three detector designs are described and in Section 4 measurements are compared to simulated results, including a comparison of figures of merit with some of the given references. Finally, some conclusions are drawn in Section 5. In Appendix A the referred diode manufacturers are listed.

2. ZBD and Discrete Resistance Modeling

The following circuit model (Figure 1) obtained using the procedures exhaustively described in [24,25] have been employed for the simulations with the ZBD.
The resulting model parameters are listed in Table 2.
About the resistors, as an alternative to the use of thin film printed resistors in microstrip circuits [6] and at an overall lower cost, discrete resistances are available for use in hybrid circuits operating at high frequencies. Nevertheless, the guaranteed operation frequency ranges are limited to 40 GHz [26]. To explore suitability of such components to be used at higher frequencies (i.e., W band) providing matching and DC return, a modeling procedure was carried out and compared with previous models up to Ka band.
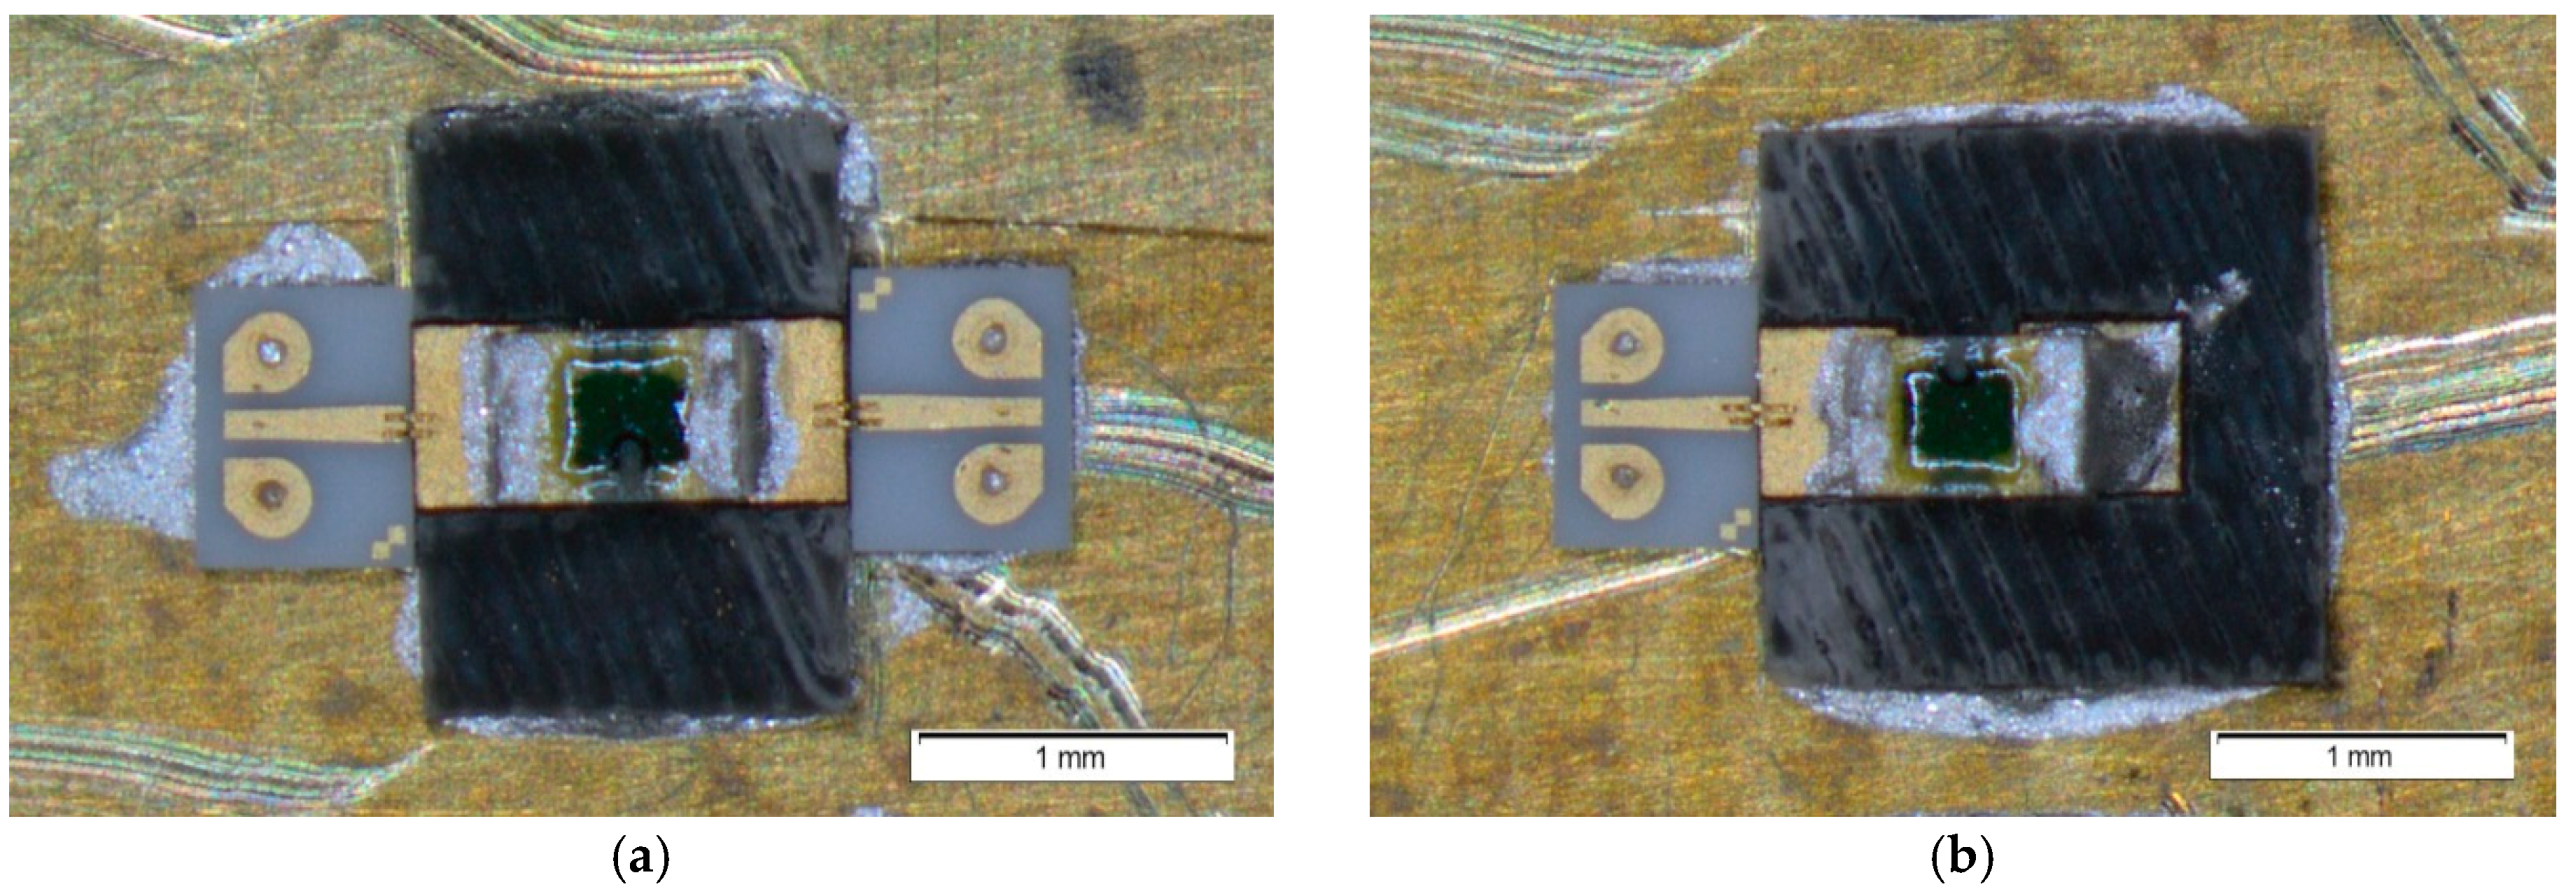
For the first version of the detector, as will be detailed in Section 3, a 51 Ω resistor (SOTA S0302AP500JG) was included in the input matching network, using a previously available model valid up to 50 GHz, but which was not accurate enough up to 110 GHz, where the parasitic effects altered the resistance behavior. In this sense, it is worth noting that the modeling task of the discrete resistance requires special dedication, knowing it will be used well above the manufacturer-defined ranges. Two different assemblies were developed, as can be seen in Figure 2a one assembly with the resistance in series connected to two commercial coplanar-to-microstrip adapters (5-mil thickness J-Micro PP0503) and the other assembly (Figure 2b), with the resistance with one access connected to one commercial coplanar-to-microstrip adapter and the other access connected to ground. This second configuration is the same as the one used in the first version of the detector.
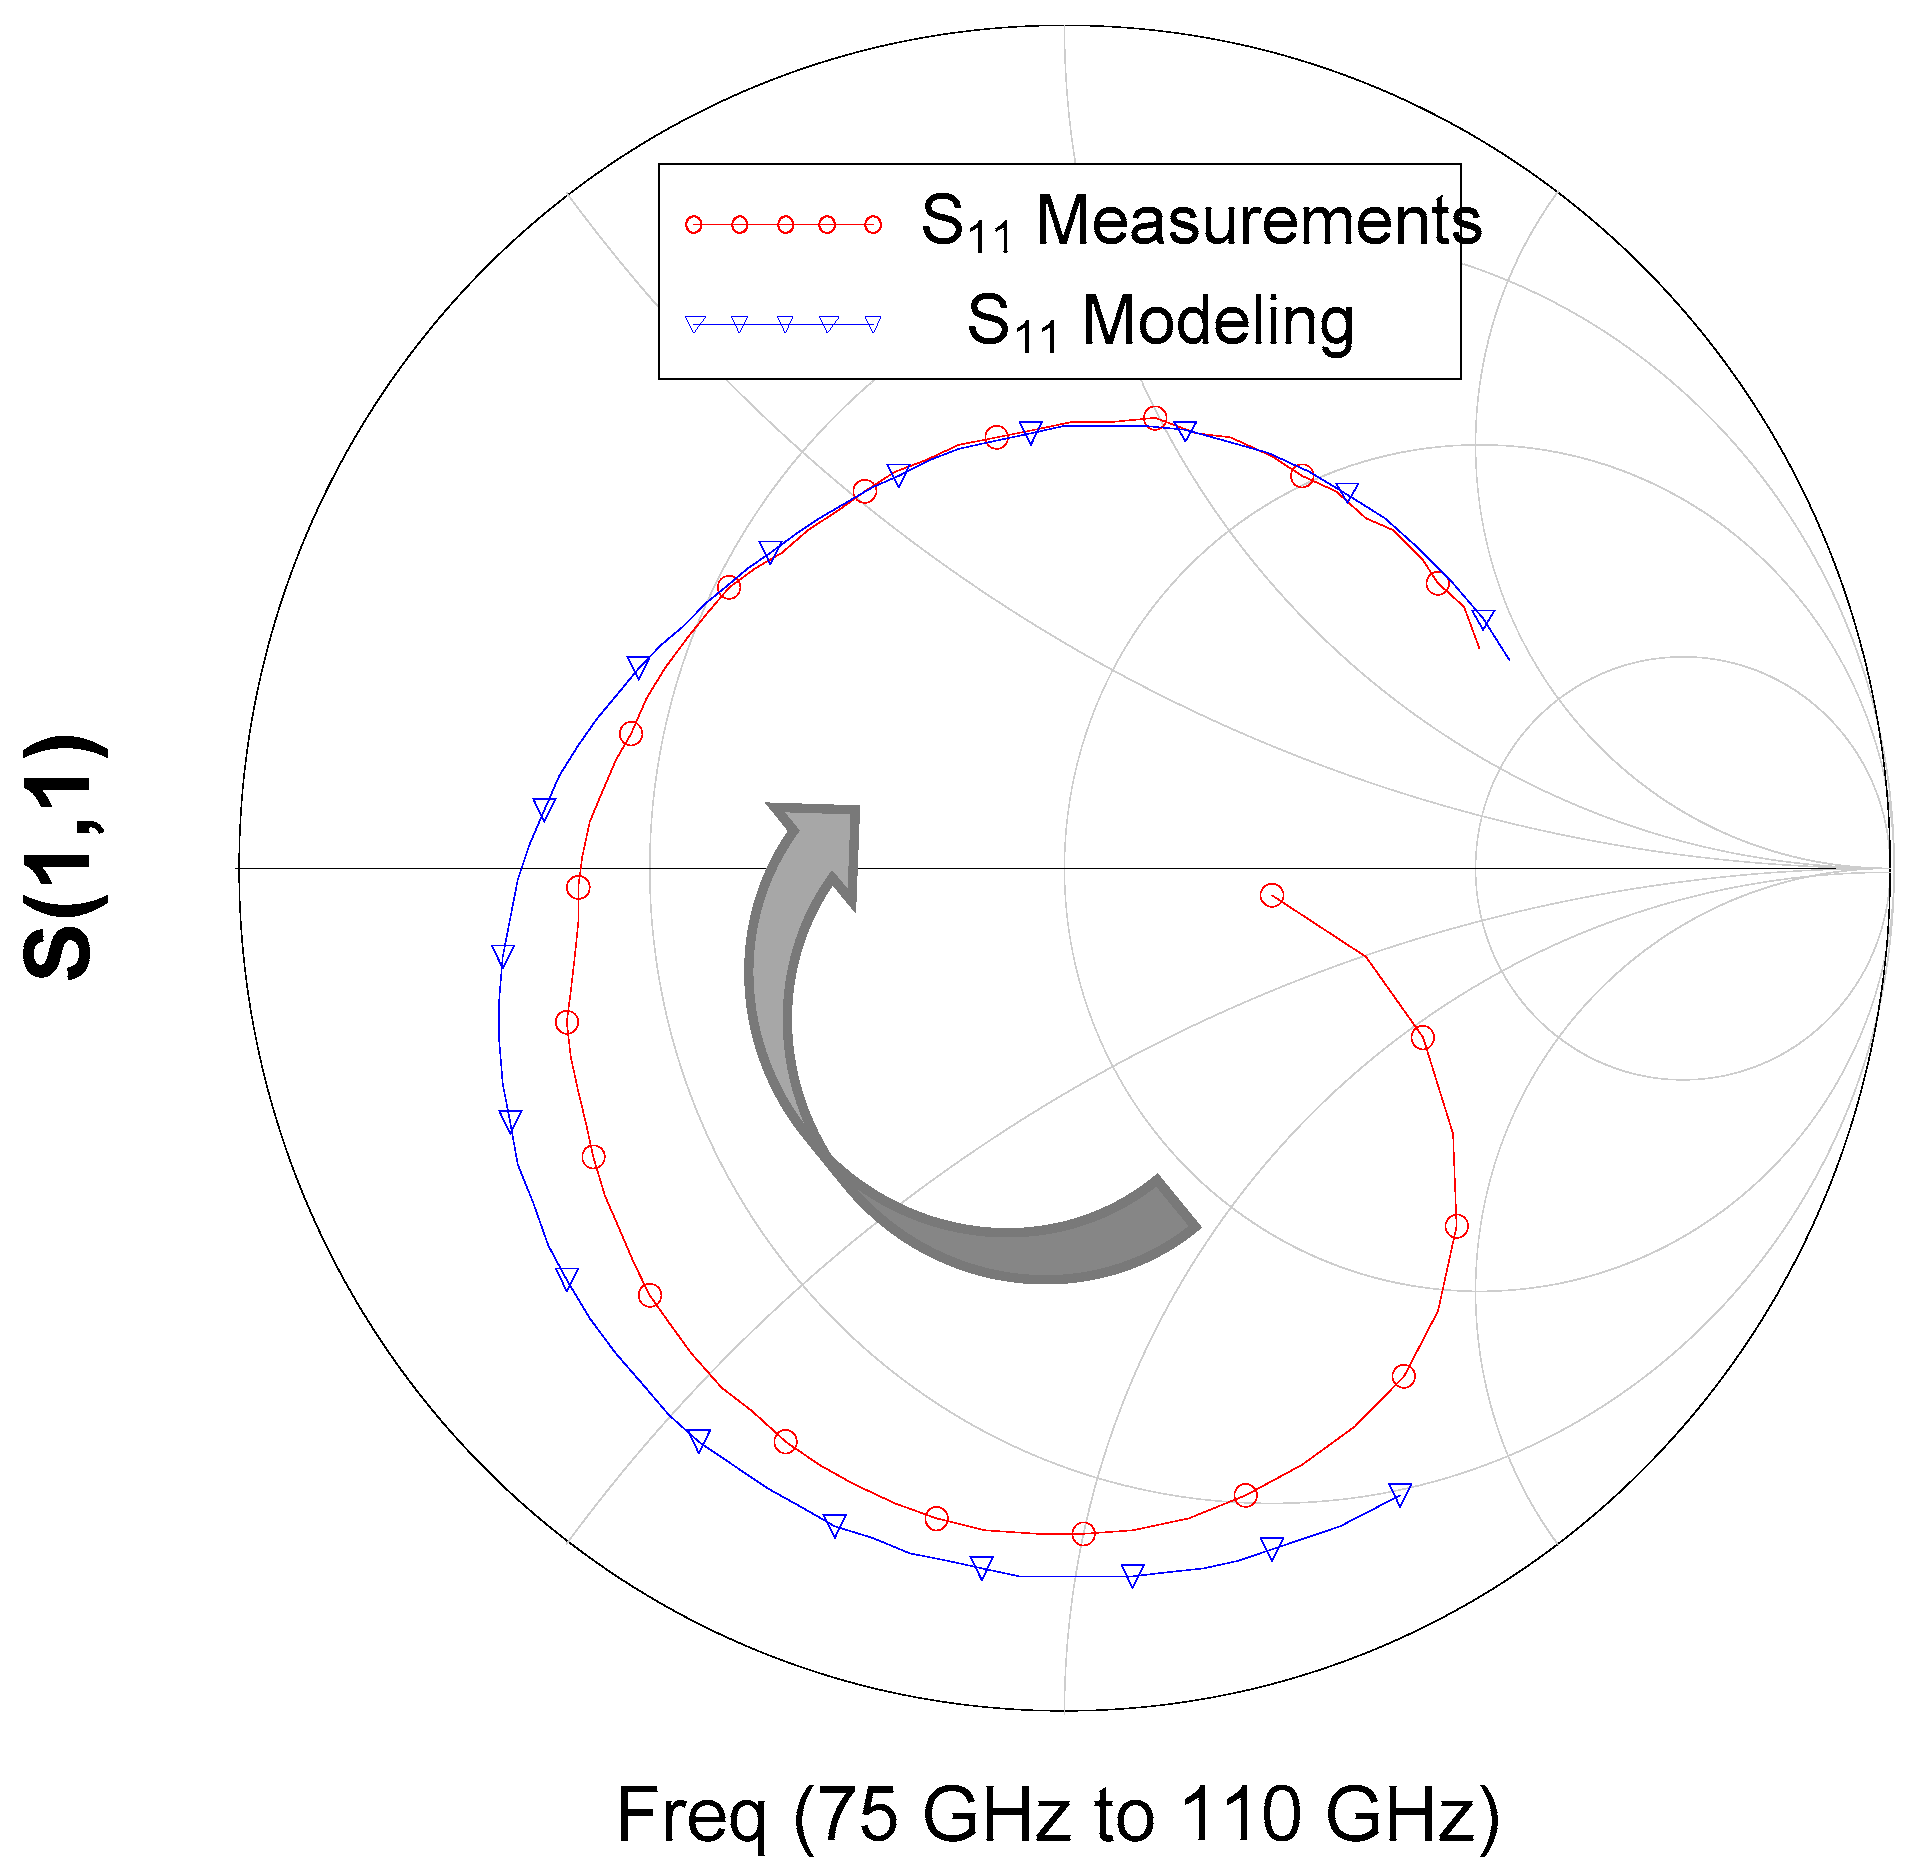
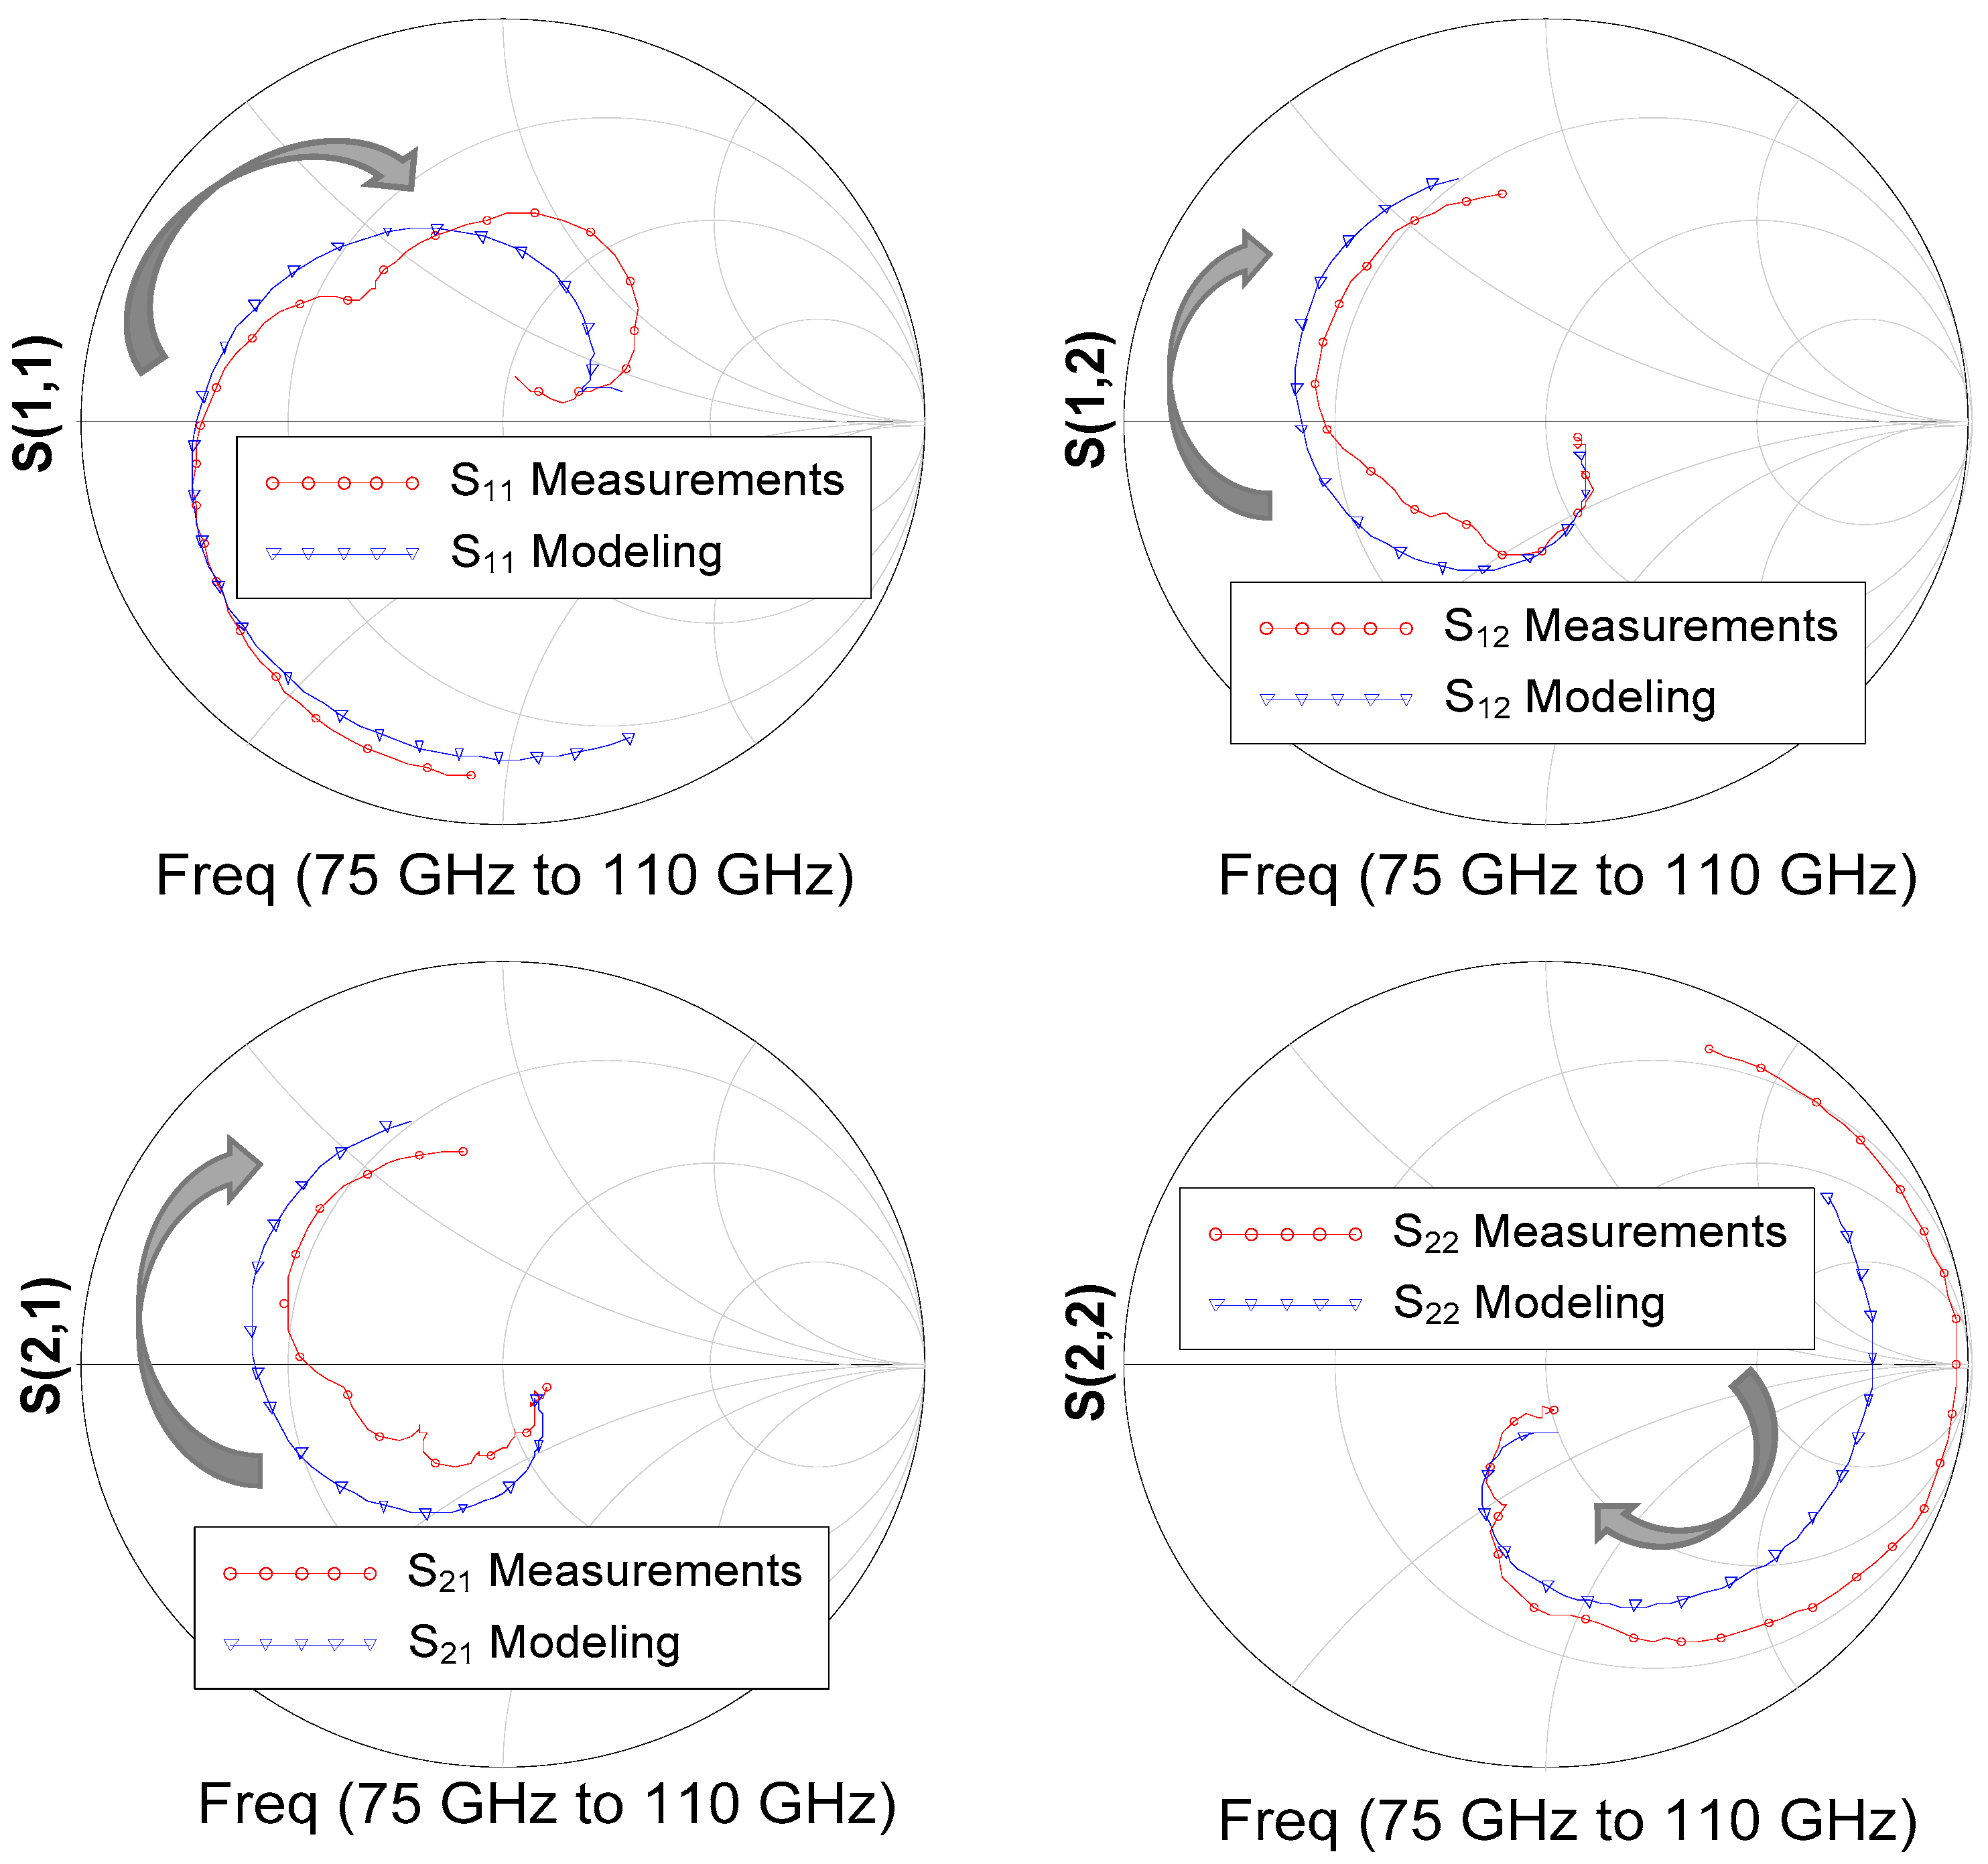
Next, comparisons between on-wafer measurements and simulations using the proposed model in each assembly are shown (see Figure 3 and Figure 4), showing a reasonably good agreement between them, particularly in the high part of the band in Figure 3, and averaged in Figure 4, thus validating the final model. It is worth mentioning that simultaneous optimization of grounded and series resistors with different weights was done, and that the bonding wires and microstrip lines were included according to the assembly used, simulating the grounding effect as an inductance in series with a resistance, introducing additional uncertainty.
From the experimental measurements performed, the final model was obtained, validating simultaneously the optimizations for both assemblies. In Figure 5, the obtained model is depicted, where the parasitic effects present at these high frequencies have been included.
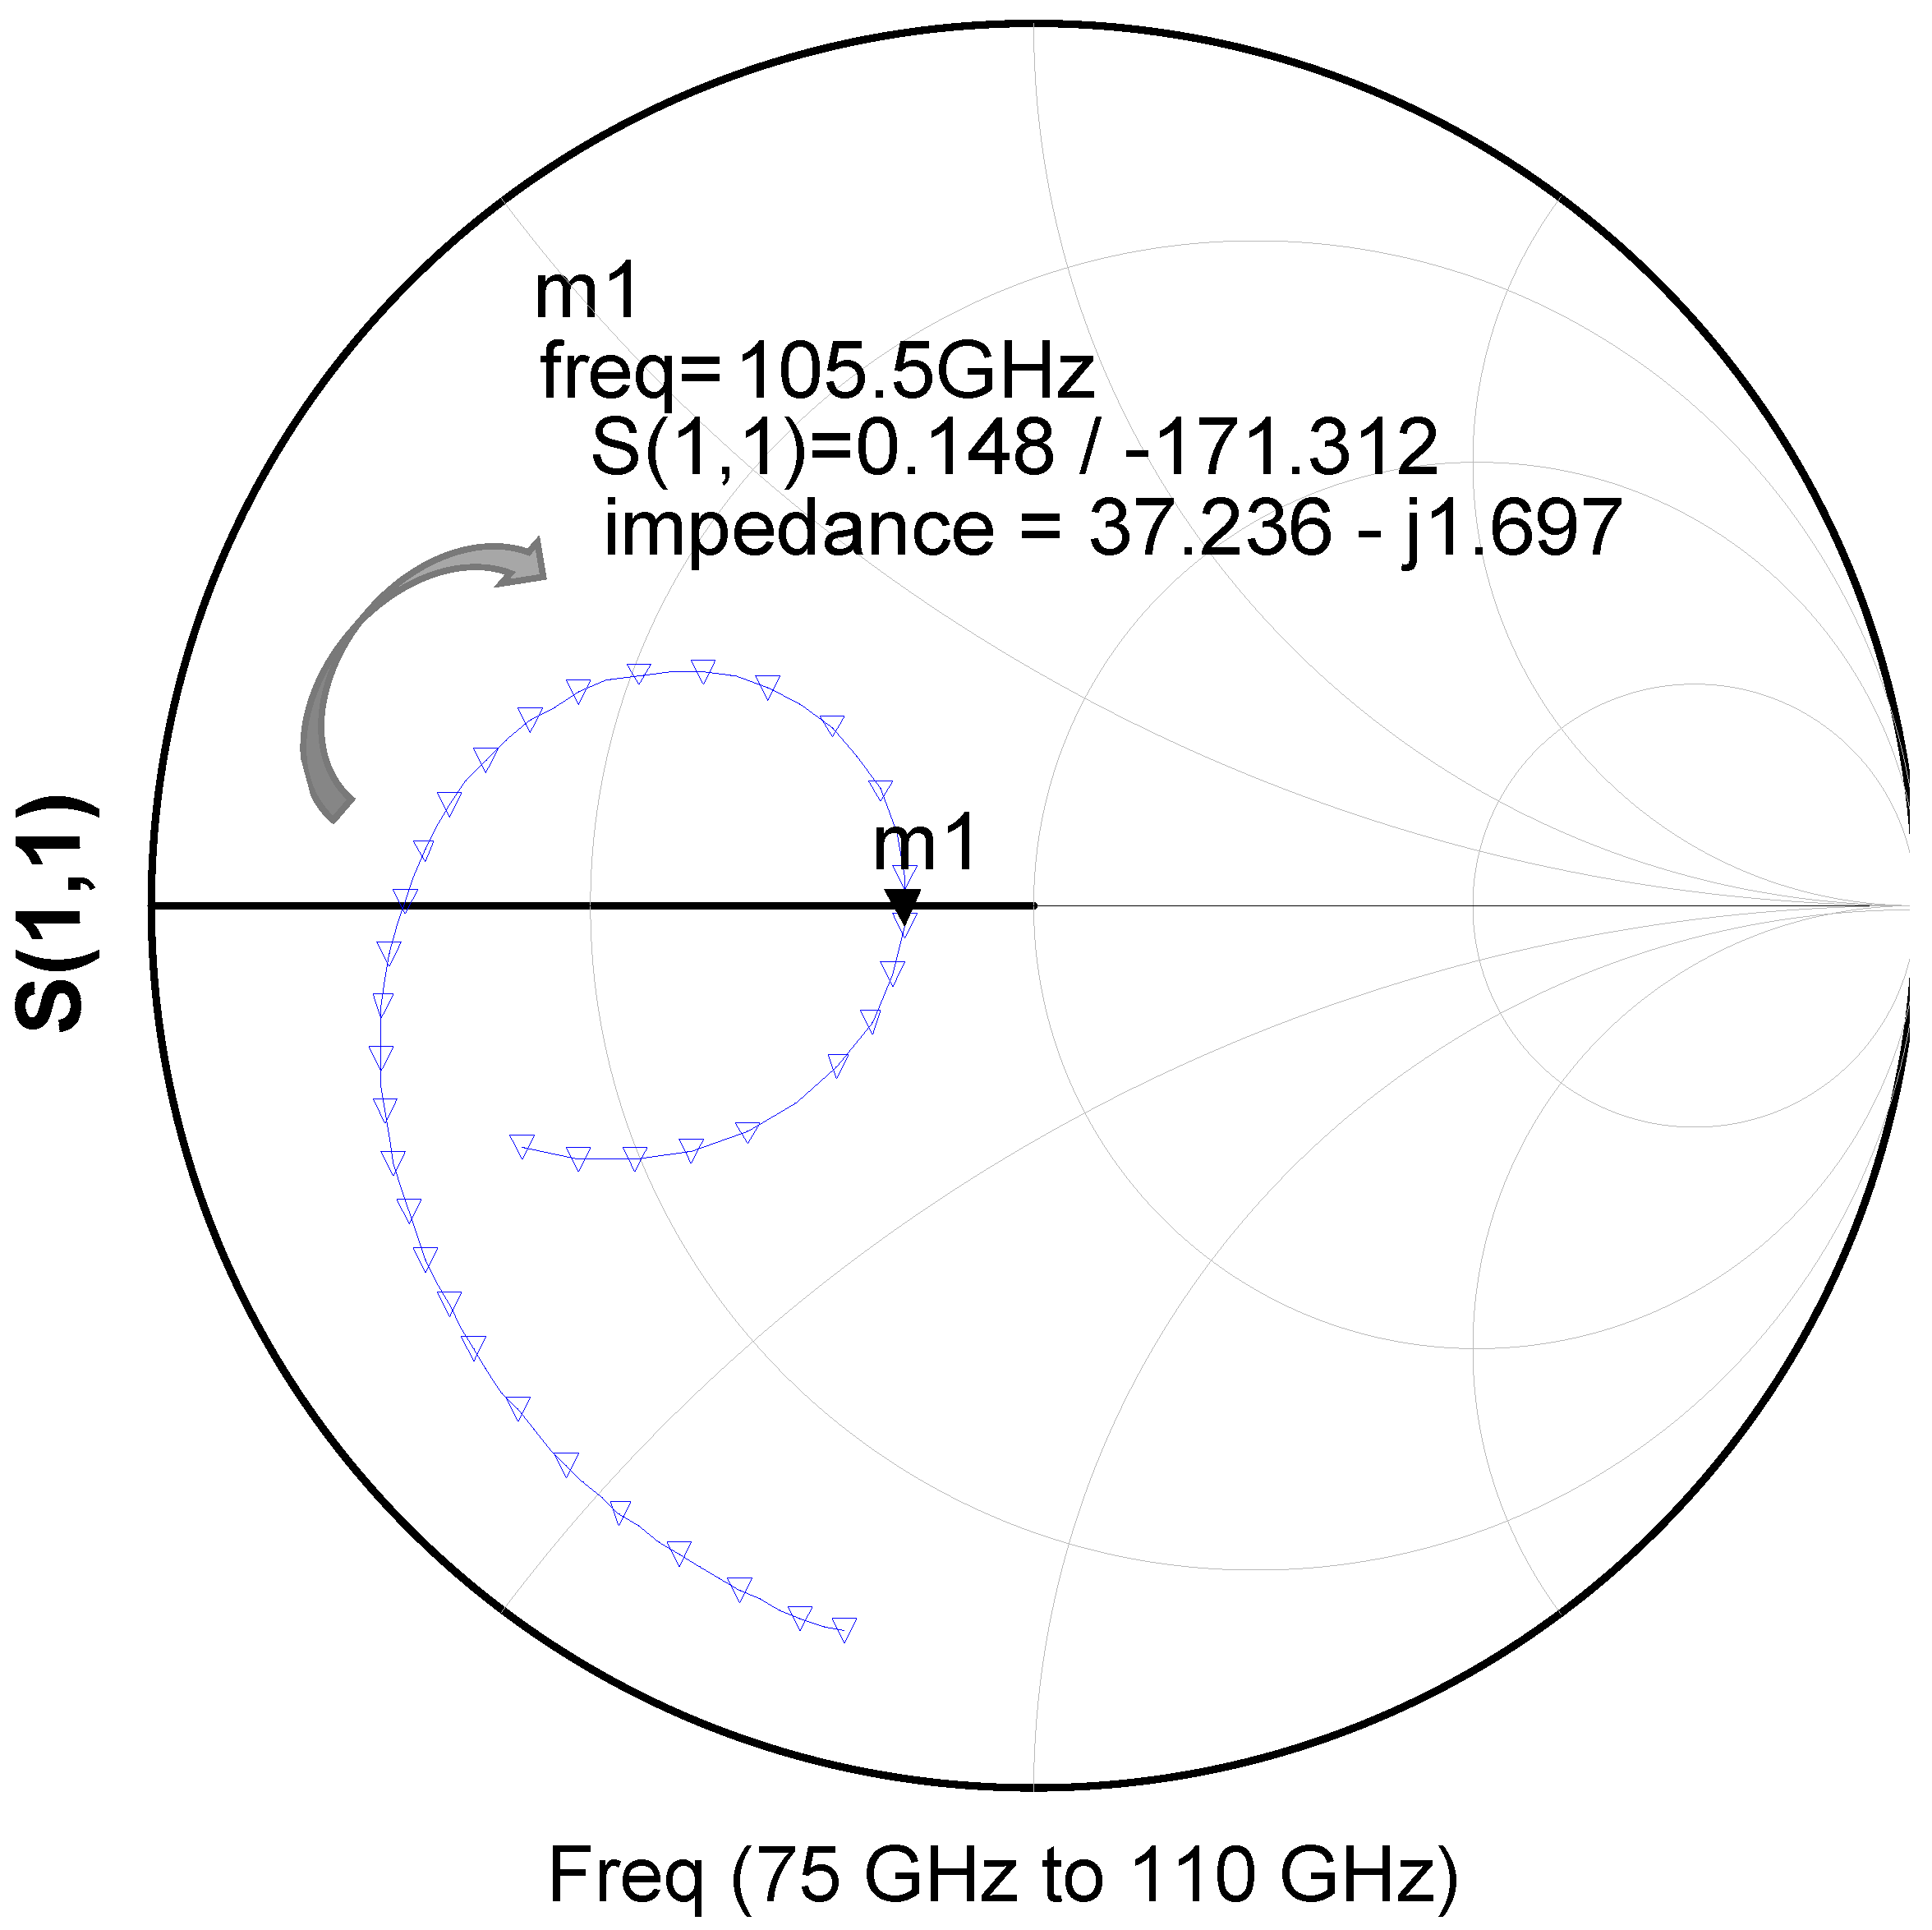
If we de-embed the external effects of the assembly and plot the reflection coefficient of the grounded pure resistor, it can be observed that the stand-alone resistance is expected to present a value lower than the nominal one, far from 50 Ω, as is shown in Figure 6.

3. Detector Designs

Figure 7 shows the block diagram of a zero-bias-diode-based detector. Detector structure is based in three main sections: a diode in series configuration which is the key component of any RF detector circuit, the RF input matching network (including DC return path, allowing the proper DC bias of the diode non-linear conductance and the discharge of the diode junction capacitance), and the output network. This subcircuit provides RF ground to the diode using the virtual RF short-circuit at the detector output on the one hand, and filters harmonics and spurious signals to provide the quasi-DC detected signal through a RC filter which defines the dynamic response to RF input power changes, on the other hand. The substrate chosen was the RT Duroid 5880 substrate with 5-mil thickness.
To implement the RF short circuit on the cathode side of the diode, a radial stub seems to be the most suitable option to provide wide band response. In the final design, the radial stub was reinforced with an additional stub to ensure the short circuit, while also trying to broaden the frequency response (the couple of radial stubs can be seen in Figure 8). This output network was common for the three versions of detectors designed. The main differences between the three circuits are related to the input matching network: using a discrete resistor in the first version and with two different microstrip-matching structures for the second and the third versions. For the simulations, the nominal diode model was the one shown in Figure 1.

3.1. Input Matching with Discrete Resistor (Version 1)

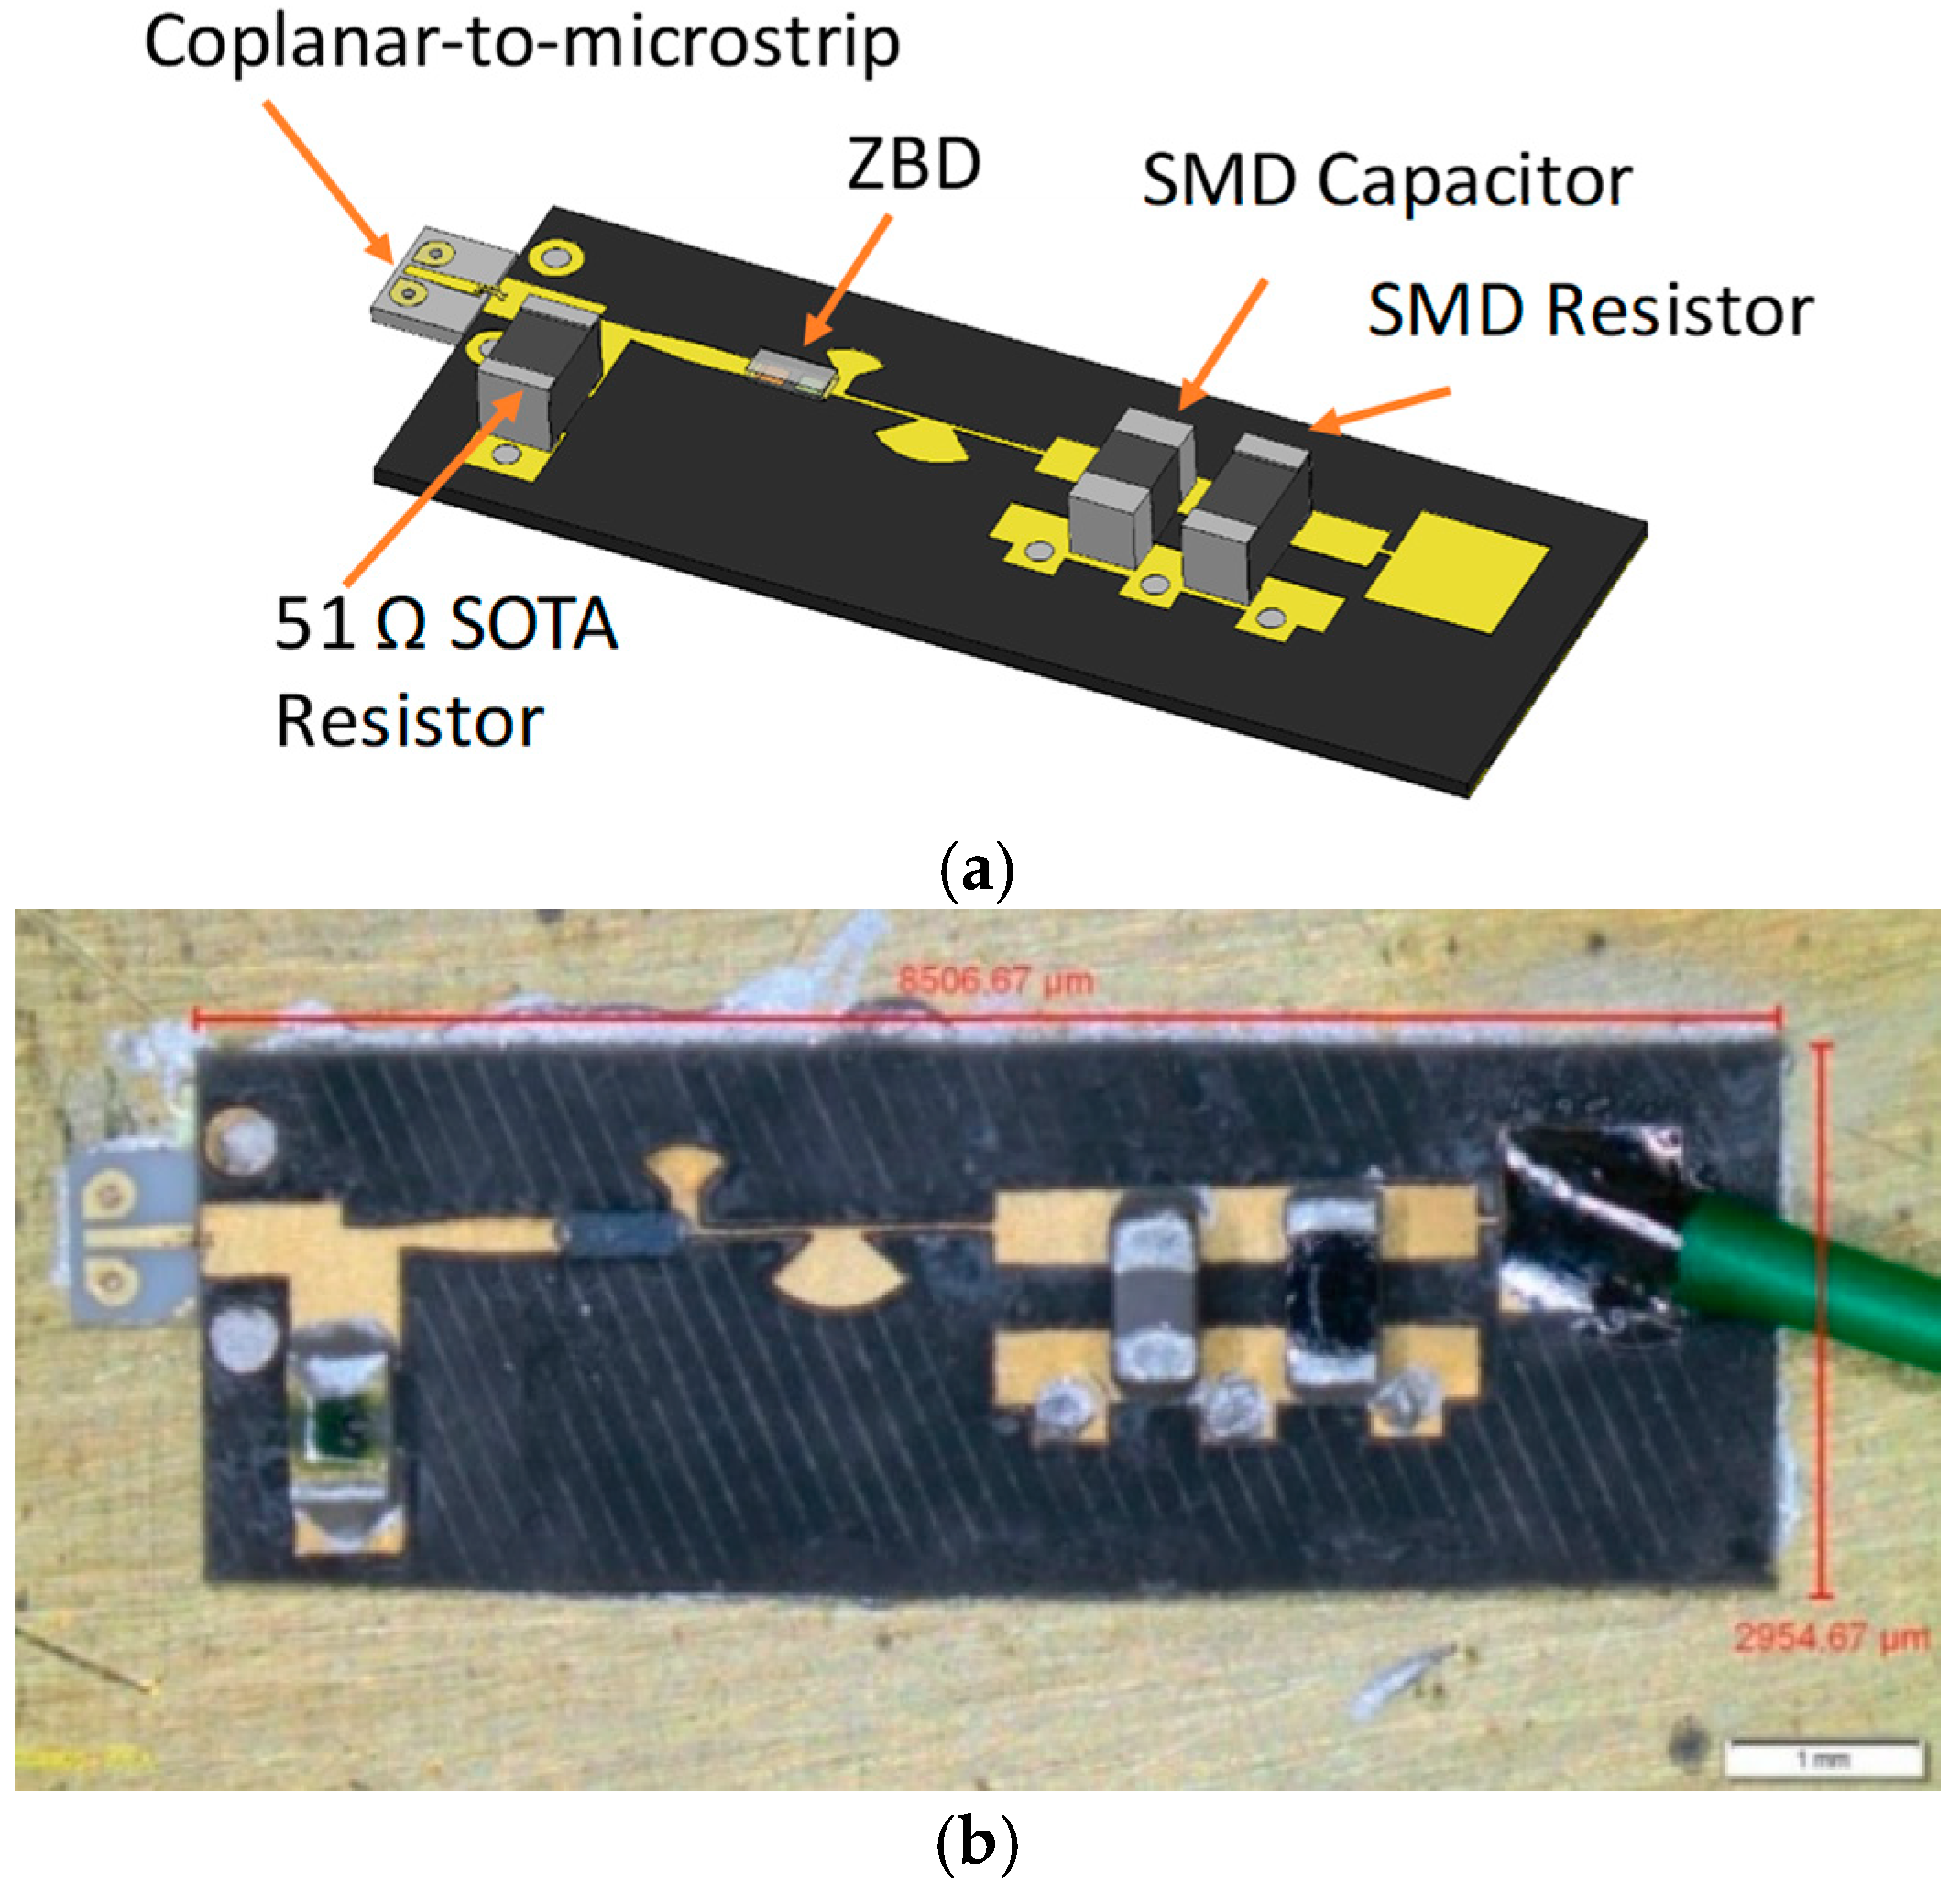
In the first version of the detector, a grounded discrete SMD resistor (model detailed in Section 2) is used, aimed to facilitate diode input matching ideally with broadband response, providing simultaneously its DC return path. Interconnection microstrip lines were designed including the models of all the additional elements (coplanar-to-microstrip adapter, bonding wires, via hole and SMD resistor), attempting to compensate for undesired effects at these high frequencies. Unless matching goals are in the center of W band, results tend to shift optimum input matching downwards, as will be seen later. The output network includes a pair of radial stubs to reinforce grounding and discrete RC elements to perform low-pass filtering. Even coupling between input and output microstrip lines when the diode is not present, it was estimated with 2D EM simulation tools to be as low as 5 fF, so, in principle, the coupling between both sides could be neglected; this allowed performing the simulations mainly by using schematic models. The prototype designed, shown in Figure 8a, was used for fabrication. Several PCBs were constructed in order to choose the most appropriate one, with dimensions closest to the nominal ones, to complete the assembly. In Figure 8b, the real assembly of this version 1 of W-band detector can be seen with its dimensions (8.5 × 2.95 mm).

3.2. Input Microstrip Matching (Version 2)

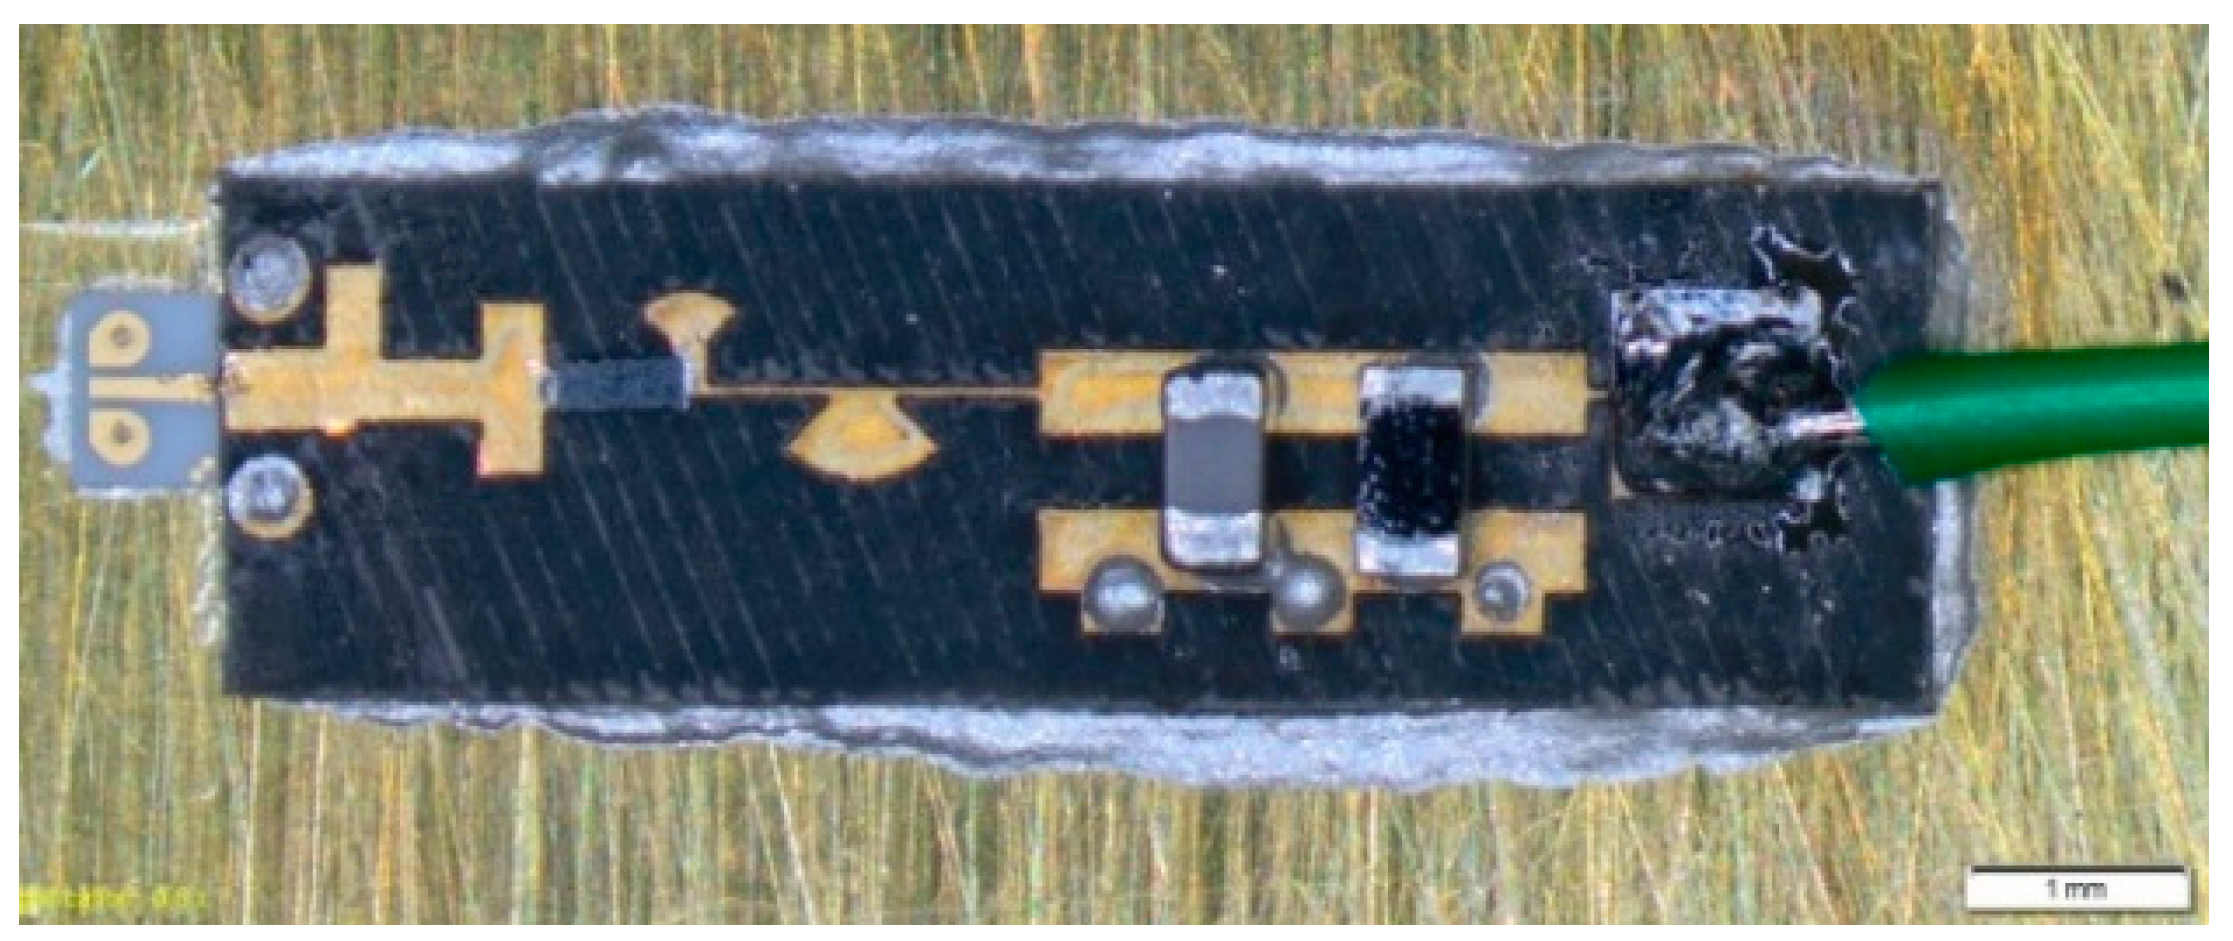
In this version, special emphasis was put on the achievement of good input matching. A double-stub network was used, unfolding one of them to maintain some symmetry (see Figure 9). To simplify, for the DC return at the input, a commercially available W-band bias tee (SHF BT110) was used. The output network was maintained. The dimensions of the input lines were more critical in this design for screen manufactured PCB, in order to choose the ones closest to nominal dimensions to be assembled.

3.3. Input Microstrip Matching (Version 3)

This version is a simplification of version 2 with a single stub and a tapered line to the ZBD anode. Performance was initially a little lower than expected in detected voltage but still fulfills the design requirements. The commercial W-band bias tee was also used for input DC return. The output network was the same, as it is shown in Figure 10.

4. Experimental Measurements and Comparisons

On-wafer measurements were done using coaxial to coplanar probes (Picoprobe 110H G-S-G, pitch 125 µm) on coplanar-to-microstrip pads (J-micro ProbePoint™ 0503 Test Interface Circuit—Coplanar to Microstrip) (Figure 11) and OML WR-10 extension modules, along with a Keysight PNA-X VNA, which was used to measure the input matching and to inject signal to the detectors with a sweeping tone with fixed power, evaluating detected DC voltage at the output.
Measurements provided a workbench for comparison and debugging of the models used through the design process for the resistor and for the ZBD diodes. In Figure 12, measurements (red line) are compared with simulations (pink line).
The frequency deviation may be due to little differences in the diode modeling or inaccuracy of the circuital simulator causing an underestimation of parasitic effects that have pushed down the optimum matching frequency.
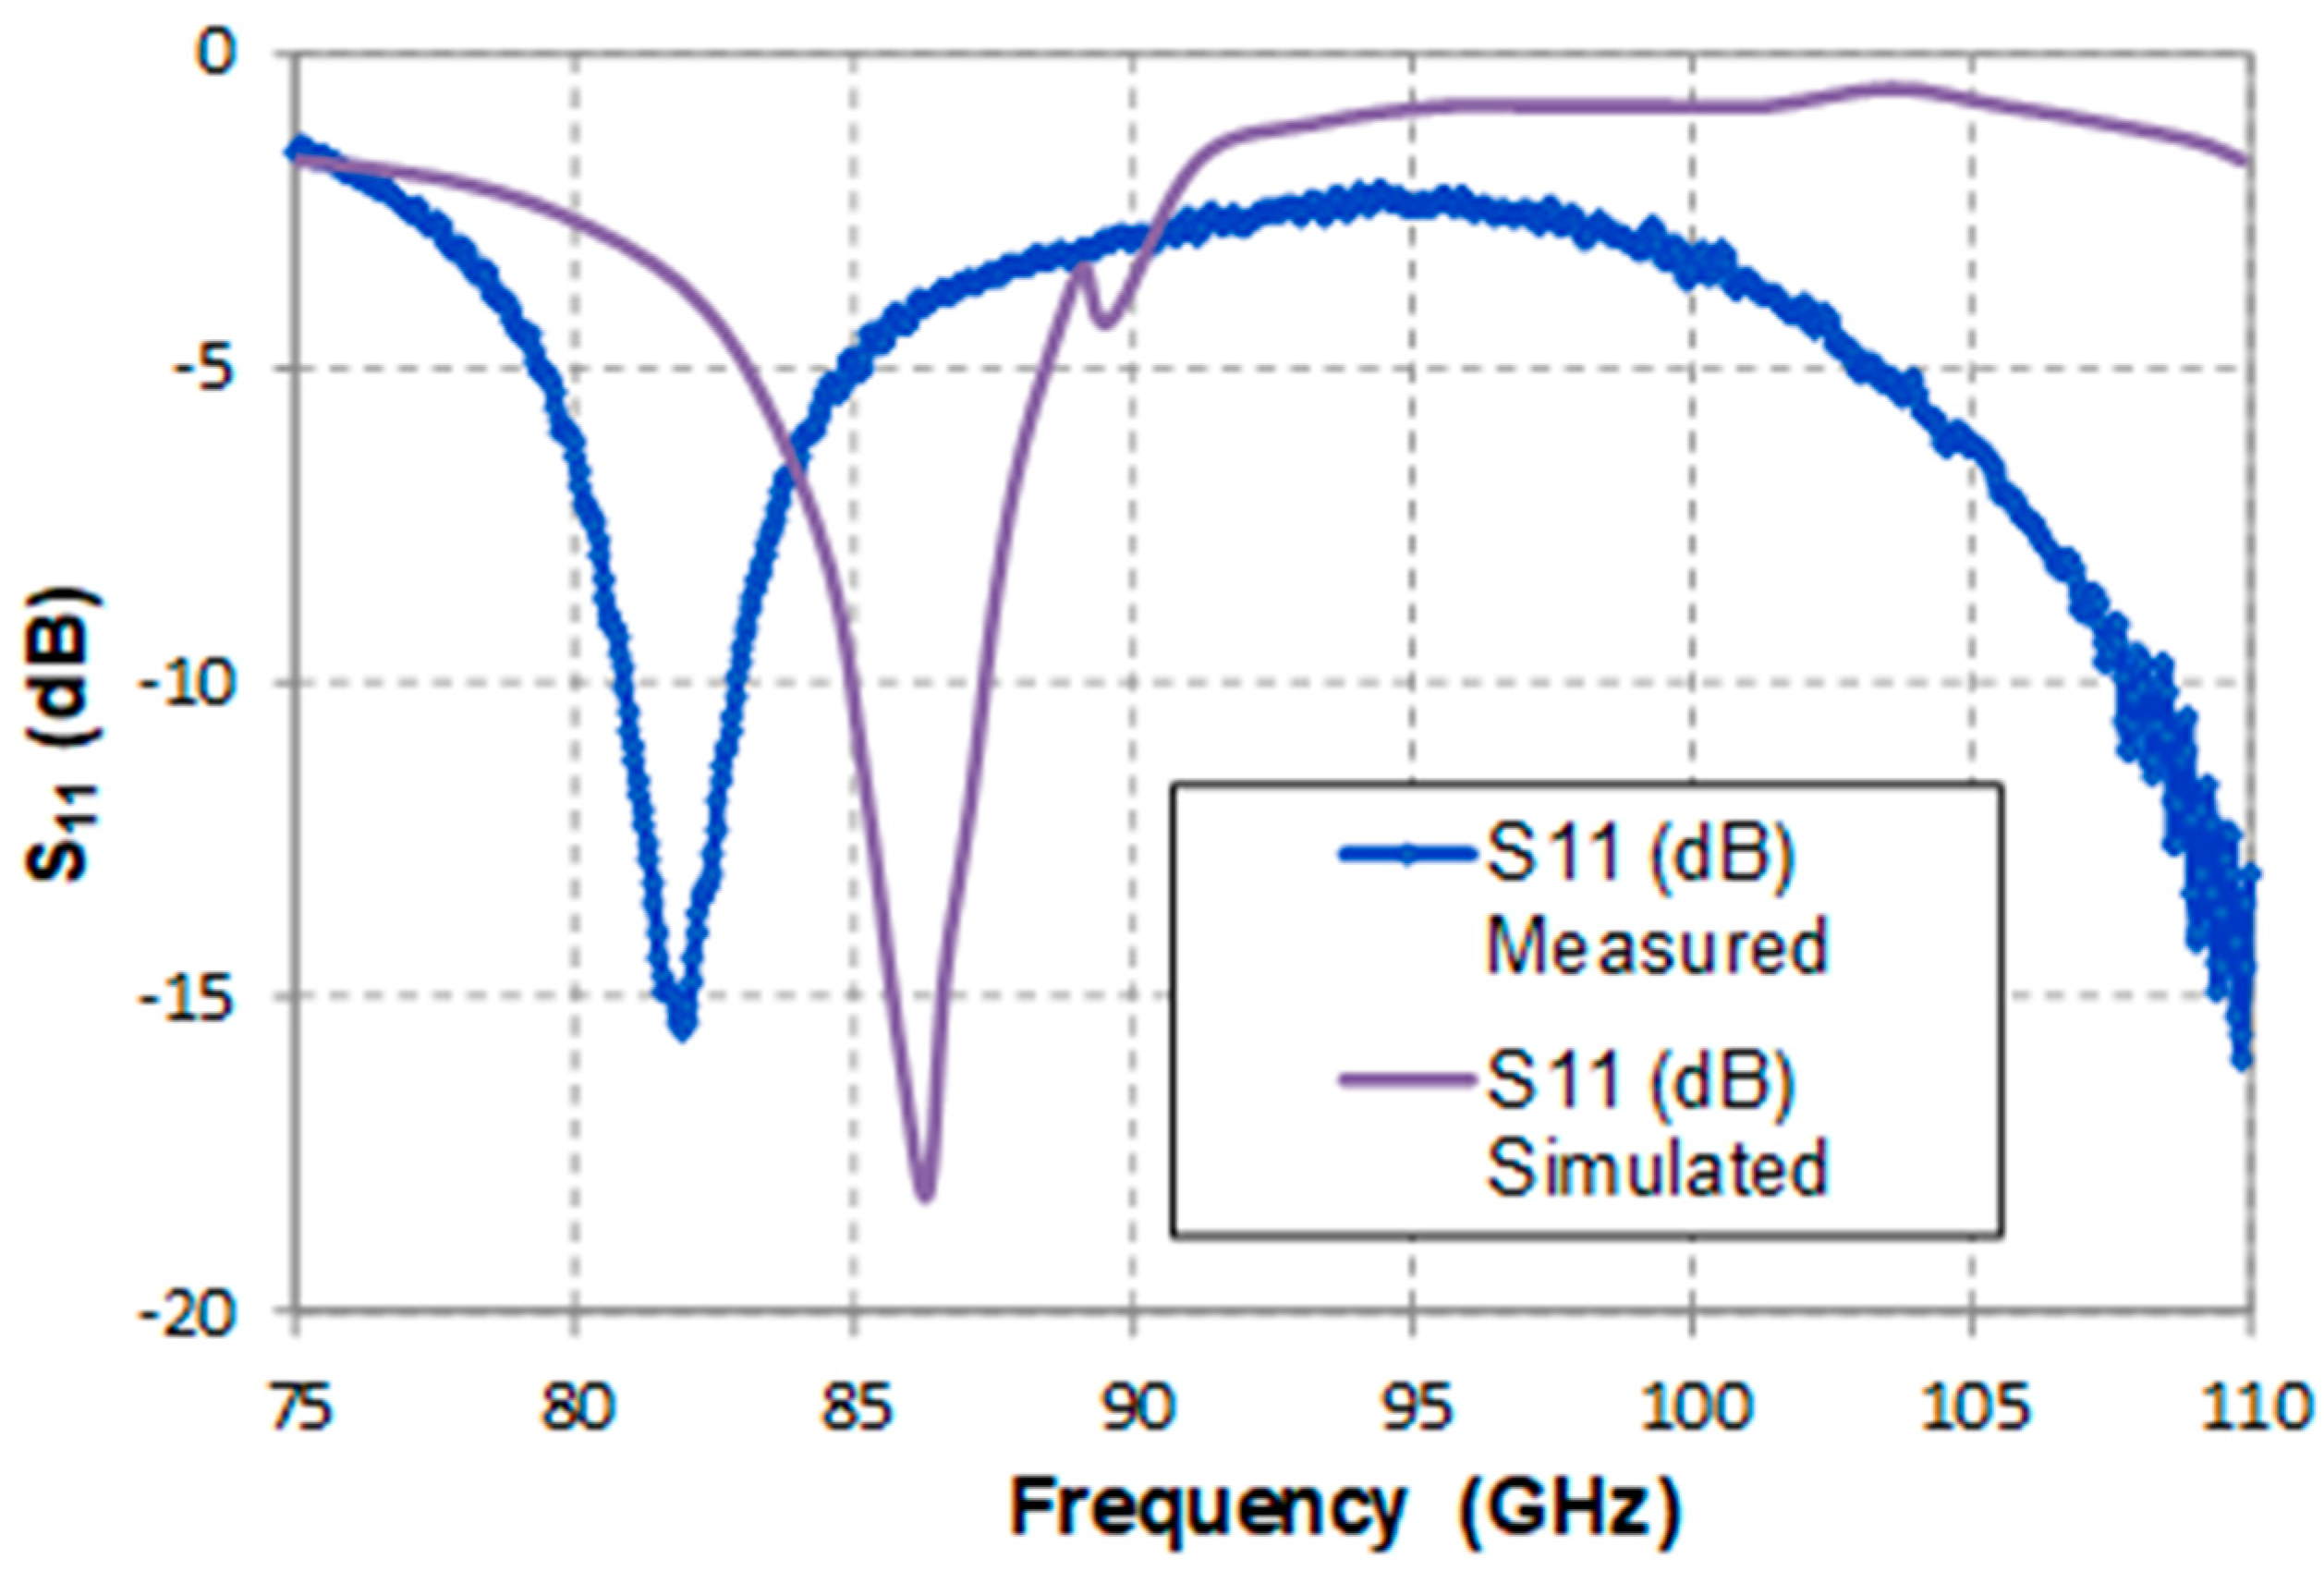
The following comparison (see Figure 13) between measurements and simulations can be made for version 2, showing again a shift in the matching peak.
Measurements and simulations of the third version of detector with a single stub for input matching will be shown for the simulation with the diode model. Measurements indicate broad band matching with a lower frequency peak. Compared to the previous versions, the best agreement between input matching measurements and simulations is obtained (see Figure 14). A small valley around 90 GHz appears in version 2 and also in version 3, which is considered as a resonance peak maybe related to some transverse resonance predicted by the simulation, but not found in measurements, maybe due to additional parasitics.

Comparisons among the Three Different Versions of Detector Circuit

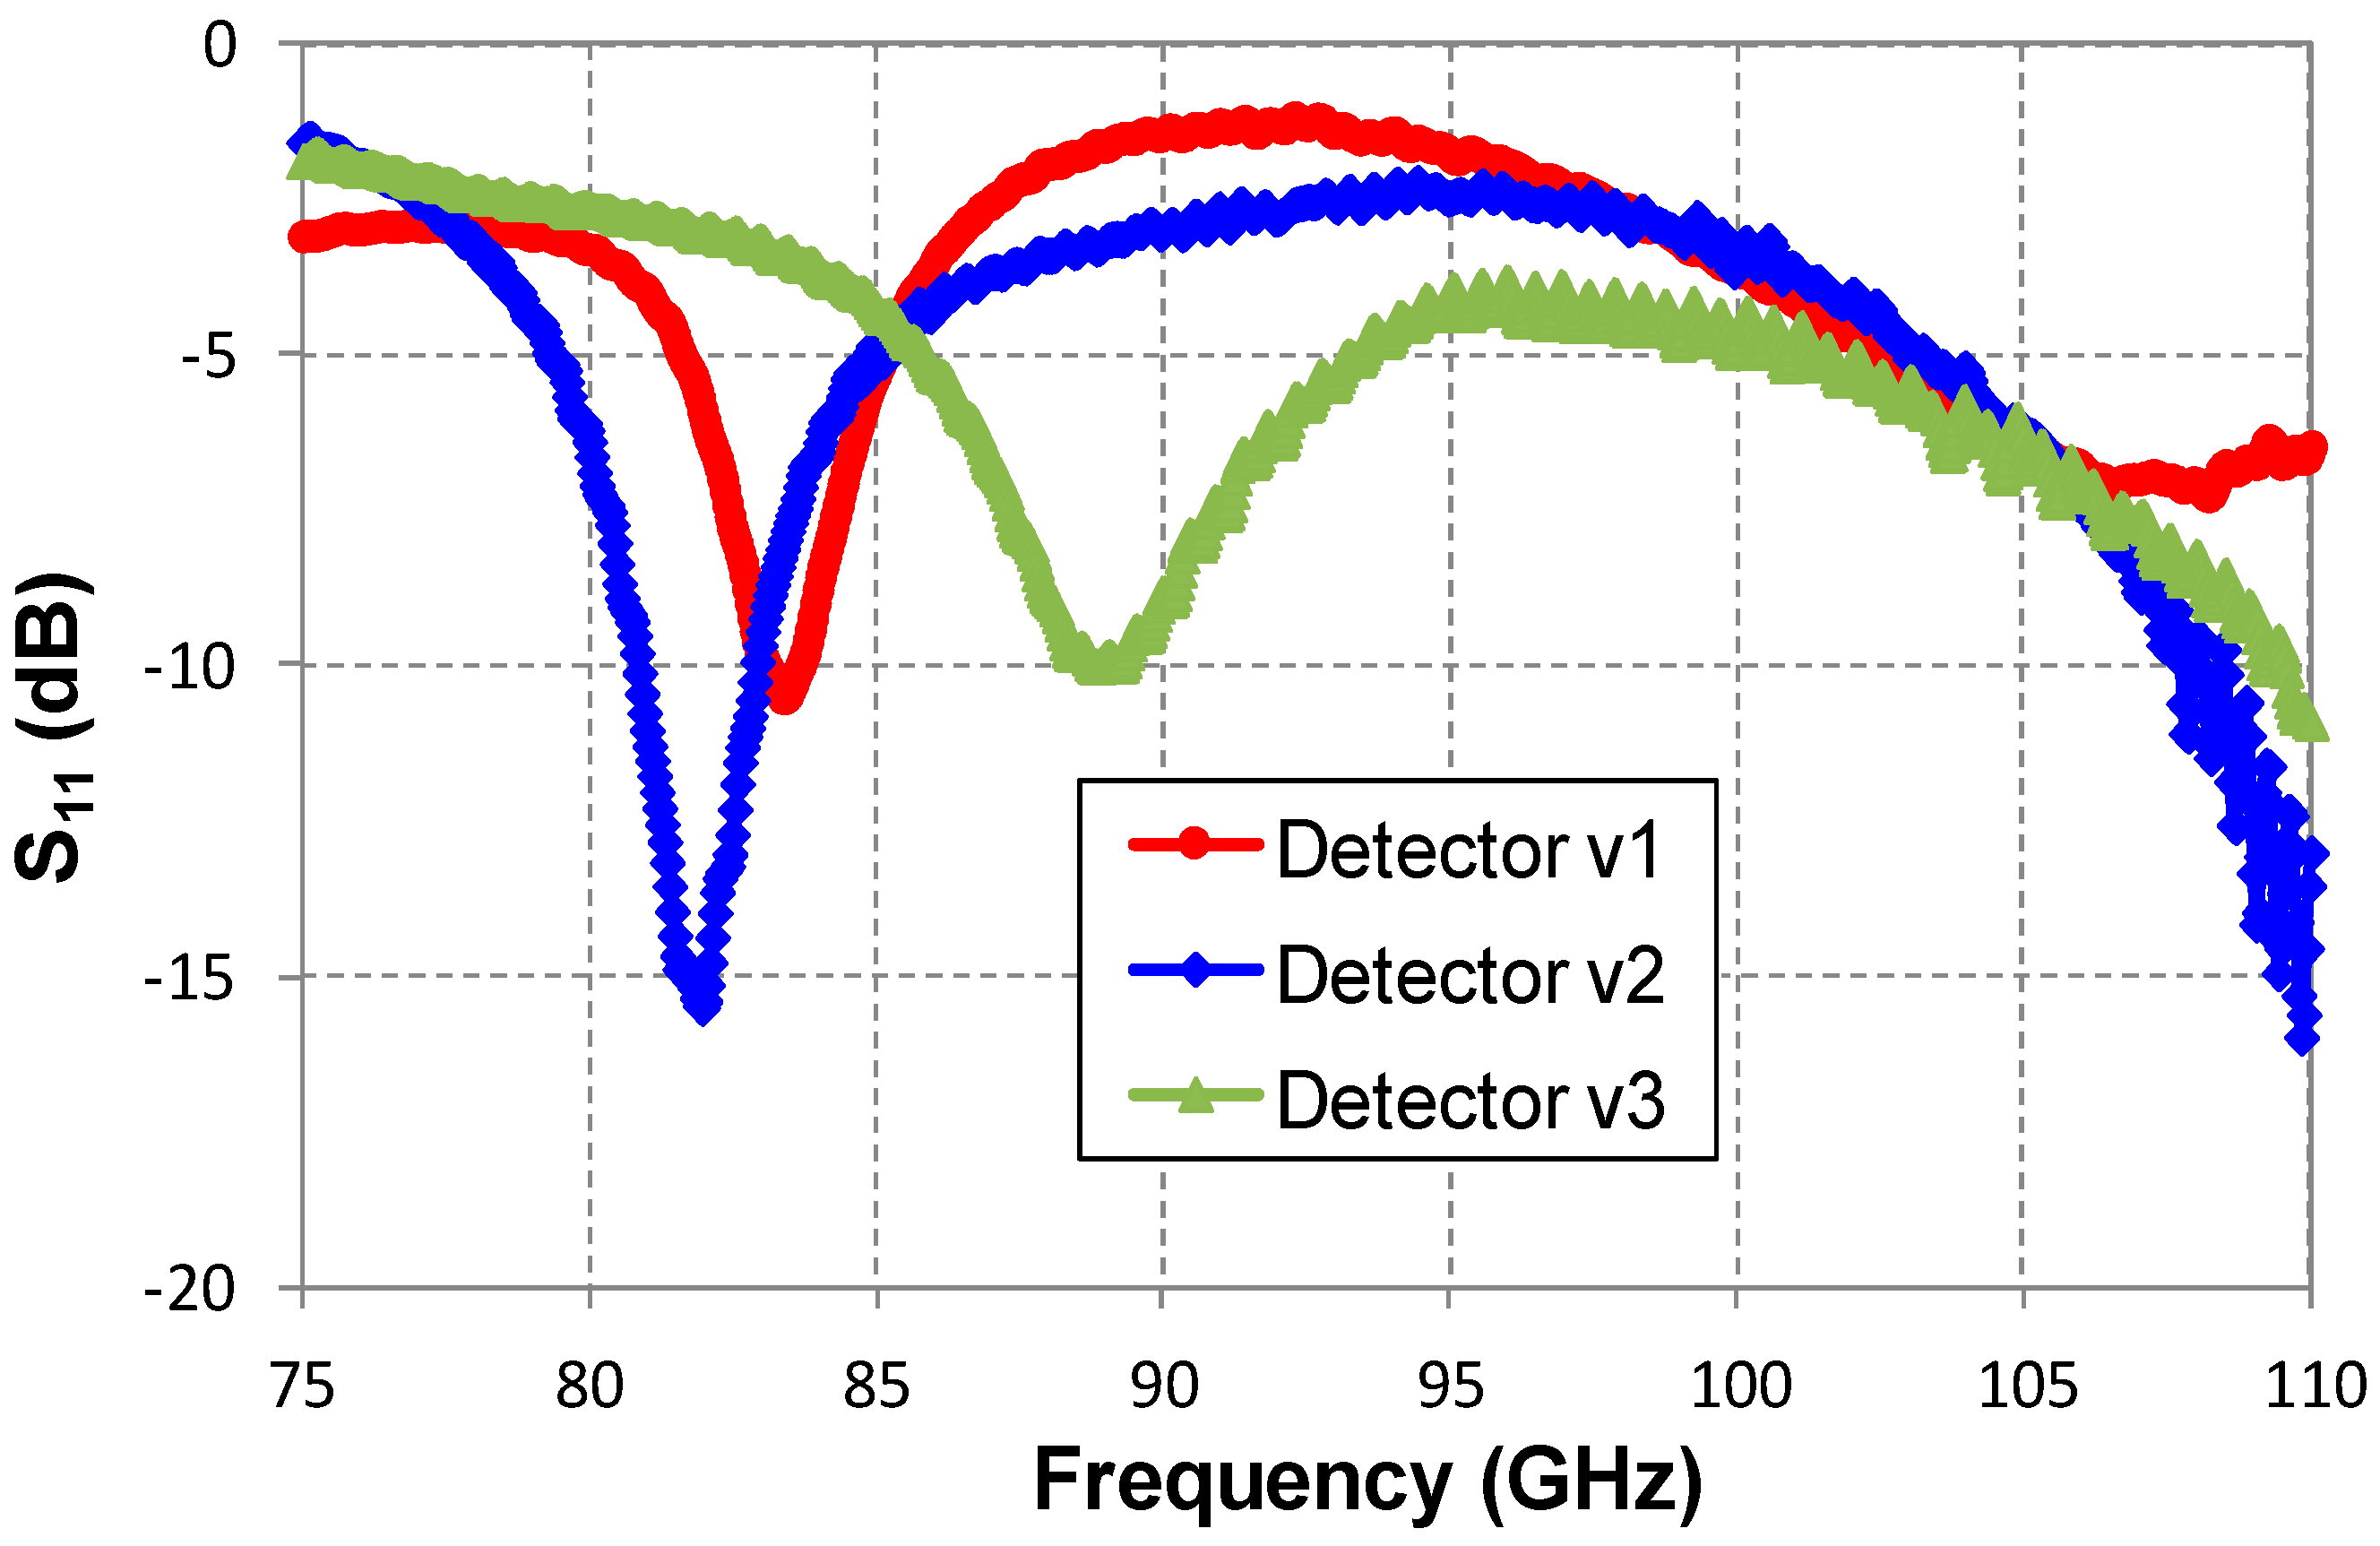
Performance comparison among the three versions’ measurements is done: detector version 3 (single stub input) shows the input matching peak at higher frequencies and detector version 2 at lower frequencies, with the deepest matching. Detector version 1 with the resistor showed an intermediate value of optimum matching frequency, as can be seen in Figure 15.
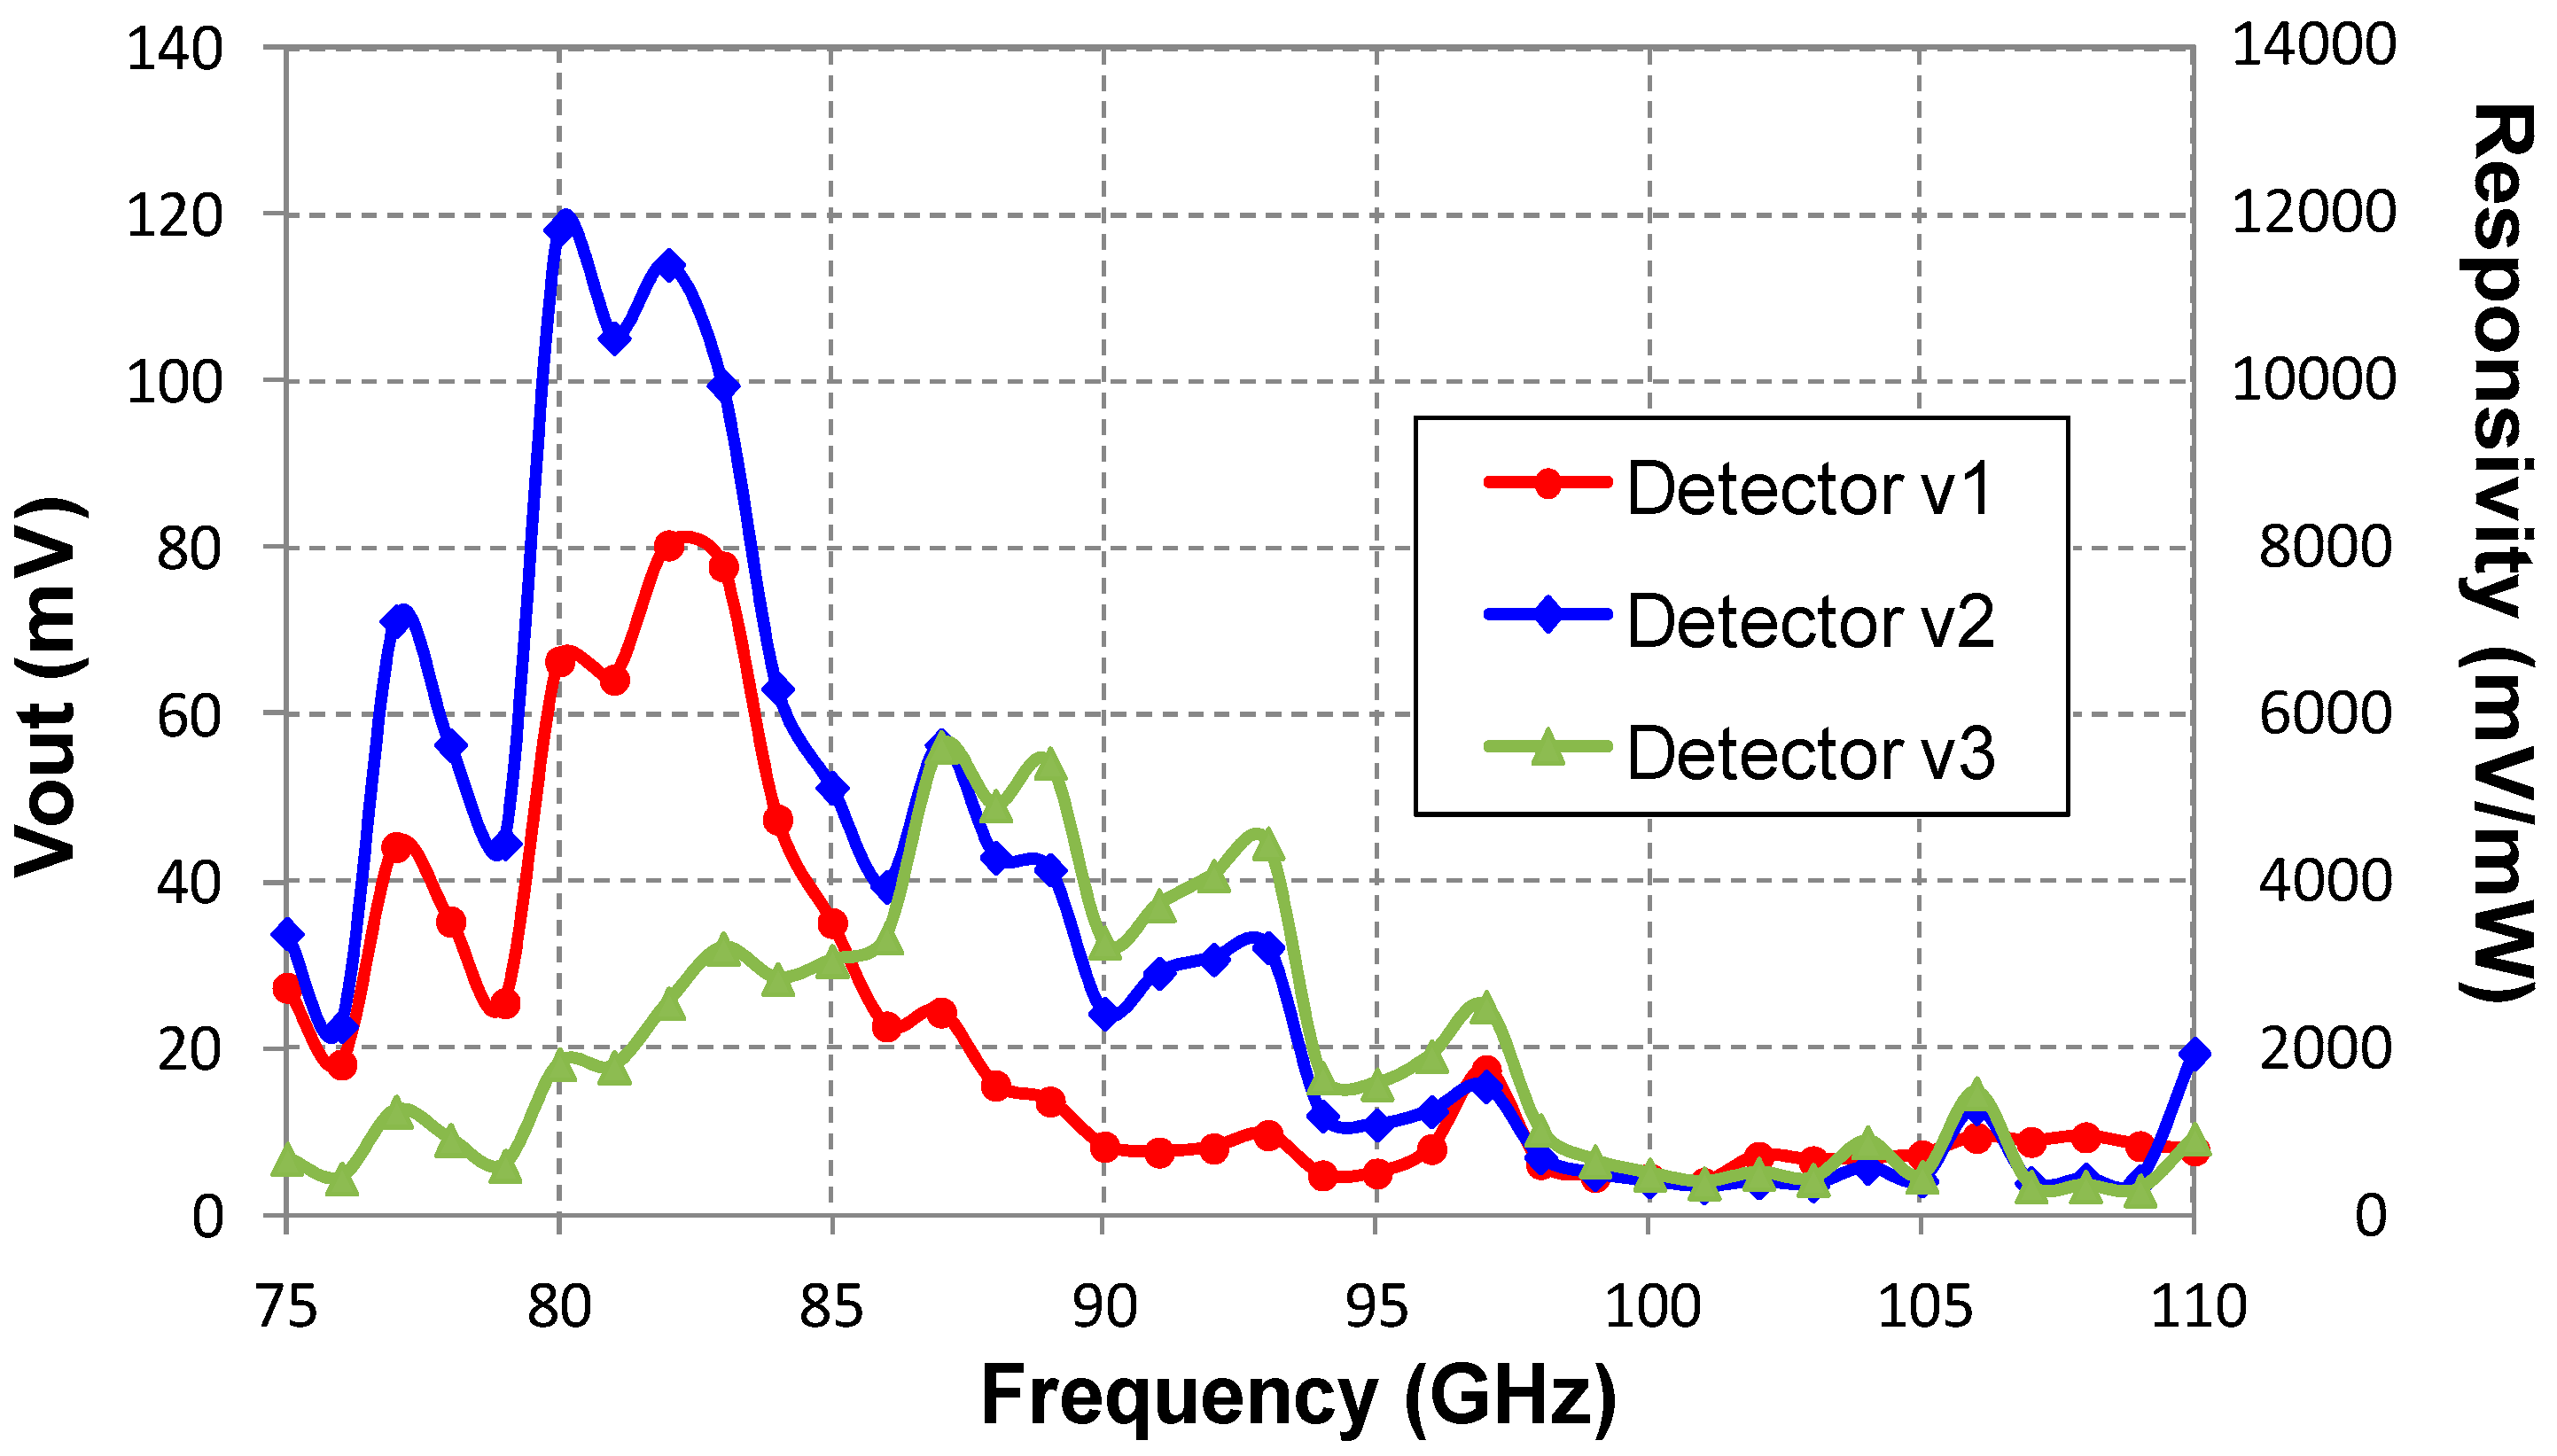
Voltage response of the three detectors versus frequency is quite in agreement with the input matching frequency profile, as can be seen in Figure 16 (left Y-axis), for an input power around the estimated 1 dB compression point (−20 dBm). Nevertheless, it should be taken into account that the response of a detector integrates two relatively independent aspects: the power really entering the detector and the responsivity of detector, which also varies with frequency: It could happen that at certain frequency with poor matching, responsivity could be higher. It means that comparison between 3 dB bandwidth based on input matching and effective bandwidth, defined in (1), which accounts for the response, must be done with caution. From the detected voltage versus frequency profile, the effective bandwidth can be obtained according to Equation (1) [27], which is written in terms of detected output voltage, dependent on the input frequency. This requires evaluating the output dc voltage of the detector when a single tone at a frequency fi is applied, which implies, in a first approach, neglecting any intermodulation or spectral regrowth. fi value is swept throughout the entire band of interest. This sweep is discrete with N frequency points and a frequency step, Δf. The noise floor is accounted for with an offset value Voutoff, leading to the following expression:
B W e f f = Δ f ( N N + 1 ) ( i = 1 N ( V o u t ( f i ) V o u t o f f ) ) 2 i = 1 N ( V o u t ( f i ) V o u t o f f ) 2
Applying Equation (1) to the traces in Figure 16 (left Y-axis), the results indicate the highest effective bandwidth is with version 3: 21.2 GHz, followed by version 2 and 1 with 17.83 GHz and 17.2 GHz, respectively.
Assuming an input power of about −20 dBm at the input of the detector, the voltage response profile in Figure 16 (left Y-axis) can be transformed into a responsivity profile [28] Equation (2) in mV/mW, as it is depicted in Figure 16 (right Y-axis). The values must be considered as a rough estimation, as there are different sources of uncertainty due to loss variations at the output of the mm-Wave head to the coplanar probes through a 1 mm coaxial cable, and minimum changes in input power can produce high variations in responsivity values.
R = Δ V o u t Δ P i n
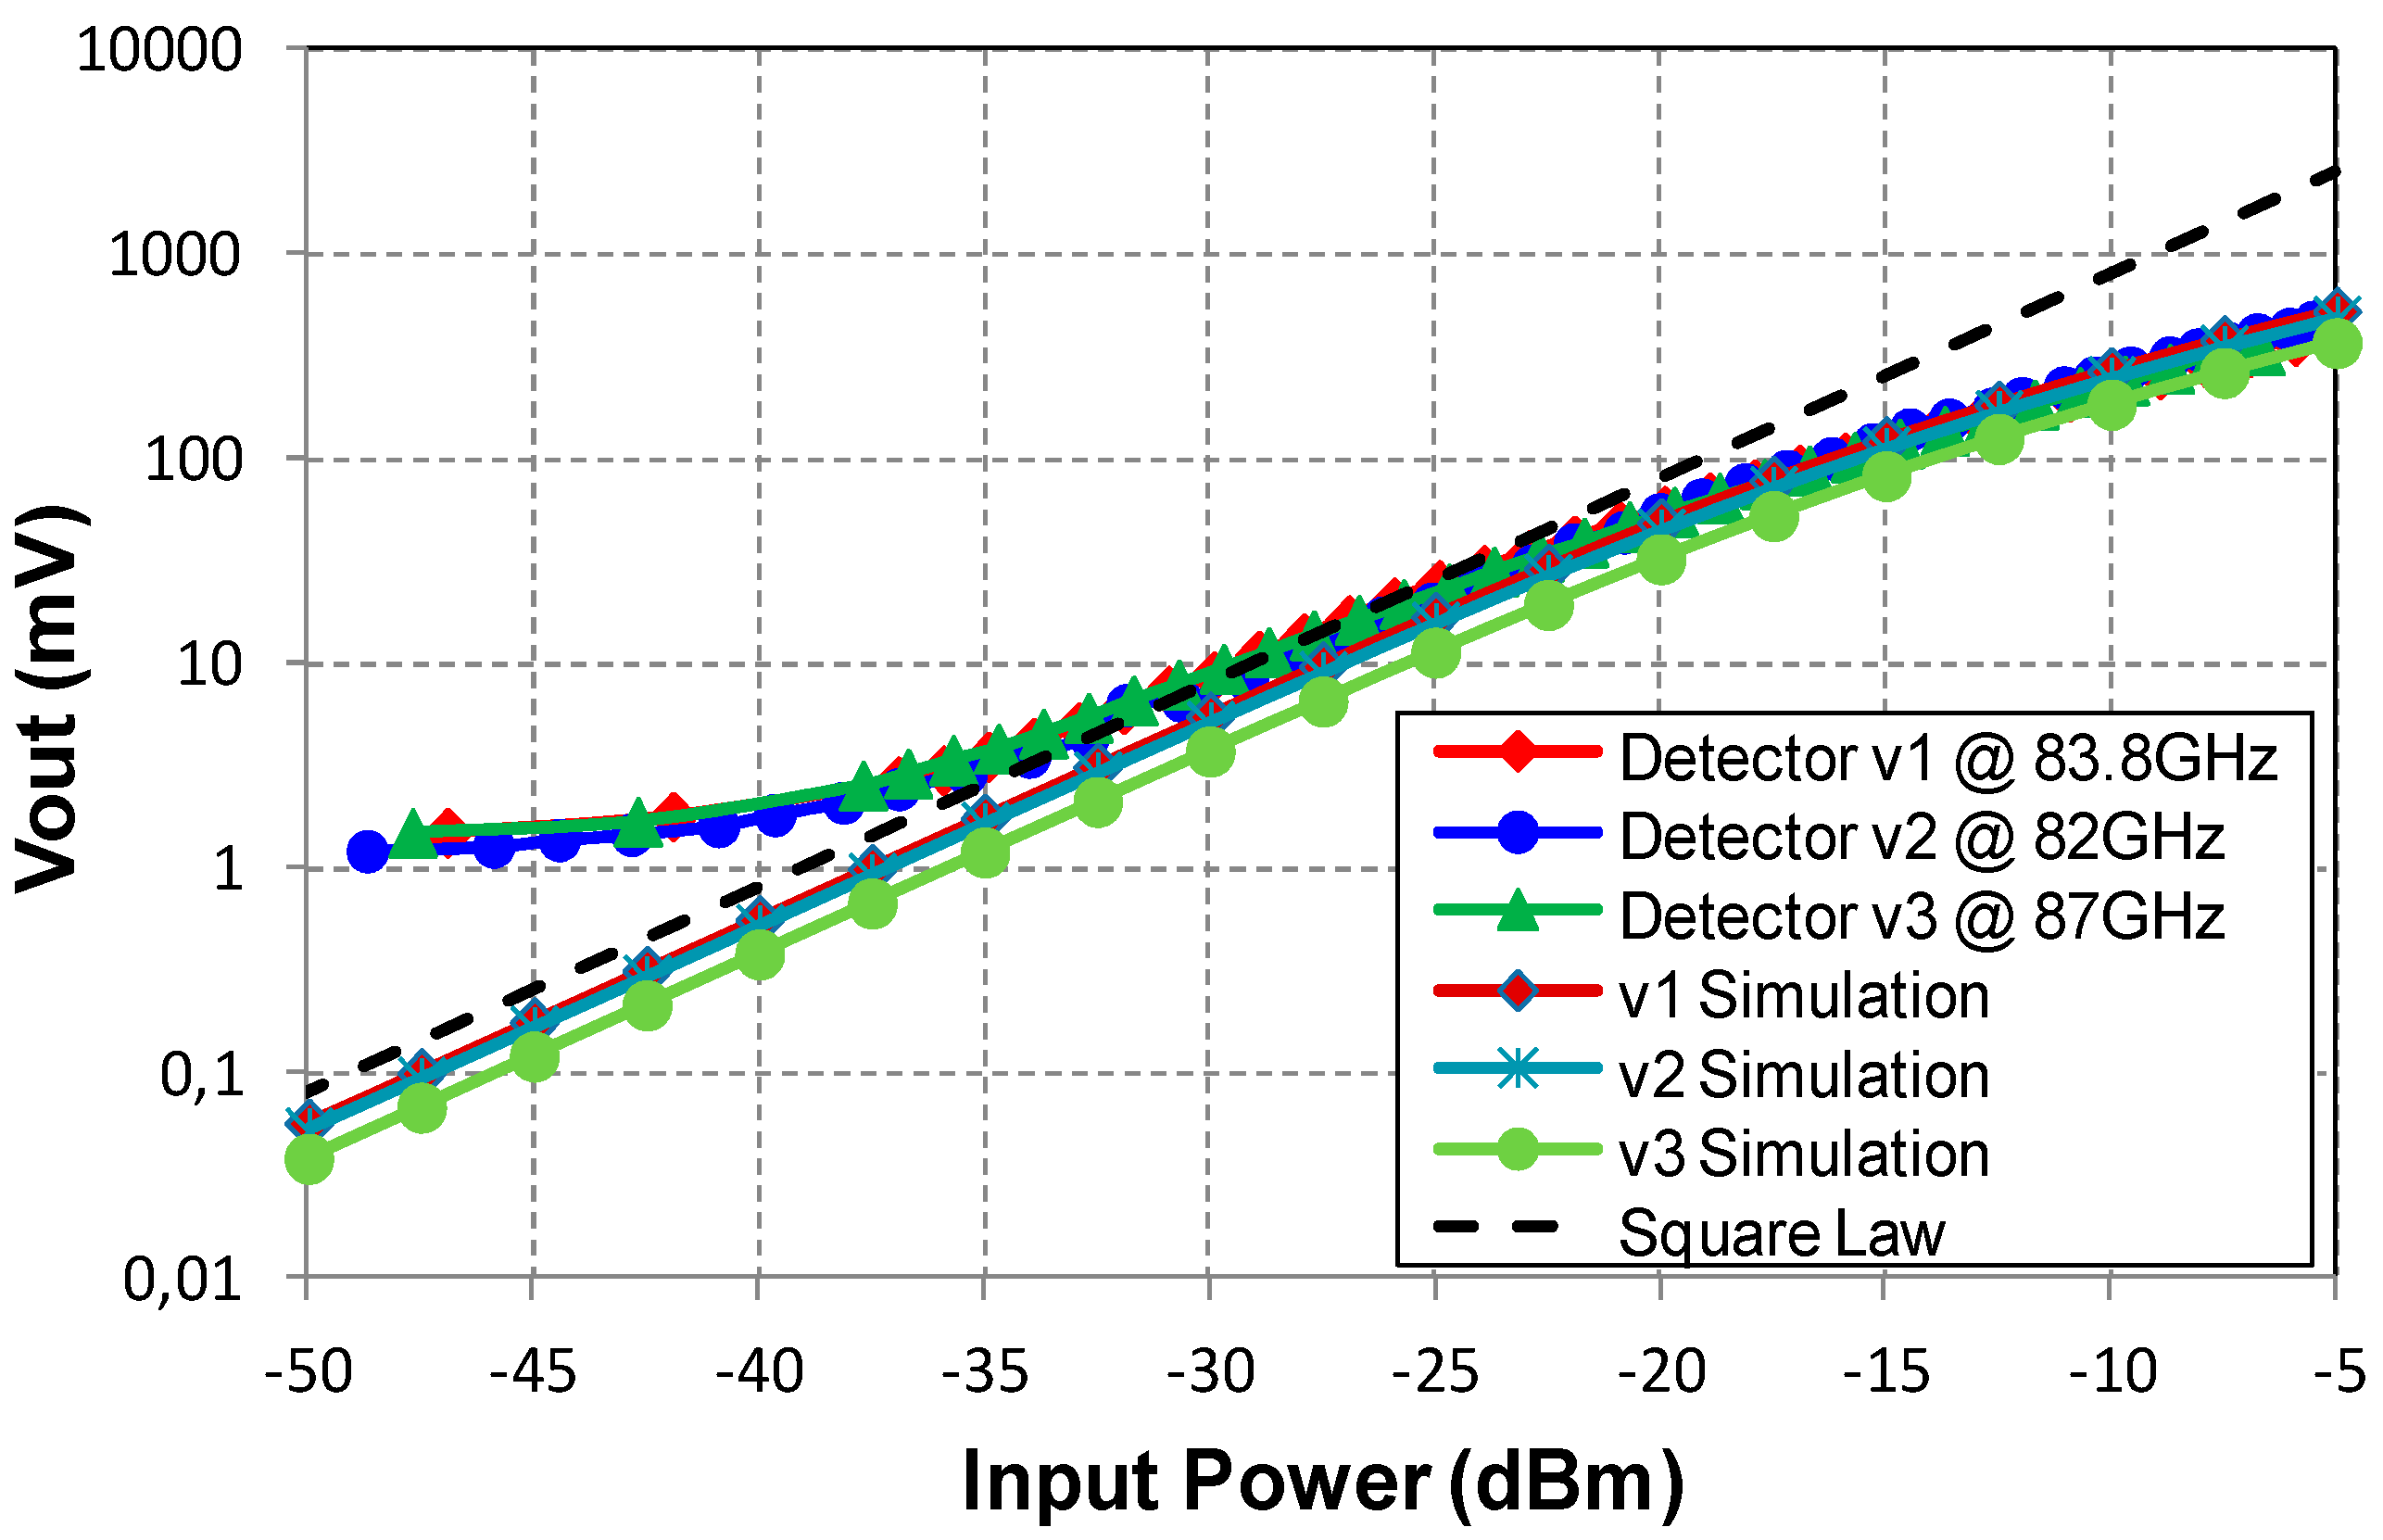
The detector response versus input power at a fixed frequency (chosen around optimum matching) was measured and simulated using the nonlinear diode model. Results are shown in Figure 17. The ideal square law for 8000 mV/mW was traced as a reference. Using a logarithmic scale on the voltage axis, it is easier to realize than Harmonic Balance simulations follow the square law up to −20 dBm approximately, but measurements do in only a narrow range around −35/−25 dBm.
Comparisons of different figures of merit among the three versions are summarized in Table 3. Responsivity is defined as the detected voltage/input power ratio, BWeff is the effective bandwidth given by Equation (1), Pinmin is the estimation of the input power required to produce a Signal-to-Noise Ratio equal to one (equivalent to TSS: Tangential Sensitivity, which is the input power that produces equal output levels in “on” and “off” states when an on-off modulation is applied to the RF input). From a practical point of view the simplest way to measure is sweeping input power with an attenuator and accounting for the input power for which detected voltage is twice the minimum. Pinmin would be that power value minus 3 dB. Another common figure of merit, specially in optics is the NEP: the Noise Equivalent Power defined as the minimum input power which produces at the output a Signal-to-Noise Ratio of 1, divided by the square root of the equivalent bandwidth to be expresed as spectral density [17,19,29,30,31]. It could be measured directly by computing the root mean squared output noise (spectral density) divided by the responsivity [19], but as power sweeps of the detector were available (Figure 17) and to avoid ambiguity on the determination of the frequency range, between 1/f knee and output low frequency bandwidth, where output noise spectral density value is read, we provide NEP estimations based on Pinmin values using Equation (3) [31]:
N E P ( e s t i m a t e d ) = P i n m i n B W e f f
Performance of the proposed low-cost detector designs is in the range of similar references in the literature. In some cases, it is difficult to establish proper comparisons, particularly when referring to peak values and simultaneously considering the effective bandwidth or the equivalent bandwidth, (definitions may differ). As could be expected, we may pay the price of relatively low-cost substrates with slightly higher minimum input power values. In any case, responsivity, bandwidth and minimum input power are similar to other MIC detectors in W band referred to in the literature (see Table 4).

5. Conclusions

A previously obtained model for flip-chip assembled Zero-Biased Diodes (VDI) up to W band and a W-band extracted model of SMD resistor manufactured (SOTA) were used to study the viability of low-cost microstrip W-band detectors. Three versions were compared, differing mainly in the input matching topology. The first version with a SMD resistor as part of the input matching shows maximum responsivity (around 8000 mV/mW) shifted downwards in the W band, and the minimum effective bandwidth, 17.2 GHz. Version number 2 uses a double stub microstrip input matching network and provides the highest values of responsivity (about 11,000 mV/mW in the maximum) and effective bandwidth of 17.83 GHz. In version number 3, a single stub is used for matching. This last topology gives the widest bandwidth, 21.2 GHz, centered at the highest frequency but with the lowest responsivity (maximum values around 5000 mV/mW). Simplicity seems the best option to achieve reasonable performance of the detector with a low-cost process relying on VDI zero bias diodes.
Despite finding a frequency shift in some cases, we consider that a reasonable agreement between measurements and simulations of the detectors is found. Nevertheless, there is room for improvement by reducing the uncertainty of the undesired couplings in the microstrip board and by refining the used ZBD model, maybe reducing the dependence of the extracted model on the extraction setup. The performance of the proposed low-cost detector designs is in the range of similar references listed in the literature.

Author Contributions

Conceptualization, J.P.P. and T.F.; methodology, T.F., J.P.P., J.G. and K.Z.; software, J.G.; validation, J.G. and K.Z.; formal analysis, J.G. and T.F.; investigation, J.G. and K.Z.; writing—original draft preparation, J.P.P. and T.F.; writing—review and editing, J.P. and T.F.; supervision, A.T.; project administration, J.P.P.; funding acquisition, A.T.

Funding

The authors would like to thank the funding of the University of Cantabria Industrial Doctorate programme 2014, project: “Estudio y Desarrollo de Tecnologías para Sistemas de Telecomunicación a Frecuencias Milimétricas y de Terahercios con Aplicación a Sistemas de Imaging en la Banda 90 GHz–100GHz” and the Spanish Ministry of Economy, Science and Innovation for the financial support provided through projects CONSOLIDER-INGENIO CSD2008-00068 (TERASENSE), the continuing excellence network SPATEK and the projects TEC2014-58341-C4-1-R, TEC2017-83343-C4-1-R. and AYA2017-92153-EXP.

Acknowledgments

The authors would like to express their gratitude to all the staff of DICOM’s Microwaves & RF group for their help and to the assembling laboratory staff: Ana Perez, Eva Cuerno and Sandra Pana for their help with the fabrication of the prototypes and to Dermot Erskine for the revision of the text.

Conflicts of Interest

The authors declare no conflict of interest. The funders had no role in the design of the study; in the collection, analyses, or interpretation of data; in the writing of the manuscript, or in the decision to publish the results.

Appendix A

Referred diode manufacturers are:
Keysight (HSCH 9161)
MACOM-Metelics (MZBD 9161)

References

  1. Biebl, E.M. RF Systems Based on Active Integrated Antennas. AEU-Int. J. Electron. Commun. 2003, 57, 173–180. [Google Scholar] [CrossRef]
  2. Shi, Y.; Jing, J.; Fan, Y.; Yang, L.; Li, Y.; Wang, M. A novel compact broadband rectenna for ambient RF energy harvesting. AEU-Int. J. Electron. Commun. 2018, 95, 264–270. [Google Scholar] [CrossRef]
  3. Janin, S.; Sripimanwat, K.; Phongcharoenpanich, C.H.; Krairiksh, M. A hybrid ring coupler quasi-optical antenna-mixer. AEU-Int. J. Electron. Commun. 2009, 63, 36–45. [Google Scholar] [CrossRef]
  4. Yaoa, C.H.; Chen, Z.; Gea, J.; Zhoub, M.; Weib, X. A compact 220 GHz heterodyne receiver module with planar Schottky diodes. AEU-Int. J. Electron. Commun. 2018, 84, 153–161. [Google Scholar] [CrossRef]
  5. Moyer, H.P.; Schulman, J.N.; Lynch, J.J.; Schaffner, J.H.; Sokolich, M.; Royter, Y.; Bowen, R.L.; McGuire, C.F.; Hu, M.; Schmitz, A. W-Band Sb-Diode Detector MMICs for Passive Millimeter Wave Imaging. IEEE Microw. Wirel. Compon. Lett. 2008, 18, 686–688. [Google Scholar] [CrossRef]
  6. Hrobak, K.M.; Sterns, M.; Schramm, M.; Stein, W.; Schmidt, L.P. Planar zero bias Schottky diode detector operating in the E- and W-band. In Proceedings of the European Microwave Conference, Nuremberg, Germany, 6–10 October 2013; pp. 179–182. [Google Scholar]
  7. Artal, E.; Aja, B.; De la Fuente, M.L.; Pascual, J.P.; Mediavilla, A.; Martinez-Gonzalez, E.; Pradell, L.; de Paco, P.; Bara, M.; Blanco, E.; et al. LFI 30 and 44 GHz receivers Back-End Modules. J. Instrum. 2009, 4, T12003. [Google Scholar] [CrossRef]
  8. Cano, J.L.; Aja, B.; Villa, E.; De la Fuente, L.; Artal, E. Broadband back-end module for radio-astronomy applications in the Ka-Band. In Proceedings of the 2008 38th European Microwave Conference, Amsterdam, The Netherlands, 27–31 October 2008; pp. 1113–1116. [Google Scholar]
  9. Gutiérrez, J.; Zeljami, K.; Villa, E.; Aja, B.; De la Fuente, M.L.; Sancho, S.; Pascual, J.P. Noise conversion of Schottky diodes in mm-wave detectors under different nonlinear regimes: Modeling and simulation versus measurement. Int. J. Microw. Wirel. Technol. 2016, 8, 479–493. [Google Scholar] [CrossRef]
  10. Xie, L.; Zhang, Y.; Fan, Y.; Xu, C.; Jiao, Y. A W-band Detector with High Tangential Signal Sensitivity and Voltage Sensitivity. In Proceedings of the 2010 International Conference on Microwave and Millimeter Wave Technology ICMMT Conference, Chengdu, China, 8–11 May 2010. [Google Scholar]
  11. Xu, K.; Zhang, Y.; Xie, L.; Fan, Y. A Broad W-band Detector Utilizing Zero-bias Direct Detection Circuitry. In Proceedings of the 2011 International Conference on Computational Problem-Solving (ICCP), 21–23 October 2011; pp. 190–194. [Google Scholar]
  12. Yao, C.; Zhou, M.; Luo, Y.; Xu, C. Millimeter wave broadband high sensitivity detectors with zero-bias Schottky diodes. J. Semicond. 2015, 36, 065002. [Google Scholar] [CrossRef]
  13. Tekbaş, M.; Erdoğan, M.S.; Ünal, İ. A W band waveguide detector module using zero bias schottky diode. In Proceedings of the IEEE 37th International Conference on Electronics and Nanotechnology (ELNANO), Kiev, Ukraine, 18–20 April 2017; pp. 137–142. [Google Scholar]
  14. Hoefle, M.; Penirschke, A.; Cojocari, O.; Jakoby, R. Broadband zero-bias Schottky detector for E-field measurements up to 100 GHz and beyond. In Proceedings of the 38th International Conference on Infrared, Millimeter, and Terahertz Waves (IRMMW-THz), Mainz, Germany, 1–6 September 2013; pp. 1–2. [Google Scholar] [CrossRef]
  15. Zhang, W.; Yang, F.; Wang, Z.X. W-band (90GHz) zero bias Schottky diode directive detector. In Proceedings of the Asia-Pacific Microwave Conference (APMC), Nanjing, China, 6–9 December 2015; pp. 1–3. [Google Scholar]
  16. Hesler, J.; Crowe, T.W. NEP and responsivity of THz zero-bias Schottky diode detectors. In Proceedings of the Joint 32nd International Conference on Infrared and Millimeter Waves, 2007 and the 2007 15th International Conference on Terahertz Electronics, IRMMW-THz, Cardiff, UK, 2–9 September 2007. [Google Scholar]
  17. Hrobak, M. Critical mm-Wave Components for Synthetic Automatic Test Systems; Springer: Berlin/Heidelberg, Germany, 2014. [Google Scholar]
  18. Tomkins, A.; Garcia, P.; Voinigescu, S.P. A Passive W-Band Imaging Receiver in 65-nm Bulk CMOS. IEEE J. Solid-State Circuits 2010, 45, 1981–1991. [Google Scholar] [CrossRef]
  19. May, J.W.; Rebeiz, G.M. Design and Characterization of W-Band SiGe RFICs for Passive Millimeter-Wave Imaging. IEEE Trans. Microw. Theory Tech. 2010, 58, 1420–1430. [Google Scholar] [CrossRef]
  20. Sánchez-Martín, H.; Sánchez-Martín, S.; Íñiguez-de-la-Torre, I.; Pérez, S.; Novoa, J.A.; Ducournau, G.; Grimbert, B.; Gaquière, C.; González, T.; Mateos, J. GaN nanodiode arrays with improved design for zero-bias sub-THz detection. Semicond. Sci. Technol. 2018, 33, 095016. [Google Scholar] [CrossRef]
  21. Han, R.; Zhang, Y.; Coquillat, D.; Videlier, H.; Knap, W.; Brown, E.; Kenneth, K.O. A 280-GHz Schottky Diode Detector in 130-nm Digital CMOS. IEEE J. Solid-State Circuits 2011, 46, 2602–2612. [Google Scholar] [CrossRef]
  22. Dhillon, S.S.; Vitiello, M.S.; Linfield, E.H.; Davies, A.G.; Hoffmann, M.C.; Booske, J.; Paoloni, C.; Gensch, M.; Weightman, P.; Williams, G.P.; et al. The 2017 terahertz science and technology roadmap. J. Phys. D Appl. Phys. 2017, 50, 043001. [Google Scholar] [CrossRef]
  23. Sizov, F. Terahertz radiation detectors: The state-of-the-art. Semicond. Sci. Technol. 2018, 33, 123001. [Google Scholar] [CrossRef]
  24. Zeljami, K.; Gutierrez, J.; Pascual, J.P.; Fernandez, T.; Tazon, A.; Boussouis, M. Characterization and Modeling of Schottky Diodes Up to 110 GHz for Use in Both Flip-chip and Wire-Bonded Assembled Environments. Prog. Electromagn. Res. 2012, 131, 457–475. [Google Scholar] [CrossRef]
  25. Gutiérrez, J.; Zeljami, K.; Fernández, T.; Pascual, J.P.; Tazón, A. Accurately Modeling of Zero Biased Schottky-Diodes at Millimeter-Wave Frequencies. Electronics 2019, 8, 696. [Google Scholar] [CrossRef]
  26. High Frequency Resistors. Available online: http://www.resistor.com/phifreq_hf.htm (accessed on 7 October 2019).
  27. Tiuri, M.E. Radio Astronomy Receivers. IEEE Trans. Antennas Propag. 1964, 12, 930–938. [Google Scholar] [CrossRef]
  28. Paschotta, R. Encyclopedia of Laser Physics and Technology; Wiley-VCH: Berlin, Germany, 2008. [Google Scholar]
  29. Richards, P.L. Bolometers for infrared and millimeter waves. J. Appl. Phys. 1994, 76, 1. [Google Scholar] [CrossRef] [Green Version]
  30. Leclercq, S. Discussion about Noise Equivalent Power and its Use for Photon Noise Calculation. Available online: http://www.iram.fr/~leclercq/Reports/About_NEP_photon_noise.pdf (accessed on 30 October 2019).
  31. Mackowiak, V.; Peupelmann, J.; Ma, Y.; Gorges, A. NEP-Noise Equivalent Power. Thorlabs Documentation. Available online: https://www.thorlabs.com/images/TabImages/Noise_Equivalent_Power_White_Paper.pdf (accessed on 30 October 2019).
Figure 1. Equivalent circuit model for the VDI Zero Bias Diode (ZBD) in flip-chip assembly.
Electronics 08 01450 g001
Figure 2. Assemblies with coplanar-to-microstrip adapters (J-Micro PP0503) for resistance (SOTA S0302AP500JG) characterization up to 110 GHz: (a) series assembly; (b) to ground assembly.
Electronics 08 01450 g002
Figure 3. Comparison between simulated and experimental results up to 110 GHz of the 51 Ω resistance to ground assembly (arrow indicates increasing frequency).
Electronics 08 01450 g003
Figure 4. Comparison between simulated and experimental results up to 110 GHz of the 51 Ω resistance in series assembly (arrows indicate increasing frequency).
Electronics 08 01450 g004
Figure 5. Model for both assemblies of 51 Ω resistance: in series and with an access to ground.
Electronics 08 01450 g005
Figure 6. The 51 Ω resistance model from 75 GHz up to 110 GHz (arrow indicates increasing frequency).
Electronics 08 01450 g006
Figure 7. W-band detector: block diagram.
Electronics 08 01450 g007
Figure 8. Final design for version 1, which includes the discrete resistor (SOTA S0302AP500JG) in the input matching network and coplanar-to-microstrip transition (J-Micro PP0503) (a) 3D view of the designed prototype; (b) Photo of the fabricated assembly.
Electronics 08 01450 g008
Figure 9. Detector version 2: photograph of the fabricated and mounted circuit including coplanar-to-microstrip transition (J-Micro PP0503).
Electronics 08 01450 g009
Figure 10. Detector version 3: photograph of the fabricated and mounted circuit including coplanar-to-microstrip transition (J-Micro PP0503).
Electronics 08 01450 g010
Figure 11. On-wafer measurements of the three prototypes with probe (Picoprobe 110H).
Electronics 08 01450 g011
Figure 12. Detector version 1: comparison between measurements (red line) and simulation with the W-band resistance model and diode model (pink line).
Electronics 08 01450 g012
Figure 13. Input matching of the second version of the detector (input matching with double stub microstrip lines). Measurements (blue line) and simulations (yellow line).
Electronics 08 01450 g013
Figure 14. Input matching of detector version 3 (input matching with double stub microstrip lines). Measurements (green line) and simulations (orange line).
Electronics 08 01450 g014
Figure 15. Comparison among the three different versions’ measurements. Input matching vs. frequency.
Electronics 08 01450 g015
Figure 16. Comparison among the three different versions’ measurements. Left Y-axis: detected output voltage, right Y-axis: responsivity, vs. frequency for constant input power (−20 dBm).
Electronics 08 01450 g016
Figure 17. Comparison between measurements, simulations and ideal square law (responsivity 8000 mV/mW) of the three different versions. Detected voltage versus input power at a fixed frequency.
Electronics 08 01450 g017
Table 1. Figures of merit for W-Band detectors from the references.
ReferenceDeviceResponsivity (mV/mW)TSS/NEP (dBm/pW/sqrt(Hz))
[5]Sb diode10,000 peak
[6]Schottky (VDI)6000 peak−55/−45
[10]HSCH 9161800–2200−49
[11]HSCH 91613800 peak−49
[12]MZBD 9161500 (11,800 peak)−38
[13]MZBD 9161700 (1000 peak)
[15]Schottky (VDI)>2000−33
[16]Schottky (VDI)40001.5
[18]65 nm CMOS80–200200–400
[19]SiGe HBT12,0002.5–4.5
Table 2. Results of the parameter extraction of the total capacitance of ZBD (VDI (Virginia Diodes, Charlottesville, VA, USA) Zero Bias Schottky Diode).
ParameterSymbolValue
Saturation Current (A)Isat27.85 × 10−6
Ideality Factorη1.39
q/ηkT (1/V)α28.6
Junction Capacitance (Vd = 0V) (fF)Cj010
Series Resistance (Ω)RS6.5
Junction Potential (V)Vbi0.16
Finger Inductance (pH)Lf50
Parasitic Capacitance (fF)CP1
Pad-to-Pad Capacitance (fF)CPP16
Input Inductance (pH)LIN59.10
Output Inductance (pH)LOUT48.22
Input Capacitance (fF)CIN3.34
Output Capacitance (fF)COUT0.33
Input Resistance (Ω)RIN2.29
Output Resistance (Ω)ROUT2.34
Coupling Capacitance (fF)CCOUPLING18.37
PAD IN Capacitance (fF)CPAD139.17
PAD OUT Capacitance (fF)CPAD2203.24
Ground Capacitance (fF)CGNDs10.97
Table 3. Comparison of fabricated W-band detectors.
Detector VersionResponsivity (mV/mW)BW Effective (GHz)Pinmin (dBm)NEP (pW/sqrt(Hz))
Version 1 Resistor8000 (@83.5 GHz, −20 dBm)17.2−352.41
Version 2. Microstrip Dual Stub11,000 (@82 GHz, −20 dBm)17.83−34.52.65
Version 3 Microstrip Single Stub5000 (@87 GHz, −20 dBm)21.2−32.53.86
Table 4. Comparison with W-Band Detectors from the references. (*) means the parameter value is given for a specified bandwidth.
ReferenceDiodeTechnologyResponsivity (mV/mW)BWeff (GHz)TSS/Pinmin (dBm)
[5]SbMMIC10,000 (peak)44
[6]Schottky (VDI)MIC6000 (peak)60–110−55/−45
[10]HSCH 9161MIC800–2200 −49
[11]HSCH 9161MIC3800 peak −49
[12]MZBD 9161MIC>500 (peak 11,800) 75–110 GHz
>2000 * 80–104 GHz
24 * (80–104)−38
[13]MZBD 9161MIC Waveguide~700 (peak 1000) 75–110 GHz
[14]Schottky (ACST)MIC 1–100
[15]Schottky (VDI)MIC>2000 86–94 GHz86–94−33
[16]Schottky (VDI) 4000
[18]65nm CMOSMMIC80–200
[19]SiGe HBTMMIC12,000
This work Version 1, ResistorSchottky ZBD (VDI)MIC8000 (@83.5 GHz −20 dBm)17.2−35
This work Version 2, Microstrip Dual StubSchottky ZBD (VDI)MIC11,000 (@82 GHz −20 dBm)17.83−34.5
This work Version 3, Microstrip Single StubSchottky ZBD (VDI)MIC5000 (@87 GHz −20 dBm)21.2−32.5