Article

A Framework for Analyzing and Testing Cyber–Physical Interactions for Smart Grid Applications

1
Department of Electrical and Computer Engineering, Florida International University, Miami, FL 33174, USA
2
Department of Electrical and Computer Engineering, University of West Florida, Pensacola, FL 32514, USA
3
Department of Electrical and Computer Engineering, Florida Polytechnic University, Lakeland, FL 33805, USA
*
Author to whom correspondence should be addressed.
Electronics 2019, 8(12), 1455; https://doi.org/10.3390/electronics8121455
Submission received: 31 October 2019 / Revised: 14 November 2019 / Accepted: 22 November 2019 / Published: 1 December 2019
(This article belongs to the Special Issue Applications for Smart Cyber Physical Systems)

Abstract

:
The reliable performance of the smart grid is a function of the configuration and cyber–physical nature of its constituting sub-systems. Therefore, the ability to capture the interactions between its cyber and physical domains is necessary to understand the effect that each one has on the other. As such, the work in this paper presents a co-simulation platform that formalizes the understanding of cyber information flow and the dynamic behavior of physical systems, and captures the interactions between them in smart grid applications. Power system simulation software packages, embedded microcontrollers, and a real communication infrastructure are combined together to provide a cohesive smart grid cyber–physical platform. A data-centric communication scheme, with automatic network discovery, was selected to provide an interoperability layer between multi-vendor devices and software packages, and to bridge different protocols. The effectiveness of the proposed framework was verified in three case studies: (1) hierarchical control of electric vehicles charging in microgrids, (2) International Electrotechnical Committee (IEC) 61850 protocol emulation for protection of active distribution networks, and (3) resiliency enhancement against fake data injection attacks. The results showed that the co-simulation platform provided a high-fidelity design, analysis, and testing environment for cyber information flow and their effect on the physical operation of the smart grid, as they were experimentally verified, down to the packet, over a real communication network.

1. Introduction

Today, the reliable operation of the smart grid is mainly based on the cyber–physical nature of its components and their configuration. However, the power system and the communication network differ in terms of their dynamic behavior. Therefore, understanding the dynamics of the smart grid’s cyber and physical domains, and the ability to model, analyze, and test the interactions between them, is important in order to ensure reliable power delivery to the critical infrastructures of current and future cities [1].
Some researchers have proposed the co-simulation concept to model the smart grid as a unified cyber–physical system. Within the work conducted in [2], co-simulation is defined as the process to integrate two software packages together and provide harmonization between them. In [3], researchers developed a co-simulation framework through which they combined OMNeT++ and OpenDSS for communication networks and power system simulations to examine wide area monitoring applications. Also, researchers in [4] showed a framework to simulate a power-routing algorithm for microgrid-clusters by combining OMNeT++ with real-time digital simulators. In [5], the authors pointed out the existence of a huge research gap regarding the simulation of cyber-physical systems and recommended that more research is required in this area. Therefore, they presented an event-driven co-simulation scheme utilizing Network Simulator NS2 and OpenDSS. In [6], a co-simulation setup based on IEC 61850 was presented for a low-voltage grid. MATLAB toolboxes SimEvents and Sim Power Systems were utilized for the modeling of the information flow between the system’s cyber and physical layers, respectively. The aforementioned research denotes a significant step to achieve proper modeling techniques for the physical and cyber domains of cyber–physical systems. However, these schemes are not being deployed over an actual communication network. Accordingly, capturing the practical issues associated with high fidelity will be difficult since they are limited to the network simulation software’s provided functionalities. For example, network simulators usually model networks on the large-scale using probabilistic and statistical models to forecast delays; they do not function on the packet level. Besides, there are practical issues associated with the fact that implementation of different firmware cannot be achieved in network simulators.
Examining this topic from another point of view, much research has involved hardware-in-the-loop (HIL) with simulation platforms. For that, there are two main approaches: (1) designing and testing networks by integrating embedded devices and intelligent electronic devices (IEDs) with traffic generation software packages, and (2) integrating physical power equipment such as converters, generators, and actuators into a simulation setting to test and validate the performance of control algorithms on hardware. A HIL testbed for distributed energy management for microgrids (MGs) was shown in [7]. The system presented utilized Zigbee protocol and the hardware and simulation were integrated using an I/O conditioning board. Also, for the research conducted in [8], phasor measurement units were connected to a real time digital simulator through an IEC 61850 bus for passive islanding schemes modeling. The former implementations have two main drawbacks, they are application specific, and it is difficult to scale up the system and deal with the complicated communication requirements for the other applications of the smart grid. Some research in this regard was conducted utilizing pure networking. For instance, [9] introduced a technique for IED testing within a platform that includes numerous protocols. However, protocol integration is based on a proprietary distributed test manager; therefore, it cannot be scaled easily, and special libraries are required to interface with it. Both approaches for modeling are single sided and do not offer a complete framework to properly model cyber–physical systems and their interactions. Also, the first approach is usually concerned with a single or a few protocol integrations and will need a lot of programming effort to combine various devices and applications together.
Additionally, and as explained in [10], comprehensive security mechanisms are required to deal with cyber security and vulnerabilities brought about by communication-assisted control and operation of the smart grid. Therefore, co-simulation, which provides cohesive platforms for the physical and communication infrastructures of the smart grid is important in the design and testing stages of cyber security solutions.
The work in this paper extends the authors’ previous work [11] by presenting a framework to analyze the cyber and physical information flow in the smart grid. Further to what is presented in the literature, which are well-detailed but application-oriented co-simulation platforms, the contributions of this framework that are beyond what is present in the literature are as follows:
(1)
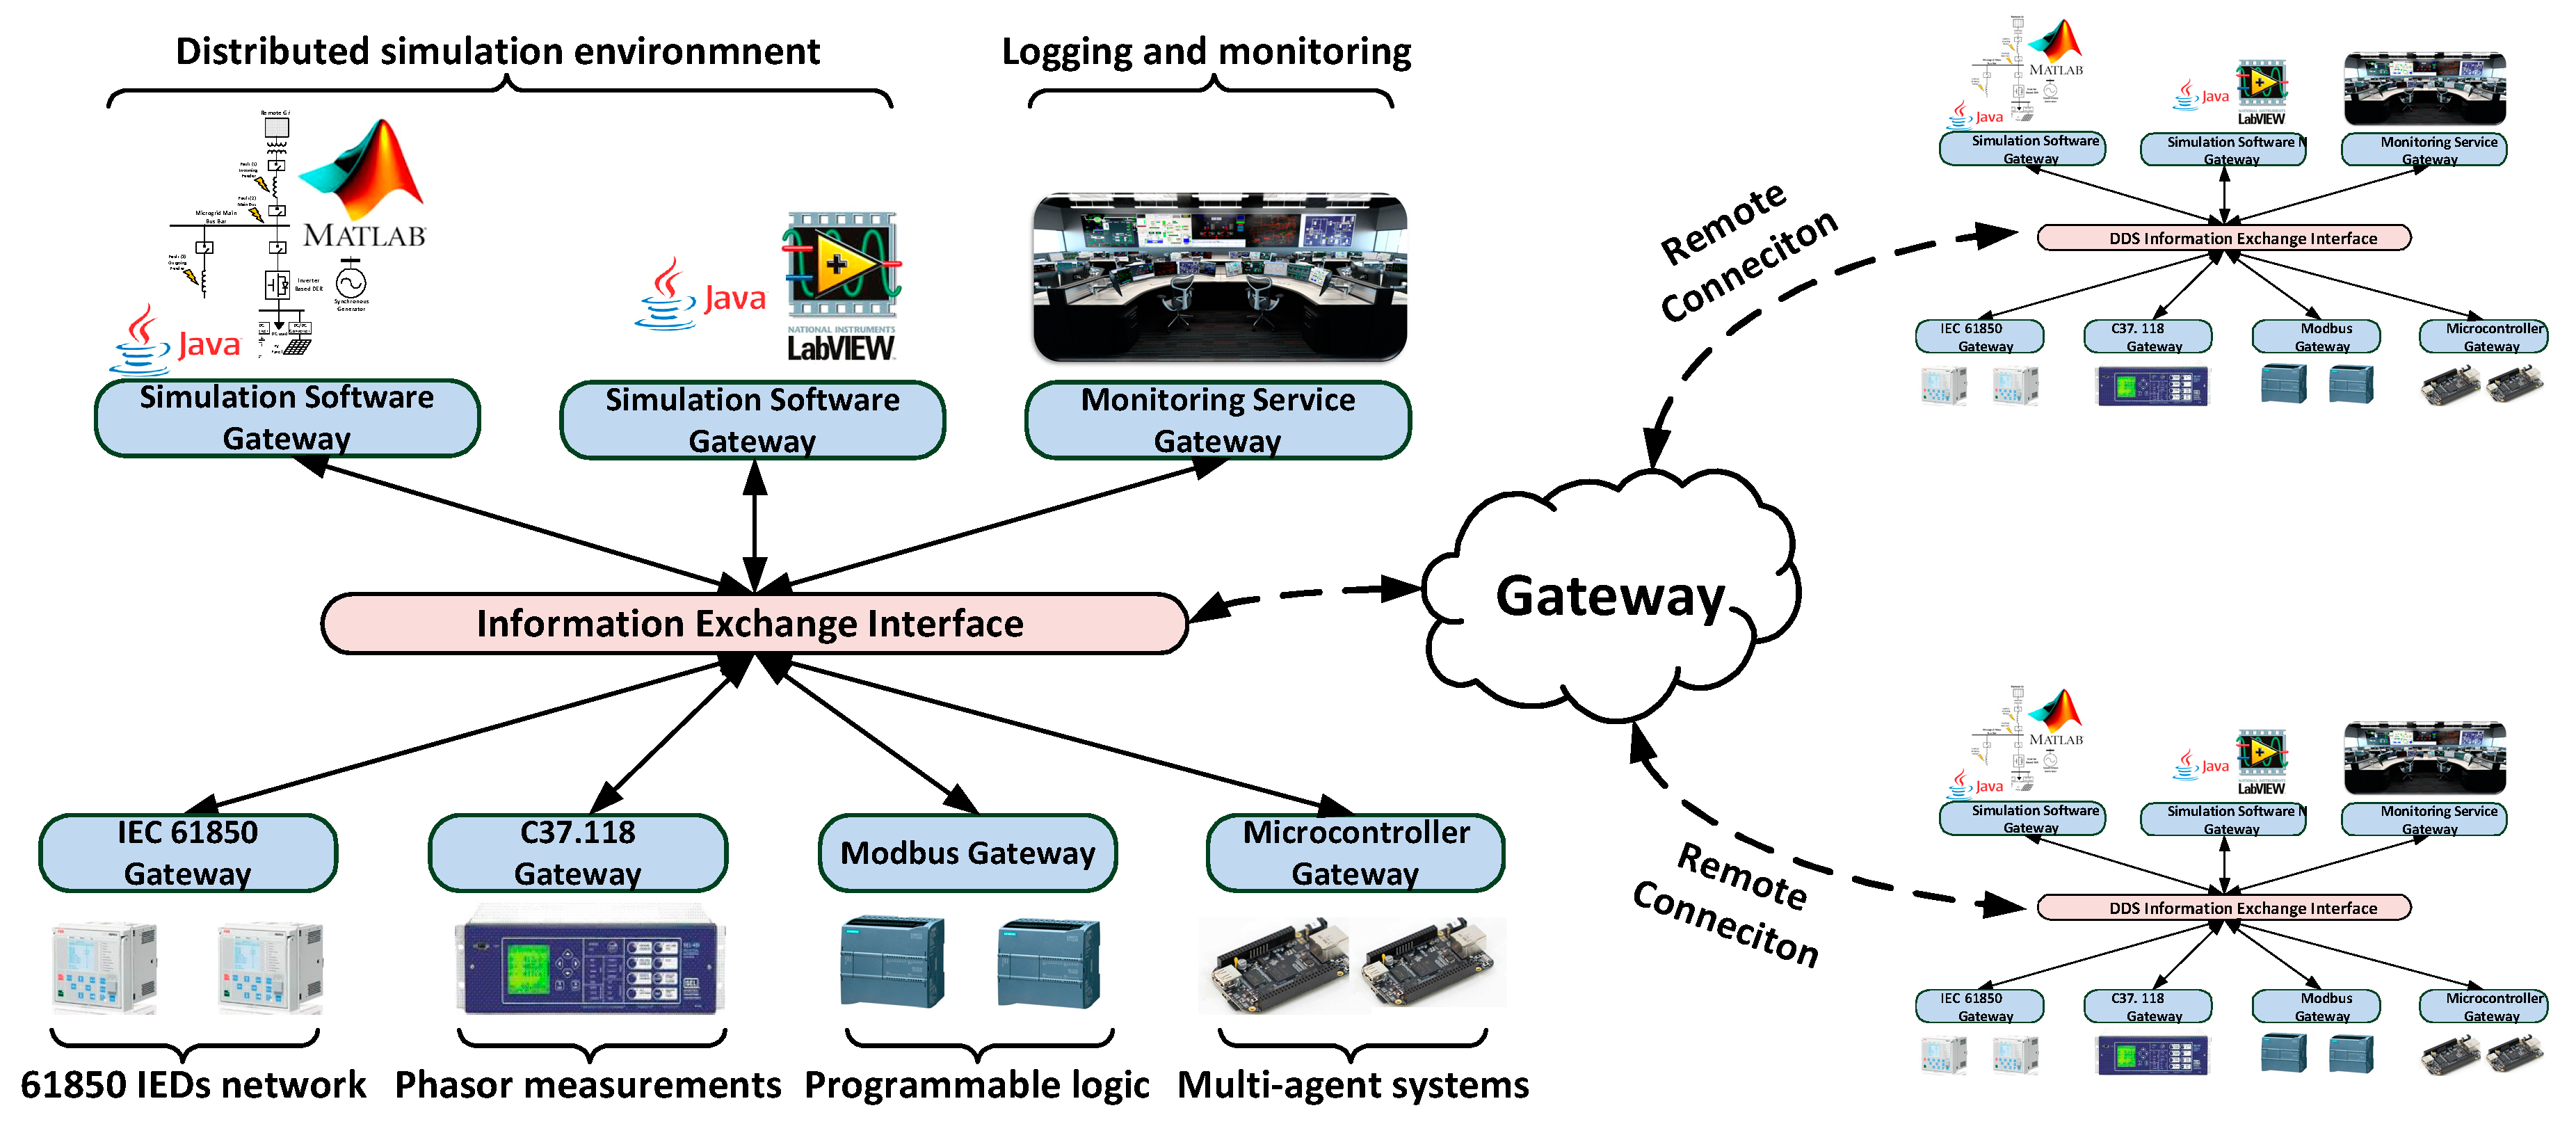
A holistic cyber–physical energy systems framework, with ease of integration of simulation packages, software, and hardware by utilizing a data-centric communication backbone to manage information exchange and seamlessly orchestrate the components of the system together.
(2)
Protocol emulation and translation, which allows the integration of a wide range of multi-protocol/multi-vendor devices into the developed framework.
(3)
Scalability to a wide range of smart grid applications, as demonstrated in the case studies.
(4)
Remote connectivity, data monitoring, and logging.
The rest of the paper is organized as follows: Section 2 describes the framework main components; Section 3 demonstrates the development procedure for the co-simulation framework; and Section 4 presents the effectiveness of the proposed framework in three case studies, including hierarchical control of EV charging, IEC 61850 protocol emulation and translation, and detection of fake data injection attacks. Finally, Section 5 concludes the paper.

2. Framework Description

Figure 1 shows a conceptual representation of the proposed framework. The developed framework consists of four main components: (1) power system simulation packages, (2) embedded microcontrollers, (3) information exchange interface and protocol translation, and (4) monitoring, logging, and remote connectivity.
(1) Power System Simulation Packages
In the smart grid, cyber information flow affects physical processes and the dynamics of physical systems influence the operation and decision of cyber processes. However, in the analysis, design, and testing phases of smart grid applications, which are the scope of this paper, it was impractical and highly expensive to test on field devices. Also, in the design stage, physical system dynamics and their tolerance to software and communication constraints could not be ignored. Given the fact that the laws of physics that govern the operation of the physical processes are well formulated in mathematical models with high accuracy, the interrelation between physical systems on one hand, and the software and communications realms on the other, could be adequately and safely captured through the incorporation of power system simulation software. In this work, SimPowerSystems from Matlab/Simulink was utilized as the power system simulation package due its popularity and extensive libraries.
(2) Embedded Microcontrollers
Software developers face a lot of challenges when implementing their algorithms on microcontrollers. These challenges include limitations on processors’ speed, memory allocation, interfacing with the network, and other practical issues. Since software algorithms would be controlling critical processes, it was important that the mentioned challenges are exhausted in a safe and high fidelity environment. Therefore, in this work, all the software and control logic were implemented on hardware embedded devices.
(3) Information Exchange Interface and Protocol Translation
Middleware technology is a practical solution which ensures language, platform, and vendor independence in smart grid applications. Using the common middleware data bus, applications exchange messages via the middleware without worrying about each other’s computing devices and configurations. The middleware, thus, introduced an abstraction level to the smart grid from the heterogeneous nature of the communication networks, operating systems, and programming languages [12].
In this work, the Data Distribution Service (DDS) machine-to-machine middleware from the Object Management Group (OMG), [13], was utilized to enable real-time integration of various applications within the developed co-simulation framework. DDS is a data-centric middleware that follows a publisher–subscriber model for distributed control applications. It possesses a relational data modelling method in a decentralized data space which decouples applications in time and space. DDS supports automatic network discovery and has a rich set of quality of service (QoS) profiles which are configured depending on the applications’ needs [13,14,15].
Another reason for choosing the DDS as a common data bus for the developed platform is that it has an application programing interface (API) that facilitates mapping of other industrial protocols such as Common Information Model (CIM), IEC 61850 Generic Object Oriented Substation Event (GOOSE) messages and sampled measured values (SMV) messages into DDS, as will be explained later. In this work, protocol translators were developed to enable seamless interfacing of multi-vendor multi-protocol devices with the developed framework.
The focus of this work was to provide a credible platform that harmonized information flow between different smart grid applications and an understanding to their cyber–physical nature. By utilizing the DDS middleware layer here, the proposed framework had the ability to support multiple power system communication protocols and standards, thus, providing interoperability between devices from different vendors. Since DDS could be interfaced with many simulation tools, the developed platform supported fully distributed applications over an expandable number of different simulation stations. The operator did not need to worry about integrating all these devices together as the DDS provides automatic network discovery features, and also learned various data structures and types of the newly joined devices and/or applications. Therefore, conceptually, a holistic smart grid framework could be modelled over a distributed network architecture, managed by the DDS middleware, and allowed to interact with real hardware devices over a real network.
(4) Monitoring, Logging, and Remote Connectivity
A monitoring and logging service was developed for the operator to keep track of the operation of the tested systems. The monitoring service also provided a visualization tool in the form of a relational graph that showed the logical relation between the components of the system and their data structures in real-time. The data logging service stored the exchanged information and the network packets for post processing.
There are a lot of situations in the smart grid where controllers interact with each other and collect sensor data over the wide area network, such as smart metering and demand side management. Therefore, in this work, remote connectivity to the developed framework was established through routing and web integration services.

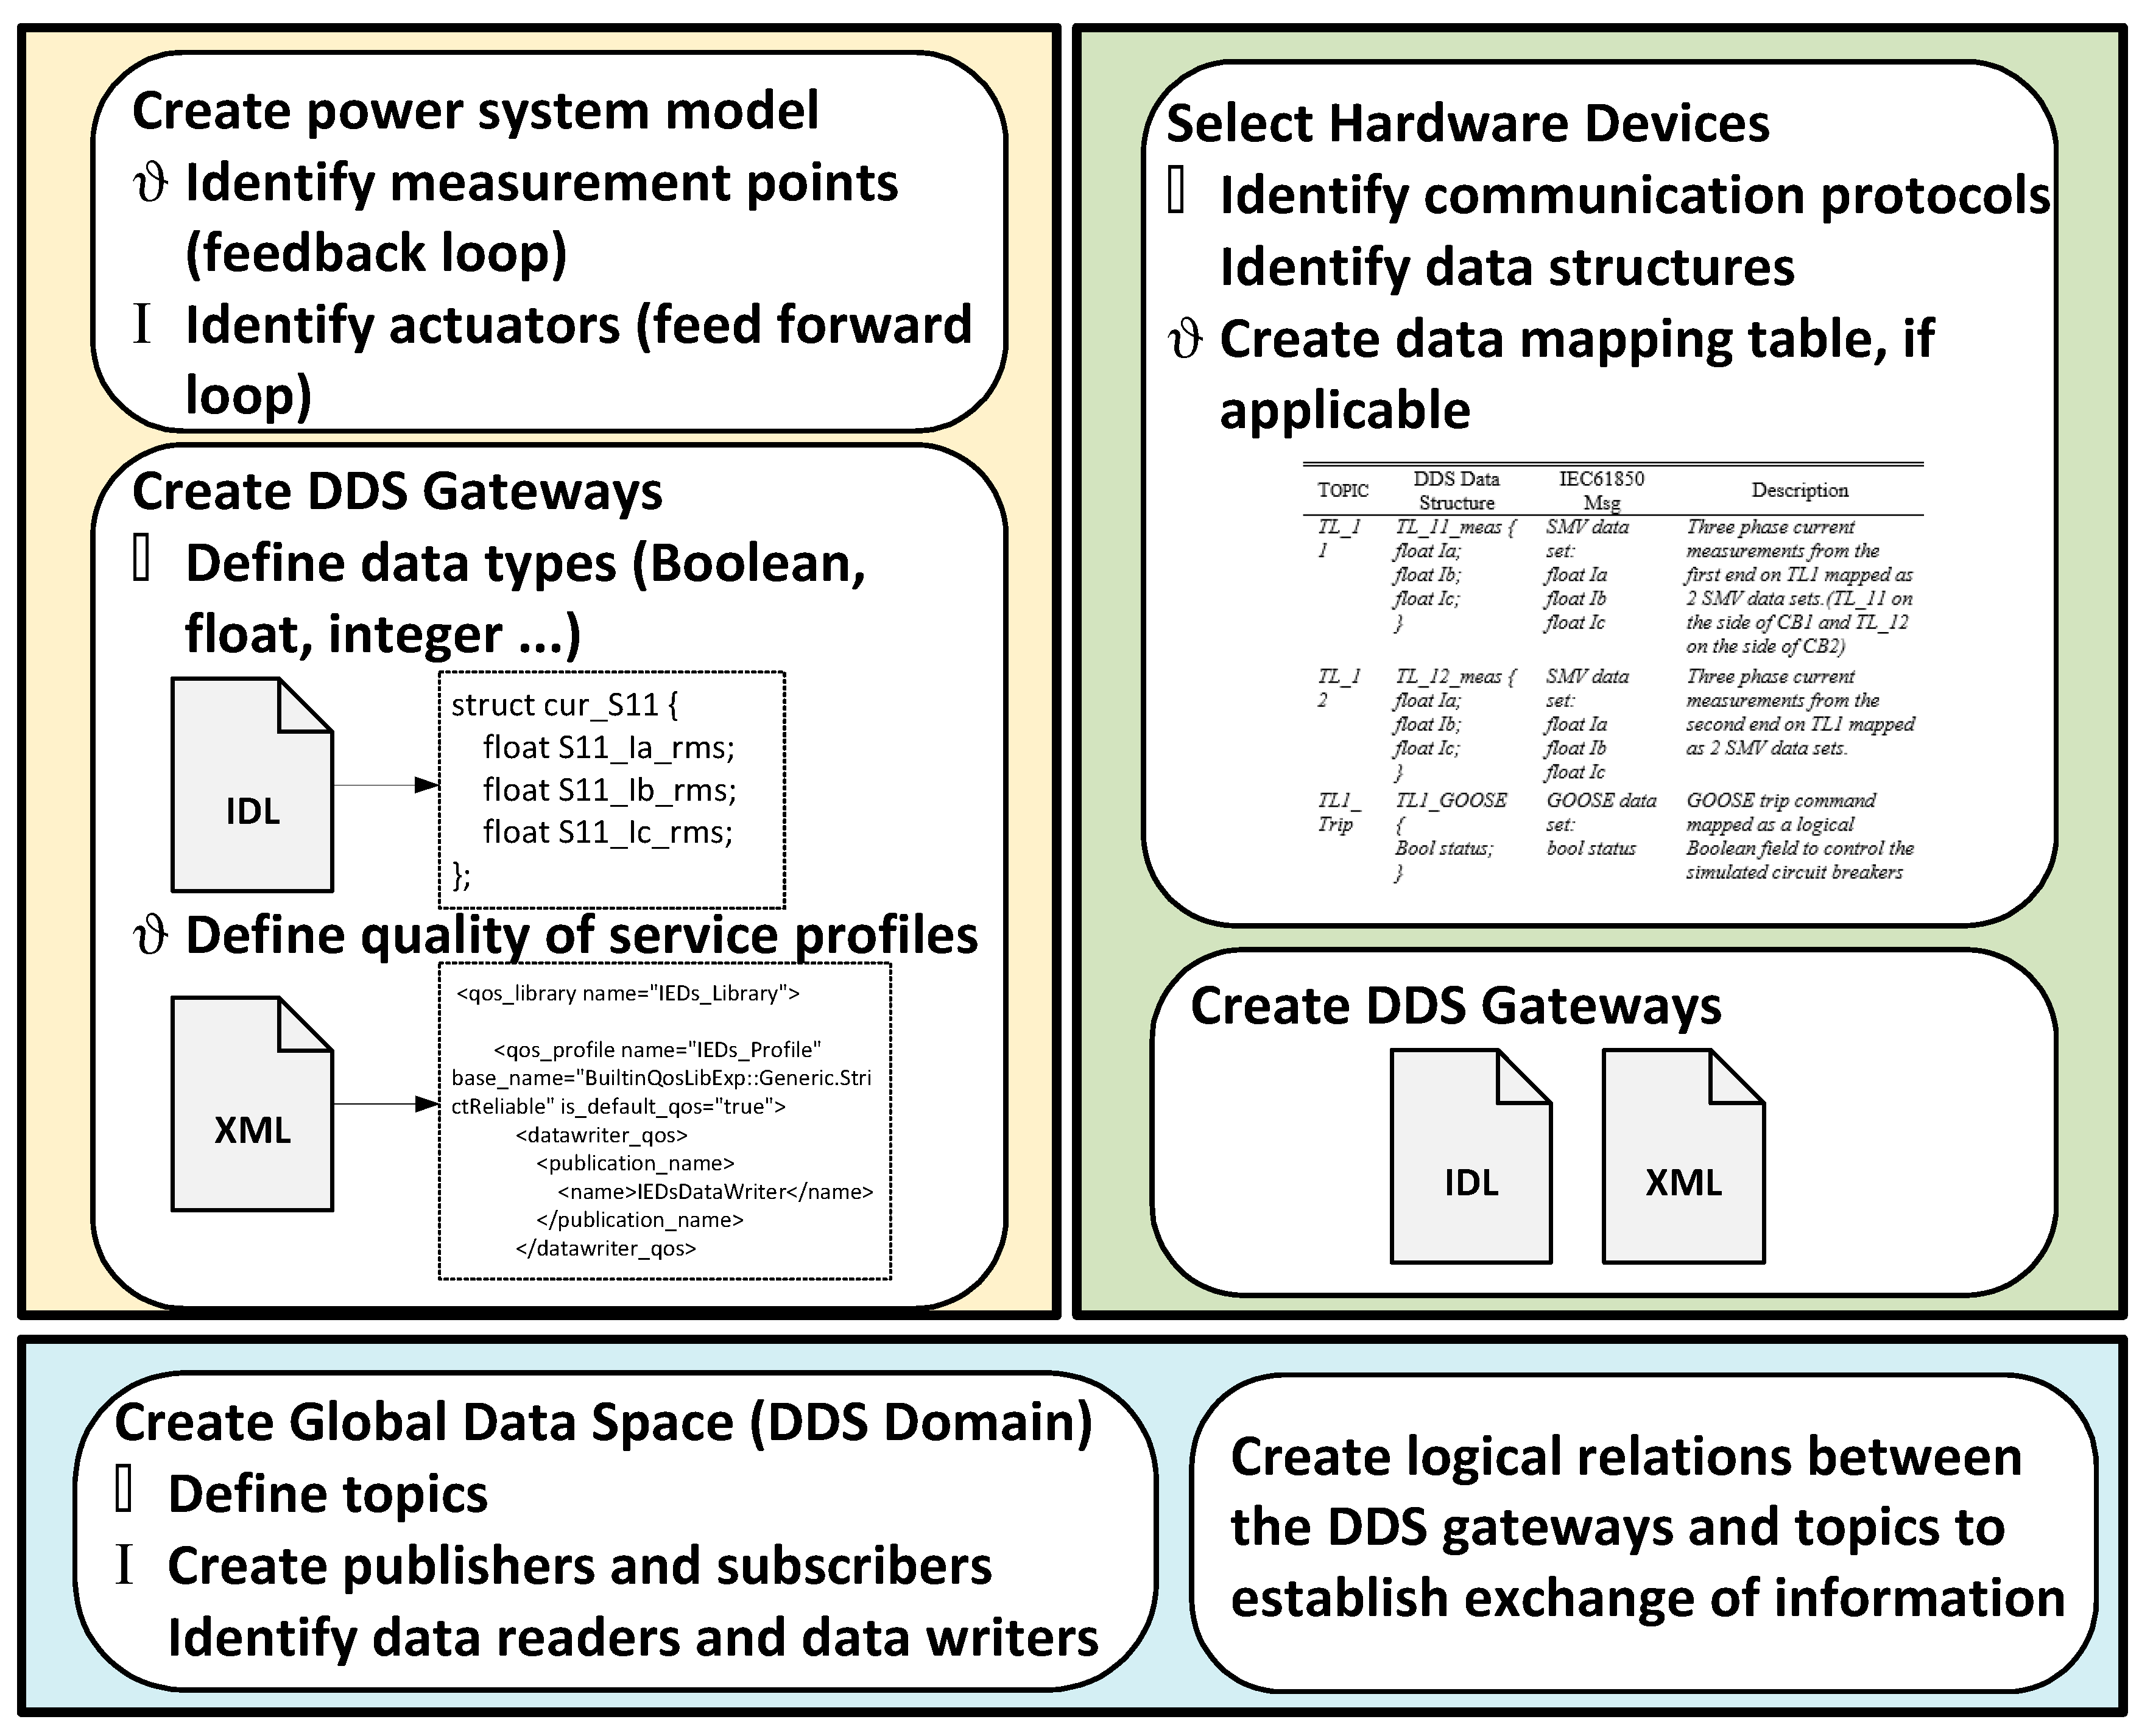
3. Procedure for Developing the Co-Simulation Framework

Figure 2 shows the general procedure to link the components of the developed co-simulation framework together. In terms of the power system, the simulation model needed to be created first. Next the developers needed to identify the measurement points (or the feedback loops) and the actuators (or the feed forward loop).
The next step was to create the DDS gateways. In this step, it was important to identify the nature of the measured data. If the data is circuit breaker status data, then it is defined as Boolean, if the data is current measurement, then it is defined as Float, and so on. After that, the data structures were organized in an interface definition language (IDL) file, one file for each gateway. Finally, an XML file was created to define the quality of service profiles for each application.
In the platform-verification case studies, which are presented later in this manuscript, the physical models were simulated on Simulink, and only the blocks which are available in Simulink where used. No special toolboxes/blocks where created by the authors for this purpose. Simulink interacts with DDS through the gateways, which the authors created inside Simulink. Inside these gateways, the authors utilized the DDS Simulink Blocks provided by RTI DDS [13]. These blocks are used to configure the DDS domains, create the necessary publishers, data writers, subscribers, and data readers to update and/or read data from topics in the DDS global data space. Accordingly, the use of each block was follows:
  • Domain participant: participates in the appropriate DDS domain as defined by the user.
  • DDS publisher/subscriber: can be configured as a publisher or as a subscriber. The DDS topic name to subscribe to/publish from and the DDS data types to read/update need to be defined by the user.
  • DDS reader: reads data per the definitions in the subscriber block.
  • DDS writer: updates data per the definition in the publisher block.
In terms of the cyber control, the first step was to select the hardware devices and identify their communication protocol and programming language. Next, a data mapping table, if needed, was to be developed to organize the translation procedure between the protocol of the hardware devices and the data structures defined in the DDS gateways. Finally, the XML quality of service profiles were defined.
To link the communication software with the hardware devices, a global data space (a DDS domain) needed to be created. In that domain, different topics needed to be created. The creation of the data topics allowed the developers to draw logical relational graphs between all the components of the system. That is, a relation graph was created between all the publishers (and the corresponding data writers) and the subscribers (and the corresponding data readers).
Figure 3 shows the hardware microcontrollers that were selected to implement the control logic of all applications in the case studies that will be detailed later. The devices were Odroid C2 embedded microcontrollers that had an ARM® Cortex®-A53 1.5 Ghz processor were running on a real-time Linux Kernel. Also, a dedicated Ethernet switch was utilized in all the case-studies.

4. Verification Case Studies

This section will present three case studies that were implemented over the developed co-simulation framework. The first case study was about hierarchical control of electric vehicle charging. The emphasis of this case study was on the utilization of the DDS common information exchange bus to link the components of the co-simulation framework together. The second case study was a protection application for active distribution networks. Its focus was on showing the ability of the developed framework to incorporate multi-vendor/multi-protocol devices via protocol translation and emulation. Finally, the last case study was on intrusion detection and focused on the importance of the developed framework in cybersecurity studies.

4.1. Hierarchical Control of Electric Vehicle Charging

A block diagram of the MG in this case study is shown in Figure 4. It consisted of four buses with a local conventional generator connected to bus B1 and an inverter-based photovoltaic (PV) source connected to bus B4. The MG had four constant loads, each connected to a different bus, and two 3-phase dynamic loads connected to buses B3 and B4. An EV was connected to every bus. This was done to take into consideration the anticipated high penetration of electric vehicles. The PV source was controlled through an inverter, which controlled the amount of injected power to the MG. The charging of the EVs was done through controlling the pulse width modulation of the DC–DC converter.
On top of the simulated physical layer, a cyber layer was present, which was composed of a two-level hierarchy of agents. As shown in Figure 4, the lower cyber layer was composed of 4 EV agents, which were responsible for calculating the requested charging current for the EV chargers, whereas the upper cyber layer was composed of a MG control agent (MCCA), which was responsible for setting the final reference charging current for every EV to charge the batteries while maintaining the voltages at the different buses within The American National Standards Institute(ANSI) standards [16].
A communication layer linked the physical and cyber layers together through a global data space, which contained three topics: requests, decisions, and simulation clock. The simulation clock topic was created to synchronize the hardware agents with the Simulink clock. A DDS gateway was created for every bus of the simulated MG. On one hand, these gateways would collect and publish the necessary input for the hardware agents. On the other hand, they would subscribe to the commands issued by the hardware agents and execute them on the simulated MG.
Every 6 minutes, each EV agent read the current state of charge ( S o C c ) of the EV battery and calculated the requested charging current (Ireq) based on Equations (1) and (2).
I r e q = ( S o C f S o C c ) × M C t
I r e q _ f = min ( I r e q ,   I r a t e d )
where S o C f is the final state of charge set to 80%, M C = 24   kWh is the battery capacity, I r a t e d = 15   A is the maximum charging rate, and t is the requested time to reach S o C f . In this study t = 4 ,   6 ,   7 ,   and   5   h for EV1, EV2, EV3, and EV4 respectively. After calculating the requested charging current, each EV agent wrote a charging request vector to the requests topic, as R = { E V I D ,   I r e q f ,   V p u } , where E V I D is the unique identifier of the EV and V p u is the p.u. voltage of the bus at which the EV is connected.
Next, the MCC agent collected all the requests for charging and readjusted the charging currents for each EV according to the heuristic rules in Equations (3) and (4). The MCCA utilized Equation (3) in the cases where the bus voltages were healthy, i.e., no under voltage. However, the MCCA utilized Equation (4) when there was an under voltage on at least one bus.
I r e f i = { I r e q i i f ( V i > 0.97 )     i [ 1 , 4 ] 0.75   I r e q i i f   ( 0.955 < V i 0.975 )   i f     i [ 1 , 4 ]
I r e f i = { k   I r e q i   k = 0   i f   V i 0.955 i     [ 1 , 4 ] k = 0.5   o t h e r w i s e
The MCCA published its decisions vectors D = { E V I D , I r e f } to the decisions topic.
The results of this case study are presented in Figure 5. Figure 5a shows the SoC of the EV batteries over time. It can be seen that all EVs reached 80% SoC within the requested time frames ( t = 4.2 ,   6.2 ,   7 ,   and   5.1   h for EV1, EV2, EV3, and EV4, respectively). The voltages in per unit at the four different buses are shown in Figure 5b. During the experiment, the voltages at all buses were maintained above 0.95 p.u., which is desired. It can be also seen that the voltage at B1 was the highest since it was connected directly to the generator. At bus 4, the voltage drop across the feeder was compensated for by the power injected from the inverter. Therefore, B4 maintained high voltage values. However, buses B2 and B3 had lower voltages, since they were far from the generation buses, especially B3, since it was connected at the far side of the feeder. The fluctuations in the charging currents of the EV batteries can be seen in Figure 5c, which were following the decisions of the MCCA.
It is worth mentioning that the focus in this case study was not on the sophistication of the control algorithm, rather on the functionality of the framework to test the system under study.
As can be appreciated from the results of this case study, the developed framework was successful in providing a smooth link between a multi-agent hardware/software infrastructure and a simulated power system. Through this link, the effect of the control logic, which was implemented in C++, was tested and the response of the power system to the control logic was analyzed.
It is important to mention that the simulated microgrid had several components, which did not allow us to utilize the real-time kernel in MATLAB. Therefore, due to slow simulation performance, the simulation was running out of sync from the hardware controllers. In theory, if the user were to simulate the power system on a high-end processor, such as real-time digital simulators, simulation delays would not be a problem, as both hardware and software would be running in real-time. However, in our case, since we were using a standard PC with an Intel i7 processor with 32GB of RAM, we worked around this issue by creating the simulation clock topic.
The hardware microcontrollers subscribed to the simulation clock topic in order to synchronize their clocks with the simulation clock, which was the slowest clock. Therefore, the simulation clock was the reference to emulate the real-time clock.

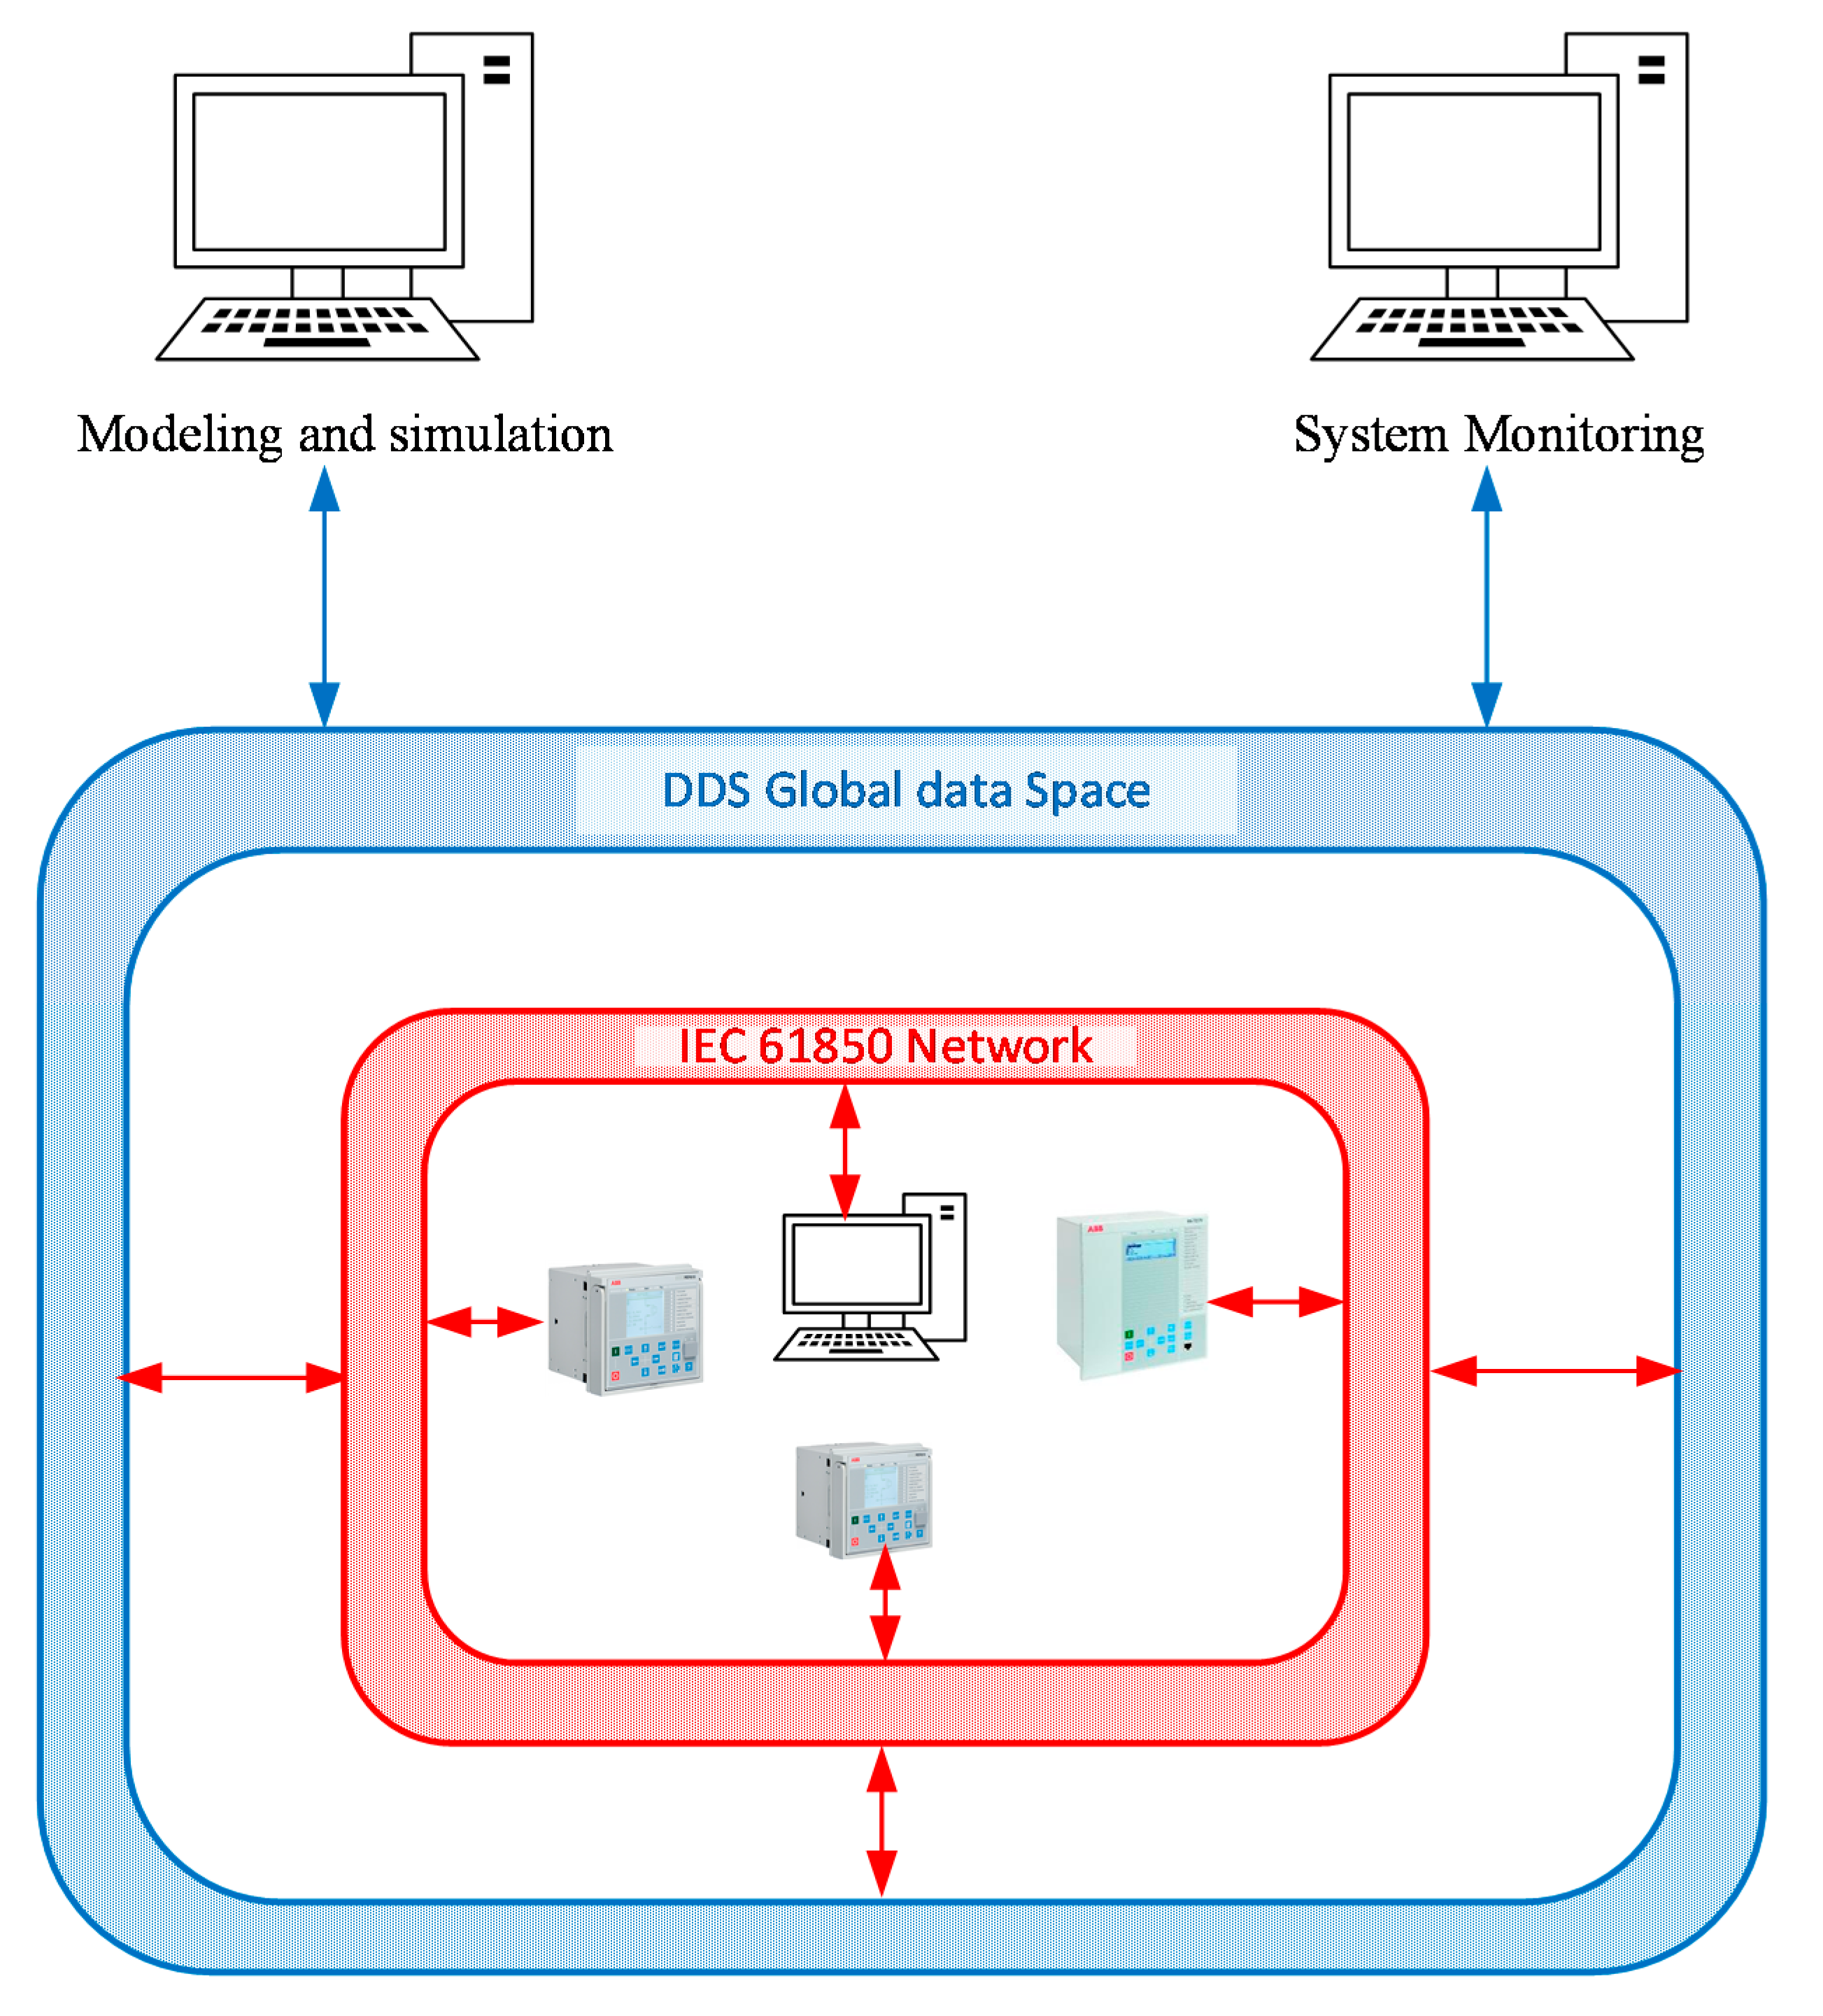
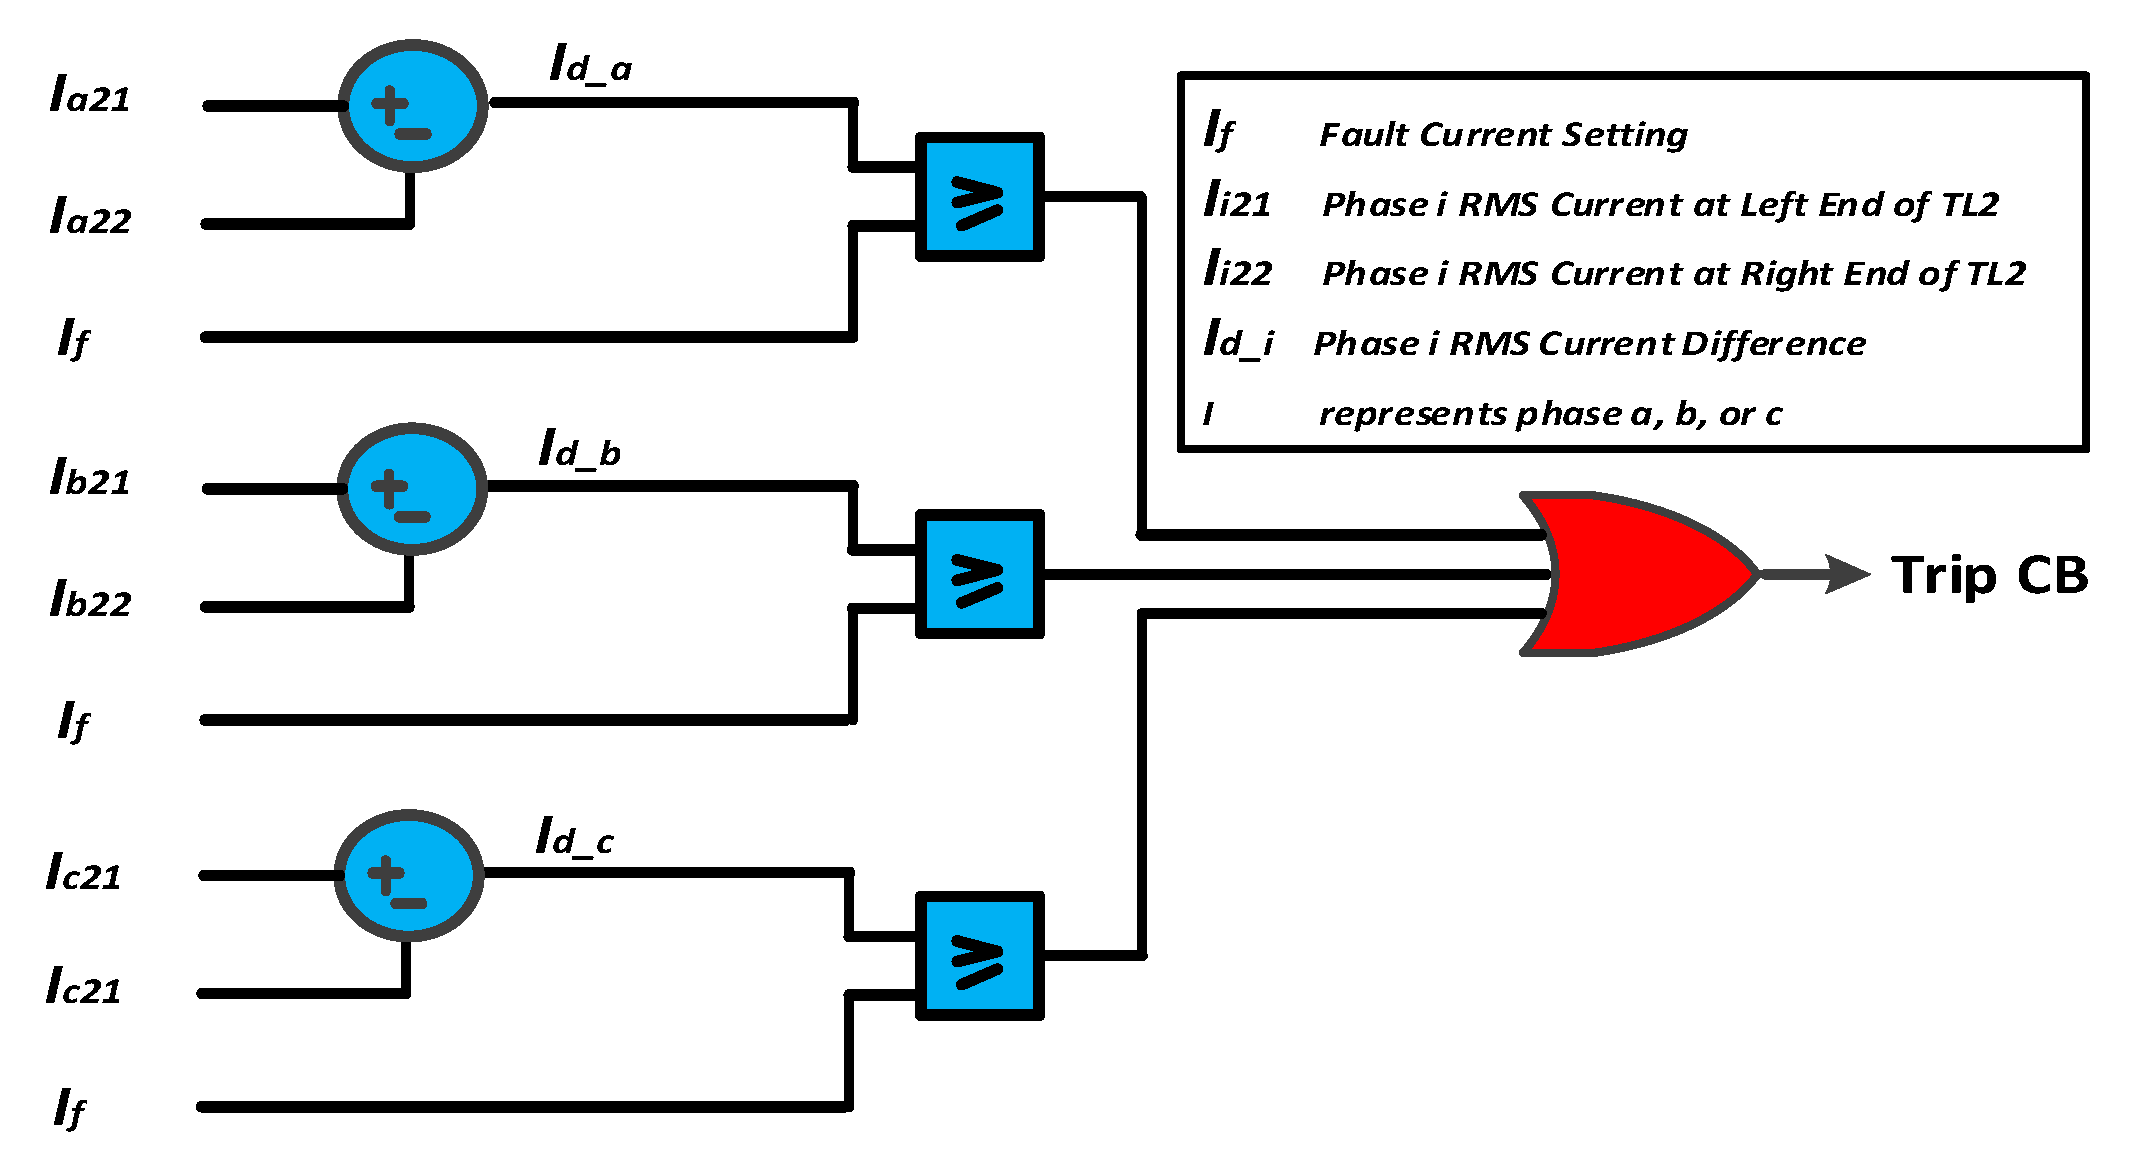
4.2. Protection of an Active Distribution Network

In this case study, we focused on how the developed framework supported the incorporation of multi-protocol devices through protocol translation. To achieve that, an IEC 61850-based differential protection algorithm was designed and interfaced with a 4-bus active distribution network.

4.2.1. System under Study

The system under study is a MG model shown in Figure 6a. This MG encompasses three transmission lines (TLs), named TL-1, TL-2, and TL-3. Different types of DC and AC loads were supplied at buses 3 and 4. TL-1 tied the MG to the grid via circuit breakers (CBs) 1 and 2. The power flowed from either the main grid or the two generators (G-1 and G-2) to the loads over TL-1 and TL-2. Three DDS gateways (i.e., linking modules) were integrated in the model as an interface linking the simulated MG with the physical merging units (MUs) and IEDs.

4.2.2. Flow of Information within the Co-Simulation Model

The DDS gateways, which were blocks developed inside Simulink via the DDS Simulink Blockset, received the 3-phase current measurements from Matlab-Simulink, then published them to the DDS Global Data Space (GDS), each measurement to its corresponding topic. The MUs, in their turn, had gateways programmed into them. These gateways, then, obtained the measurements by subscribing to the GDS, then translating them to IEC-61850 SMV packets, and finally publishing the translated measurements (SMV messages) over the Ethernet network.
For each TL, an associated IED read the published SMV measurements from the corresponding MUs and sent a command (i.e., GOOSE message) to trip the corresponding CB, if required, according to the coded protection scheme in the firmware. The IED associated with the CB also had a gateway programmed into it that subscribed to read the corresponding GOOSE signals then converted them to DDS messages to switch on/off the CB status in the simulated MG model. The flow of information between software and hardware, and the conversion between the different protocols through the gateways is depicted pictorially in Figure 6b.
The communication between the simulation and the physical hardware microcontrollers happened over a dedicated Ethernet network switch, which can be seen in Figure 3.
The gateway coding embedded within the IEDs and Mus and the mapping/translation between IEC61850 GOOSE /SMV messages and DDS was coded using C-language utilizing the open source library libIEC61850 [17], and libraries from DDS API from Real-Time-Innovation (RTI) OMG.
An IDL file which encompasses the IEC-61850 data modules was sent to the automatic subscriber/publisher code generator, adopted from RTI. The code generated was then combined with routines that were available in libIEC61850. The codes developed were then downloaded on Odroid-C2 single board computers (SBCs), representing the IEDS, running a real time Linux-kernel operating system. Table 1 shows an example for translation between DDS and IEC-61850 SMV/GOOSE messages for TL1.

4.2.3. DDS Advantages
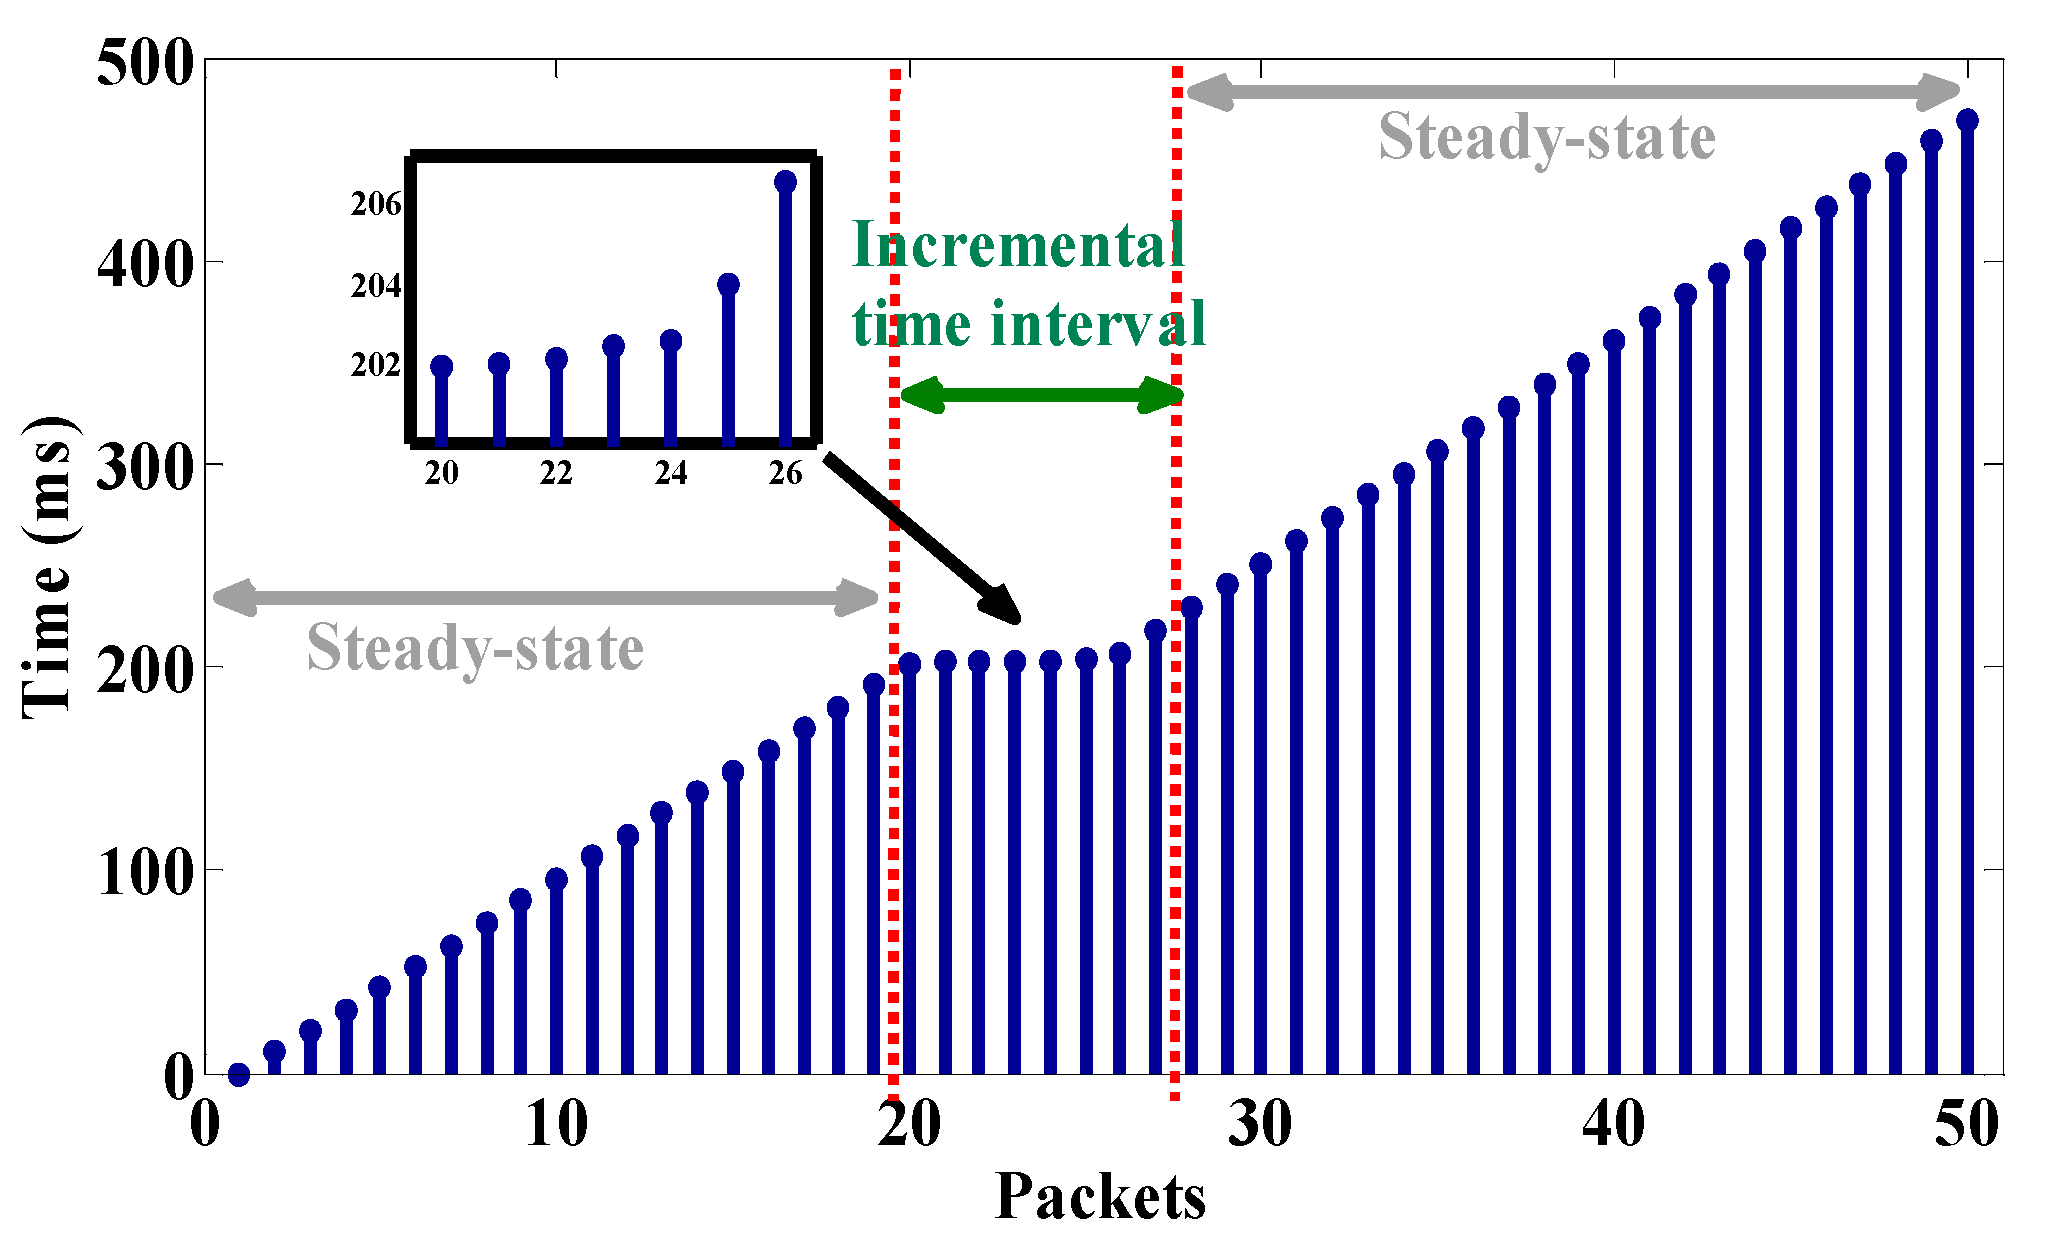
As discussed earlier, DDS offers a standard flexible API in order to integrate/combine with various systems and different programming languages. Since DDS is a data-centric communication middleware, the structure of the message is directly driven from the system data model with no necessity for a predefined specific set of messages’ structures. Besides, the automatic code generation for subscribers/publishers is built upon the data models defined by IDL and/or XML files, and facilitates the incorporation of different types of data for other utilized protocols by different remote units and IED’s vendors. Figure 7 demonstrates how IEC-61850 is connected to the simulation via the DDS GDS.

4.2.4. Case Study

A 3-phase to ground fault was applied on TL-2 at time t = 5.5 s. DDS Gateway-2 read the current measurements from the CTs at both ends of the TL and published them to the GDS as DDS messages. Two physical MUs were subscribing to the GDS to acquire these published measurements. From this perspective, it can be seen that the IEC-61850 process bus concept was applied. These MUs published these measured currents values as SMV-packets at a publishing rate of 4800 Hz as recommended by IEC-61850 for the 60 Hz systems. An IED that had the protection logic coded on it, was then subscribed to read these SMV messages. Then the IED performed a simple arithmetic process, firstly calculating the RMS value of all the received measurements and then, the difference between the two RMS-currents values at both ends of the TL for each phase according to Equation (5).
I d i f f a b c = | I 21 a b c I 22 a b c |
where I d i f f a b c is the difference in current per-phase, I 21 a b c is the current of phase-1 at the left end of TL-2, and I 22 a b c is the current of phase-2 at the right end of TL-2. If the current difference in any of the phases at both ends of TL-2 was bigger than or equal to the predefined fault current, the IED would send a command signal to trip the CB as GOOSE message. This is demonstrated in the logical diagram in Figure 8 and Equation (6).
C B S t a t u s = { 1 ( I d i f f a I f )   | |   ( I d i f f b I f )   | |   ( I d i f f c I f ) 0 o t h e r w i s e
Finally, the IED subscribing to this corresponding GOOSE messages mapped it (i.e., translated it) to a DDS Boolean signal command to change CB3 and CB4 status in the MG simulated model. The system frequency was recorded and presented along with the status of the CBs in Figure 9.
It can be seen in Figure 9 that the system frequency dropped from 60 to 59.82 Hz after the fault occurrence at t = 5.5 s. However, the frequency of the system was quickly restored to 60 Hz after clearing the fault by opening CB3 and CB4 as a response of the GOOSE tripping message issued by the associated IED. It can be noticed and appreciated from the results that the microcontrollers (i.e., IEDs) were capable of identifying, locating, and issuing trip signal-commands in order to isolate the fault within the MG simulated model in a timely fashion based on the feedback measurements received by the controllers from the MUs, which in their turn got the measurements vis subscribing to the GDS. Also, the MG simulated model received the correct trip signal-commands from the controllers via the linking modules (i.e., DDS gateways) and was able to trip open the corresponding CBs to achieve successful fault clearing.
The cyber portion of this system was mainly the exchanging of GOOSE and SMV messages over an actual Ethernet network. It was integrated successfully with the simulation environment that was representing the system dynamics in response to the protection control actions. Yet again, this confirms the ability of the framework proposed to capture accurately the relations between the cyber and the physical flow of information in electric power systems.
Moreover, the co-simulation framework was utilized to analyze and examine the performance of the IEC-61850 process bus in terms of transmission delays and sampling rates. GOOSE and SMV messages were logged using Wireshark network analysis tools. Figure 10 shows the recorded transmission rate of the SMV messages. The SMV average rate of transmission was found to be approximately 4.76 KHz, which is near the recommended rate by IEC 61850 that is 4.8 KHz [17,18,19].
As for delays, Figure 11 shows the rate of re-transmission of the GOOSE messages to Circuit Breaker CB3. It is worth mentioning that during normal operation the re-transmission rate was constant; however, during faulty operation it increased exponentially. It can be seen in Figure 11 that during steady-state normal operation of the MG, the GOOSE messages were being re-transmitted at a fixed rate, around 10 ms. Fault events took a place at packet No. 20. During these faulty events, the IED started sending GOOSE messages with an incrementing transmission rate (i.e., exponential rate) until the protection system disconnected the corresponding CBs and the system steady state was restored again. It can be seen in Figure 11, in the zoomed square, that during the faulty event the GOOSE signal was increasing exponentially until the fault was cleared (i.e., tripping the corresponding CBs). Table 2 displays that the recorded average delays for SMV and GOOSE messages were within the 4 ms constraint recommended by the IEC-61850.

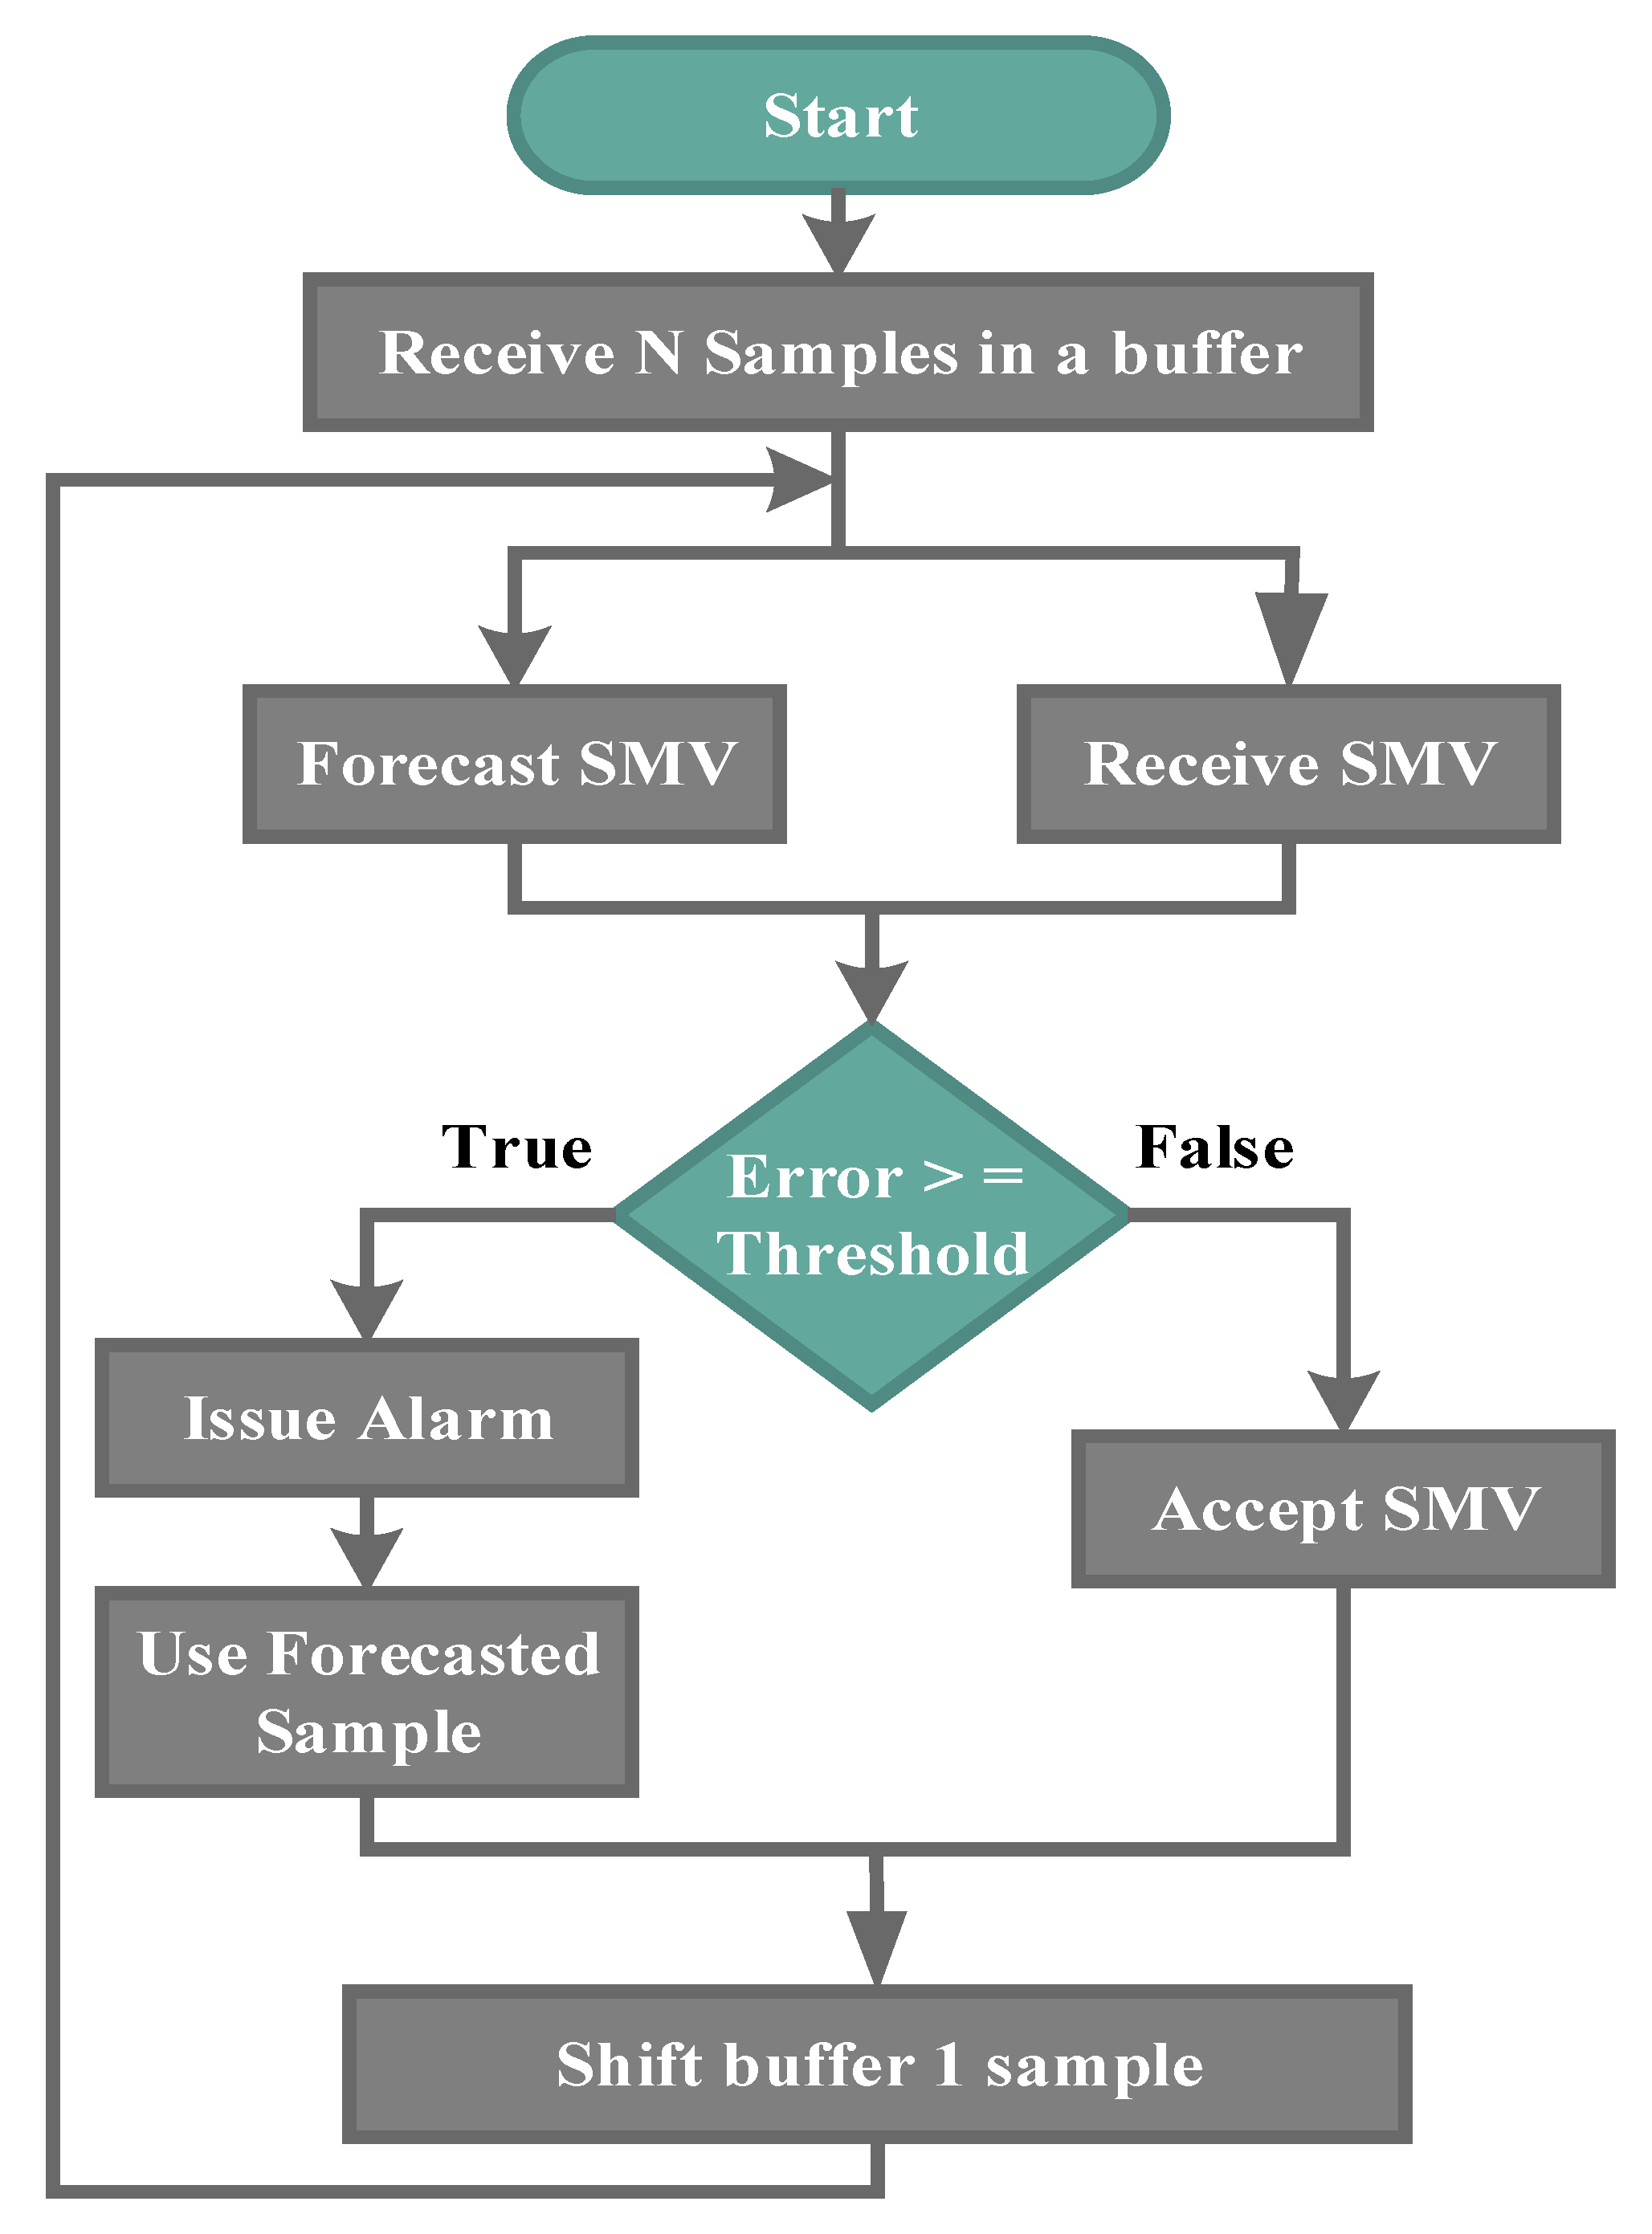
4.3. Detection of Fake Measurement Injection Attack

As mentioned earlier, one of the purposes of the developed framework is to use it for testing cyber security algorithms over a real communication network and assess their effect on the operation of the power system. For that purpose, a fake measurement data detection module was developed.
The intuition behind the fake data detection is that a time series neural network was trained to forecast the value of incoming measurements. Figure 12 shows a flowchart explaining the process of the detection algorithm. Every time an SMV packet was received, it was compared with a forecasted value. If the error between the actual and forecasted values was small, i.e., less than a predefined threshold (2% in this case), the packet was declared legitimate and thus was processed by the IED. Otherwise, the message was declared fake. In this event, the IED processed the forecasted message while an alarm was issued to the system operator to take appropriate actions.
The neural network had three layers: one input, one hidden, and one output layer. The input layer had 20 neurons corresponding to 20 previous samples, whereas the output layer has one neuron corresponding to the forecasted sample. The number of neurons in the hidden layer was 10. The forecasting accuracy of the neural network against the computation time was studied. Based on this empirical study, it was found that 20 previous samples and 10 neurons in the hidden layer produced the highest accuracy in the least amount of time.
In this paper, protection applications where controllers rely on current measurements were studied. Therefore, to properly forecast such types of time-varying data, the neural network was trained with the back-propagation algorithm with a sliding window approach. Starting from the first sample, 20 samples were counted as input and the 21st sample was set as the target output. Next, the window was moved one sample where the input became samples 2 to 21, inclusive, and the target output was sample 22, and the process continued. An exploration simulation approach was adopted to generate a rich set of target and training data. The microgrid of case study B was utilized to generate data for fault events and other contingencies, such as loss of TLs or generation units.
In addition to learning the features of the power network, the fast response of properly trained neural networks makes them excellent candidates in time-critical applications, such as protection. The overall transmission and processing time of an SMV packet was measured to be less than the 4 ms constraint set by the IEC 61850 standard. The proposed security algorithm was implemented on the IED corresponding to TL-2 of Figure 6. Table 3 summarizes the performance of the neural network, which showed a 0.56% false positive rate. Figure 13 shows the response of the fake data detection system where the blue curve represents randomly published fake measurements, whereas the red curve is the reconstructed current waveform by the Neural Network (NN) forecasting module. An example is given in Figure 13—when the NN detected a fake sample of 15.82 amps, it discarded this message and utilized the forecasted value of −0.66 amps. One must be cognizant of the fact that the number of consecutively manipulated packets will affect the performance of the presented algorithms. For instance, every time a manipulated packet is detected, the forecasted value of this packet will be loaded in the history samples buffer used for forecasting the upcoming sample. The use of the estimated value will lead to the accumulation of the forecasting error. To address this issue, a large history window size could be used to allow the system to compensate for the fake samples. However, this will affect the performance of system in terms of the computation time. Since IEC 61850 are restricted to a 4 ms time delay, a window of 20 history samples covering a quarter AC cycle has been used in this study.

5. Conclusions

This paper proposed a hybrid hardware–software co-simulation platform capable of modeling the relation and interaction between the cyber and physical parts of the smart grid. Microgrids were simulated on MATLAB/Simulink SimPowerSystems to model the physical system dynamics, whereas all control logic was implemented on embedded microcontrollers communicating over a real network. The data-centric DDS communication middleware was selected to bridge together the different communication protocols, hardware, and software applications. Three case studies, representing three different smart grid applications, were presented to verify the effectiveness of the proposed co-simulation framework. First, the hierarchical EV charging control case study showed the importance of the DDS common information exchange interface in seamlessly orchestrating together the components of the framework. Next, the capabilities of the framework to provide interoperability through protocol translation for multi-protocol devices was shown in the protection of an active distribution network case study. The last case study, showed that cyber security algorithms, such as fake data injection, could be tested with high fidelity over the developed framework. In all the cases studies presented, cyber information flow and physical dynamics of the power system were recorded and the interrelation between them was properly analyzed.

Author Contributions

M.E.H., and T.Y. conceived and designed the algorithms and experiments, performed the experiments, and analyzed the data. M.S. contributed in writing and thoroughly editing the manuscript, organizing the flow of ideas, presenting the ideas in pictorial diagrams, as well as reviewing and analyzing the data. S.F. and H.H. helped build the simulation model of the microgrid. O.A.M. is the main supervisor of the project.

Funding

This research was funded partially by the United States Department of Energy (DoE) and partially by the United States Office of Naval Research (ONR).

Conflicts of Interest

The authors declare no conflict of interest.

References

  1. Akella, R.; Tang, H.; McMillin, B.M. Analysis of information flow security in cyber–physical systems. Int. J. Crit. Infrastruct. Prot. 2010, 3, 157–173. [Google Scholar] [CrossRef]
  2. Albagli, A.N.; Falcão, D.M.; de Rezende, J.F. Smart grid framework co-simulation using HLA architecture. Electr. Power Syst. Res. 2016, 130, 22–33. [Google Scholar] [CrossRef]
  3. Bhor, D.; Angappan, K.; Sivalingam, K.M. Network and power-grid co-simulation framework for Smart Grid wide-area monitoring networks. J. Netw. Comput. Appl. 2016, 59, 274–284. [Google Scholar] [CrossRef]
  4. Boroojeni, K.; Amini, M.H.; Nejadpak, A.; Dragičević, T.; Iyengar, S.S.; Blaabjerg, F. A Novel Cloud-Based Platform for Implementation of Oblivious Power Routing for Clusters of Microgrids. IEEE Access 2017, 5, 607–619. [Google Scholar] [CrossRef]
  5. Celli, G.; Pegoraro, P.A.; Pilo, F.; Pisano, G.; Sulis, S. DMS Cyber-Physical Simulation for Assessing the Impact of State Estimation and Communication Media in Smart Grid Operation. IEEE Trans. Power Syst. 2014, 29, 2436–2446. [Google Scholar] [CrossRef]
  6. Sharma, E.; Chiculita, C.; Besanger, Y. Co-simulation of a low-voltage utility grid controlled over IEC 61850 protocol. In Proceedings of the 2015 5th International Conference on Electric Utility Deregulation and Restructuring and Power Technologies (DRPT), Changsha, China, 20–24 Novembar 2015; pp. 2365–2372. [Google Scholar]
  7. Oh, S.-J.; Yoo, C.-H.; Chung, I.-Y.; Won, D.-J. Hardware-in-the-Loop Simulation of Distributed Intelligent Energy Management System for Microgrids. Energies 2013, 6, 3263–3283. [Google Scholar] [CrossRef]
  8. Almas, M.S.; Vanfretti, L. RT-HIL Implementation of the Hybrid Synchrophasor and GOOSE-Based Passive Islanding Schemes. IEEE Trans. Power Deliv. 2016, 31, 1299–1309. [Google Scholar] [CrossRef]
  9. Goughnour, D.; Stevents, J. Testing Intelligent Device Communications in Distributed System. Available online: http://trianglemicroworks.com/docs/default-source/referenced-documents/testing-intelligent-device-communications-in-a-distributed-system.pdf?sfvrsn=2 (accessed on 1 April 2017).
  10. Boroojeni, K.G.; Amini, M.H.; Iyengar, S.S. Smart Grids: Security and Privacy Issues; Springer International Publishing: New York, NY, USA, 2016. [Google Scholar]
  11. El Hariri, M.; Youssef, T.; Habib, H.F.; Mohammed, O. A Network-in-the-Loop Framework to Analyze Cyber and Physical Information Flow in Smart Grids. In Proceedings of the 2018 IEEE Innovative Smart Grid Technologies—Asia (ISGT Asia), Singapore, 22–25 May 2018; pp. 646–651. [Google Scholar]
  12. Alkhawaja, A.R.; Ferreira, L.L.; Albano, M. Message Oriented Middleware with QoS Support for Smart Grids, In Proceedings of the InForum 2012—Conference on Embedded Systems and Real Time, Caparica, Portugal, 6–7 September 2012.
  13. RTi Connext DDS Professional. Available online: https://www.rti.com/products/dds/omg-dds-standard.html (accessed on 21 December 2016).
  14. Corsaro, A. DDS & OPC-UA Explained. Available online: http://www.prismtech.com/events/dds-and-opc-ua-explained-live-webcast (accessed on 1 April 2017).
  15. Youssef, T.A.; Elsayed, A.T.; Mohammed, O.A. Data Distribution Service-Based Interoperability Framework for Smart Grid Testbed Infrastructure. Energies 2016, 9, 150. [Google Scholar] [CrossRef]
  16. American National Standard for Electrical Power Systems and Equipment: “ANSI C84.1-2006, Voltage Ratings (60 Hertz)”; American National Standards Institute: Washington, DC, USA, 2006.
  17. IEC. Communication Networks and Systems in Substation—Specific Communication Service Mapping; IEC 61850.8; Technical Report; IEC: Geneve, Switzerland, 2008. [Google Scholar]
  18. El Hariri, M.; Youssef, T.A.; Mohammed, O.A. On the Implementation of the IEC 61850 Standard: Will Different Manufacturer Devices Behave Similarly under Identical Conditions? Electronics 2016, 5, 85. [Google Scholar] [CrossRef]
  19. Youssef, T.A.; Hariri, M.E.; Bugay, N.; Mohammed, O.A. IEC 61850: Technology standards and cyber-threats. In Proceedings of the 2016 IEEE 16th International Conference on Environment and Electrical Engineering (EEEIC), Florence, Italy, 7–10 June 2016; pp. 1–6. [Google Scholar]
Figure 1. Conceptual representation of the overall framework.
Electronics 08 01455 g001
Figure 2. Steps to combine the framework components.
Electronics 08 01455 g002
Figure 3. Embedded microcontrollers utilized in the co-simulation framework.
Electronics 08 01455 g003
Figure 4. Hierarchical control of EV charging (DDS: Data Distribution Service).
Electronics 08 01455 g004
Figure 5. (a) Battery state of charge, (b) bus voltages in p.u. and (c) battery currents.
Electronics 08 01455 g005
Figure 6. (a) Simulated distribution network linked to the IEC 61850 agents and (b) the functionalities of the gateways (GOOSE: Generic Object Oriented Substation Event; SMV: Sampled Measured Values).
Electronics 08 01455 g006
Figure 7. Architecture of the communication network.
Electronics 08 01455 g007
Figure 8. Protection logic.
Electronics 08 01455 g008
Figure 9. System frequency and status of Circuit Breaker CB3.
Electronics 08 01455 g009
Figure 10. Performance of SMV messages.
Electronics 08 01455 g010
Figure 11. Performance of GOOSE messages.
Electronics 08 01455 g011
Figure 12. Intrusion detection algorithm.
Electronics 08 01455 g012
Figure 13. Response of the intrusion detection system.
Electronics 08 01455 g013
Table 1. Example DDS data structure & corresponding IEC 61850 messages.
TopicDDS Data StructureIEC61850 MessageDescription
TL-11TL_11_meas {
float Ia;
float Ib;
float Ic;
}
SMV data set:
float Ia
float Ib
float Ic
Measurements of 3-phase currents from the left end of TL1 mapped as an SMV data set.
TL-12TL_12_meas {
float Ia;
float Ib;
float Ic;
}
SMV data set:
float Ia
float Ib
float Ic
Measurements of 3-phase currents from the right end on TL1 mapped as an SMV data set.
TL1-TripTL1_GOOSE {
Bool status;
}
GOOSE data set:
bool status
GOOSE message mapped as a logical Boolean field to trip the simulated CBs
Table 2. Recorded time delays.
Message TypeAverage Delay Time
SMV120 μs
GOOSE11.2 μs
Table 3. Performance of neural network IDS.
Total SamplesFalse PositivesFalse Positive (%)
48,4342730.56

