Abstract
Thermoelectric Generators (TEGs) are devices for direct conversion of heat into electrical power and bear a great potential for applications in energy scavenging and green energy harvesting. Given a heat source, the conversion efficiency depends on the available temperature difference, and must be maximized for optimal operation of the TEG. In this frame, the choice of materials with high thermoelectric properties should be accompanied by the identification of criteria for an optimal exploitation of the electrical power output. In this work, we briefly review the main properties of TEGs, focusing on the electrical power output and the thermal-to-electrical conversion efficiency. Besides, we discuss principles of operation of TEGs enabling the optimization of the electrical power output, based on the suitable choice of the electrical load. In particular, we comparatively present and discuss the conditions for matching the electrical load—yielding to maximum power transfer—and those for maximizing the conversion efficiency. We compare the two conditions applying them to the exploitation of a heat reservoir for energy storage and to the recovery of heat from a heat exchanger. We conclude that the difference between the two conditions is not significant enough to justify the complexity required by the implementation of the maximum efficiency. In addition, we consider the effect of the thermal contact resistance on the electrical power output. Using a simple thermal-electrical model, we demonstrate that the equivalent electrical resistance measured between the terminals of the TEG depends on the thermal exchange. Hence, for maximum power transfer, the electrical load of the TEG should not match its parasitic resistance, but the equivalent electrical resistance in each specific operating conditions, which determine the thermal fluxes. The model can be applied for the development of efficient alternative algorithms for maximum power point tracking.
1. Introduction
Thermoelectric Generators are able to generate electrical power by thermal-to-electrical energy conversion starting from any heat source: they are compact, robust and reliable, and are very attractive for a wide range of applications envisioning the energy recovery of waste heat, ranging from the automotive sector to space missions or other applications in extreme environments. Recently, thermoelectric generators have been proposed for energy scavenging. In fact, a TEG can in principle exploit any hot surface to convert heat into electrical power and supply it to small electronic circuits, including sensor nodes for Internet of Things network [1,2]. However, the practical use of TEGs typically encounters several limitations coming from the electrical and thermal properties of the materials that are currently available [3,4]. Actually, a material enabling effective thermoelectric energy conversion should display high Seebeck coefficient S and electrical conductivity , together with very low thermal conductivity . The parameter , or the dimensionless figure of merit , with T the absolute temperature, are used to quantify the thermoelectric performance, where should be maximized. Commercially available TEGs are usually based on tellurium compounds and display a around 1 at room temperature [5,6]. The research in this field is currently focusing on the development of innovative material platforms that assure high values of while at a time are biocompatible, as well as low cost and technologically affordable [7,8,9]. In this scenario, the development of materials and systems at the nano- and micro-scale opens exciting perspectives for applications [10,11,12,13,14] while at the same time poses fundamental questions for nanoscience and nanotechnology applied to energy generation, conversion, and harvesting [15,16]. One of the most promising material systems at the nanoscale consists of nanostructured silicon [17]. It exhibits a very low thermal conductivity [18,19,20] ( 1–5 W/(m K)) with respect to its bulk counterpart ( = 148 W/(m K)) and also displays good electrical transport properties: this makes it an excellent candidate for thermoelectric applications. Besides, thermoelectric generators based on silicon could be easily integrated with current electronics, enabling complete on-chip systems where sensors, processors and power supply coexist. Noticeably, the full exploitation of TEGs drives not only the research on innovative thermoelectric materials, but also the development of algorithms and techniques for the correct management of the electrical power output [21,22,23]. In particular, the thermal-to-electrical conversion efficiency must be maximized both for an optimal exploitation of the heat source and also for reducing the residual heat that has to be dissipated on the cold side of the device. In general, given the temperatures and of the hot and cold reservoirs exploited by the TEG, the conversion efficiency depends on the electrical load applied to the generator. The latter can be controlled with a suitable driving of the dc-dc converter, necessary to adapt the output voltage of the TEG to the user device.
In this work, we review the main aspects associated to the concept of conversion efficiency in a thermoelectric generator (Section 2). We also discuss and compare two different strategies for the optimization of the electrical load, namely for maximum output power or for maximum efficiency. In this frame, we specifically compare the efficiencies and the electrical power output for two ideal cases (Section 3). Finally, we analyze the impact of the thermal contact resistance between the TEG and the heat sources, and we discuss its effect on the electrical power output, providing guidelines for improving the power management (Section 4).
2. Maximum Power or Maximum Efficiency?
Figure 1 schematically depicts a basic module of a thermoelectric generator, made of a p and a n doped pieces of semiconducting material (the “legs” of the device) assembled electrically in series and thermally in parallel, and placed between two heat sources at temperatures (Hot) and (Cold). Due to the temperature gradient, both electrons and holes flow from the hot to the cold side, driving a net current through the electrical load applied to the thermoelectric generator. The resistor represents the electrical load, which exploits the power generated by the TEG. The thermoelectric parameters [3] to be accounted for are the Seebeck coefficient for each leg of the device ( and ), the electrical conductivities and , and the thermal conductivities and . The total thermal conductance of the module can be written as , where . L and A are, respectively, the length and the cross sectional area of the two legs, assumed to be the same for simplicity. From the electrical point of view (Figure 1b), a TEG can be sketched as the Seebeck voltage generator that supplies a voltage , where and , in series with the resistance , which is the total electrical resistance of the two legs. In general, a thermoelectric generator is made of a combination of many elementary p – n modules, placed thermally in parallel and electrically in series or in parallel. It can be trivially shown that the evaluation of the efficiency does not depend on the series/parallel combination of the modules, so that it can be assessed independently for each individual p – n module. Let us express the electrical power delivered to the load resistor as:
where I is the electrical current generated by the TEG. The thermal power withdrawn from the hot source is:
where is the heat flux due to the Peltier effect (Peltier coefficient ), is the fraction of the Joule heating reverted to the hot source, and the term is the heat flux due to the thermal conductivity of the material. This formula is derived from the thermal and electrical conduction equations [4], in the approximation that the thermoelectric parameters can be considered constant with temperature. The thermoelectric parameters S, , and can be evaluated at the average temperature : , and . Even if approximated (for example, the Thomson effect is not considered), this formula is more than suitable for the evaluation of the power performances of a thermoelectric generator. As alternative, a very complex, numerical solution of the complete thermoelectric equations should be implemented, but this would not give a clear vision of the power management solutions.
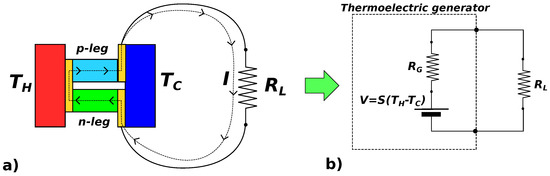
Figure 1.
(a) A sketch of a thermoelectric module, made of two pieces (legs) of different semiconductors, one n-doped while the other p-doped semiconductor, is shown. The two legs are placed electrically in series and thermally in parallel, between the hot heat source and the cold heat sink. (b) The electrical equivalent circuit of the thermoelectric generator is shown.
The thermal-to-electrical conversion efficiency of a thermoelectric generator can be written as the ratio between the electrical power on the load resistor and the thermal power Q withdrawn from the hot source :
Let us express with the ratio , . The current results:
The key point here is the optimization of to achieve the best performances of the module, and in general of a TEG made of a series/parallel combination of many p – n modules.
Using the explicit current dependence on the efficiency, we can derive the following general equation:
With a simple mathematical step, this equation can be expressed as a function of the factor :
Making the derivative of with respect to , and equating it to 0, it can be found that the maximum efficiency is achieved for , where is the average temperature of the TEG. Therefore, to achieve the maximum efficiency, the load resistance must be:
With this electrical load, we are in the condition of maximum conversion efficiency, which results:
It is well known that the condition for the maximum power transfer is that the load resistance matches the generator resistance R: , hence . Therefore, when the load exploits the maximum power which the thermoelectric generator can supply, the efficiency is smaller with respect to the maximum one. Replacing in the expression for the efficiency, it can be derived:
This efficiency, achieved with matched load for the maximum power transfer, is smaller than the maximum one, achievable with . Figure 2 shows the difference between the two load conditions, which depends on the parameter Z (or the dimensionless figure of merit ). In Figure 2 (left), the two efficiencies are reported as a function of ( K), for at room temperature. In Figure 2 (right), the difference between the maximum efficiency and the efficiency for the maximum power is shown as a function of temperature, for several values of .
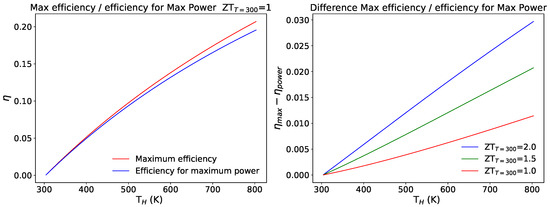
Figure 2.
Efficiency as a function of the temperature, for two cases of study: matched load resistance (), for maximum power transfer; and maximum efficiency, for .
It can be noted that for the difference in the efficiency for the two load conditions is also well below 1% for high temperatures. Even considering ideal cases of , the difference between the two efficiencies remains very small.
3. Two Practical Cases
To compare the two power management conditions, i.e., maximum power () and maximum efficiency (), we considered two ideal cases of study. We compared the two loading conditions in terms of the optimization of the power output, and we made numerical simulations on the base of a few simplifying assumptions. To test our theoretical outcomes, we considered the temperature dependence of the thermoelectric characteristics of a commercial module, the GM250-127-28-12 (European Thermodynamics).
3.1. Energy Storage Through Hot Water
As first case of study, we compared the maximum power transfer and the maximum efficiency power management conditions considering the thermoelectric generator used for the conversion of heat withdrawn from a bucket full of water at 100 °C (see the sketch in Figure 3). We assumed that the heat is exchanged only via the thermoelectric module. The simple equations of Section 2 were evaluated as a function of time, assuming a withdrawn of heat from the hot part which is converted into electrical power. The temperature of the water decreases accordingly with the withdrawn of heat. Suitable Python programs were developed for the purpose. Figure 3 (left) shows the electrical energy produced by the module as a function of time, driven in maximum power (red curve) and in maximum efficiency (blue curve) condition. Numerical values were calculated for 1 kg of water. It was assumed that the temperature of the cold part of the module is fixed at °C. Figure 3 (right) shows the water temperature as a function of time. The behavior is straightforward: as the heat is withdrawn, the temperature decreases down to 30 °C, when the hot side and the cold side temperatures are the same and no further energy transfer is possible (equilibrium condition). The important thing to be noted is that the total energy that is converted into electrical power is not very different in the two cases: 5000 Joule per liter of water for maximum power with respect to 5136 Joule for maximum efficiency condition. The difference of 136 J/liter is less than 2.6% of the total generated electrical energy. We can see, as expected, that, with the maximum power management condition, the output electrical power is greater than that achieved in the maximum efficiency condition, but only in a first phase. The reason is that the power withdrawn from the hot source is bigger in the maximum power condition, thus the temperature drops more quickly, as shown in Figure 3 (right). After a certain amount of time, the generated voltage, which is proportional to the temperature difference, becomes smaller than the one achieved in the maximum efficiency condition, and as a consequence also the electrical power output is smaller.
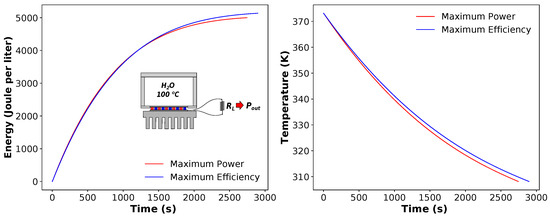
Figure 3.
Energy recovered from a bucket of hot fluid (1 L of water at 100 °C) using a thermoelectric generator, driven in the conditions of maximum power transfer (red curve) and of maximum efficiency (blue curve): (left) the total electrical energy as a function of time; and (right) the temperature of the liquid as a function of time. As a consequence of the thermal to electrical conversion, the temperature decreases with time.
3.2. Heat Exchanger
As a second case, we compared the maximum power transfer and the maximum efficiency conditions considering a series of thermoelectric generators, applied to a pipe where a hot fluid (warm air) is flowing (see the sketch in Figure 4). This represents the case of a heat exchanger applied to a chimney, or to an exhaust of a burner. We considered a very simplified model for the heat exchanger, with the only aim of comparing the two power management strategies. In particular, the average hot temperature on each module was considered as and for the evaluation of the thermoelectric parameters (Seebeck coefficient and electrical and thermal resistance). The power output of each module was managed so that it could work in the maximum power output or in the maximum efficiency condition, according to its own . Once these assumptions were made, the heat withdrawn and the electrical power output from each module was evaluated solving the equations reported in Section 2. The fluid was cooled from each module accordingly with the withdrawn of heat. Suitable Python codes were developed. The initial temperature of the air was 600 °C, and a cold side temperature of 30 °C was considered for each module. The two data plots reported in Figure 4 are related to an air flux of 0.025 m3/s. The power output of each module is reported in Figure 4b, for the two power management conditions. In both cases, the temperature of the air after the 12th module resulted very close to 30 °C, so that no significant electrical power output is achieved adding more modules. Figure 4c shows, for each module, the difference of the power output between the maximum efficiency and the maximum power condition. Similar to the case of the hot water bucket, for the first four modules, the output power is greater for the maximum power condition. However, the withdrawn heat is also greater, and hence the temperature of the air after the fourth module remains higher in the maximum efficiency condition. It is important to underline that the power output difference achieved with the two loading conditions is of a few watts, against a total power output of several hundred of watts.
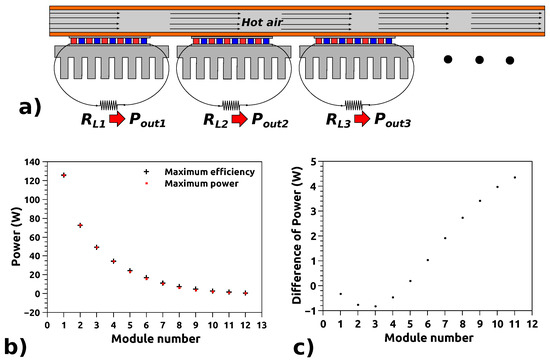
Figure 4.
Power output from a heat exchanger, where a series of thermoelectric modules is used for producing electrical power (a). Each module is driven for maximum power or for maximum efficiency. (b) The power output for each module is reported for the two power management conditions. (c) The difference between the two datasets reported in (a).
It should be noted that, in both cases, a bismuth telluride module was used, whose performances are good for temperatures lower than 200 °C. Thus, we can argue that in both cases of study the difference between the two load conditions is not so strong as to motivate the development of complex algorithms for the implementation of the maximum efficiency condition: in fact, this requires more effort than matching the electrical load .
4. Effect of Contact Thermal Resistances: A Simple Model and Its Experimental Validation
In practical applications, the thermoelectric generator must be thermally coupled with the hot source and the heat sink ; therefore, the contact thermal resistances between the heat sources and the TEG must be taken into account. In particular, the real temperature difference between the ends of the TEG is smaller than , because the heat flowing through the TEG produces a temperature drop on the contact thermal resistances. Let us indicate with and the real temperatures at the hot and cold ends of the module, respectively. The design of an electrical dc-dc converter for the matching of the electrical load requires considering this temperature drop, since the heat flux flowing through the TEG depends on its electrical current. Figure 5 shows a thermal-electrical equivalent circuit of a TEG. The circuit takes into account the electrical part, made of a voltage generator in series with its electrical resistance R and the load resistance . The electrical generator is dependent on the thermal part, which is represented with its electrically equivalent components. The thermal part includes the two voltage generators and , which represent the two heat sources, and the two contact thermal resistances and . represents the thermal resistance of the TEG (), and the temperature drop is the control parameter for the electrical generator . The heat flux due to the Peltier effect is taken into account through the equivalent current generator (W/K), dependent on , which is the output electrical current. This current controls also the two equivalent current generators (R is the internal electrical resistance of the TEG), which represent the heat generated by the Joule effect, and which is released for a half to the hot part and a half to the cold part of the TEG. The behavior of the thermal circuit, represented by its electrically equivalent components, can therefore be described by the equation ():
which is the expression of the heat withdrawn from the hot source, already used in the evaluation of the efficiency . This equivalent thermal-electrical circuit can be used for the modeling of the effect of contact thermal resistances, and more in general for the development of complete systems for energy conversion based on thermoelectric generators. The modeling circuit was tested on a real TEG (European Thermodynamics GM250-241-10-12), mounted on a home-made test bench. The TEG was fixed between two plates with a pressure of 1 MPa, and thermal conductive paste was used to minimize the contact thermal resistance. The plate is electrically heated, and the plate is cooled by a flux of water at 15 °C. The parameters of the TEG were measured, as reported in Figure 5c. In particular, S was determined through the measurement of the open circuit output voltage divided by the temperature difference measured between the plates; was determined by measuring the heating power through a guarded hot plate technique, already implemented for the measurement of thermal conductivity of silicon nanowire forests [20]; and R was measured by impedance spectroscopy. For this optimized measurement it was assumed that the contact thermal resistances and are negligible. Figure 5b reports the measured output electrical power as a function of the current (red dots), together with the results achieved by the equivalent model: the equivalent electrical circuit was solved as a function of the output electrical current by means of the SPICE circuit simulator. The top right graph shows an excellent agreement between the measures and the modeling circuit. This demonstrates that in this optimized case (large plates with high pressure, conductive paste and a large amount of cold water) the thermal contact resistances are very low.
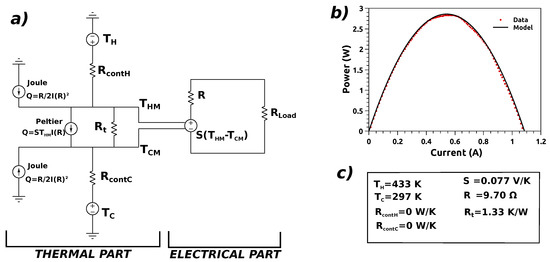
Figure 5.
(a) The thermal-electrical equivalent circuit used for modeling a TEG in operating conditions is sketched; (b) the modeled and the measured electrical power as a function of the current are shown; and (c) the parameters used for the modeling.
In real applications, it is very challenging to achieve very low thermal contact resistances, for example when a heat exchanger (heatsink) with only a limited thermal conductance is applied to the cold part of the TEG. The heatsink introduces a significant thermal resistance between the TEG and the cooling fluid, e.g., air. In this case, is the room temperature and is the thermal resistance of the heatsink, which can assume different values, from 0.05 to 0.5 W/K, depending on the geometrical dimensions and on the potential application of a fan.
Figure 6a shows the electrical power output as a function of the TEG output current (thermoelectric generator European Thermodynamics GM250-241-10-12), for different values of . The output electrical power was evaluated with the equivalent circuit reported in Figure 5. As expected, the maximum electrical power decreases with the increasing of , because the increase of the temperature equals the temperature drop on as a consequence of the heat flux. Hence, both the generated voltage and the output electrical power decrease. The dependence of the output voltage on the output current is reported in Figure 6a. The slope of the curve versus I, or alternatively the ratio between and I, represents the electrical resistance seen at the output electrical terminals of the TEG, and it includes the effect of the temperature drop on the thermal contact resistances due to the heat flux. If , then the slope is the parasitic electrical resistance of the generator = 9.7 Ω. With , the resistance seen at the output of the TEG is different, because the current affects the heat flux via the Peltier effect, which in turn is taken into account by the equivalent generator . The Joule heating, which is taken into account and is not linear with the electrical current, also affects the heat flux and hence . However, the output voltage versus the current shows a good linear behavior: this means that the Joule heating gives a negligible contribution to the heat flux.
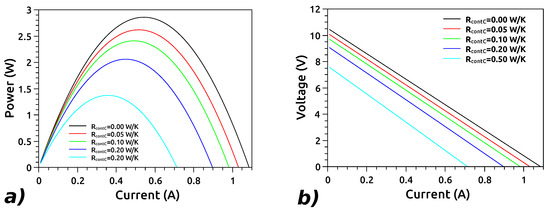
Figure 6.
The output electrical power (a) and the output voltage (b) as a function of the current, for different values of the contact thermal resistance.
Table 1 shows several parameters for different values of , reported in the first column. The second column shows the maximum power, which is achieved with the load resistance reported in Column 3. As expected, in the case of , the load resistance for the maximum power matches the parasitic electrical resistance = 9.7 Ω of the TEG. For , the load resistance for the maximum power is no longer R [24], but it matches the slope of versus I (see Figure 6b). Therefore, the electrical load resistance for the maximum power output must match the effective resistance seen at the output terminal of the TEG, which is affected by the thermal part through the Peltier generator and the contact resistance . The fourth and fifth columns report, respectively, the conversion efficiency achieved in the maximum power output condition and the maximum conversion efficiency of the system: the difference is almost vanishing. Finally, the last column displays the power output achieved with the maximum conversion efficiency: in this case as well, the difference with respect to the maximum power output is negligible.

Table 1.
Table showing the maximum power, the efficiency for the maximum power, and the maximum efficiency.
5. Discussion and Conclusions
After a review of the principles of thermoelectric generation, and of the basic equations concerning the electrical power output and the efficiency of a TEG, we discuss the energy that can be extracted with the maximum efficiency or instead the maximum power output strategy, exploiting simple models applied to two practical cases. The generated electrical energy is maximum if the TEG is driven in the condition of the maximum conversion efficiency. Following this criterion, the implementation of a power management strategy based on the maximum efficiency is desirable. However, the total electrical energy achievable driving the TEG with the condition of maximum power output is barely smaller than the maximum efficiency condition. In addition, in terms of efficiency, that for the maximum power is only a fraction of a percentage point smaller than the maximum one.
As a matter of fact, driving a TEG in maximum efficiency condition is not an easy task: an algorithm which controls the output electrical current trough a dc-dc converter should also take into account the thermal power, which needs to be measured with a good accuracy. This implies increasing the complexity of the system (TEG plus sensors plus heat exchangers), and hence the implementation costs. Conversely, it is not very challenging to implement a maximum power strategy: in principle, maximum power point tracking algorithms, such as those developed for photovoltaic generation, can be used for the driving of thermoelectric generators. As thermoelectric generators have a linear output (as a first approximation), a simple way for achieving the maximum power output is to match the load resistance with the internal electrical resistance of the TEG. This is typically done by measuring the output voltage and current, which can be adjusted for maximum power with suitable algorithms for the dc-dc conversion. Even if, in principle, an accurate evaluation of the two strategies should be done for each system, in practice, for real applications, it could be more convenient to implement directly the maximum power condition.
In real systems, the thermal resistances due to the coupling of the TEG with the heat sources can play a key role in establishing the electrical power output, because the temperature drop due to the heat flux affects the voltage output, while the electrical current modifies the heat flux. We developed a simple thermal-electrical equivalent circuit for taking into account the thermal resistances, and for the evaluation of their effect on the electrical power output. Following this model, we found that the maximum power output is not achieved matching the internal electrical resistance of the TEG. When contact thermal resistances are taken into account, the maximum electrical power output is achieved when the load resistance matches the effective electrical resistance seen at the terminals of the TEG, which is different from its parasitic resistance because it is affected by the heat flux. Once the TEG is operating in the real system, the temperature sources are known and the thermal contacts are imposed by the mechanical coupling and by the heatsinks, then a suitable algorithm can match the equivalent resistance by measuring the output voltage and current. A continuous monitoring of the equivalent resistance allows matching even in the case of a change of the temperature of the sources. The slope of the voltage versus current curve returns indeed the resistance that must be matched. Our outcomes consist in the development of simple models followed by experimental validation of the model against the operation of a commercial TEG. Overall, we believe our results can provide a useful guideline to the design of suitable algorithms for dc-dc converter to be applied for the thermoelectric conversion.
Author Contributions
G.P. and F.R. conceived the work; G.P. designed the work and performed the simulations; E.D. tested the devices; and all authors contributed to the discussion and wrote the paper.
Funding
This research received funding from the regional project CONTACT (Tuscany Region project POR FESR 2014-2020 Action 1.1.5).
Conflicts of Interest
The authors declare no conflict of interest.
References
- Davila, D.; Tarancon, A.; Fernandez-regulez, M.; Calaza, C.; Salleras, M.; SanPaulo, A.; Fonseca, L. Silicon nanowire arrays as thermoelectric material for a power microgenerator. J. Micromech. Microeng. 2011, 21, 104007. [Google Scholar] [CrossRef]
- Davila, D.; Tarancon, A.; Calaza, C.; Salleras, M.; Fernandez-Regulez, M.; SanPaulo, A.; Fonseca, L. Monolithically integrated thermoelectric energy harvester based on silicon nanowire arrays for powering micro/nanodevices. Nano Energy 2012, 1, 812. [Google Scholar] [CrossRef]
- Pennelli, G. Review of nanostructured devices for thermoelectric applications. Beilstein J. Nanotechnol. 2014, 5, 1268. [Google Scholar] [CrossRef] [PubMed]
- Pennelli, G.; Macucci, M. Optimization of the thermoelectric properties of nanostructured silicon. J. Appl. Phys. 2013, 114, 214507. [Google Scholar] [CrossRef]
- Goldsmid, H.; Douglass, R. The use of semiconductors in thermoelectric refrigeration. J. Appl. Phys. 1954, 5, 386. [Google Scholar]
- Yamashita, O.; Tomiyoshi, S. High preformance n-type bismuth telluride with highly stable thermoelectric figure of merit. J. Appl. Phys. 2004, 95, 6277. [Google Scholar] [CrossRef]
- Wang, Y.; Yang, L.; Shi, X.; Shi, X.; Chen, L.; Dargusch, S.; Zou, J.; Chen, Z.G. Flexible Thermoelectric Materials and Generators: Challenges and Innovations. Adv. Mater. 2019, 31, 47. [Google Scholar] [CrossRef]
- Hong, M.; Zou, J.; Chen, Z.G. Thermoelectric GeTe with Diverse Degrees of Freedom Having Secured Superhigh Performance. Adv. Mater. 2019, 31, 23. [Google Scholar] [CrossRef]
- Chen, Z.G.; Shi, X.; Zhao, L.D.; Zou, J. High-performance SnSe thermoelectric materials: Progress and future challenge. Prog. Mater. Sci. 2018, 97, 64. [Google Scholar] [CrossRef]
- Rossella, F.; Pennelli, G.; Roddaro, S. Measurement of the Thermoelectric Properties of Individual Nanostructures. In Semiconductors and Semimetals; Elsevier: Amsterdam, The Netherlands, 2018; Volume 98, pp. 409–444. [Google Scholar]
- Roddaro, S.; Ercolani, D.; Safeen, M.A.; Suomalainen, S.; Rossella, F.; Giazotto, F.; Sorba, L.; Beltram, F. Giant thermovoltage in single InAs nanowire field-effect transistors. Nano Lett. 2013, 13, 3638–3642. [Google Scholar] [CrossRef]
- Yazji, S.; Hoffman, E.A.; Ercolani, D.; Rossella, F.; Pitanti, A.; Cavalli, A.; Roddaro, S.; Abstreiter, G.; Sorba, L.; Zardo, I. Complete thermoelectric benchmarking of individual InSb nanowires using combined micro-Raman and electric transport analysis. Nano Res. 2015, 8, 4048–4060. [Google Scholar] [CrossRef]
- Roddaro, S.; Ercolani, D.; Safeen, M.A.; Rossella, F.; Piazza, V.; Giazotto, F.; Sorba, L.; Beltram, F. Large thermal biasing of individual gated nanostructures. Nano Res. 2014, 7, 579–587. [Google Scholar] [CrossRef]
- Rocci, M.; Demontis, V.; Prete, D.; Ercolani, D.; Sorba, L.; Beltram, F.; Pennelli, G.; Roddaro, S.; Rossella, F. Suspended nanowire devices for thermal conductivity measurements using the 3omega-method. J. Mater. Eng. Perform. 2018, 27, 6299–6305. [Google Scholar] [CrossRef]
- Tikhonov, E.; Shovkun, D.; Ercolani, D.; Rossella, F.; Rocci, M.; Sorba, L.; Roddaro, S.; Khrapai, V. Local noise in a diffusive conductor. Sci. Rep. 2016, 6, 30621. [Google Scholar] [CrossRef]
- Tikhonov, E.; Shovkun, D.; Ercolani, D.; Rossella, F.; Rocci, M.; Sorba, L.; Roddaro, S.; Khrapai, V. Noise thermometry applied to thermoelectric measurements in InAs nanowires. Semicond. Sci. Technol. 2016, 31, 104001. [Google Scholar] [CrossRef]
- Pennelli, G. Top-down fabrication of silicon nanowire devices for thermoelectric applications: Properties and perspectives. Eur. Phys. J. B 2015, 88, 121. [Google Scholar] [CrossRef]
- Melosh, N.; Boukay, A.; Diana, F.; Gerardot, B.; Badolato, A.; Petroff, P.; Heath, J. Ultrahigh-Density Nanowires Lattices and Circuits. Science 2003, 300, 112–115. [Google Scholar] [CrossRef]
- Pennelli, G.; Nannini, A.; Macucci, M. Indirect measurement of thermal conductivity in silicon nanowires. J. Appl. Phys. 2014, 115, 084507. [Google Scholar] [CrossRef]
- Pennelli, G.; Elyamny, S.; Dimaggio, E. Thermal conductivity of silicon nanowire forests. Nanotechnology 2018, 2018, 505402. [Google Scholar] [CrossRef]
- Montecucco, A.; Siviter, J.; Knox, A. Costant heat characterization and geometrical optimization of thermoelectric generators. Appl. Energy 2015, 149, 248. [Google Scholar] [CrossRef]
- Torrecilla, M.; Montecucco, A.; Siviter, J.; Strain, A.; Knox, A. Transient response of a thermoelectric generator to load steps under constant heat flux. Appl. Energy 2018, 212, 293. [Google Scholar] [CrossRef]
- Kim, R.; Lai, J. A seamless mode transfer maximum power point tracking controller for thermoelectric generator applications. IEEE Trans. Power Electron. 2008, 23, 2310. [Google Scholar]
- Deasy, M.; Baudin, N.; O’Shaughnessy, S.; Robinson, A. Simulation-driven design of a passive liquid cooling system for a thermoelectric generator. Appl. Energy 2017, 205, 499. [Google Scholar] [CrossRef]


© 2019 by the authors. Licensee MDPI, Basel, Switzerland. This article is an open access article distributed under the terms and conditions of the Creative Commons Attribution (CC BY) license (http://creativecommons.org/licenses/by/4.0/).