1. Introduction
Monitoring the maritime surface represents a crucial task to authorities and institutions. It provides meaningful information to develop suitable policies regulating a number of human activities and it helps to detect critical circumstances early and eventually counteract or mitigate related consequences. Within this scenario, maritime traffic represents a critical activity which deserves uninterrupted supervision. Approximately 600,000 vessels navigate daily on the world seas, with purposes related to fishing, travel, tourism, military or mercantile business. Nowadays, several types of maritime traffic are under observation, such as migrant flow, unauthorized fishing and environmental pollution. Existing monitoring tools (Automatic Identification System [
1]) are based on the active collaboration from navigating vessels. They turn out to be intrinsically unreliable because the data can be easily counterfeited by malicious users. As an alternative, satellite missions rotating around earth-centered orbits provide remote sensing information in the form of multi-sensor multi-resolution data, captured on a daily basis. These data carry relevant information about moving vessels and their attributes. The observed vessel’s features may relate to morphological-geometrical properties (center of mass location, length, width), to radiometric properties (backscattering intensity statistics) as well as to pertubations generated in the water medium by the ship motion. Examples of high-resolution data can be provided by currently orbiting satellites such as European Space Agency (ESA) Copernicus Sentinels, ImageSat International Earth Remote Observation System (ISI EROS) and Italian Space Agency Constellation of Small Satellites for Mediterranean basin Observation (ASI COSMO-SkyMed).
The automatic monitoring of the maritime traffic is currently a relevant research topic. For this purpose, Information and Communication Technology (ICT) provide powerful tools that can be exploited in the implementation stage. The present scientific literature provides examples of software platforms, based on a computer vision approach, which are primarily dedicated to the observation and classification of marine traffic [
2,
3,
4,
5,
6,
7,
8].
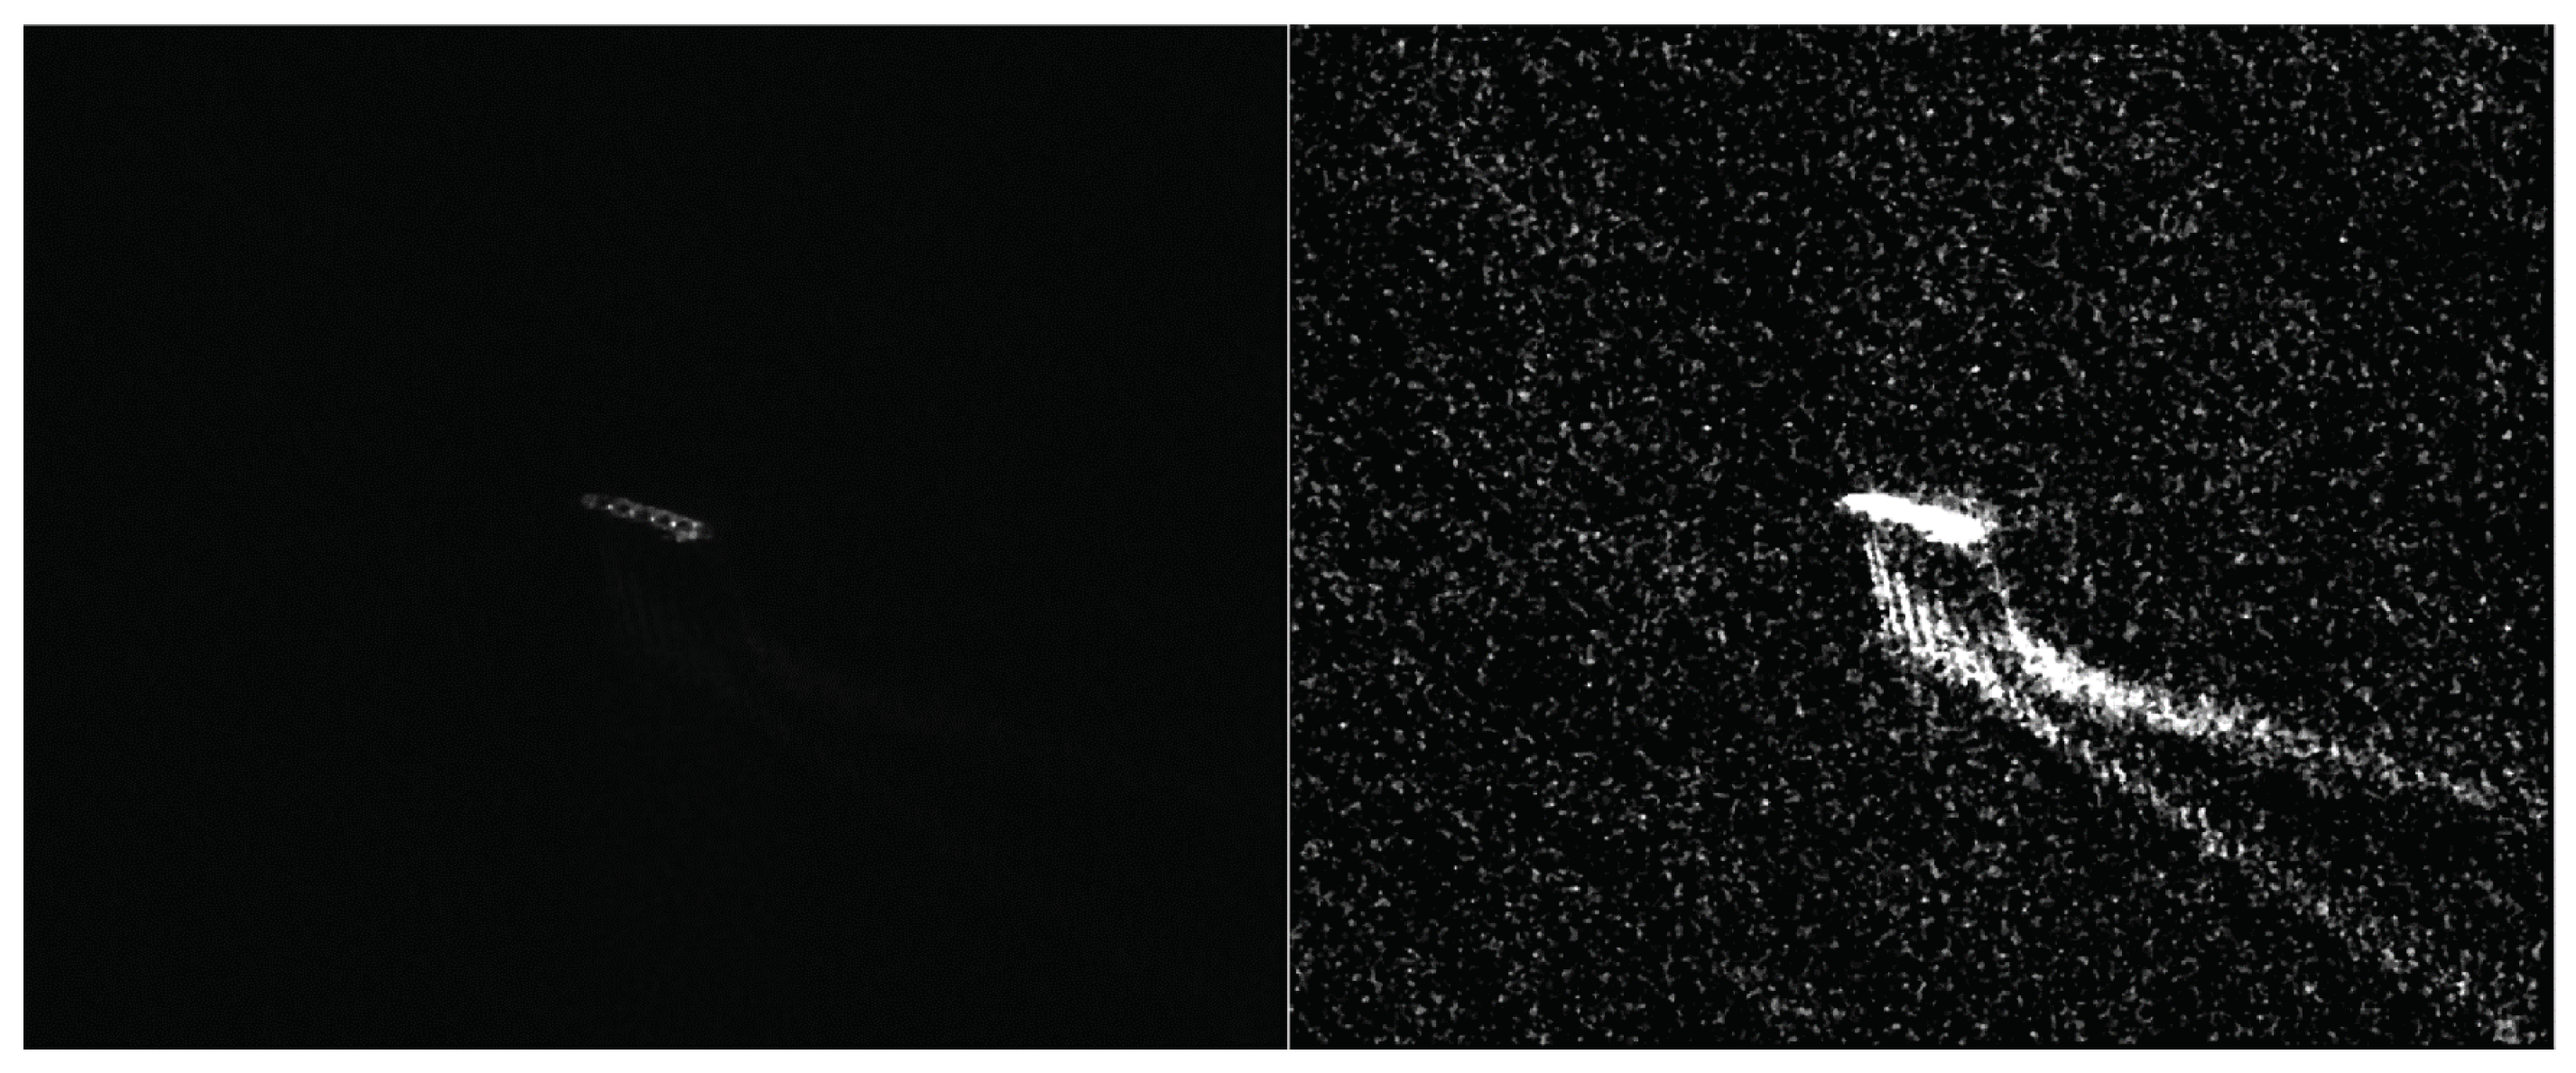
The ship detector applied to an SAR/optical map typically returns a small patch cut out of the entire original map (an example in
Figure 1, left side), centered on a candidate vessel, supplied with relevant information, such as a coarse estimate of the ship centroid coordinates and a first approximated ship geometry. The detector returns an output patch that includes the vessel body and, if available, the surrounding motion’s related features.
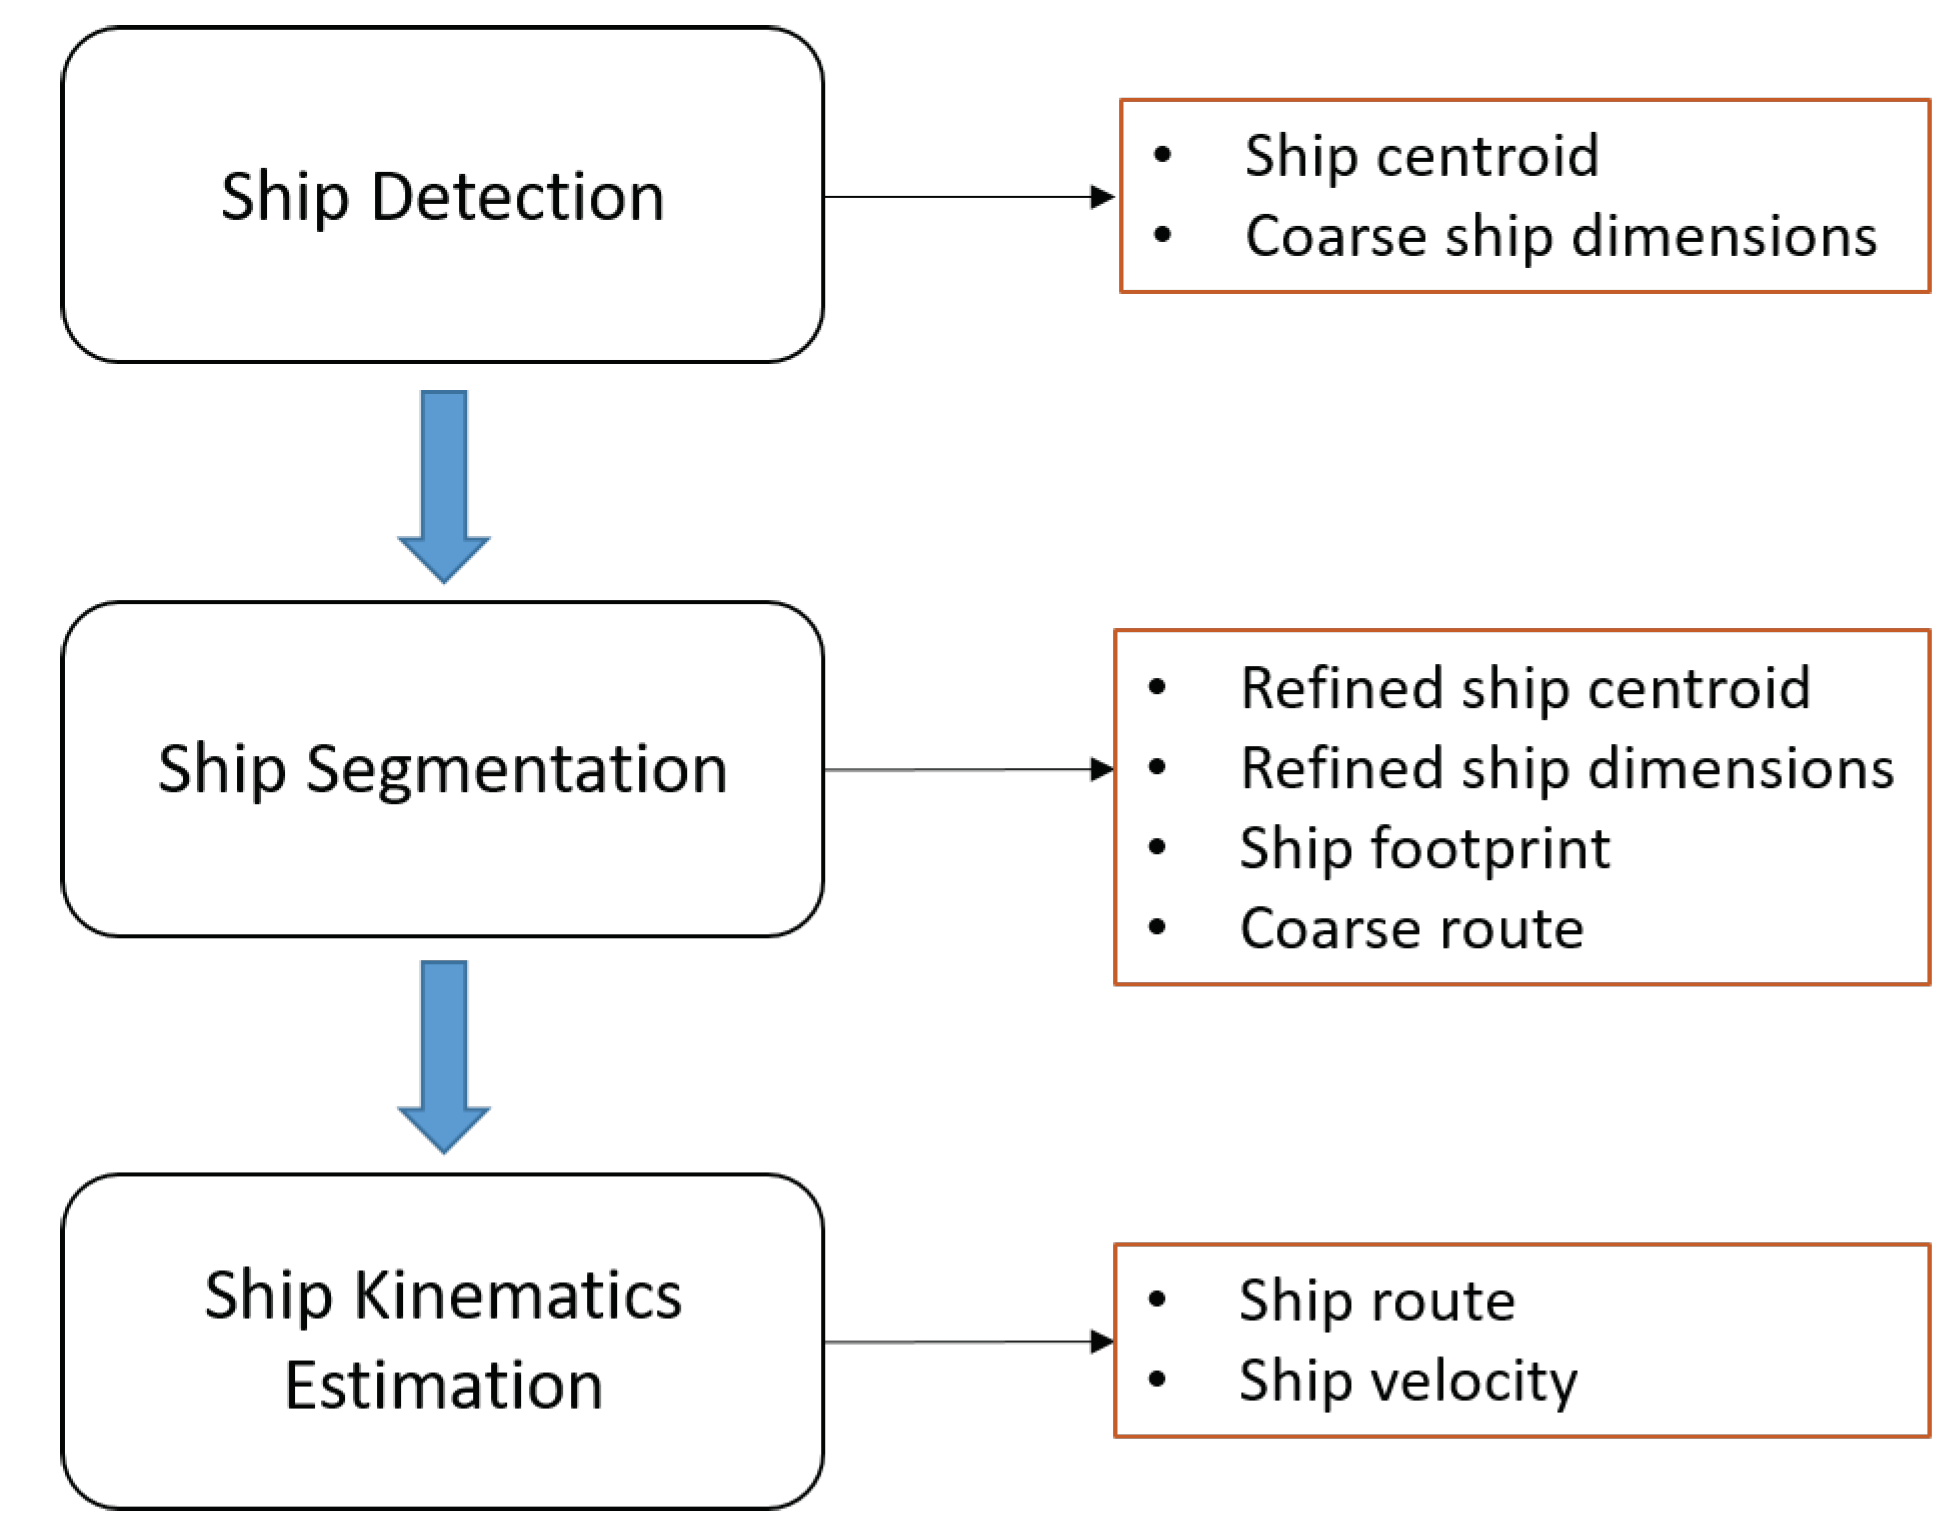
A typical approach (
Figure 2) is based on the cascade pipeline of multiple machine learning and image processing steps. The most relevant modules are represented by the ship detector, the ship segmentation/classification module and the ship kinematics estimation module.
The following segmentation step provides accurate estimates of the vessel centroid positioning, a binary model of the vessel shape representing the area occupied by the ship, the hull main dimensions and an estimate of the vessel orientation, which is related to the minimum inertia axis of the candidate target (see [
9]). For this reason, the vessel course is provided with a
ambiguity, since at this stage it is not yet possible to univocally identify the target’s fore and aft.
The geometrical and morphological information provided by the previous steps can be enriched by inspecting the water surface surrounding the detected ship position. Indeed, it is known that the ship’s kinematics is directly related to the peculiar wake pattern generated by the motion of the ship itself through the water surface (see [
10,
11]). In particular, by detecting the linear envelopes of the main wake components and performing a proper analysis of the detected signals, it is possible to estimate respectively the ship’s heading (univocally) and the ship’s velocity module (see, for example, [
12,
13,
14]).
The present work focuses on the latter topic, by discussing the conception and development of a suite of algorithms dedicated to the estimation of a vessel’s route and velocity values through the detection and analysis of the vessel’s motion related features. Interesting features for the mentioned purposes are (i) the displacement, exclusively observable in SAR imagery, between the vessel target center of mass and the corresponding wake pattern tip and (ii) the spatial wavelength of the plane wave oscillation located at the edge sector of the wake envelope (
Kelvin wake). The extraction of these features is carried out following a novel approach based on the computation of the gradient of the input signal, according to a criterion of robustness w.r.t. noise. Integrating this preliminary stage of signal manipulation in the processing pipeline yields an enhancement in the wake pattern detection results, as suggested by the discussion reported in the following sections. The presented procedure has been implemented in the Octave environment [
15] and tested on a SAR imagery dataset captured by ESA Sentinel-I and provided through the Copernicus Open Access Hub. Octave represented an attractive option because of the available basic image processing functionalities usually featuring high computational performances, and thus suitable for real-time application purposes.
The rest of the paper is arranged as follows:
Section 2 concerns a detailed discussion of the signal features that are related to the vessel motion and that may be employed to estimate the vessel kinematics.
Section 3 concerns the preliminary processing stages of the proposed pipeline, which are in charge of enhancing the Signal-to-Noise Ratio of the captured imagery.
Section 4 concerns the description of the algorithms implemented for the purposes of this work and the related results.
Section 5 concludes the paper by presenting a summary of the main results and discussing future developments.
2. Motion’s Related Features
For the purpose of the work described in this document, the analysis will converge on those peculiar features that refer more or less directly to the motion of the vessel itself. The problem of estimating the ship velocity from an image can be separated in the estimation of the direction and the magnitude of the velocity vector.
For what concerns the ship orientation, we make the hypothesis that each moving vessel has a velocity versor that coincides with the principal axis of the hull, identified by the stern-bow oriented segment. A first attempt to provide information about the vessel kinematics consists of performing a refined segmentation of the candidate target and in estimating the 2D principal inertia axis of the target. Eventually, the ship’s main axis is identified as the minimum inertia axis [
9]. Furthermore, previous literature [
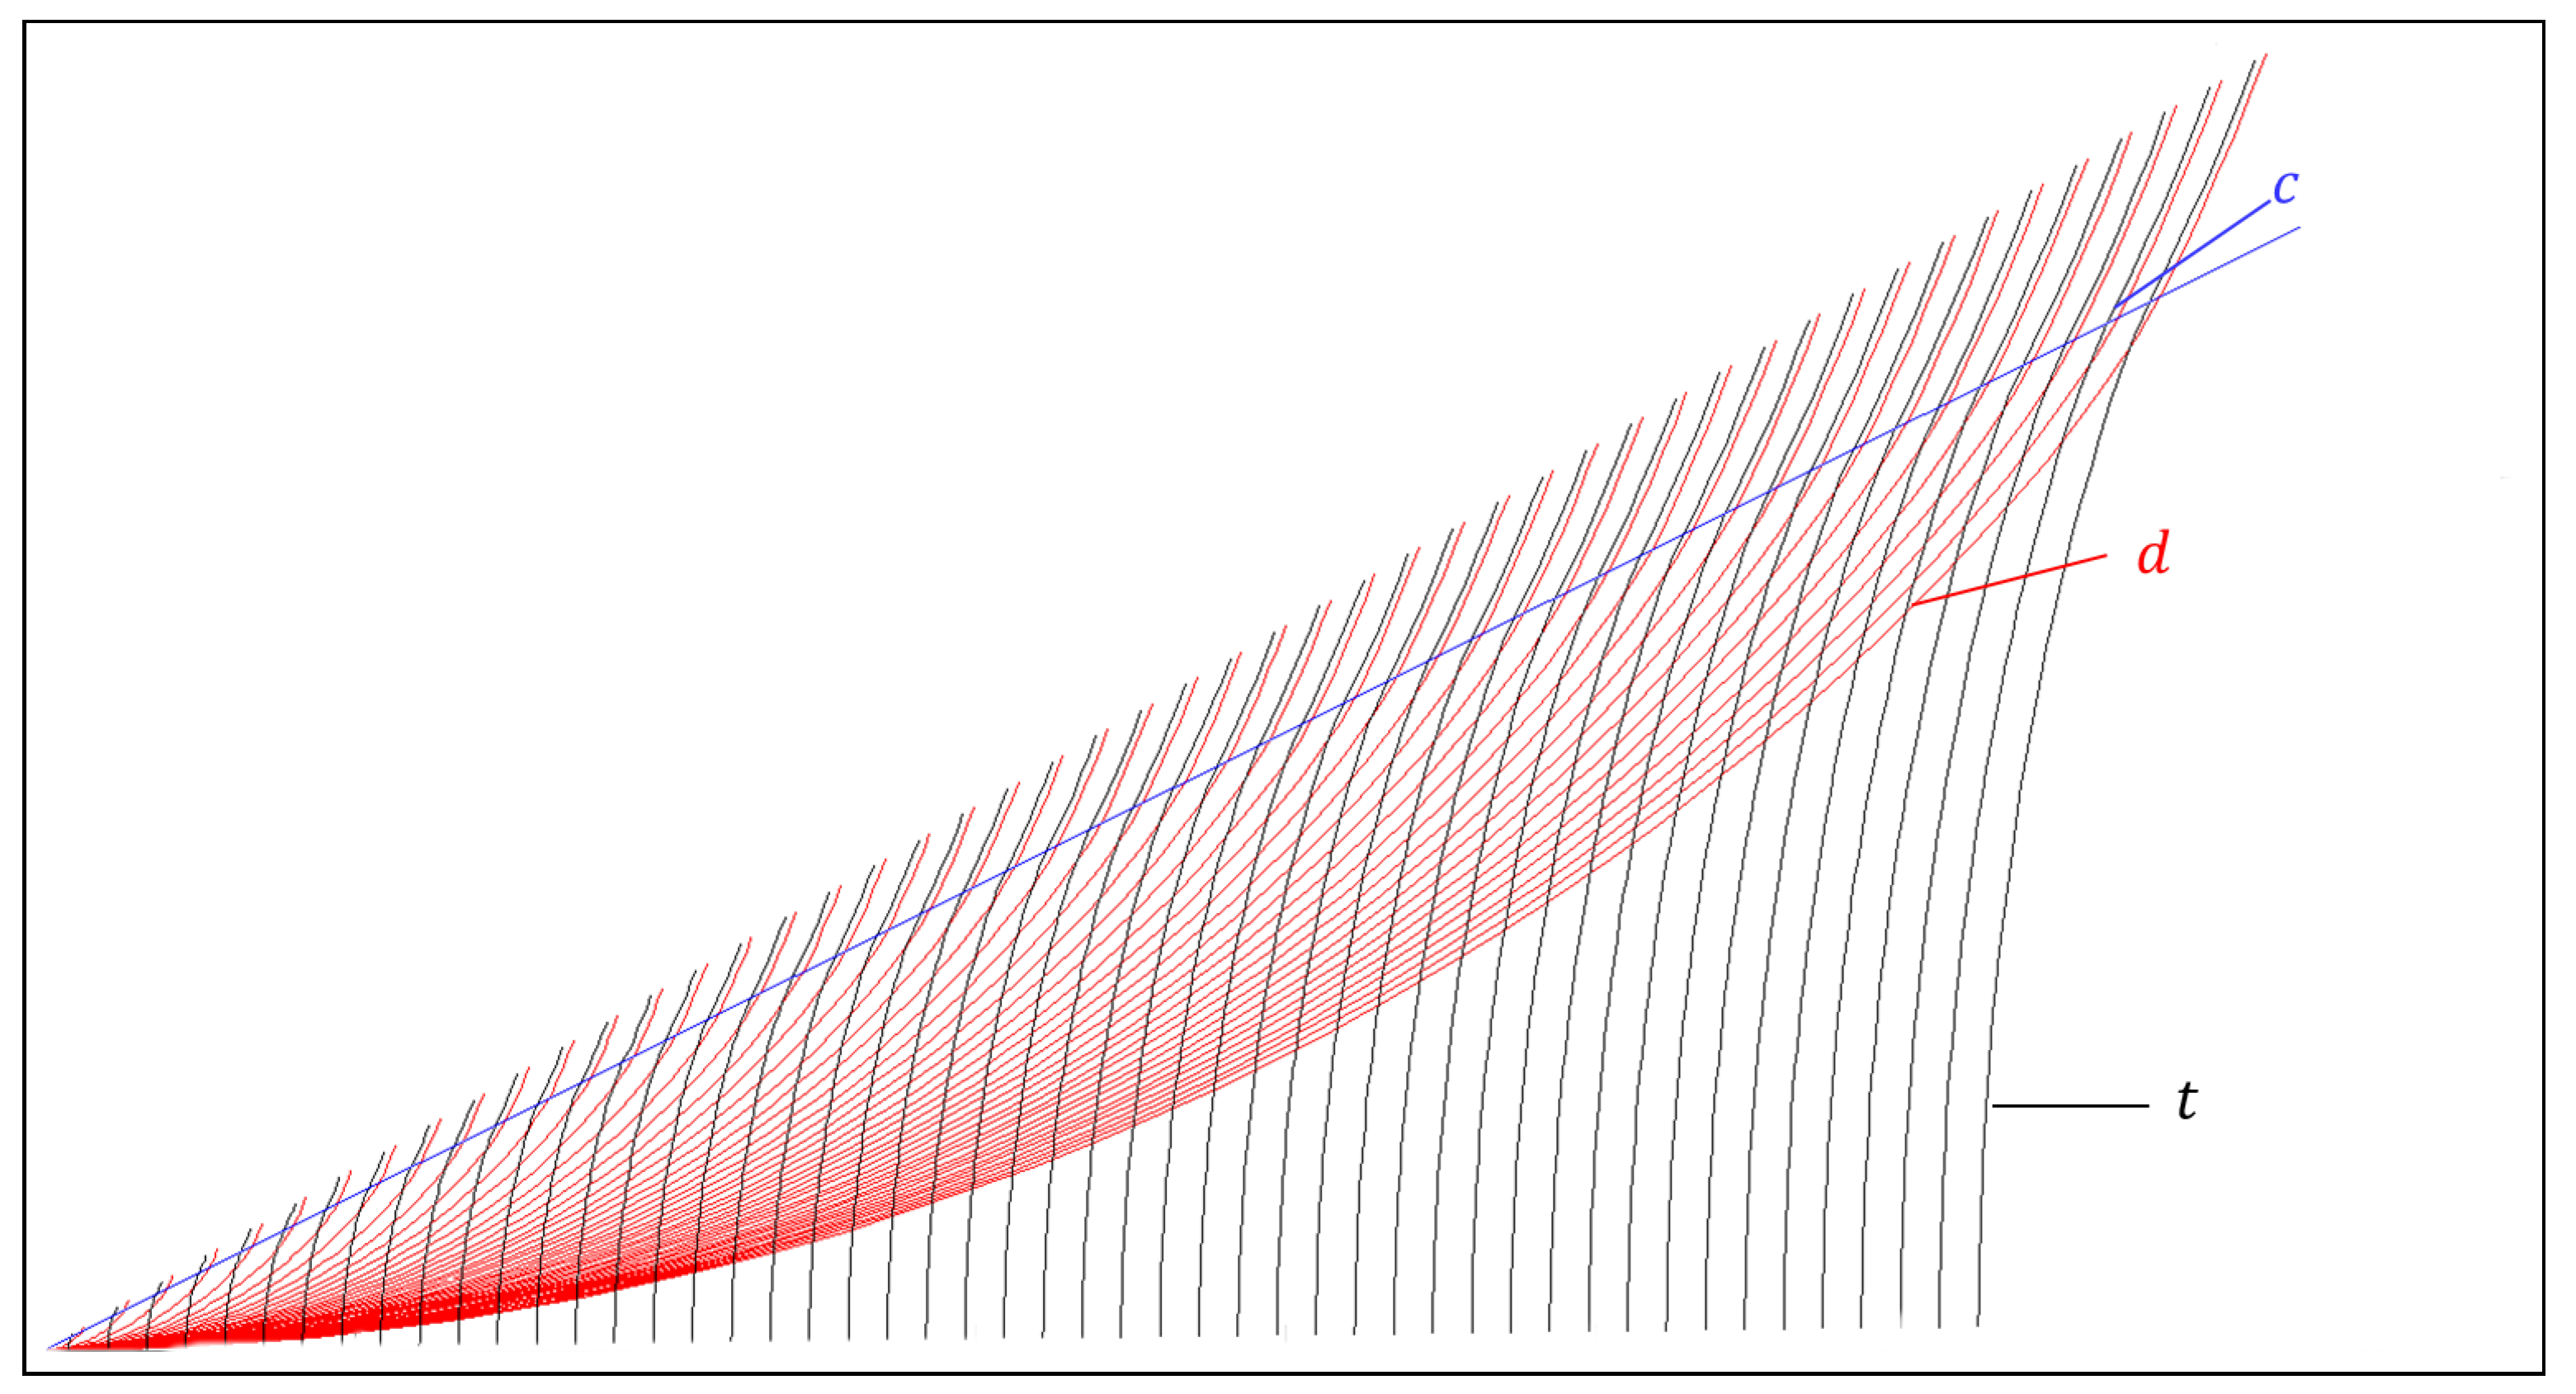
16] has proven that an object moving on the water surface at constant heading and speed generates a wake pattern made up of divergent and transverse wave components (the diagram in
Figure 3 shows the crests profiles for a generic wake pattern). We assume that all the wakes observed in the captured data share common morphological features, such as the angular aperture between the different wake components, and differ for what concerns the spatial frequencies of the generated oscillations. This hypothesis can be considered valid for a certain range of velocities (from a few up to tens of km/h, see, for example, [
17]), and for a variety of vessels’ typologies with different hull dimensions.
Generally speaking, a wake pattern in a SAR map is usually observed as the composition of three macro-structures that develop along linear directions: (i) a central turbulent strip, usually appearing as two collinear lines, a bright one next to a dark one, behind the vessel, with the same orientation of the vessel’s heading and (ii) two linear bright stripes, located approximately at the wake boundaries, about
19.47
with respect to the central turbulent wake, in the so-called cusp wave regions of the wake. The wake formation results from the combination of multiple oscillatory components whose summation exhibits a V-shaped pattern centered on the ship route axis. The angular aperture of this V usually features a constant value of, approximately, 39
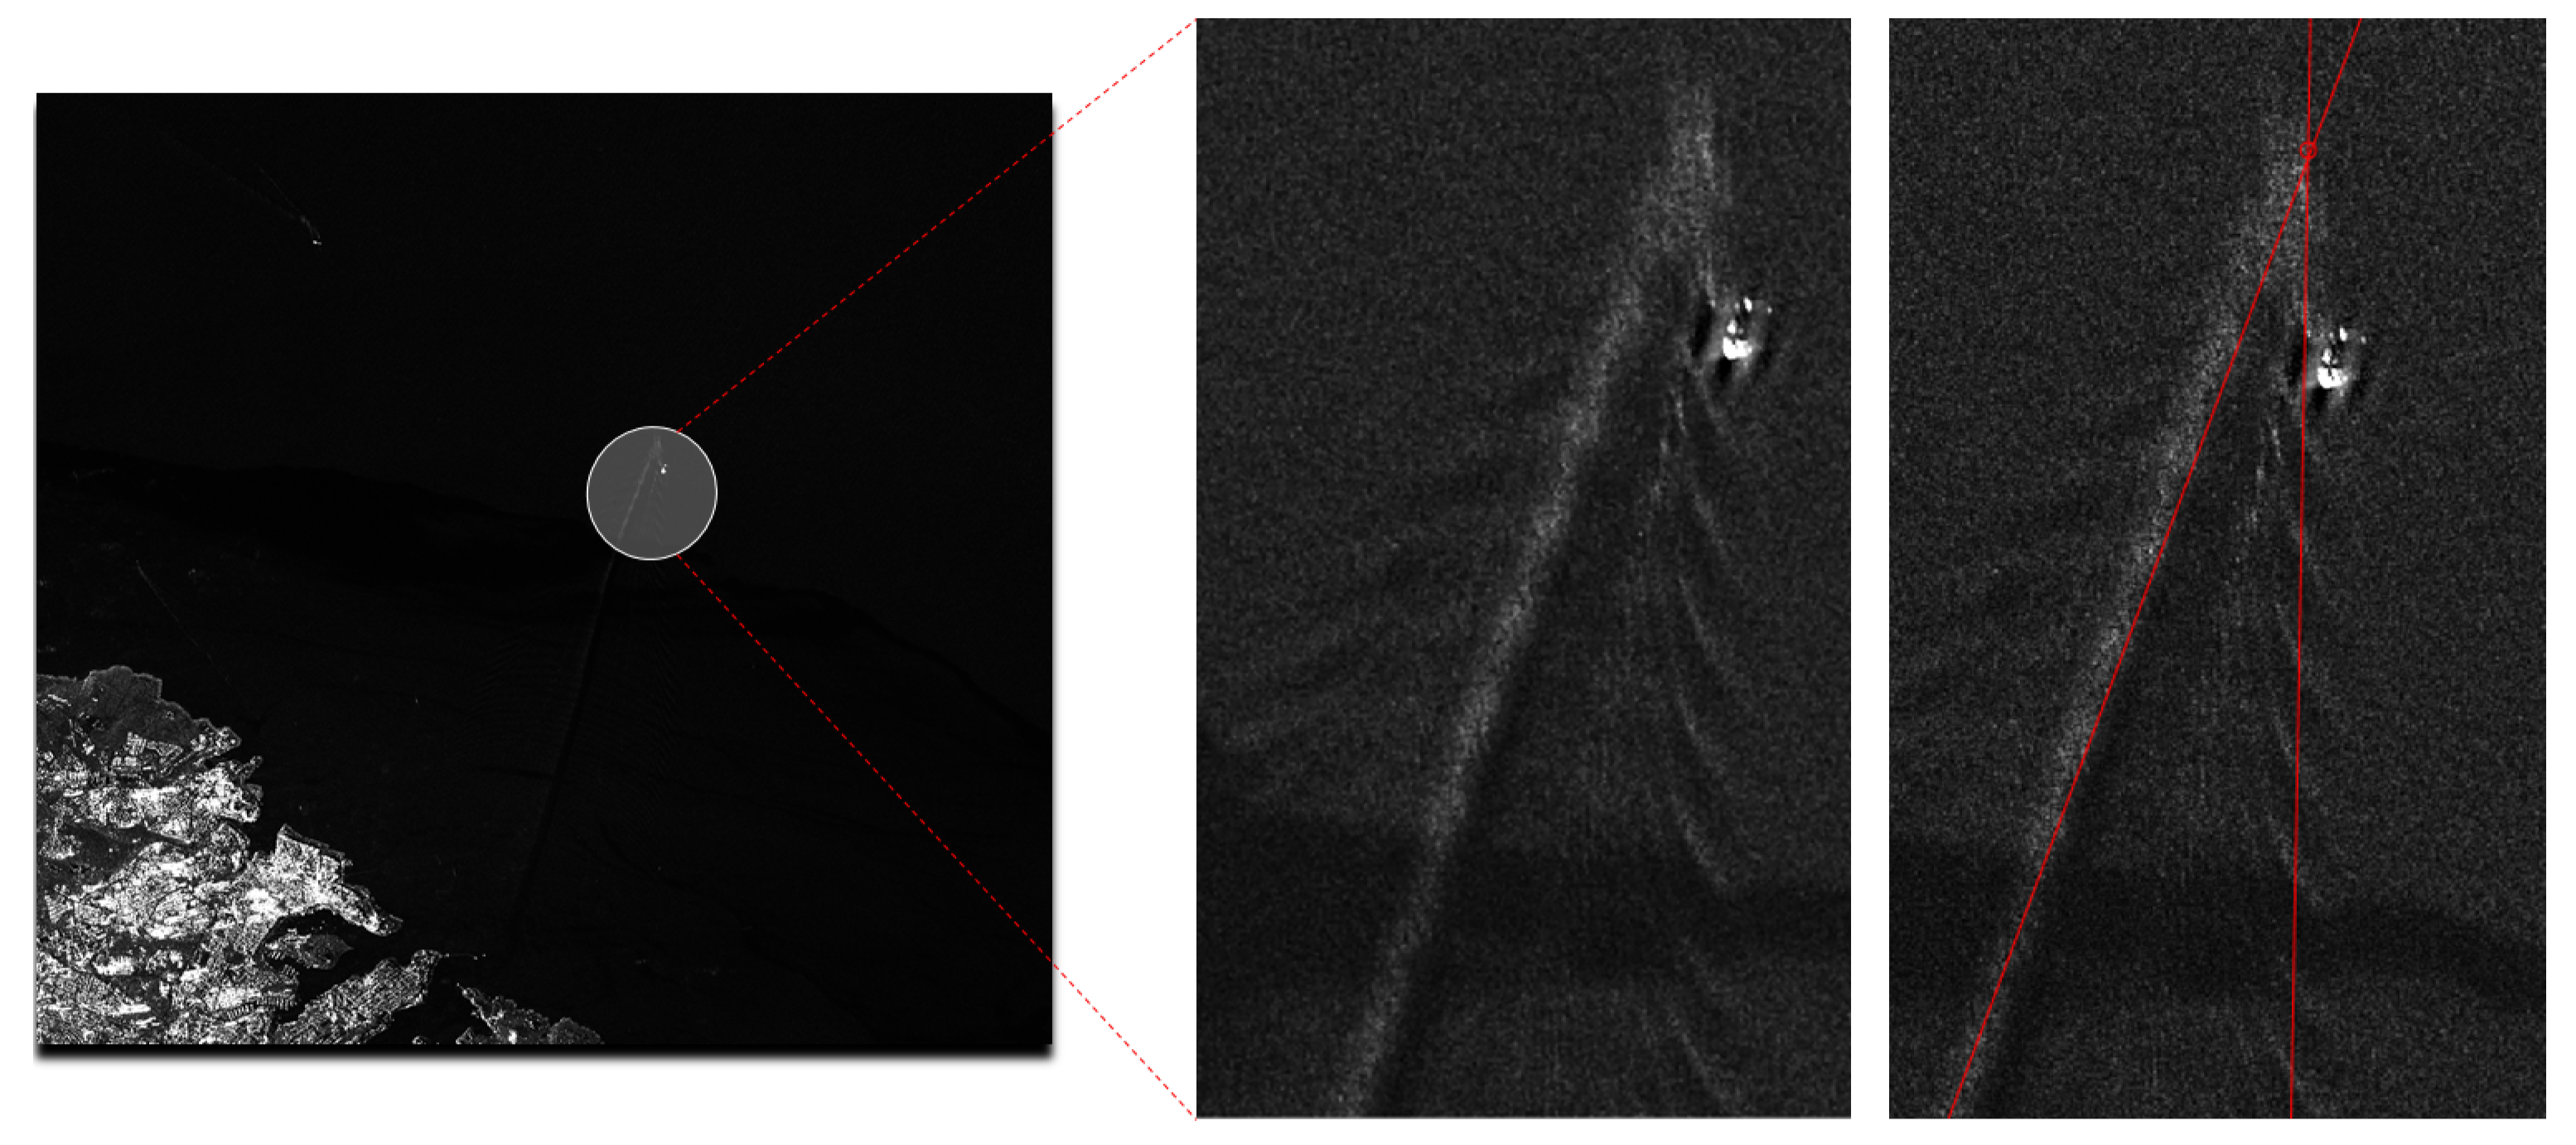
. Exploiting these observable phenomena, the route direction can be estimated by first detecting the V pattern (
Figure 4) through a radon-transform-inspired linear detector [
18], and by later identifying the wake center axis.
The wake pattern carries information about the vessel speed—for example, the oscillatory components observed in the external boundaries of the wake and feature wavelength values that relate to the velocity of the ship itself. Hence, provided the image resolution is large enough to observe these specific wake details, a frequency analysis of the external wake components is performed, followed by the computation of the dominant wavelength .
The ship’s velocity
v is finally estimated by means of the following expression (see [
19]):
where
.
A second method for estimating the vessel’s speed exploits the
Azimuth shift effect, a distortion which affects SAR remote sensing, causing an artificial separation, observed in the resulting map, between the moving ship and its wake. The separation length
is proportional to the vessel speed according to the following expression (see [
20]):
where
is the satellite speed,
is the slant range from satellite to the target and
is the angle between the vessel’s velocity vector and the radar beam. Hence, the vessel speed can be obtained by measuring the separation length directly on the SAR map.
Figure 5 illustrates examples of the image processing methods mentioned.
The work described in the following will focus on (i) the detection of the linear envelopes of the wake, in order to estimate the ship heading, (ii) the estimation of the ship velocity by exploiting the causality with the azimuth shift effect occurring in SAR mapping and, in the unlikely circumstance that the internal wake components are represented at a sufficiently large resolution, the spectral analysis of the cusp waves, whose oscillation properties are also related to the kinematics of the ship.
Indeed, ship wakes are not usually visible or too faint to be detected. The most common type of detectable wakes are the turbulent wakes. Typically, due to very low Signal-to-Noise Ratio (
SNR) values, the detection of a wake is a task with very small probabilty of success. Thus, different approaches have been proposed (see, e.g., [
21,
22]) in order to improve the poor results obtained through classical methods, e.g., based on the straightforward application of the radon/Hough transform on intensity images. In
Section 4.3, a method inspired by [
20] is described while, in the following
Section 4.4, a novel method exploiting the image gradient is proposed. The latter shows promising results concerning the detection of the turbulent component of a wake. Accordingly, a comparison between the two mentioned approaches is proposed.
The remaining parts of this section concern detailed descriptions of each processing stage that contributes to the fulfillment of the aforementioned tasks.
3. Signal Pre-Processing for Multiplicative Noise Reduction
Due to the coherent nature of the SAR imaging system, the data capture is affected by a multiplicative noise, called speckle. It results from the combination of echoes coming from different scatterers, coherently generating a non-null backscatter value.
A consequence of the combination of speckle noise with the signal backscattered by homogeneous areas is that the pixels’ statistical properties will vary spatially. This effect can be partially reduced by integrating different captured images (looks) of the same scene. The latter operation entails a decrease of the signal variance and the subsequent enhancement of the signal-to-noise ratio.
A notable amount of previous literature has concerned speckle filtering issues in SAR imagery (see, e.g., [
23,
24]). Given a point
in the image plane, a popular model for the speckled image formation is:
where
I is the image intensity,
R is the radar reflectivity and
u is the multiplicative speckle noise term. The approach adopted within this work consists of describing the imaged scene and the speckle noise through their related probability density functions (
pdf). According to the Bayes theorem, the conditional probability of
R given
I takes the following form:
where
represents the a priori knowledge about the radar reflectivity.
is the a posteriori information about reflectivity, information that is gathered during the measurement process. In this framework, the unknown quantity
R is estimated by adopting a Maximum A Posteriori (MAP) approach, i.e., by computing the mode of the posterior probability in Equation (
4).
In accordance with [
25], we assume the following statistical properties:
According to Equation (
3),
also follows a Gamma distribution, with a form that is proven [
24] to be
By substituting in Equation (
4), taking the logarithm and computing the derivative with respect to
R, we get:
which, upon selecting the positive solution, gives the restored signal
Each of the considered input maps have been preliminary processed by applying the signal restoration defined by Equation (
6) (see an output example in
Figure 6).
4. Wake Features Extraction and Analysis
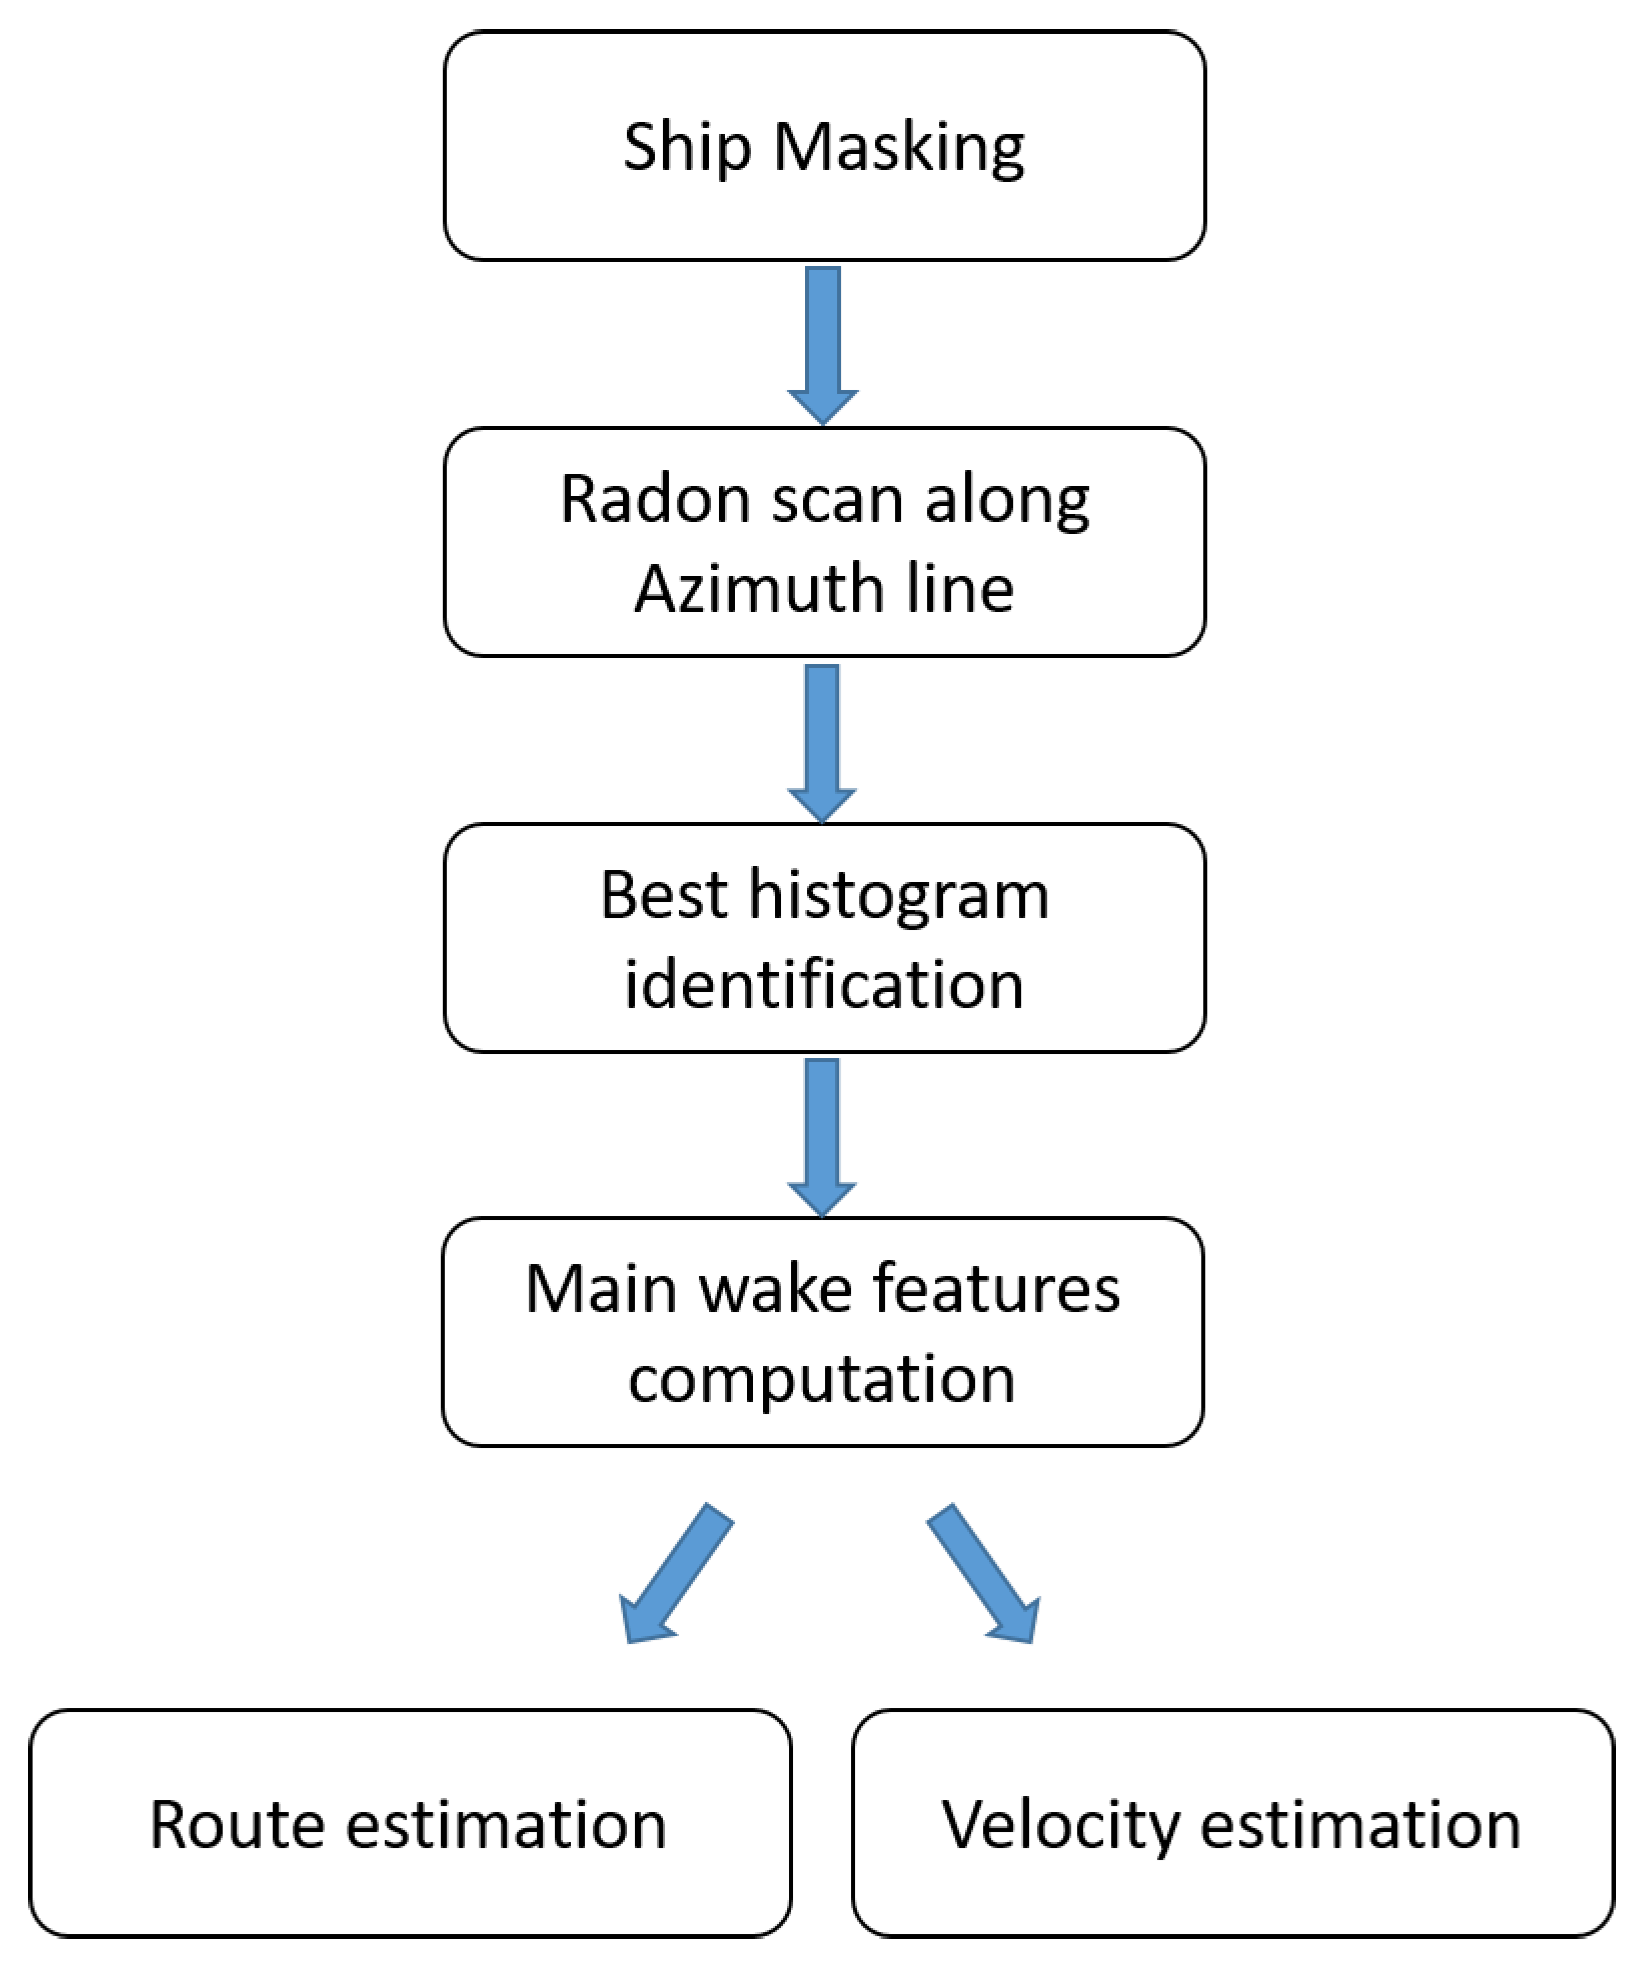
The following sections concern detailed descriptions of the algorithms that have been developed to perform the estimation of a vessel kinematics. The corresponding processing pipeline is illustrated in
Figure 7.
4.1. Ship Masking and Data Preprocessing
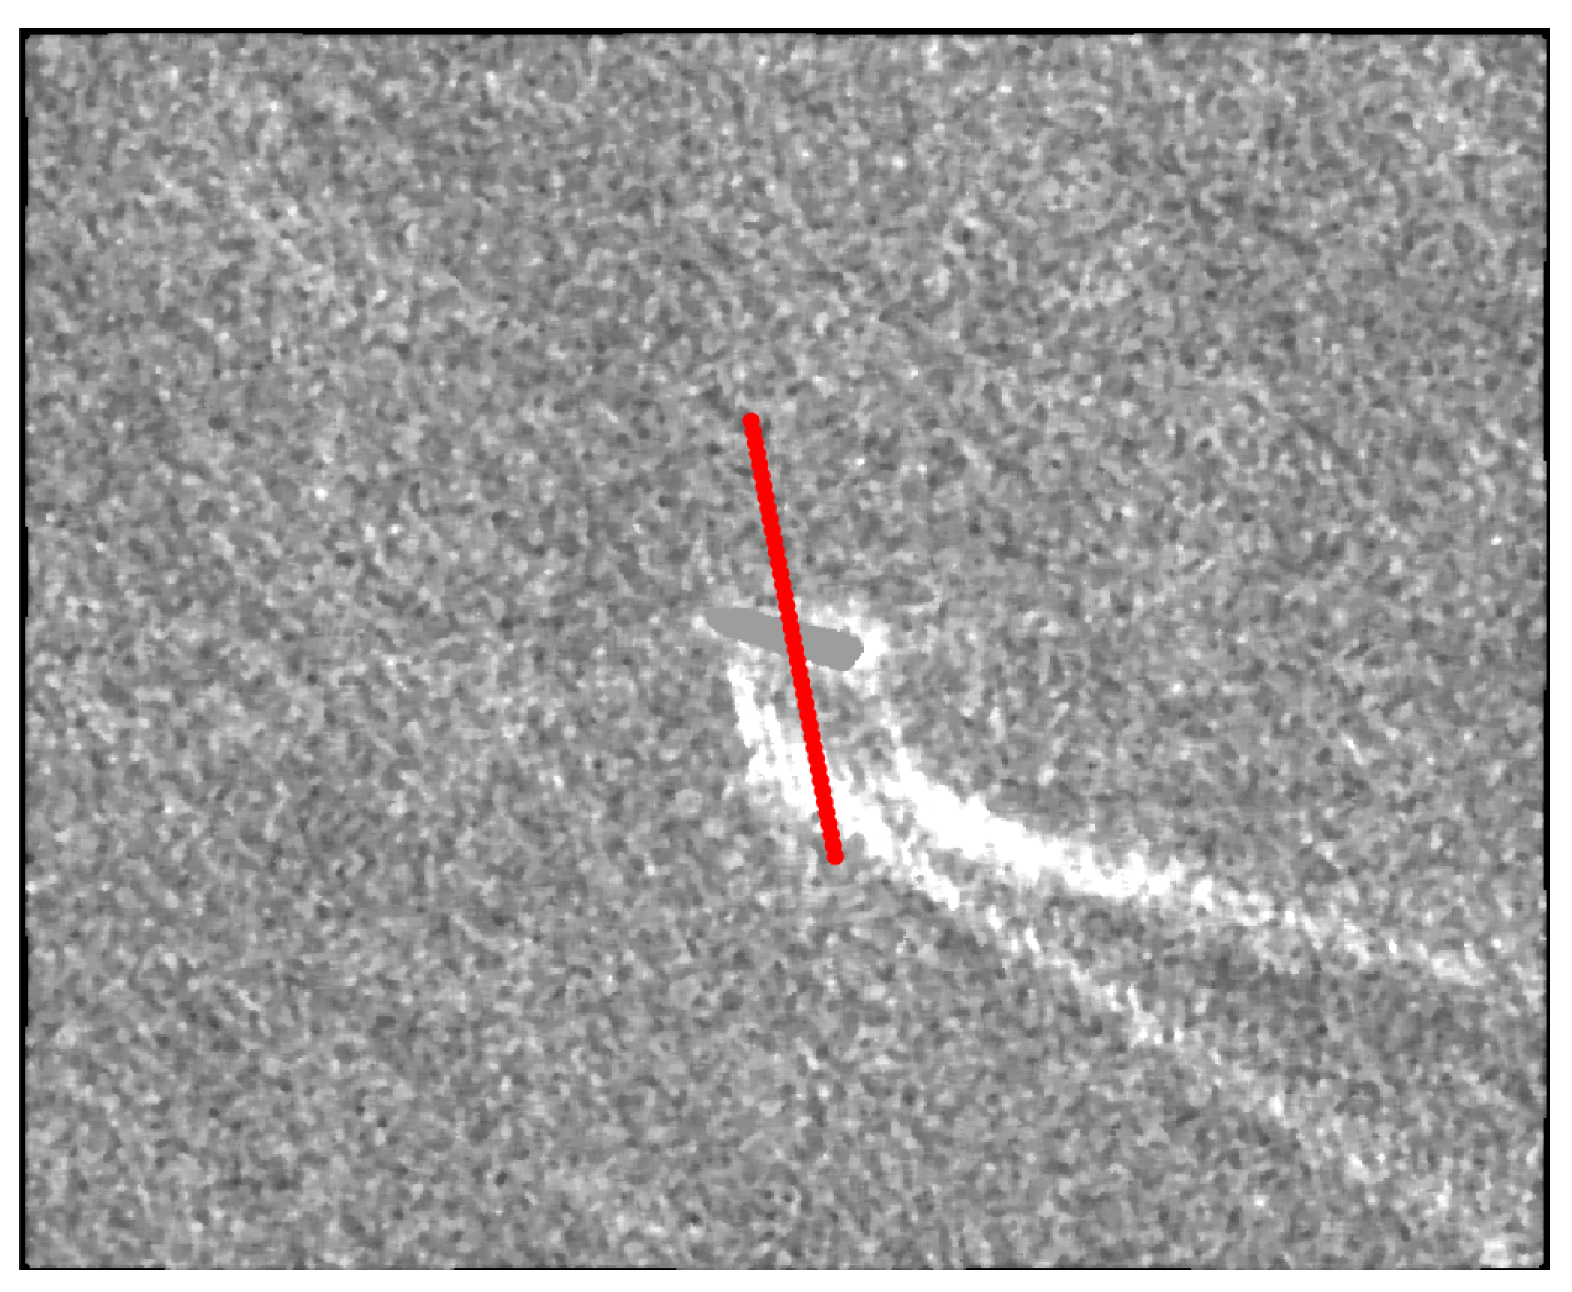
For the purpose of properly identifying the signals of interest, the captured data must be preliminary filtered to limit false positive detections, due to noise or known spurious signals that have to be neglected a priori. In case of SAR data input, the wake detector performance can be critically affected by the signal backscattered by the ship’s body, which usually features pixel values that are several orders of magnitude larger than the backscattering amplitudes related to the wake pattern. We assume that pixels associated to the main vessel’s body can be filtered out provided that a ship footprint is available from preliminary estimations, obtained through the methods discussed in
Section 1. This way, a binary mask can be generated, based on the mentioned footprint, and exploited to substitute the ship’s body pixels with proper intensity values, such as the image mean value (
Figure 8).
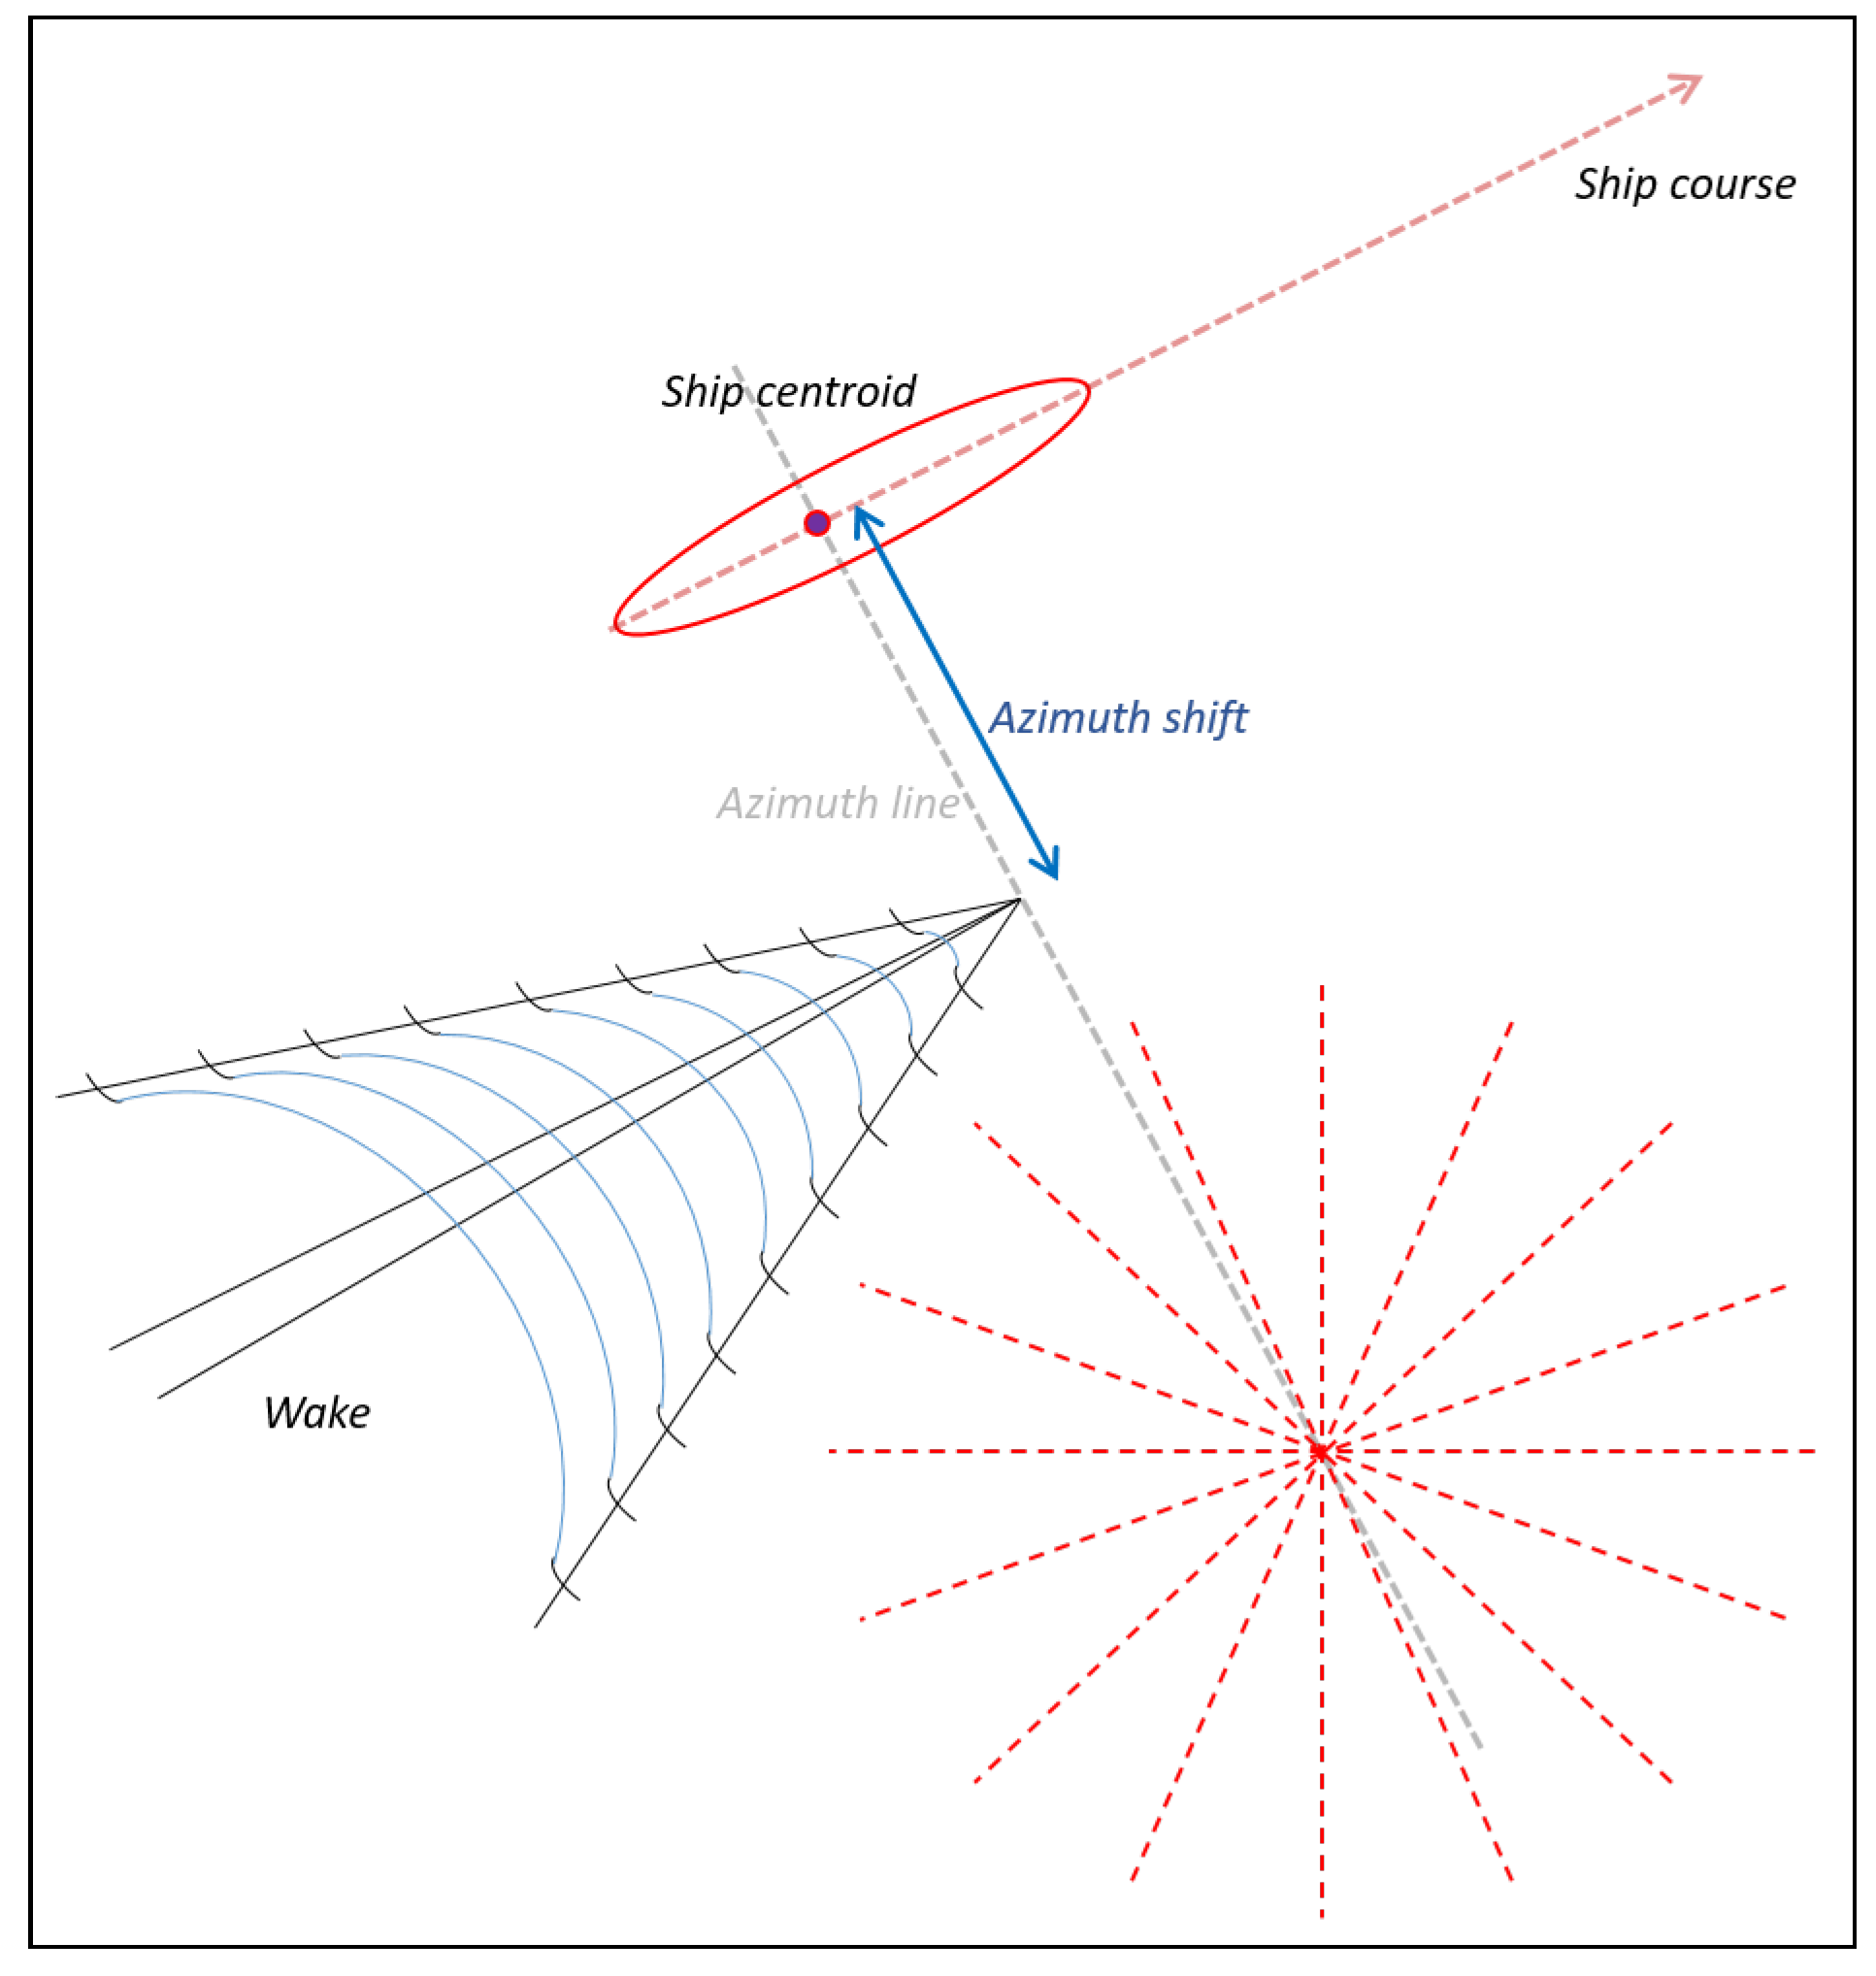
As previously mentioned, in case of SAR remote sensing of moving objects, the surface wake generated by the ship’s motion through the water will be represented in the map as displaced, with respect to the ship centroid, by a certain amount of pixels along the Azimuth direction. This can be exploited for limiting the wake pattern search to those points that lie along the Azimuth line (
Figure 9). The criteria adopted to implement the mentioned wake search are presented in the following section.
4.2. Azimuth Line Scan
The wake search is performed along the line passing through the ship centroid, with orientation given by the satellite heading (Azimuth). This approach, graphically explained in
Figure 10, is inspired by the work [
20].
It is assumed that the wake tip is located on the mentioned line. For each point
on that line, consider the family of straight lines having that point as the origin. In case a
angular pace is set, we will have a family of 360 straight lines for each point. For each of the 360 angle values, the integral summation of the pixel intensities along each orientation is computed as follows:
Hence, each point on the azimuth line has an associated angular histogram, describing the average image value along 360 angular directions. In case a linear pattern crosses a point located on the azimuth line, the integral summation process will generate a peak for that particular direction. As soon as the scan on the azimuth-oriented line gets to the wake tip, the corresponding histogram will exhibit a number of peaks as large as the number of observed wake arms. Hence, a first detection criterion consists of selecting the point
on the Azimuth line (
Figure 9) such that the corresponding angular histogram features the largest peak:
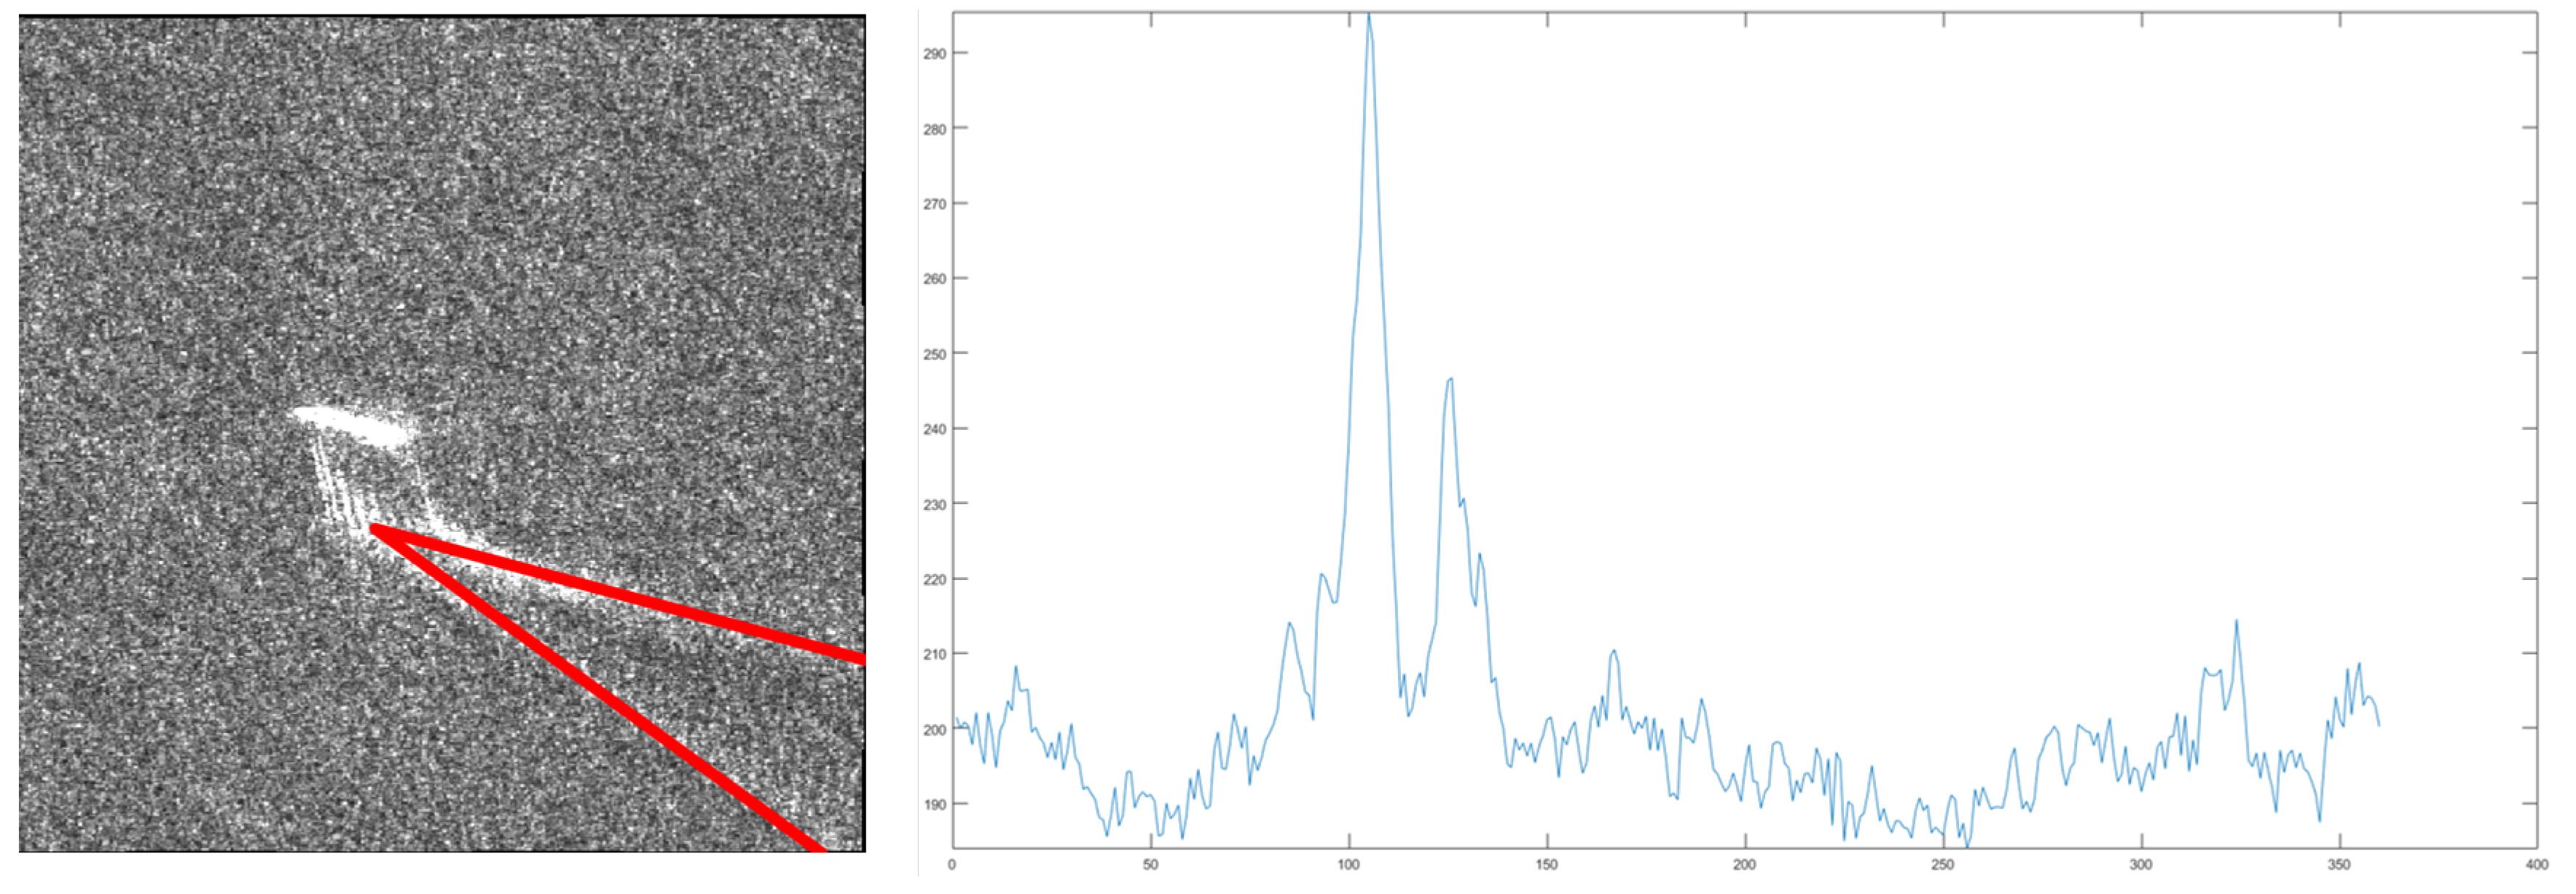
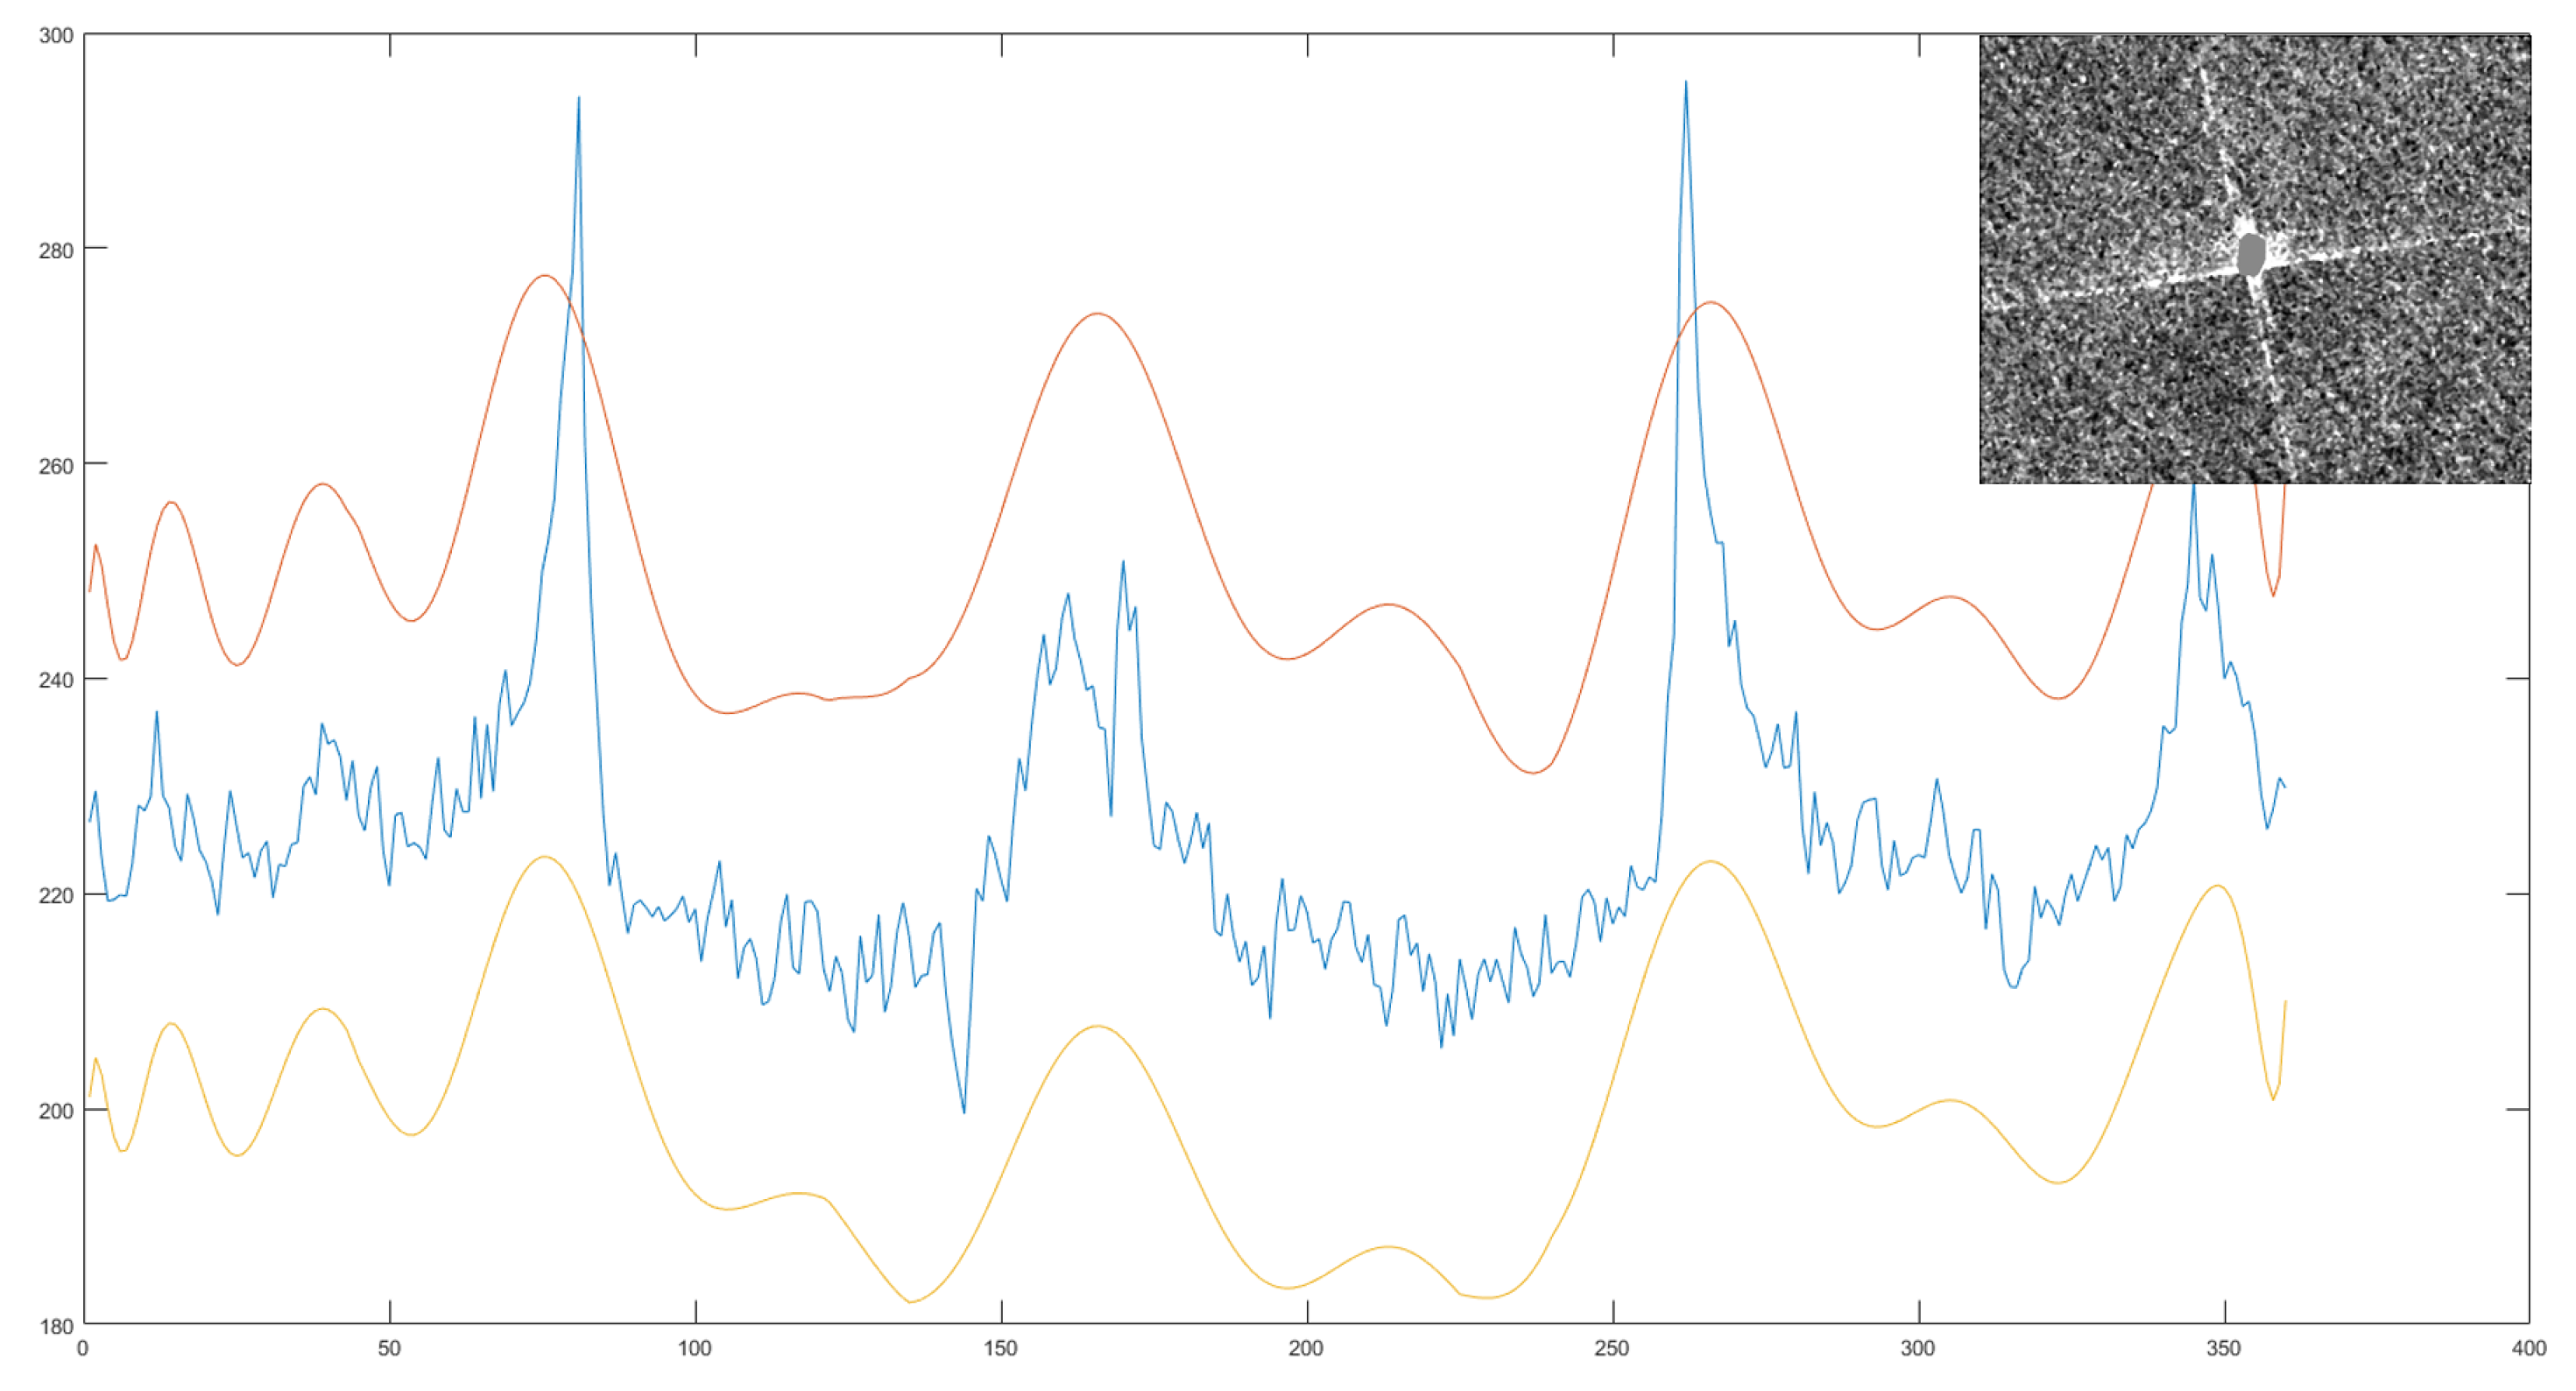
Performing this operation on the data represented in
Figure 1 returns the histogram function in
Figure 11.
4.3. Wake Detection
As a consequence of the previous stage, in every crop, one single point lying on the Azimuth line has been identified as the potential tip of a wake trace. Between all the points that lie on the Azimuth line, the selected one is the most probable, since its associated angular histogram function, i.e., the distribution of the pixel mean values computed along 360 directions, features the largest peak amplitude.
In order to decide whether an angular histogram is generated by a meaningful linear object (e.g., a wake pattern arm) or it is due to noise/spurious signals, the histogram undergoes a dedicated detection stage, following the ideas described in [
20].
Given a point
on the Azimuth line, the histogram function
can be approximated, according to [
26], by a linear combination
of
n Chebyshev polynomials, where
n is the order of the fit and
is defined in the angular domain
.
The Chebyshev orthogonal polynomials are defined as:
with
and
.
Thus,
can be expressed as:
The coefficients
are estimated adopting a least squares approach, i.e., they are computed by minimizing the following error:
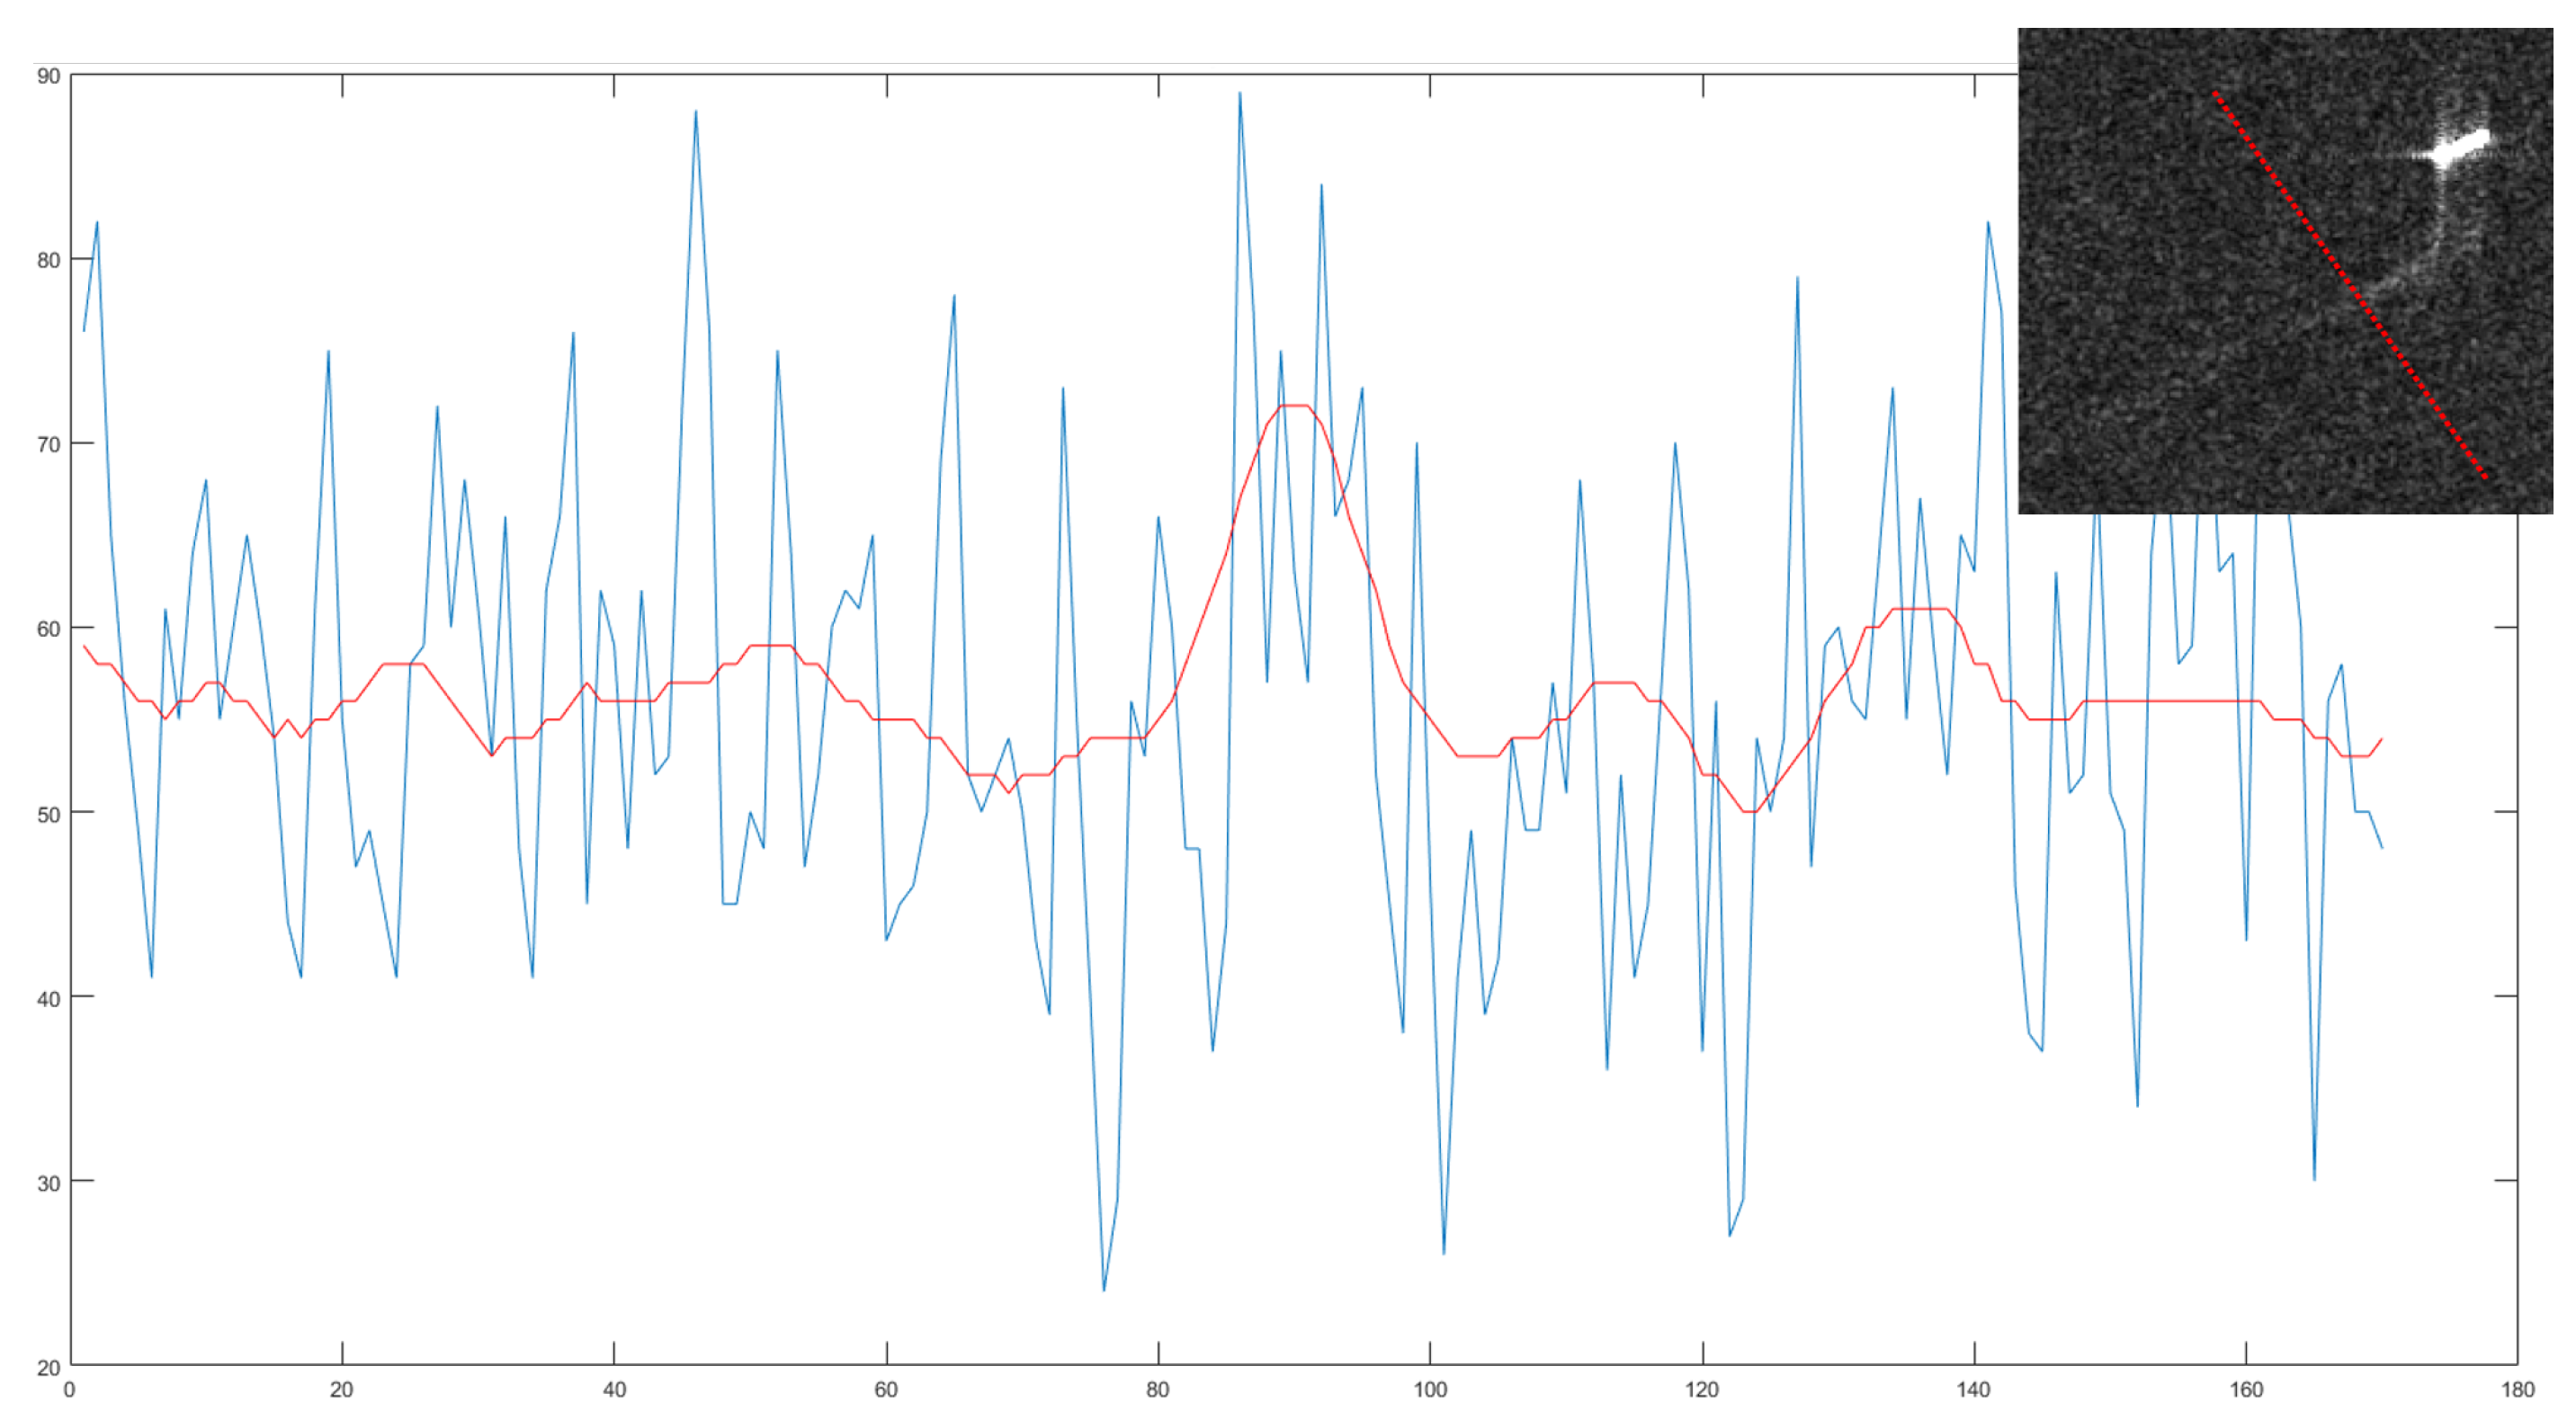
If the fit order value is chosen as sufficiently small with respect to the number of histogram bins, e.g., taking the first few Chebyshev polynomials to approximate
g, the fit operation returns a continuous curve that smoothly follows the input signal (red dotted curve in
Figure 12).
Each point in the fit curve has an associated uncertainty which depends on the statistical hypothesis adopted to model the signal capture process.
According to the assumed hypothesis, the pixel values are samples of the related random distribution, hence, for every point on the fit curve, the statistical deviation from the mean value can be expressed by a numerical value
, as in [
20].
The computed deviation is exploited to decide whether a histogram value lies within a regular range or if it represents an anomaly.
Indeed, a histogram
is associated with a positive detection in case one or more of its points overshoot a given threshold. The threshold is defined point by point, since each value of the histogram is computed as the average of a varying number of pixels. For the
i-th angle, the threshold has been placed at
p times the corresponding standard deviation
above the fit curve value. To obtain the purple and yellow curves in
Figure 12, we adopted the same approach specified in [
20] with
. It has to be remarked that the choice of the optimal detection threshold represents a delicate decision in the processing chain. Indeed, it is not usually possible to have an a priori knowledge of the noise statistical properties, since it is typically modeled as a non-stationary space-varying speckle process.
Some exception rules have been implemented in order to avoid spurious signals from passing the detection stage. In case of SAR remote sensing, the backscatter signal captured by strong reflectors, such as the vessel metallic hull, is usually affected by typical cross-shaped artifacts (
Figure 13, upper right). These artifacts typically feature low intensity values, but they become relevant in case the signal undergoes a preprocessing stage to enlarge the intensity range, e.g., by applying a gamma correction algorithm (see, for example, [
18]). In these circumstances, spurious signals typically generate relevant peaks in the angular histogram, causing false positive detections.
In order to avoid misleading pitfalls, the algorithm is enhanced by introducing dedicated rules, such as the exclusion of those candidates whose histograms exhibit peaks separated by specific angular distances that may relate to the presence of cross-shaped artifacts (e.g., multiples of
). An example of an angular histogram returned by the application of the wake detection pipeline to a signal affected by a star-shaped artifact is represented in
Figure 13.
4.4. Gradient Based Wake Detection
In SAR imaging of moving vessels, a typical turbulent wake appears as a central dark line aligned with the ship longitudinal axis. Two bright linear features (narrow V-wakes) can appear within a half-angle of
. In this section, we focus on the detection of the turbulent band by first computing the signal gradient through an approach specifically suited for speckle-affected signals, followed by the detection of the wake central component based on the methods discussed in
Section 4.2 and
Section 4.3.
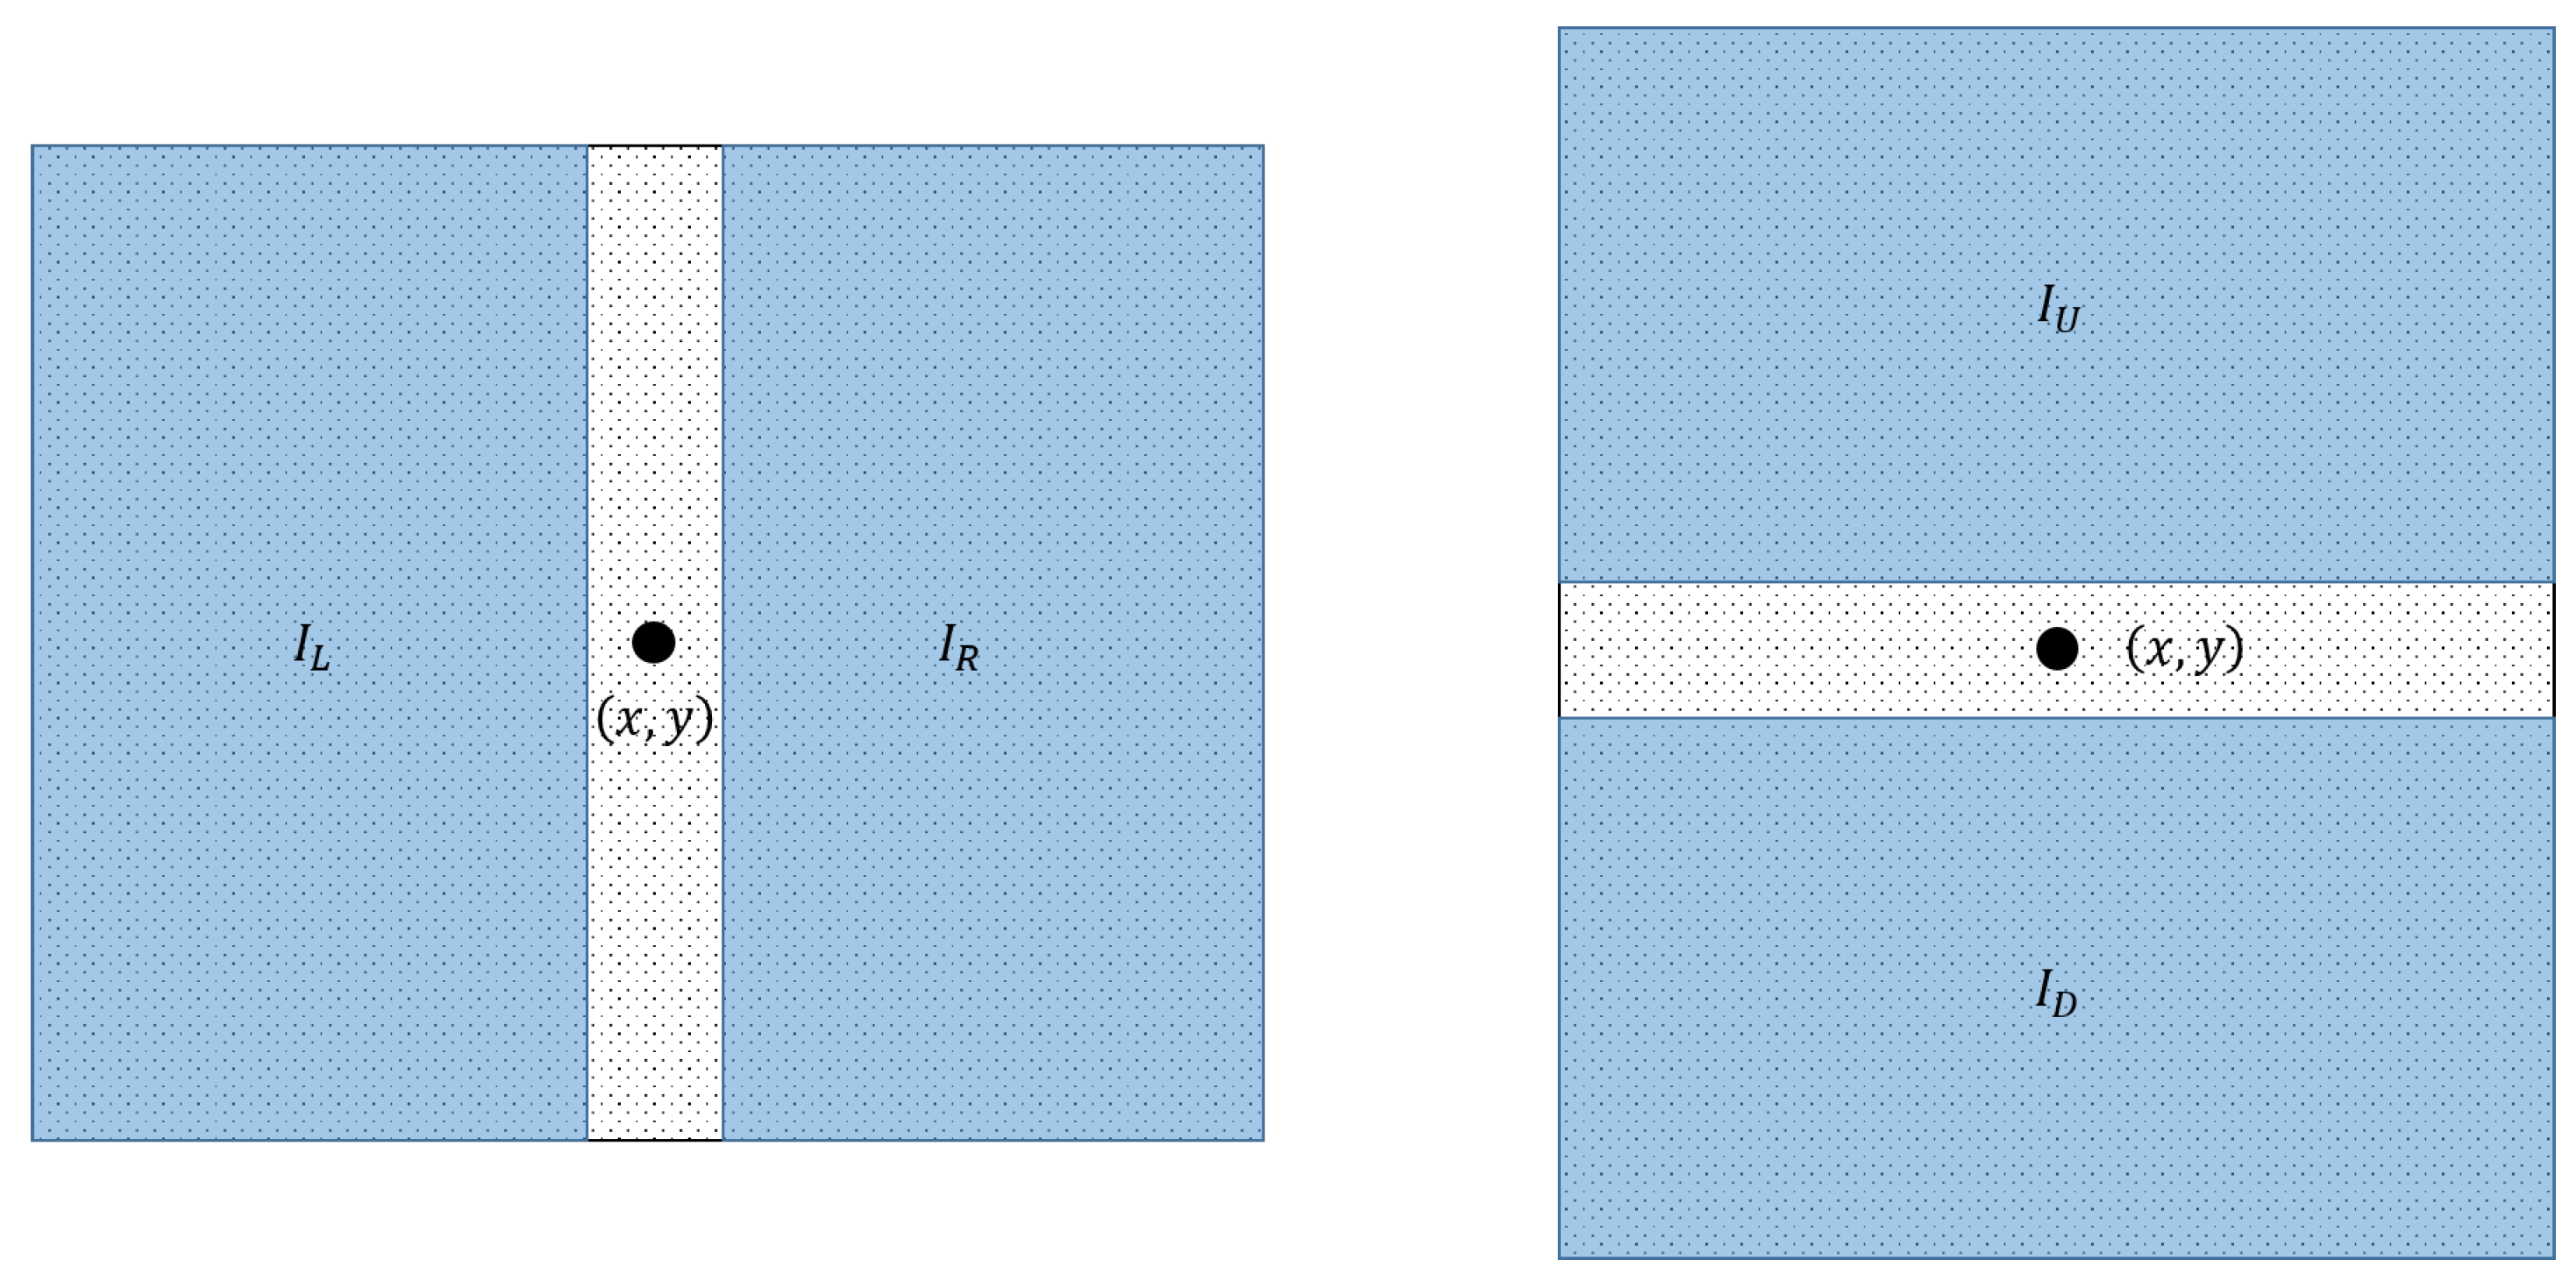
Indeed, we expect that the local gradient exhibits relevant variations along the direction orthogonal to the wake center axis (
Figure 14). However, it is a proven fact (see [
27]) that estimating the gradient through differences of standard masks (e.g.,
or
) results in low performances on speckle-affected data.
In order to robustly estimate the signal gradient, we adopted the approach described in [
28]. In the article mentioned, the signal derivative at a given point
is computed through the ratio of average (
roa) estimator (see
Figure 15), which is defined, for the horizontal and vertical cases, as
The horizontal and vertical
roa correspond to the horizontal and vertical gradient components obtained as:
and the related magnitude and phase values
Hence, gradient phase and amplitude are estimated, for every pixel in the image, by means of Equation (
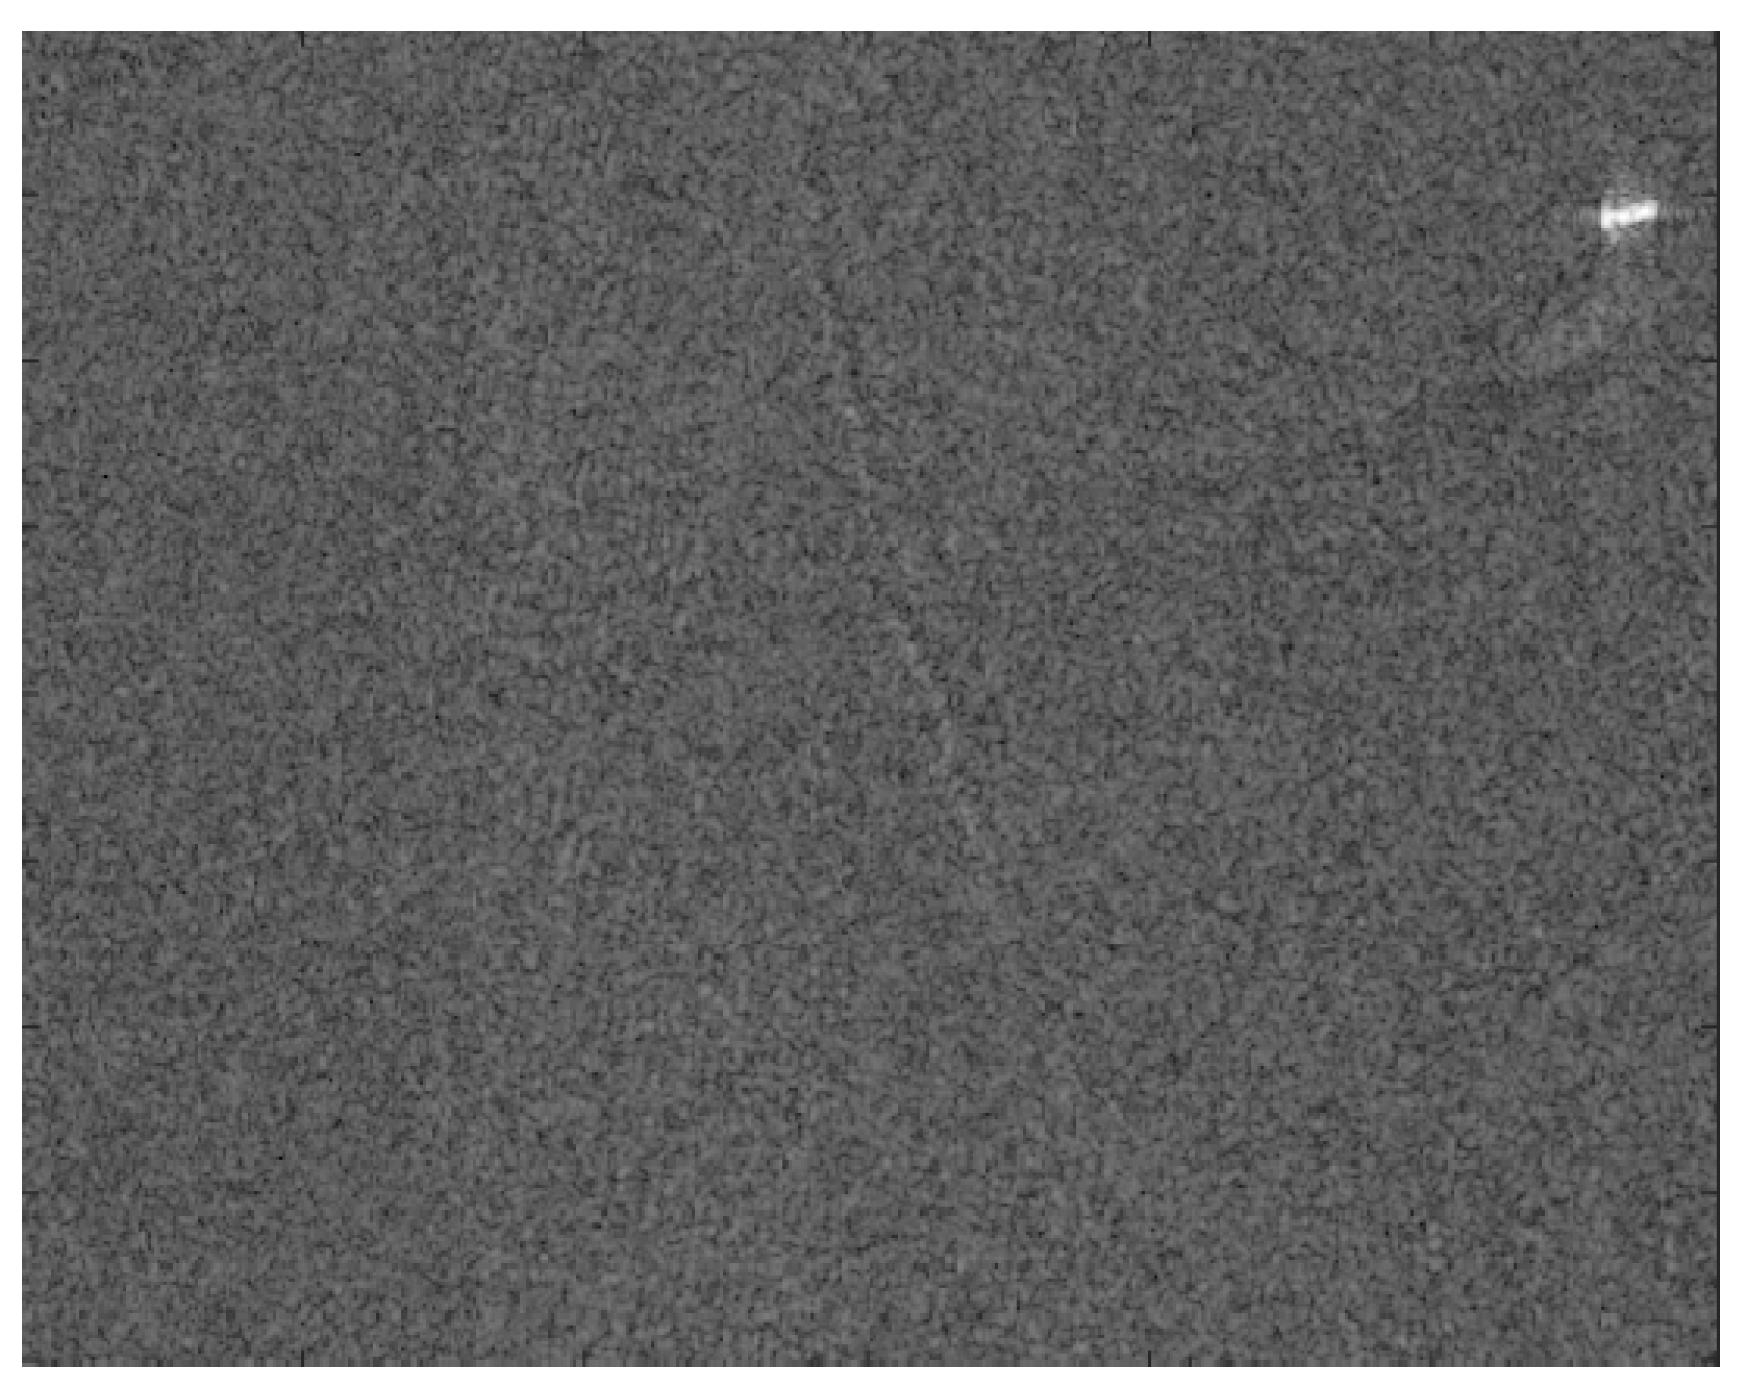
13). Eventually, in order to capture and isolate the maximum variation of the signal in the wake neighborhood, the estimated gradient is projected onto the direction orthogonal to the previously estimated main axis of the ship. The resulting gradient is finally processed by the wake detection method discussed in
Section 4.2.
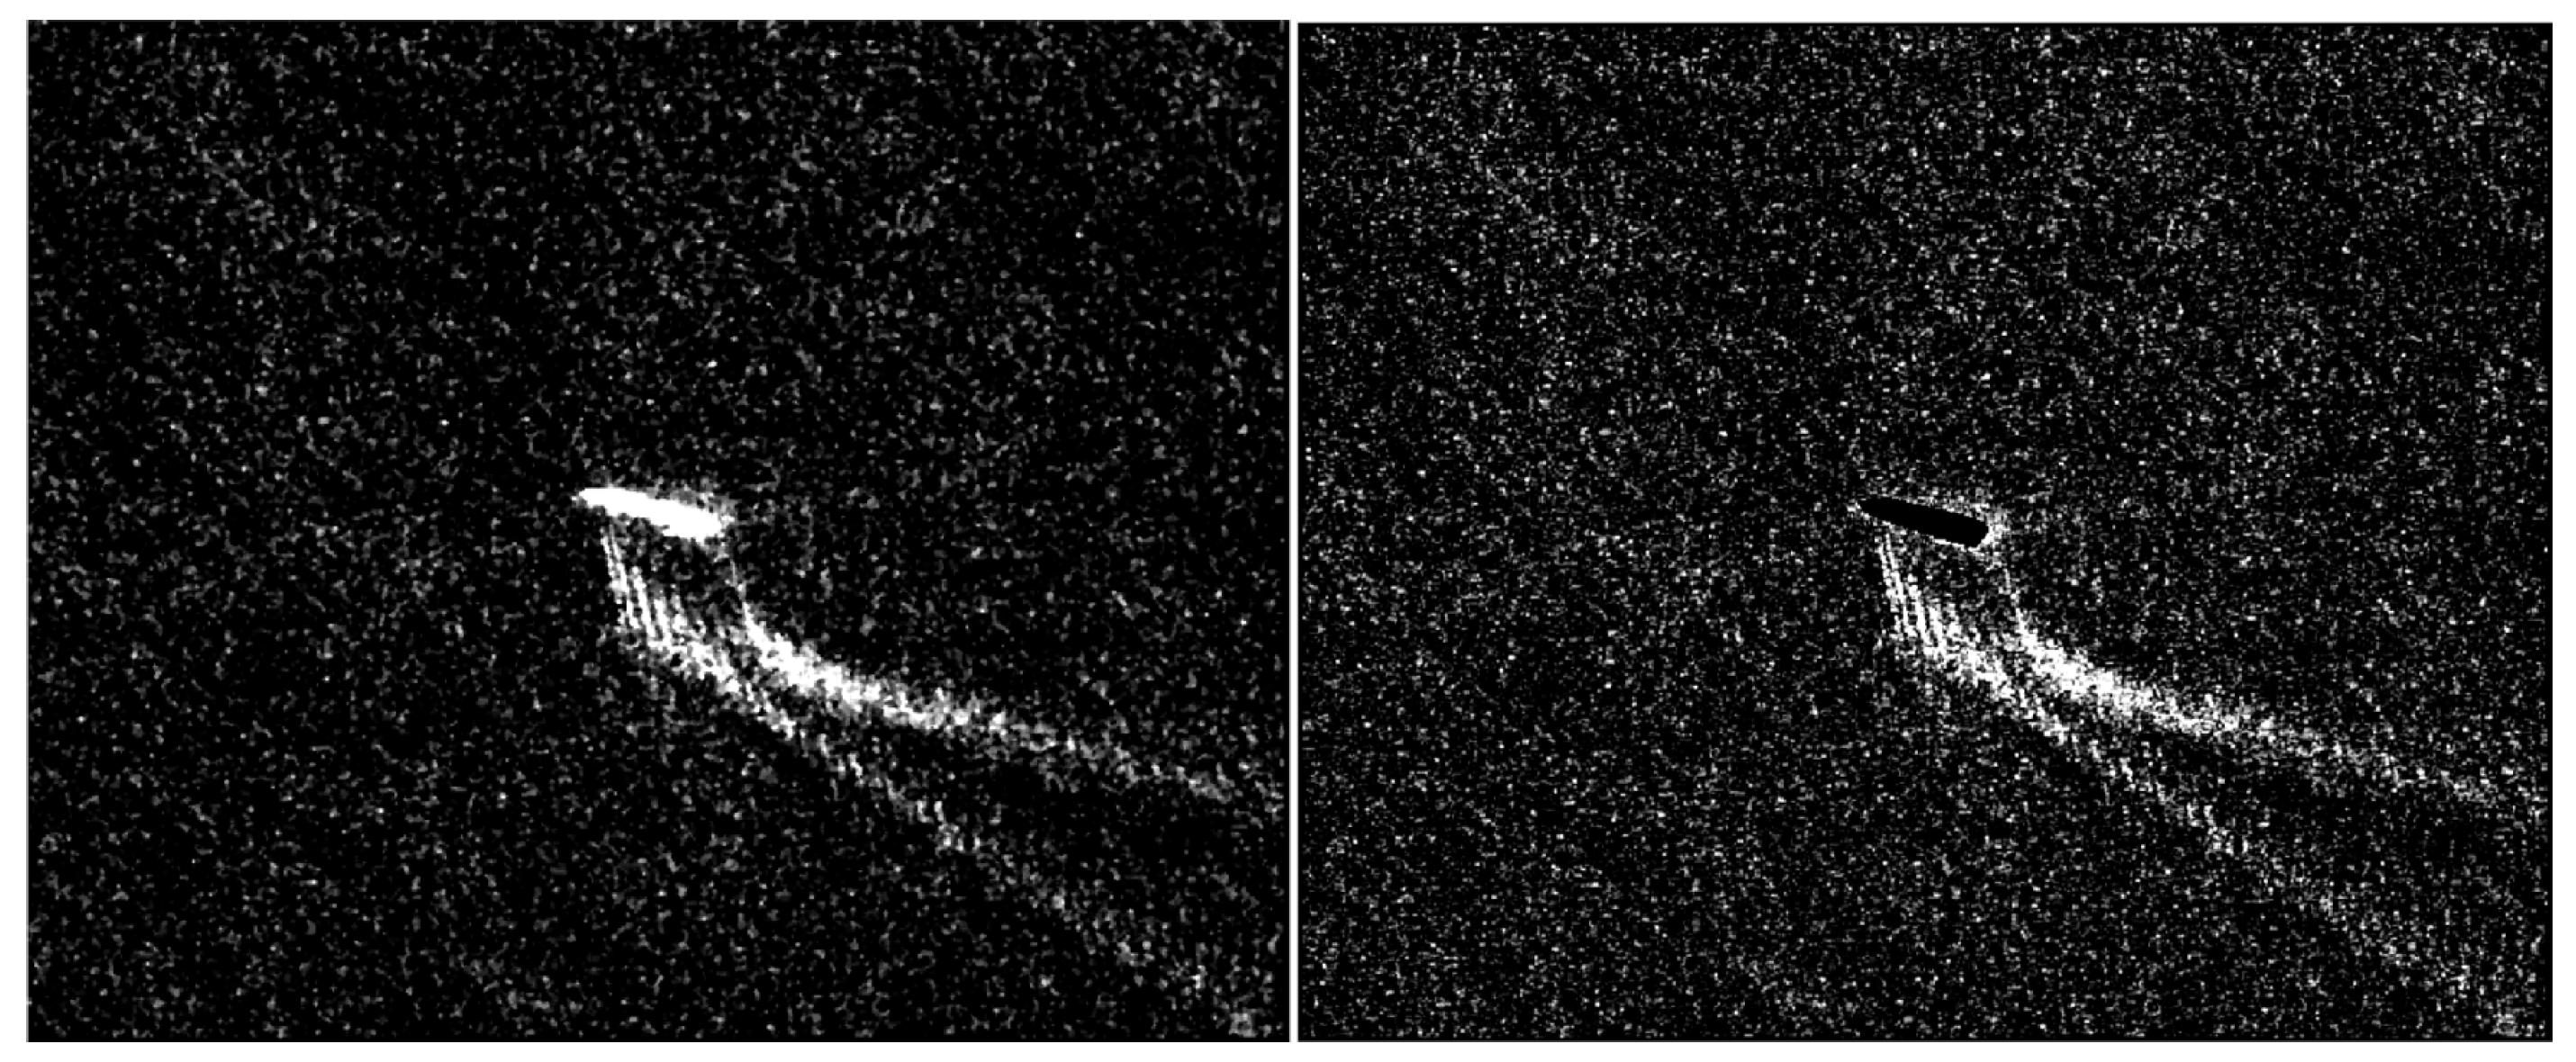
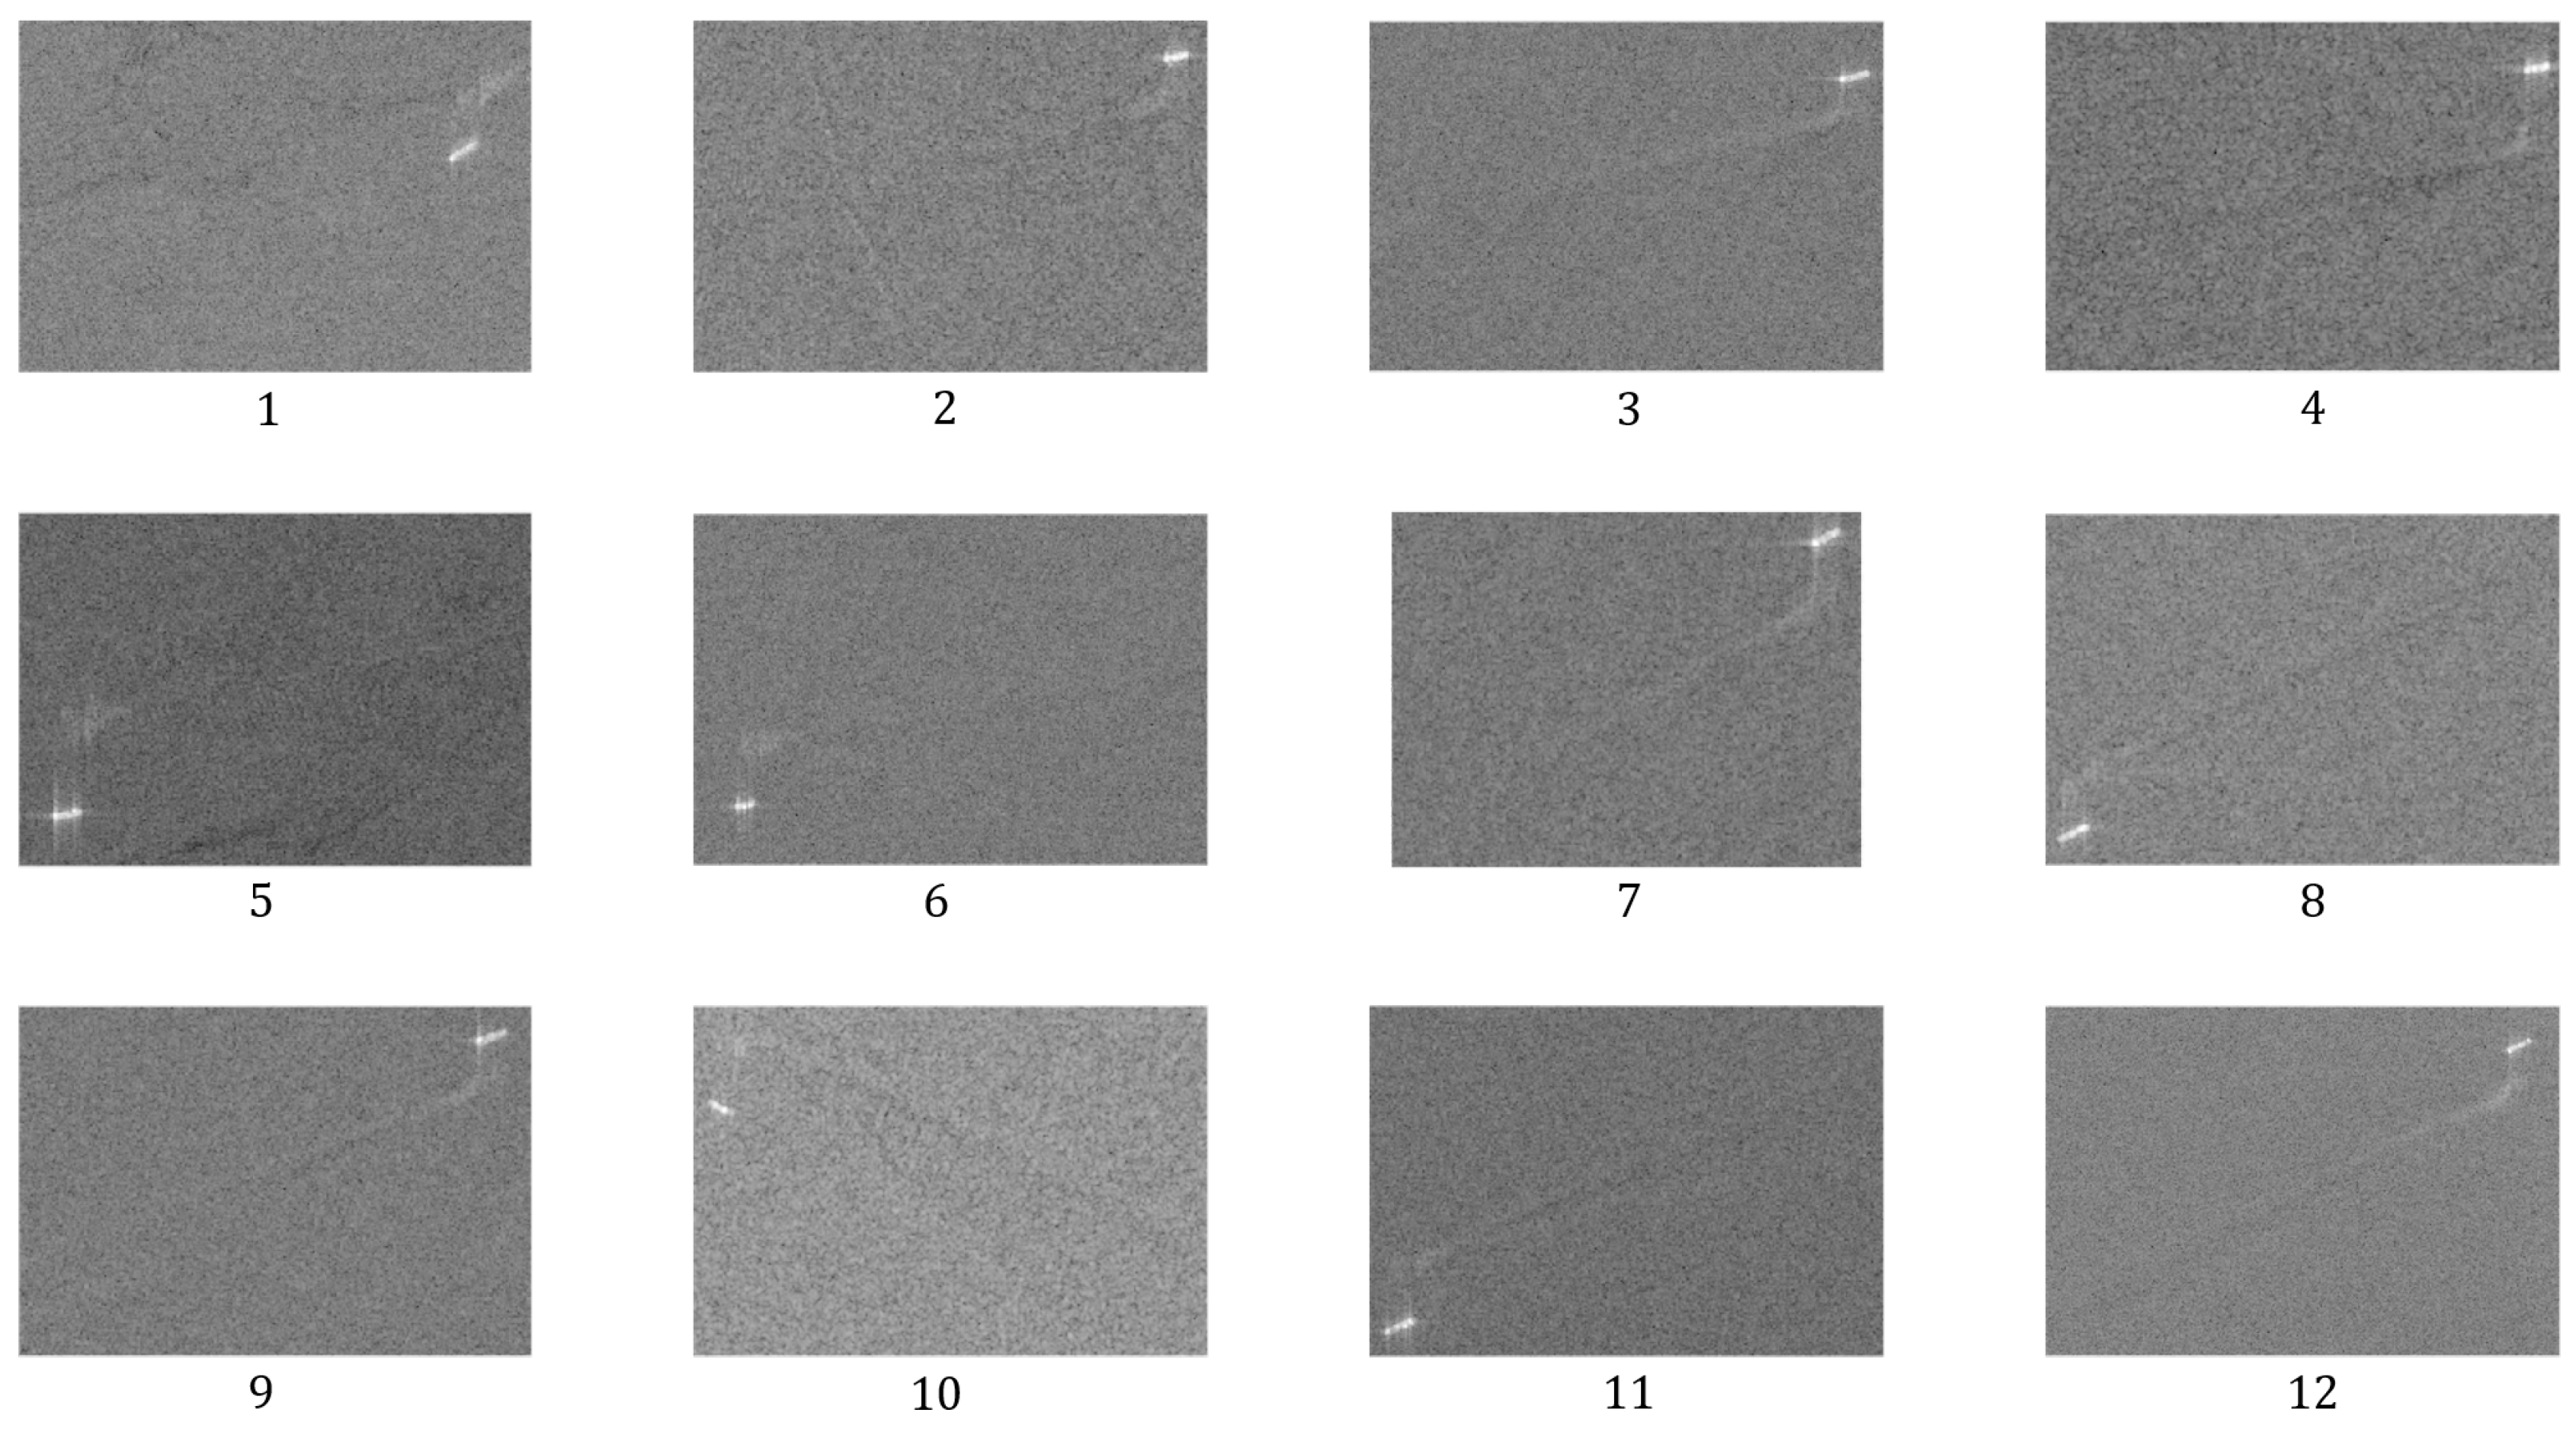
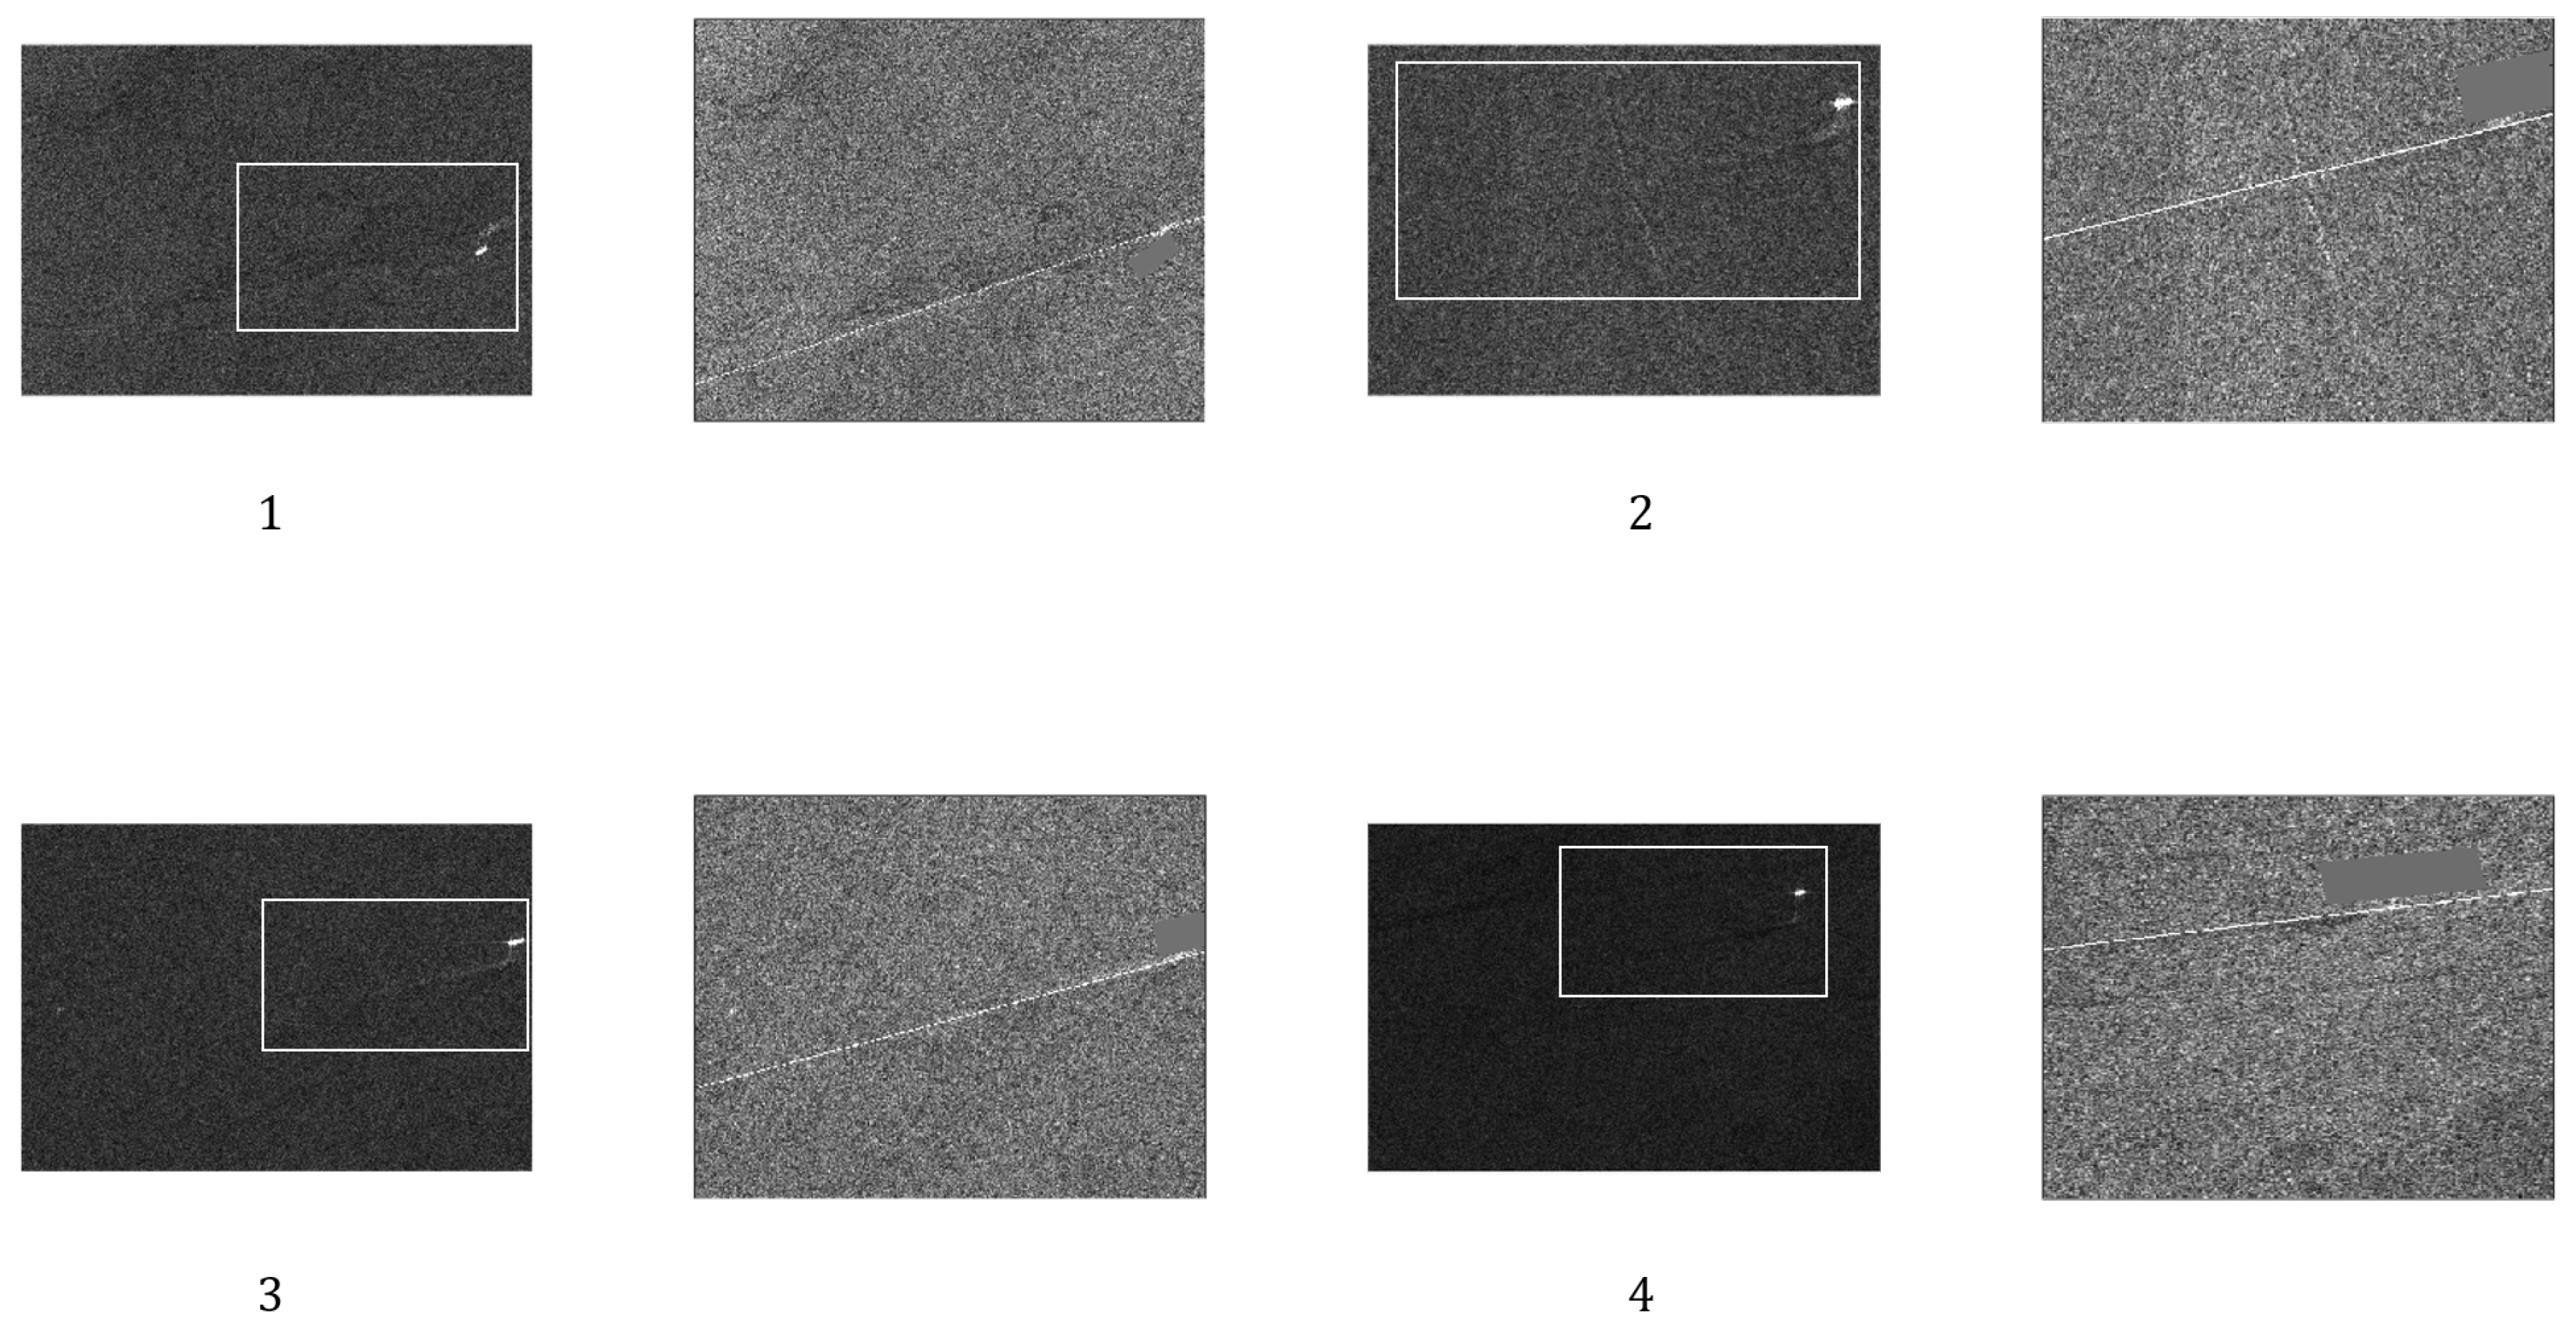
The proposed turbulent wake detector has been applied to the dataset in
Figure 16. The detection of the turbulent band can be visually observed in
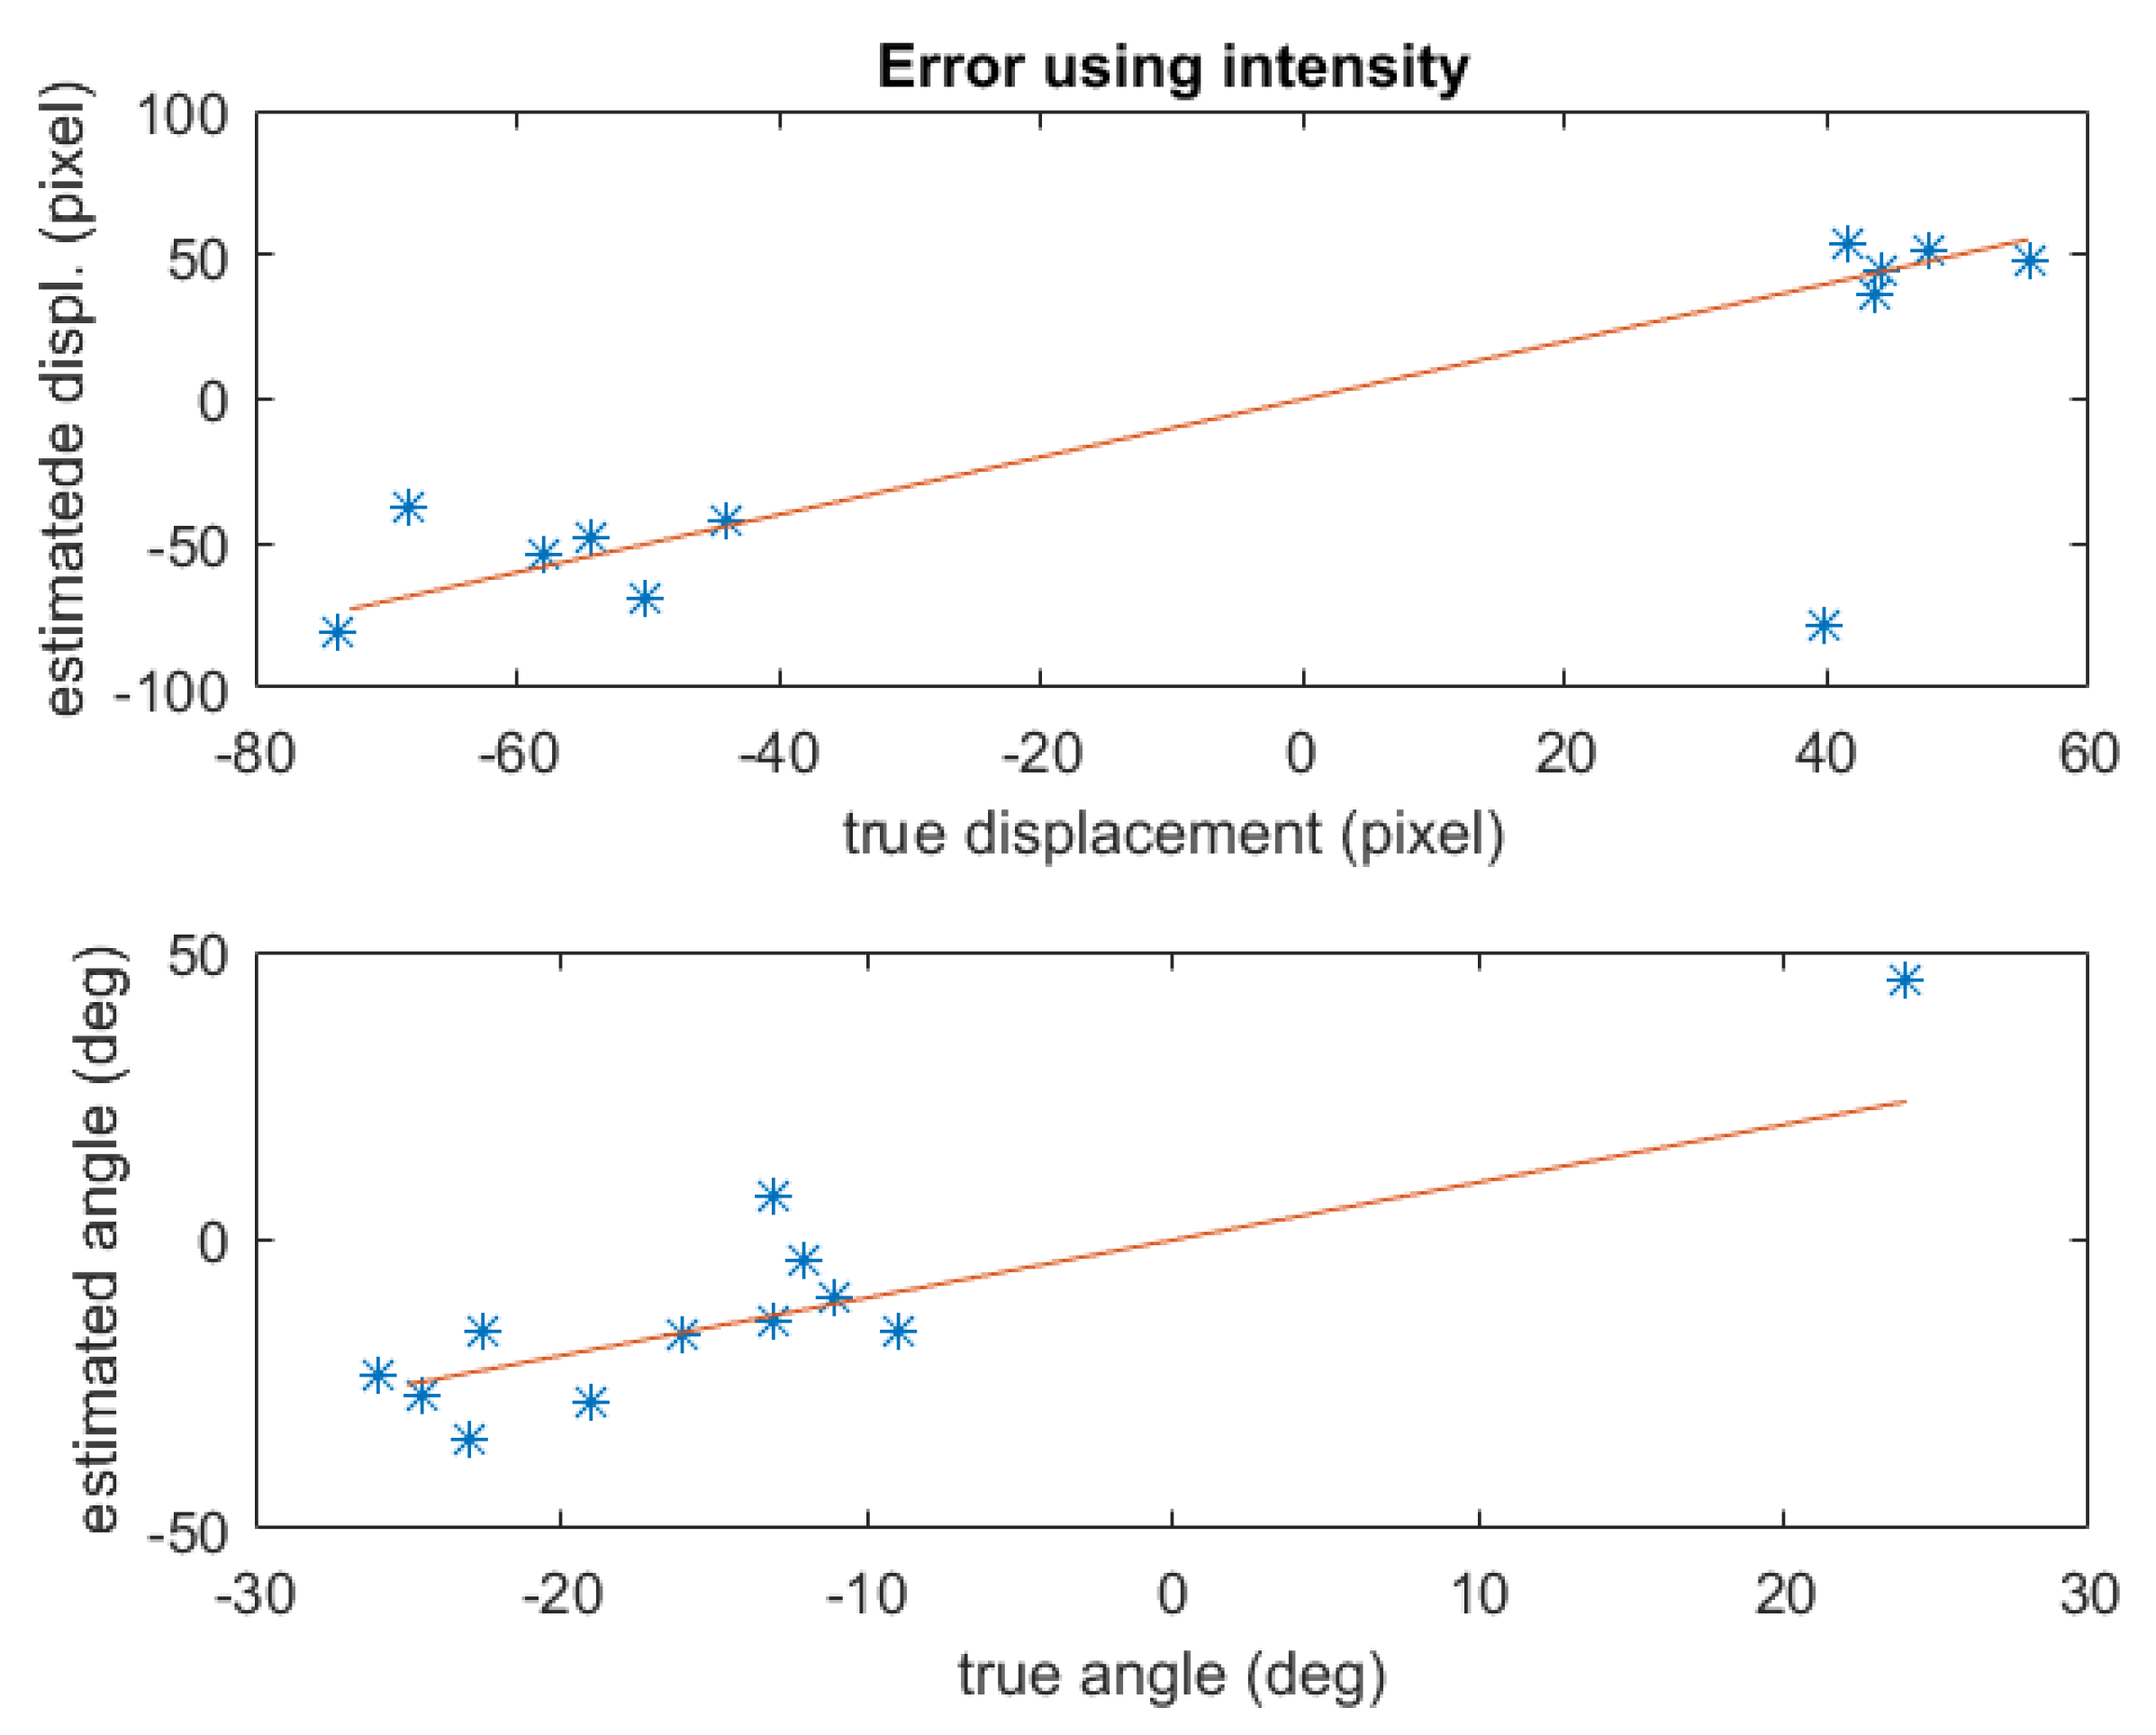
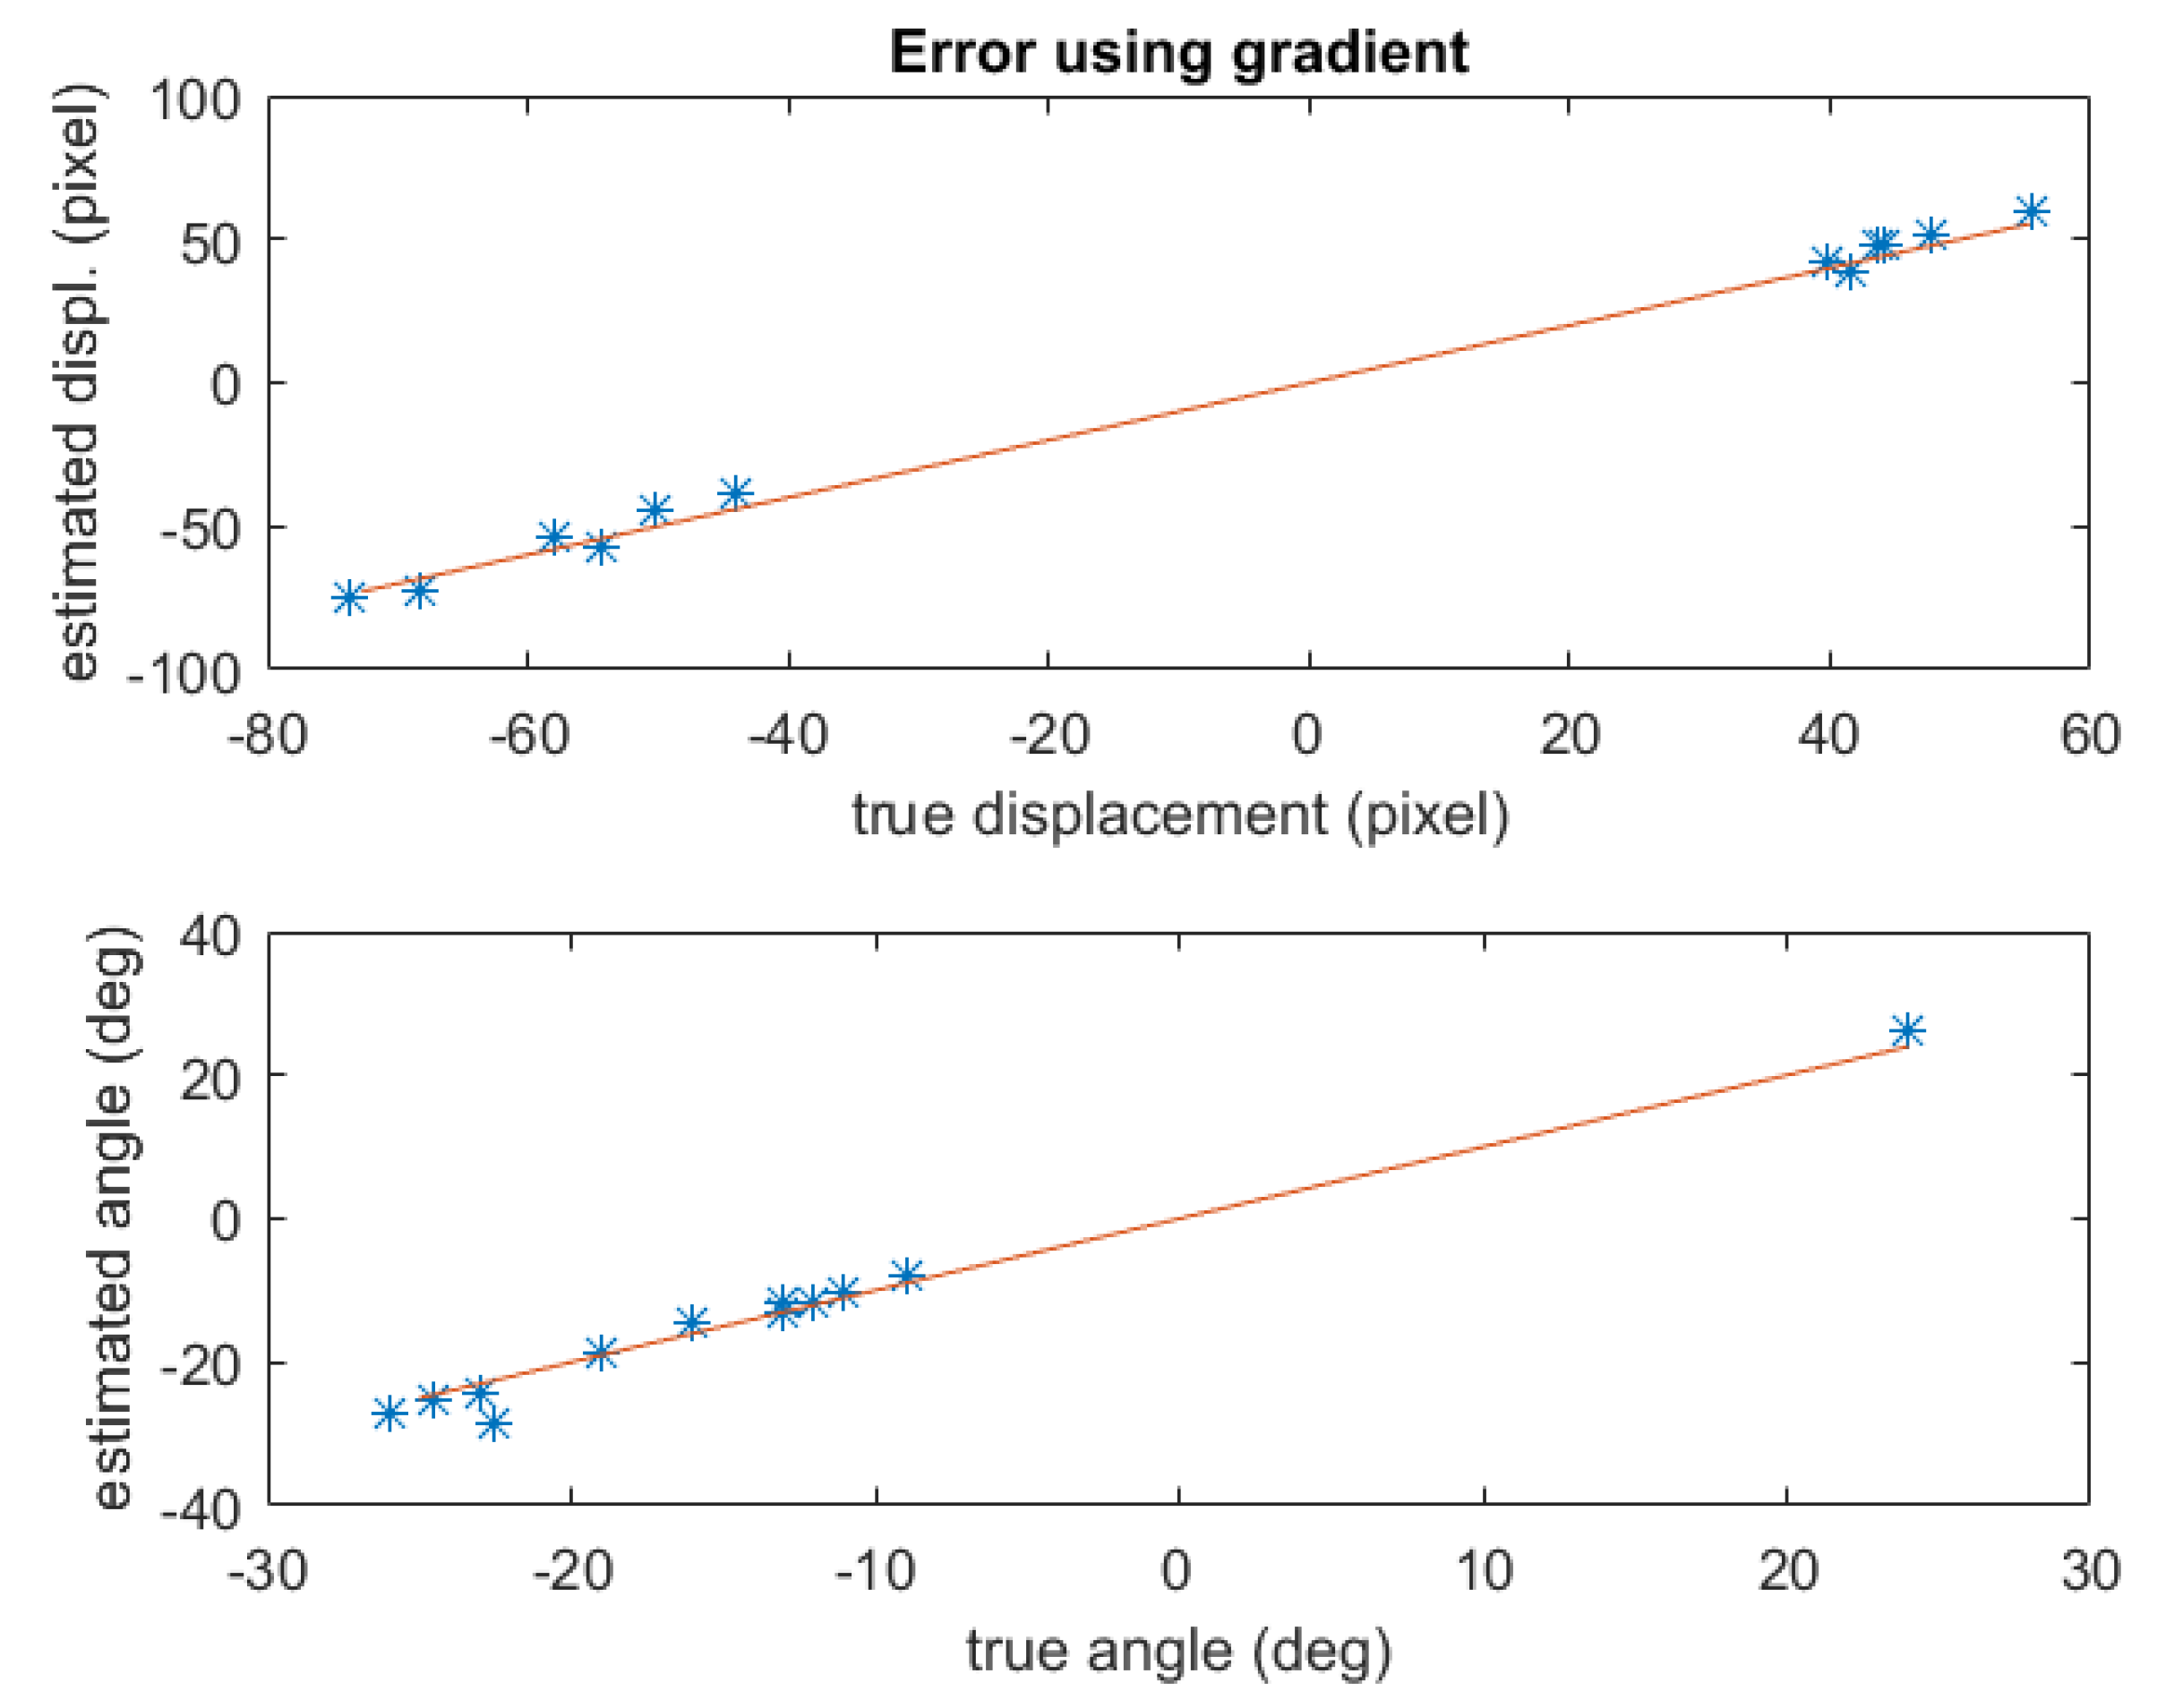
Figure 17 while numerical validation is illustrated in
Figure 18 and
Figure 19, where the estimated Azimuth displacement and turbulent wake orientation have been plotted versus the corresponding true values. In particular, the first set of diagrams represents the comparison between the results obtained by applying the proposed pipeline directly on the intensity maps (standard approach following [
20],
Figure 18), while the second set (
Figure 19) accounts for the results obtained by preprocessing the intensity map by the described gradient estimator. It is relevant to consider the data dispersion around the red line (the
line) in
Figure 19, and observe the better performance of the proposed method w.r.t. the standard method (
Figure 18).
4.5. Wake Analysis
In case a crop candidate passes all the detection phases, it is further processed to extract all the information that is considered of interest. First of all, the peaks that overshoot the
threshold are considered wake components. As already stated in [
2], in the most favourable case, the observable wake components are the central turbulent band, directed as the vessel route, and two external envelopes placed symmetrically at ±
w.r.t. the central component.
Since the vessel route coincides with the center band of the wake pattern, recognizing the turbulent component represents a crucial goal for the wake analysis task. In case the number of observed components is at a maximum, the route is defined as the bisector between the most external components, while, in case a single line is detected, this one will be automatically identified as the turbulent component. In the most ambiguous circumstance, i.e., when the algorithm detects two different lines, the adopted approach consists of selecting the component that exhibits the largest mean value. Since the central turbulent band of a wake usually features the largest backscattering signal, the largest peak in the angular histogram is finally labeled as the wake central orientation.
After the vessel route computation, the wake pattern is considered for estimating the ship’s speed. Indeed, the kinematics information intrinsically included in the wake pattern geometry can be exploited to estimate the vessel velocity according to the methods discussed in
Section 2.
The analysis of the wake pattern has been performed on the ship target represented in
Figure 1. For that candidate target, it has been possible to get reliable ground truth data from a commercial Automatic Identification System (AIS) provider. The analysis performed on the detected wake pattern provided the results in
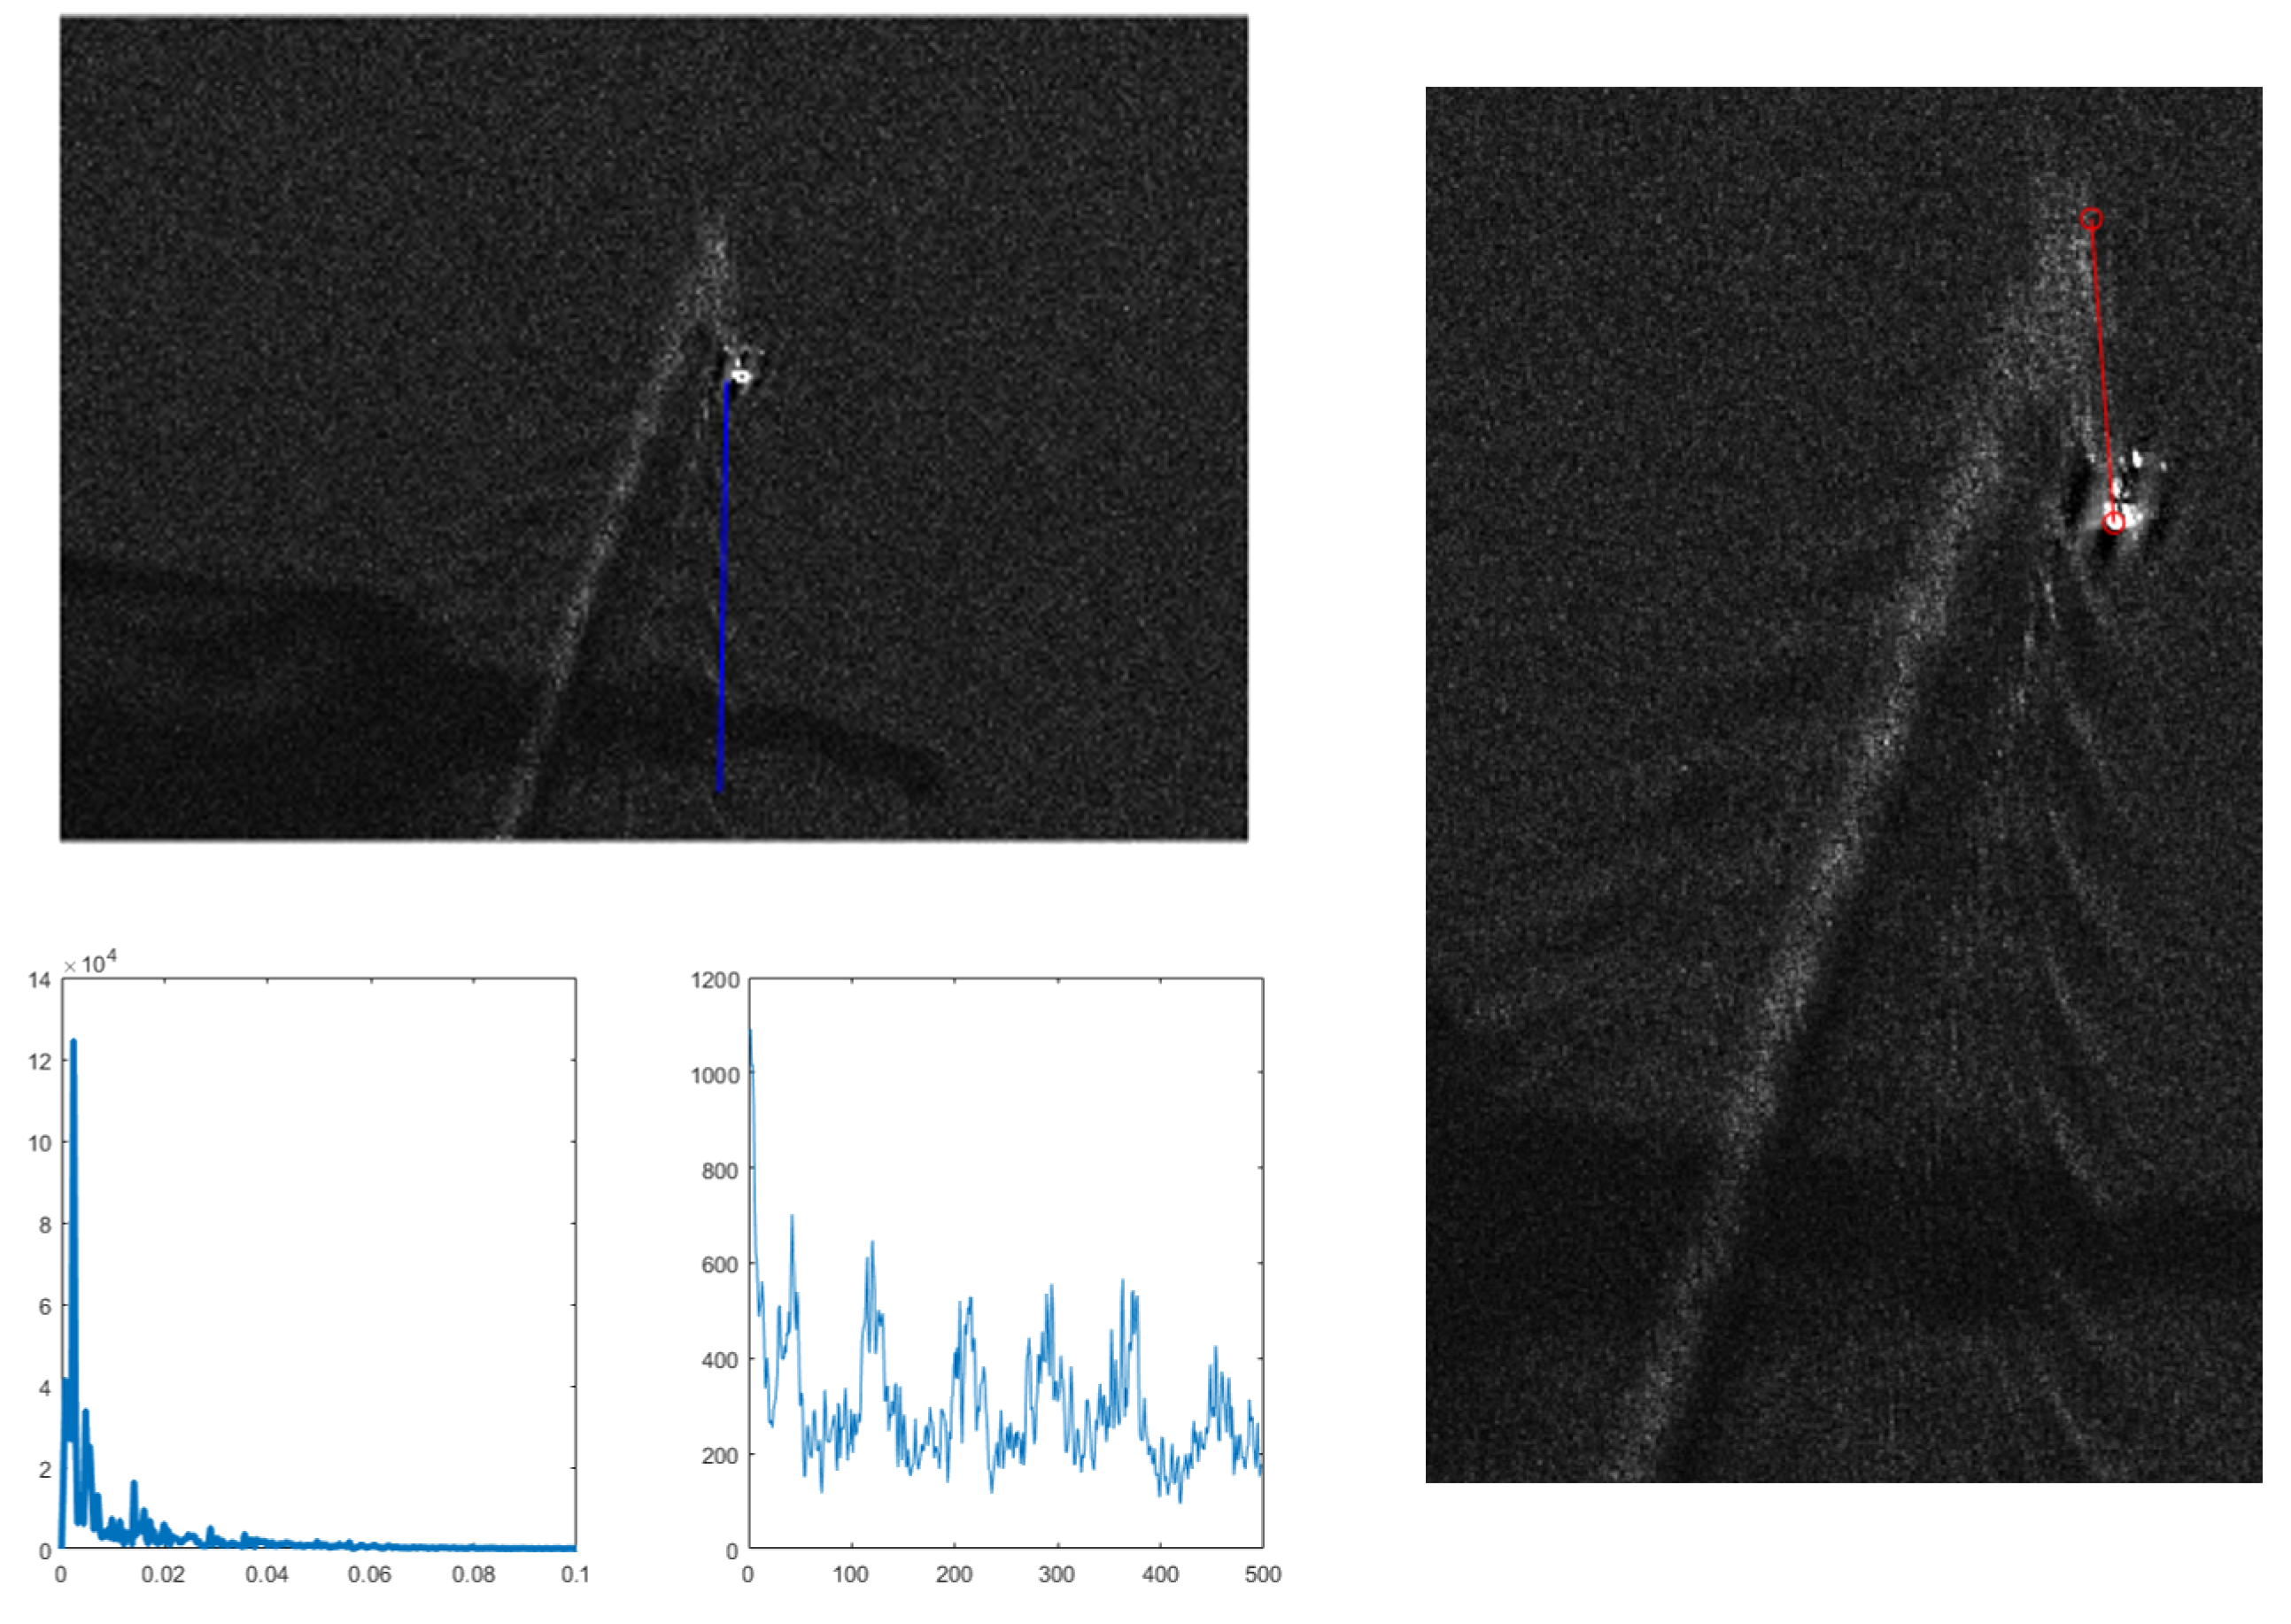
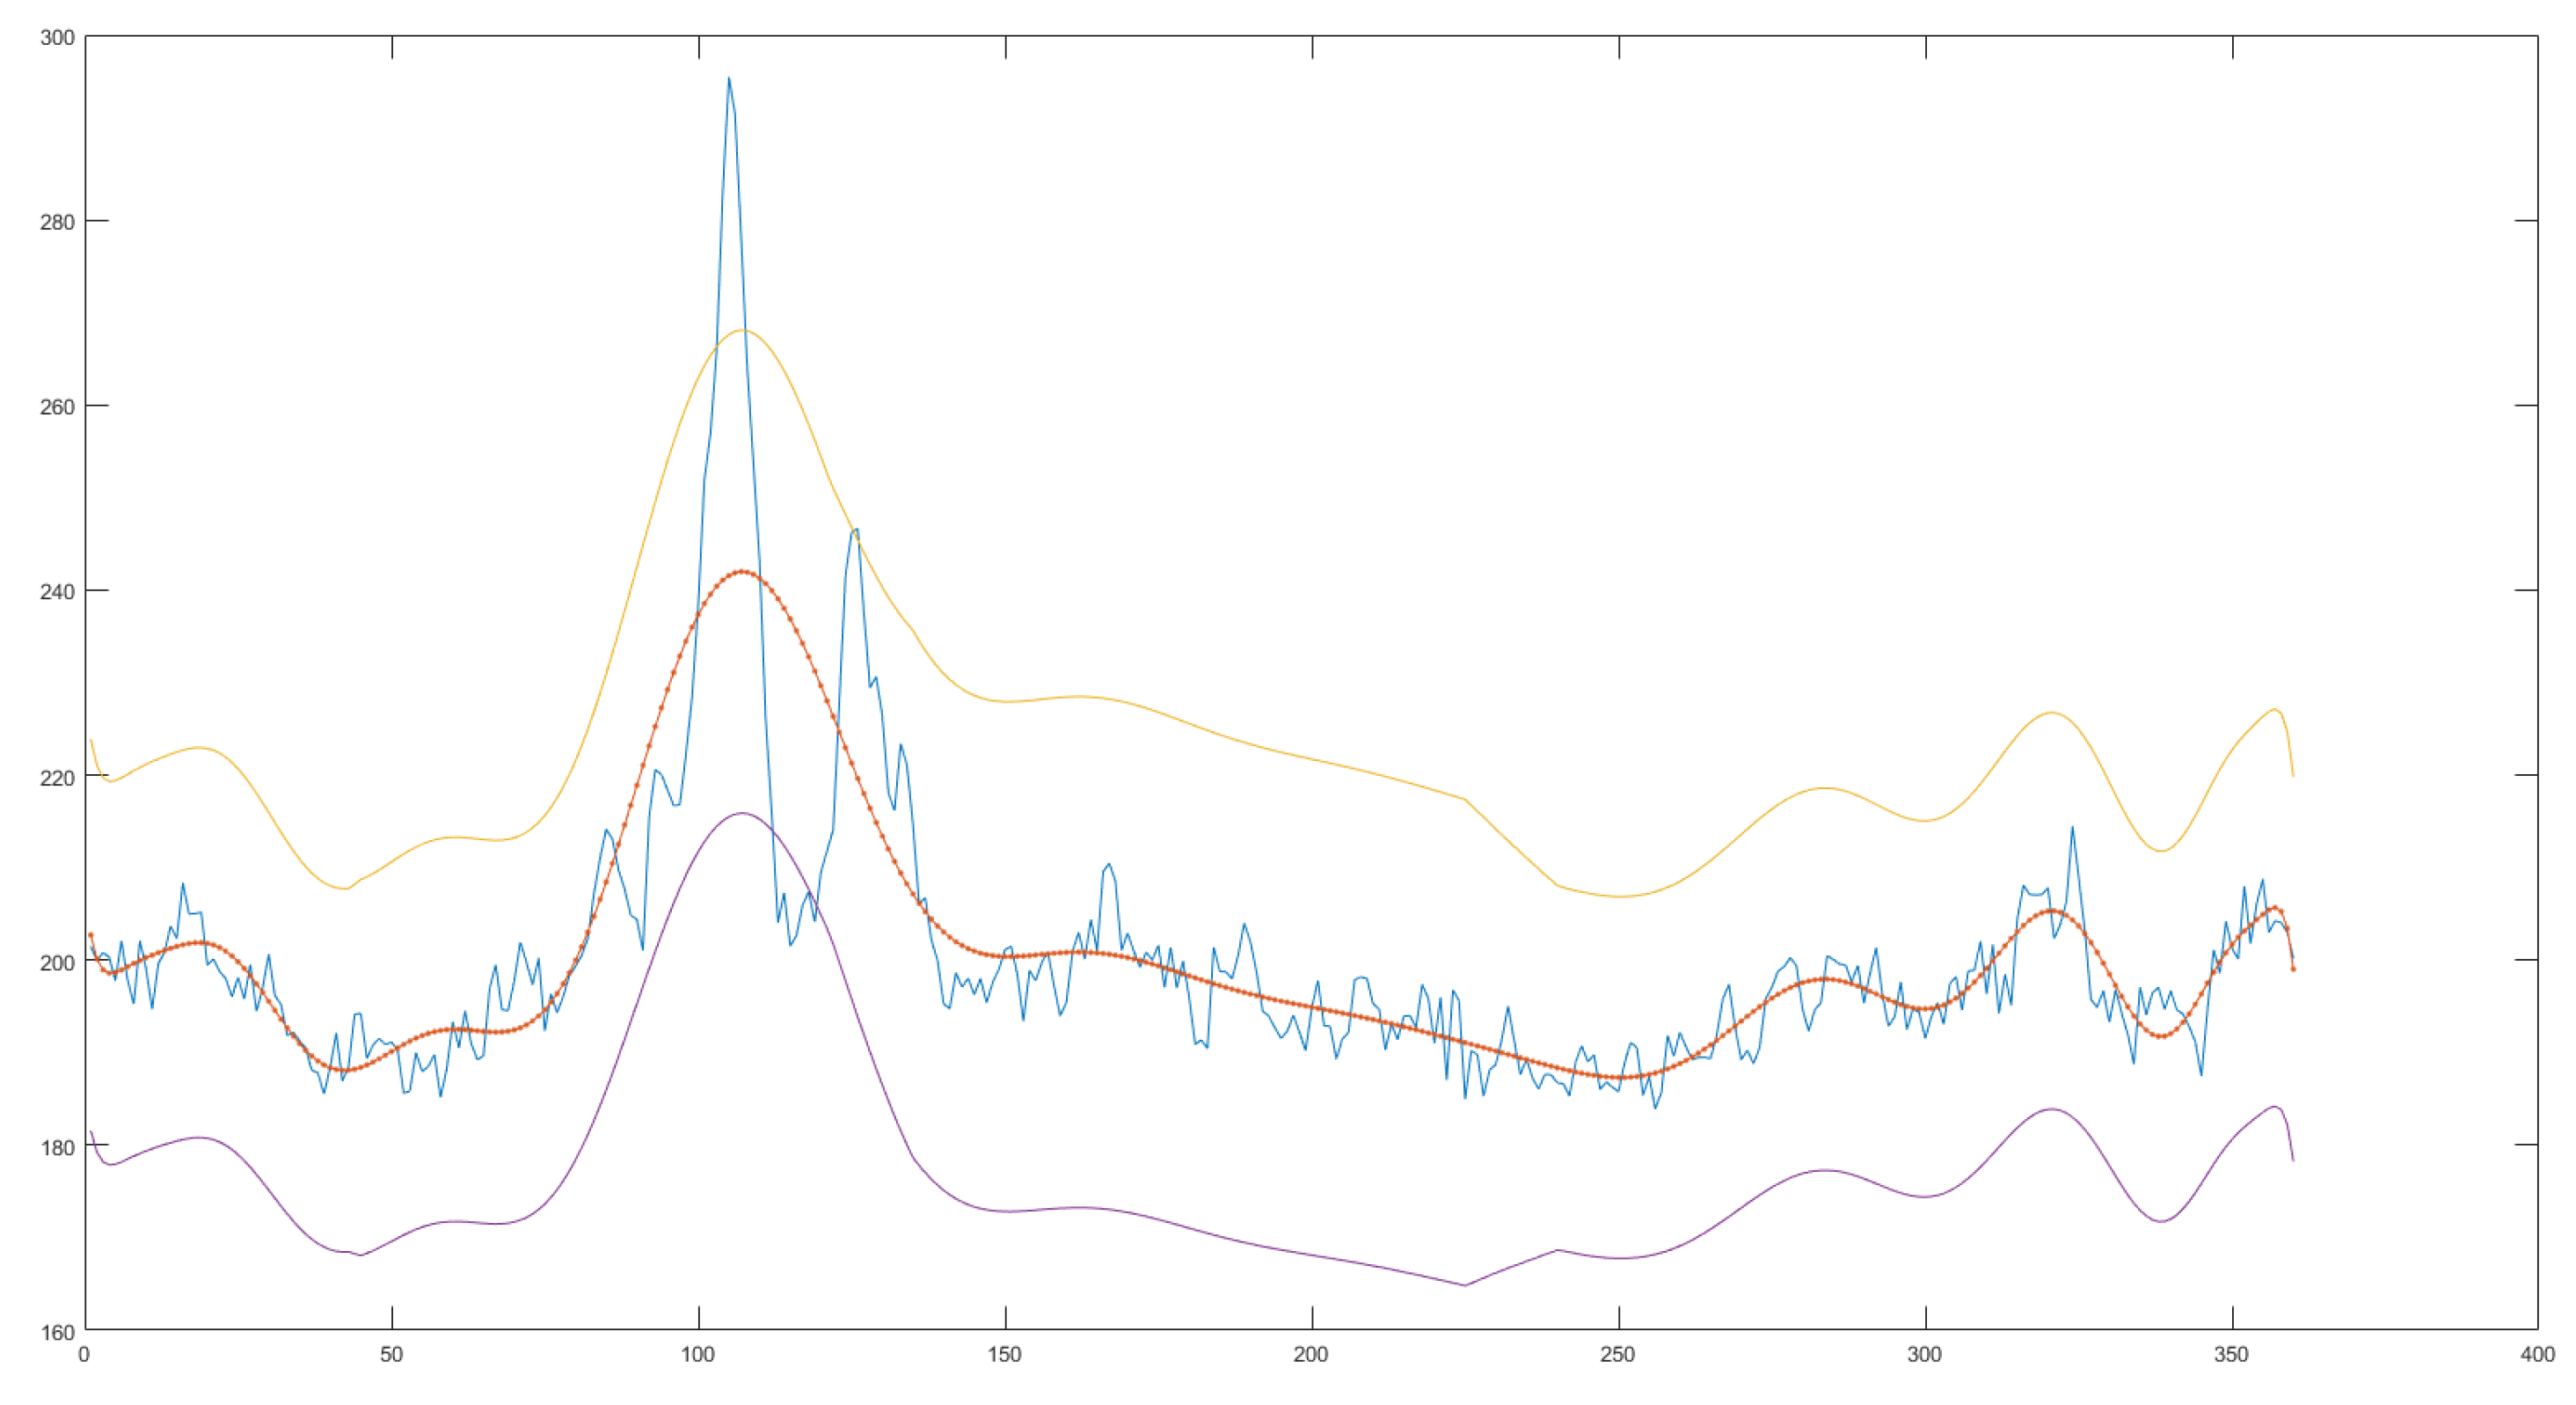
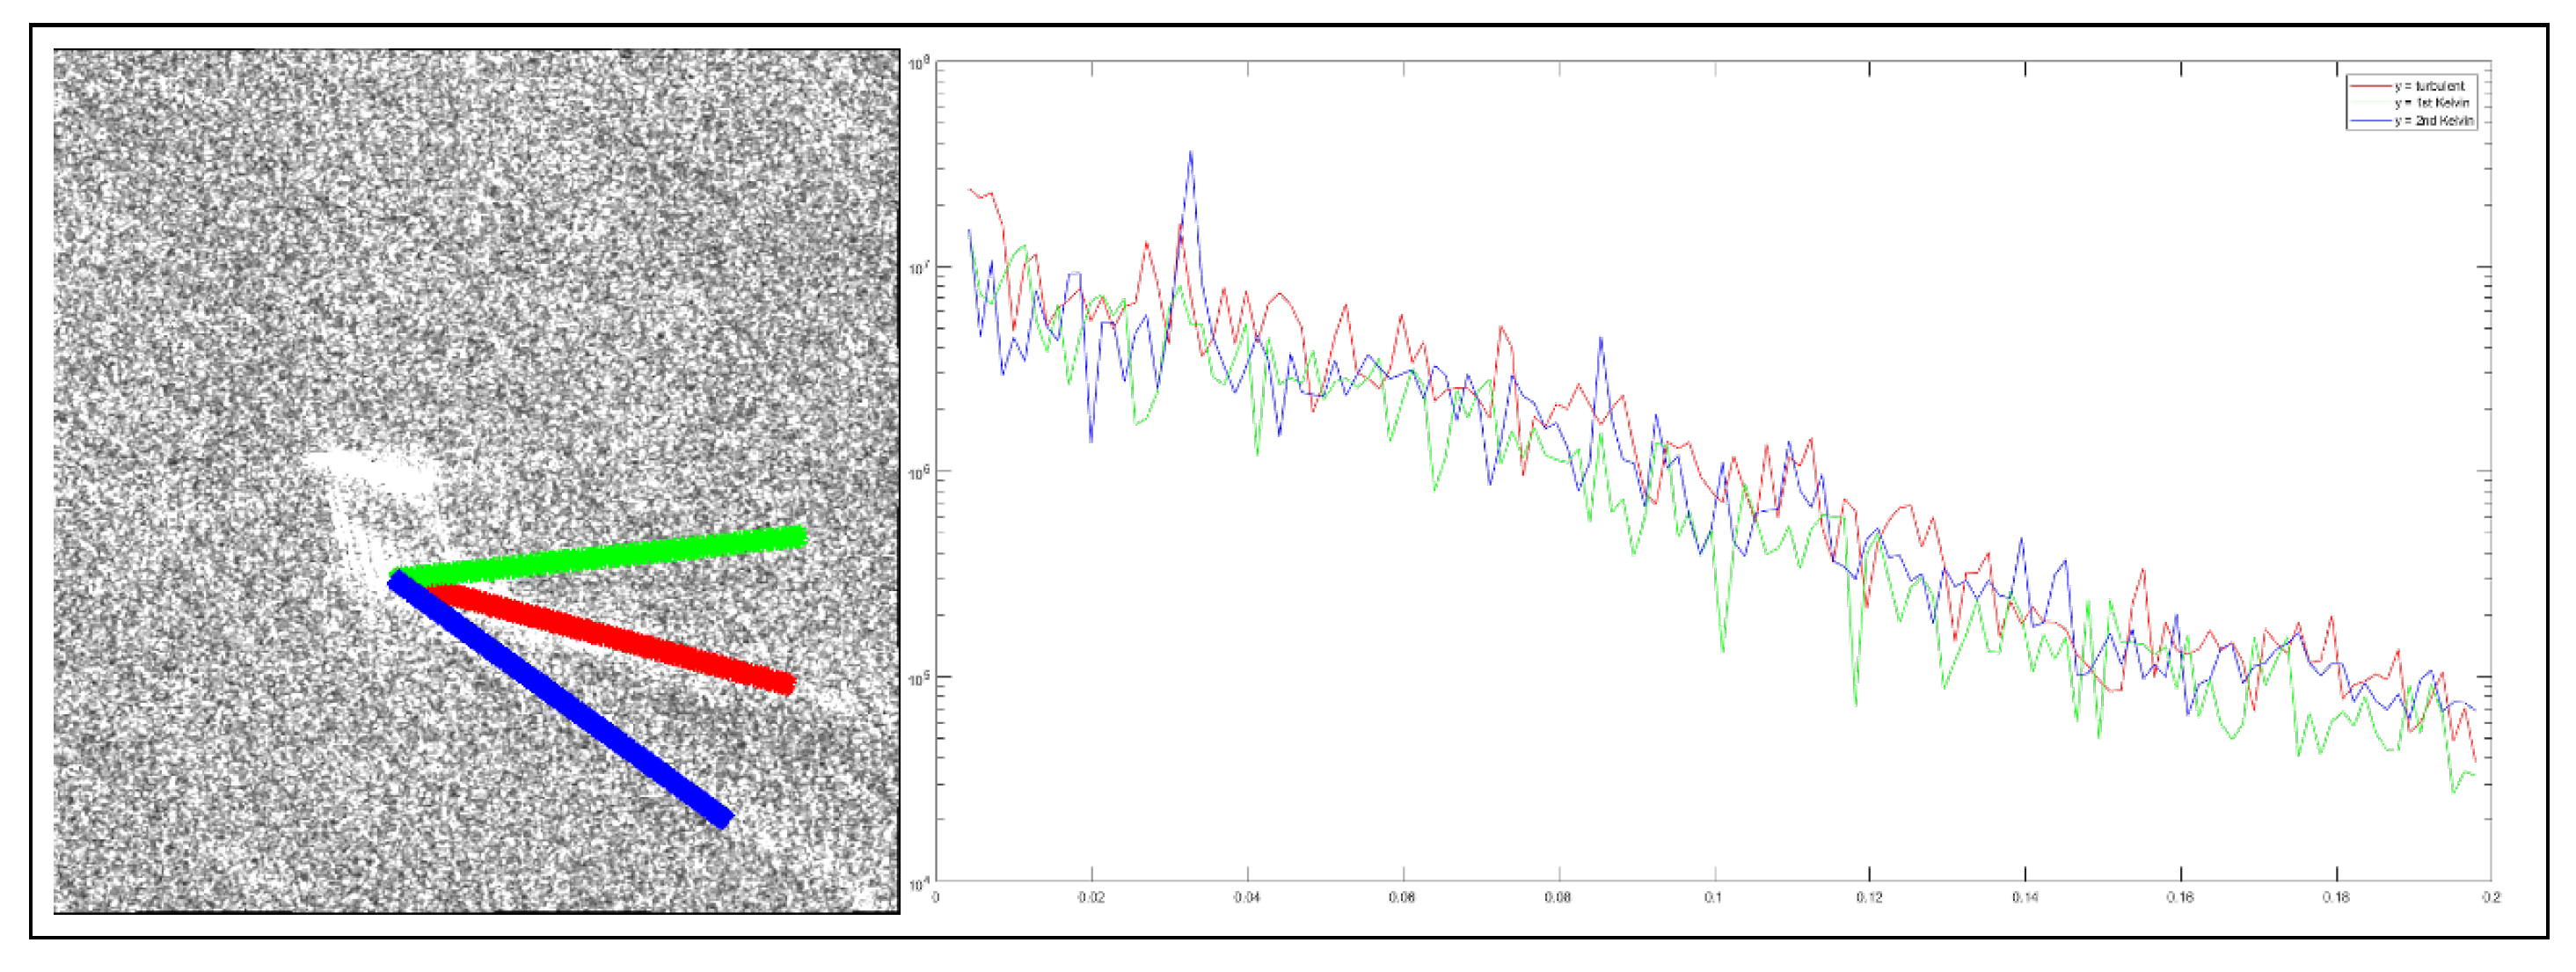
Table 1. Velocity estimates are provided according to the two implemented methods, i.e., the method exploiting the Azimuth shift (A.S.) and the one exploiting the spectral analysis on the external Kelvin wake (F.A.). Concerning the latter method, the Fourier analysis has been performed on three lines starting from the wake tip (
Figure 20, left side). The result of the Fourier analysis provided three periodogram curves (
Figure 20, right side). The blue curve clearly exhibits a peak corresponding to the wavelength of the periodical component.
As mentioned in
Section 1, Kelvin wakes are rarely observed in SAR data and they typically feature low SNR values. Nevertheless, when they are successfully detected, it is possible, provided that the signal resolution is sufficiently large, to perform accurate estimations (see
Table 1).
5. Conclusions
This document presents the implementation and the results related to a software procedure dedicated to the ship kinematics estimation task. This procedure takes as input remote sensing imagery and returns the estimated values of the vessel route and the vessel speed. This is primarily conceived to process radar imagery but can also be applied to optical data, provided some proper preliminary processing stages are introduced in order to enhance the wake pattern traces.
Wake patterns are hardly detectable in SAR maps, hence future developments will also be devoted to the refinement of the wake recognition process, based on the exploitation of additional information, such as the fine estimate of the vessel position as well as the constraints of this peculiar hydrodynamics problem, e.g., the theoretically expected wake angular aperture. A novel method for the detection of the wake has been introduced. Promising results (see
Figure 17) obtained by processing the dataset in
Figure 16 suggest that employing the proposed gradient-based approach may enhance the accuracy concerning the estimation of the wake motion’s related features (see charts in
Figure 18 and
Figure 19).
Taking inspiration from cutting edge literature of machine learning, novel prospects will also be devised, especially concerning the development of procedures for wake detection by means of neural networks based methods, also benefitting from the availability of large amounts of open access data (e.g., the ESA Copernicus Open Access Hub). For what concerns the estimation of the vessel’s speed, novel methods are currently being investigated to evaluate their potential in terms of kinematics information extraction. In particular, along-track-interferometry techniques represent interesting tools for the purpose of estimating the line-of-sight velocity value through the analysis of single-look-complex SAR data. Moreover, the Doppler centroid of the SAR signal varies according to the kinematics of the backscatterer. Estimating the variation between the Doppler centroid of a moving object w.r.t. a stationary one provides an additional velocity estimation method, which sounds worthy of being further studied.
The presented platform is being currently tested within the framework of the OSIRIS (Optical/SAR data and system Integration for Rush Identification of Ship models), an ESA project with the main goal of developing a platform dedicated to sea surveillance, capable of detecting and identifying illegal maritime traffic. The main goal of this platform is to detect and identify target vessels within a given sea surface area, which is remotely supervised by orbiting satellites such as Sentinel 1/2, CosmoSKy-Med and EROS missions. Radar and optical images represent the main input data for the platform described. These are processed by a suite of algorithms which are sequentially applied to the data returning information about (i) the ship positioning within the inspected area, (ii) the main ship geometrical attributes, such as length overall, beam overall and heading, and (iii) the ship kinematics status represented by its velocity vector. Future developments will also be devoted to improving the overall performance of the platform by enhancing the accuracy of each individual stage in the processing pipeline.
OSIRIS will represent a new tool for combating unauthorized fishing, irregular migration and related smuggling activities.


