1. Introduction
Skin makes up 15% of the human body’s weight and is considered as the most essential part of the human body. Skin acts as safeguard for all body components, as all body parts are beneath it, so any injury to the human body may first affect skin. Any injury to skin results in skin wounds. Skin wounds vary in size and type, which depends on the intensity and type of injury. Skin wounds are divided into two major categories, i.e., open wounds and closed wounds.
In closed wounds, tissues beneath the skin layer are not affected by injury; only the external skin layer is affected; while in open wounds, skin is affected by injuries such that tissues beneath the skin layer become visible and exposed to the outside atmosphere. Open wounds further are divided into four major types: abrasions, avulsions, lacerations and punctures.
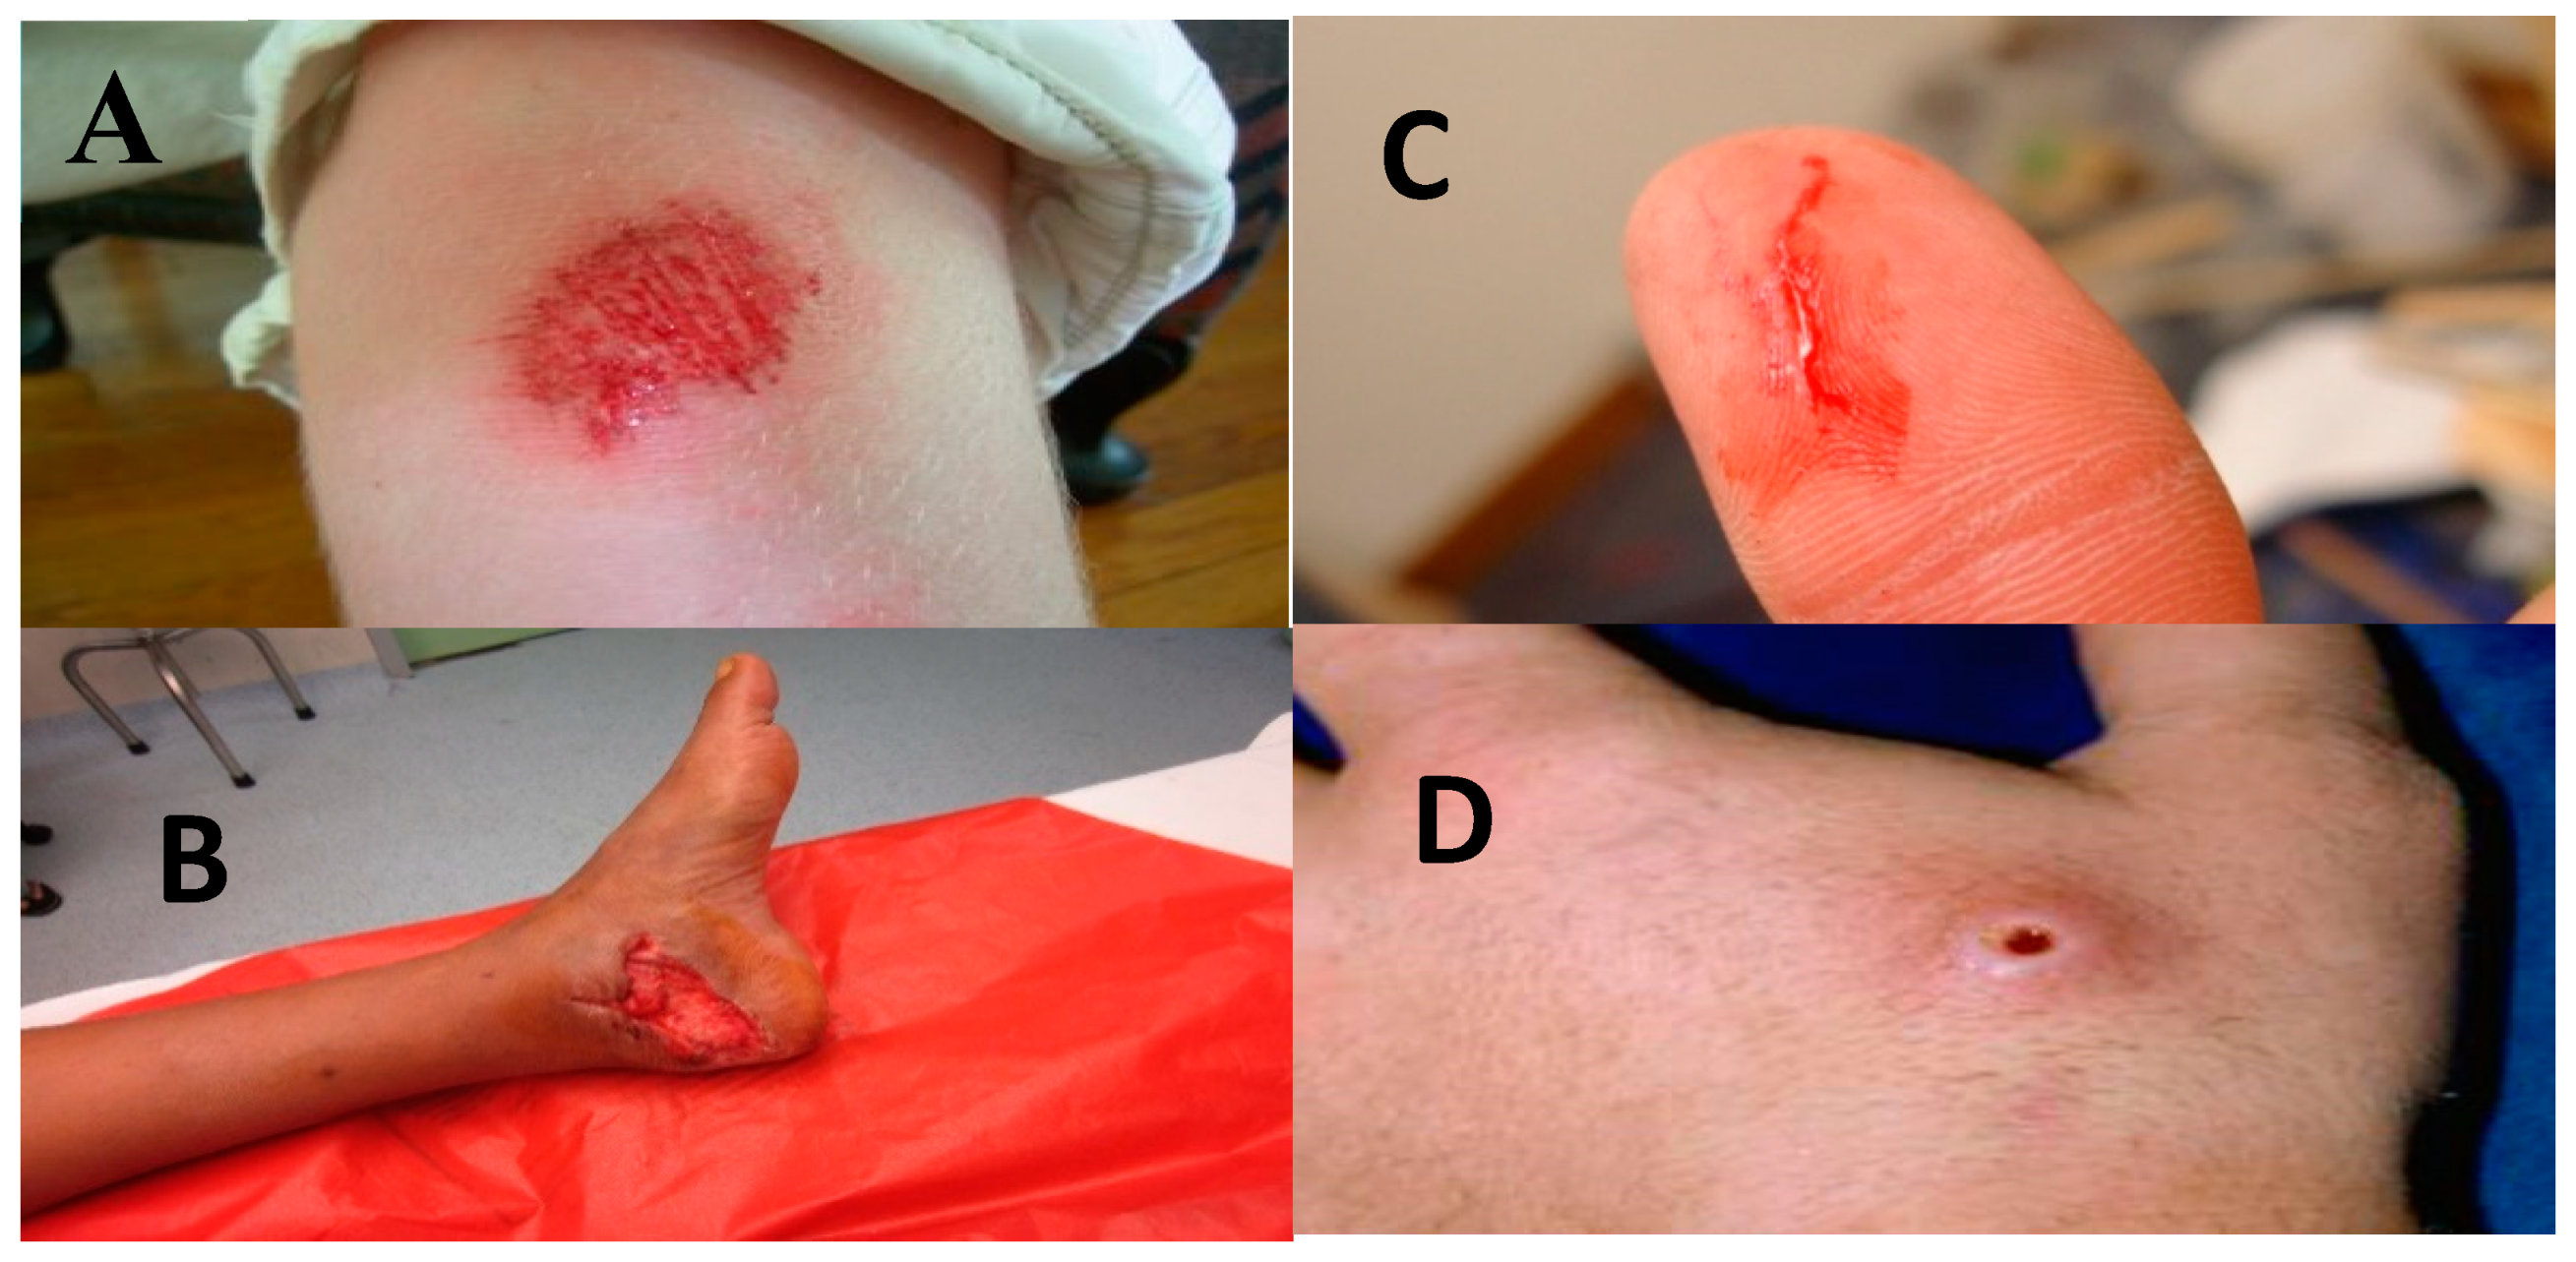
Open wounds that are deep in skin are called abrasions, which results from skin rubbing against a hard surface. They commonly do not bleed and are also known as scrapes. An avulsion is an open wound to skin due to severe injury to the human body such as a car accident or gunshot. As a result, skin tears away, and underlying tissues are exposed to the external environment. This wound results in excessive bleeding. Skin cuts caused by sharp objects like knives cause deep skin tears known as lacerations. They may bleed more if the cut is deep in skin. Skin holes, which appear after contact with a sharp pointy object, as known as punctures. They may bleed sometimes, but not always. All types of open skin wounds are shown in
Figure 1, given by [
1].
There are different factors that may complicate or delay the wound healing process. These factors are of two types, local and systemic. Local factors directly affect wounds, while systemic factors are concerns about the patient’s health state [
2]. Local factors include infection or abnormal bacterial presence as environmental conditions, while systemic factors include trauma, age, stress, nutrition, obesity, repeated trauma, skin moisture, chronic conditions and medication. The term environment comprises many parameters to measure, i.e., temperature, humidity and air quality (concentration of gases, smoke and dust particles). Other factors that may delay/complicate wound healing are regional factors and other miscellaneous factors such as exposure to radiation and smoking [
3].
IoT provides more flexible and low-cost solutions for daily life problems, which ultimately improve the user’s life [
4,
5]. Although many previous researchers proposed air quality sensing systems by using different sensor combinations [
6,
7,
8,
9,
10,
11,
12,
13], as shown in
Table 1, with the detailed description of previous studies provided, we may conclude that there are three reasons for the motivation to design an efficient wound monitoring system.
Previously-proposed air quality sensing systems focused on air gases’ measurement for monitoring of air quality rather than considering other environment components, e.g., moisture, temperature, etc.
Previously-proposed air quality systems used expensive sensor arrays for monitoring air quality.
Previously-proposed air quality sensing systems did not consider the design goals from the clinical perspective of the environment’s role in wound healing.
Previous studies did not implement data mining techniques to investigate the exterior environment for wound healing.
Previously-proposed air quality monitoring systems were only available locally.
In order to assure wound healing continues in a normal fashion, it is necessary to check all important parameters that may complicate/delay the healing, one of which is the external wound environment. Traditionally, external environment factors, i.e., temperature, humidity, air dust, etc., did not receive much attention from physicians and medical experts to monitor wound healing; they generally ask patients to ensure normal environment conditions for faster recovery of the wound. Mostly, patients at their home are not concerned with checking the air temperature, humidity and other factors to ensure the environmental factors are in favour of healthy wound healing, as there is not a simple and inexpensive solution to check and analyse all environmental factors at once. Although there are many types of pollution measurement equipment available, they have two major issues: they are expensive and present only local information, as they are in fixed locations [
14]. Therefore, we provide an effective wound care solution by undertaking the following objectives.
The proposed solution is designed to provide a simple solution for wound monitoring, which motivates patients to track wound healing easily at their home.
The proposed solution can measure the environment by low-cost sensing devices and a microcontroller, which ultimately offer patients a very feasible and inexpensive wound care solution.
The proposed solution is designed to facilitate clinical practice, as with the help of the proposed solution, doctors can control impaired wound healing as a result of bad environmental conditions and could improve the wound healing rate.
The proposed solution also helps physicians in the maintenance of a healthy environment in the hospital with continuous monitoring of the environmental conditions for wounded patients. This facility may guarantee speedy recovery of wounded patients.
The proposed solution provides an intelligent decision making technique to check environment feasibility based on standard rules, rather than ambiguous predictions made by patients.
Our proposed system consists of an air quality sensing system to record real-time environmental values and an SVM classifier to classify the real-time environment into favourable or unfavourable classes. Experiments show that the Air Quality Sensing System (AQSS) reads and records current environmental values which, can further be correctly classified by SVM in MATLAB, as shown in
Figure 2 of the block diagram of the proposed approach.
The rest of the paper is structured as follows:
Section 2 discusses the clinical and technological concepts and methods for analysing the effect of wound healing factors, the SVM classifier-based analysis systems carried out during the research and the related work;
Section 3 describes the theatrical basis of the proposed system along with the materials and methods of the presented research for the SVM system used for the proposed air quality sensing system;
Section 4 provides the details of the experiments, their results and a discussions to show the performance during testing and the outcomes of the presented approach;
Section 5 presents the conclusion of the research presented.
2. Related Work
In this section, we discuss related research work that has been done in the area of skin wound healing, data mining, and air quality sensing. This section is further divided in two subsections. In the first section, we provide a brief description of previously-done research in
Table 1, to highlight previous research work’s key features and current research goals, while in the second section, we discuss different technological approaches of previous research in the area of wound healing, data mining and sensing devices.
2.1. Features and Limitations of Previous Research
Zampolli et al. [
6] proposed an electronic nose by using a sensor array for the detection of indoor air quality. Their proposed system sensed CO
2 and NO
2. They proposed the system to be integrated with indoor climate control units, which ultimately control the air quality of the indoor environment and facilitate home users.
Kavi et al. [
7] proposed wireless sensors based on an air quality monitoring system in Mauritius. Their system recorded real-time environmental values and used the air quality index to categorize air quality. They proposed a system to measure the air quality of the country and facilitate the government to categorize the air quality of the country by comparing real-time environmental values with the standard air quality index. They used different colours to indicate air quality categories, which made the system very user friendly.
Kinkeldei et al. [
8] proposed an air quality monitoring system for textiles. Their proposed system used two sensors for the measurement of humidity and temperature, i.e., flexible polyimide substrates containing a gold Resistance Temperature Detector (RTDs) and a conductive polymer (PEDOT-PSS) humidity sensor. The sensor was woven into a textile using a commercial band weaving machine.
Abdelghani Benharref et al. [
9] proposed a biosensor-based healthcare framework for monitoring chronic diseases of patients. The proposed system used a service-oriented architecture and wireless body sensors along with cloud environments. They assigned each patient a set of sensors depending on his/her chronic disease(s). The system consisted of a mobile app. The proposed system took readings of health parameters by sensors and automatically communicated these to the mobile application. The mobile app communicated with healthcare personnel (e.g., physician, nurse and nutritionist) for advice if necessary.
Maradugu Anil Kumar et al. [
10] proposed an Android-based system for health monitoring. They proposed an approach to monitor patient biological parameters such as heart rate, blood oxygen and temperature with the help of a web server and Android app. Their proposed approach was beneficial for patient health monitoring as doctors did not need to be present physically, and patient health history was stored on a web server as well.
Cecilia Occhiuzzi [
11] proposed a wound monitoring and healing approach by integration of an RFID sensor tag in a hydrogel bandage. Their proposed approach provided an effective way to monitor the wound, as the integrated sensor was highly sensitive to fluid, which either changed or was absorbed. Their proposed approach provided a better reading range by a temperature microchip embedded in the tag. This enabled reading temperature and fluid by a hand-held device. Their proposed approach facilitated a smart bandage preparation, which helped to observe wound healing.
Rahim Rahimi [
12] proposed a wound assessment approach based on a pH sensor array. The work discussed how the pH level is a key indicator for the assessment of wound healing in a chronic wound bed; therefore, an approach for the measurement of pH level by a low cost pH sensor array was presented, which was placed on palette paper. The proposed sensor array showed a linear potential of 0.9734 in buffer solutions of pH in the range of 4–10 and a sensitivity of 50 mV/pH, which matched with the target level, so the approach could be integrated in a wound dressing to detect pH.
Sohini Roy Choudhury et al. [
13] designed wearable device to monitor wound healing with the help of a uric acid biosensor. Their proposed device detected Uric Acid (UA) from the wound. UA is a biomarker that has a strong correlation with wounds and their healing. They used a redox electron shuttle, Ferrocene Carboxylic Acid (FCA), which allowed the transfer of electrons between the enzyme and the transducer. For uric acid detection in wound fluid, they used a wound fluid volume range of 0.5–50 μL. Their case studies from different wound samples showed an average recovery of 107%.
2.2. Related Approaches
Tor Svensjo et al. [
14] studied the wound repair process influenced by many factors. They did experiments to investigate the effect of hydration on contraction, granulation tissue thickness, and epithelial thickness. During the treatment process, they studied the influence of different environmental conditions on these parameters, and they found that a wet environment encouraged fast wound healing the most.
S. M. Riaz ul Islami et al. [
15] did a comprehensive survey on IoT applications in the healthcare domain. In their paper, they studied IoT application domains, including healthcare. Improvement in IoT provides the growth of technological, economic and social prospects of healthcare. Their paper studied advances in IoT-based healthcare technologies. They provided reviews about state-of-the-art network architectures/platforms, applications and industrial trends in IoT-based healthcare solutions. They proposed a security model that minimized security risk. They discussed the effect that big data innovations, ambient intelligence and wearables can have in a healthcare context.
Riyadh Arridha et al. [
16] did research on classification extension for environment monitoring based on big data analytics. They proposed a method to integrate big data technology with the water monitoring system for real-time analysis. They engaged in the ongoing project named SEMAR (Smart Environment Monitoring and Analytics in Real-time system) to provide an IoT-big data platform for water monitoring. In their proposed solution, they designed an extension of SEMAR for water quality classification based on the pollution index method. In their system, they used the updated communication protocol MQTT. Then, they implemented a real time-user interface for visualization. Their results showed that the linear SVM and decision tree algorithms provided 90% accuracy with 0.019075 for the MSE.
Emmanuel Agu et al. [
17] studied the benefits and challenges of smartphone applications as a medical device. Smart phones are composed of multi-core CPUs and GPUs, megapixel cameras and an array of sensors. Currently, smartphone sensors can be configured for the diagnosis of different medical conditions such as cough detection, irregular heartbeat detection and lung function analysis. These smart phone applications enable the patient to detect these medical conditions early, and this reduces the healthcare costs. In their paper, they provided state-of-the-art examples and studied the technical issues of smart phone usage as a medical device. They also highlighted the benefits and challenges of smartphone usage for medical assistance. In addition, they presented an Android smartphone app for wound detection and healing for diabetic patients.
Shoffi Izza Sabilla et al. [
18] proposed an approach to find a suitable gas sensor by using the slope deflection method. They used an E-nose to obtain the concentration of gases in air with the MQ (Mingan Qi-Lai) family of sensors and then used an artificial neural network to estimate gases’ concentration. Their results showed that ANN provided a good ratio to achieve higher performance of the E-nose.
Andrei-Stelian Bejana et al. [
19] did an experiment to design an energy-efficient building with low energy consumption and a low effect on the environment. They proposed a system to measure the indoor environment factors, i.e., temperature, CO
2 and relative humidity levels, during one winter month (February) and also to correlate the results with the energy consumption. From their experiment, they concluded that the indoor parameters, in their case study of the EFdeN project (
https://efden.org/), were achieved with minimum energy consumption during the winter period, and this case study represented a model of a sustainable building that could be widely implemented.
3. Materials and Methods
In this section, we give a detailed description of the proposed system. We first discuss theoretical the background of the proposed system, which provides a basis for the design of AQSS and implementing it with a linear SVM classifier.
3.1. Relational Constructs Used
The proposed system was designed to identify the real-time environmental measurement feasibility level for wound healing, as there are many environmental factors, but in our proposed system, we focused on temperature, humidity, air dust and air quality. After studying the effect of each component on wound healing, we drew the basic relational construct for each environmental factor for wound healing to justify the significance of the proposed system in clinical aspects.
There are many environmental factors that can delay or boost the normal healing process. In fact, environmental factors affect skin conditions, which ultimately delay/boost wound healing. Skin factors that contribute to wound healing are: skin moisture level and body oxygen level.
It has been observed that open skin wounds such as lacerations, abrasions, crush injuries and burns heal faster when treatment involves promoting a moist wound bed. Researcher have studied the “comparison of the effects of moist and dry conditions” and concluded that wounds heal faster under moist conditions because inflammatory and proliferative phases are accelerated in moist conditions and slow under dry conditions [
20]. Specifically, cell growth needs moisture, and the main goal of moist wound therapy is to create and maintain these optimal moist conditions. Cells can grow, divide and migrate at an increased rate to enhance the formation of new tissue. During this phase of wound healing, an aqueous medium with several nutrients and vitamins is essential for cell metabolism and growth. We depict the relationship of open skin wound healing and environmental factors in Equations (1)–(3).
where:
WH = Wound Healing
E
F = Environmental Factors
T = Temperature
H = Humidity level
Smoke = air smoke
GC = Gas Concentration
DP = Dust Particles
In Equation (1), we draw the relationship between wound healing and environmental factors. Equation (2) shows that the term environmental factors is a union of temperature, humidity level and air quality, while Equation (3) shows that air quality is a union of smoke, gasses and dust articles in the air.
3.1.1. Measuring Temperature
Temperature plays a vital role in skin wound healing. The human body’s normal temperature is the most suitable temperature for fast wound healing, i.e., 37 °C (98.6 °F). This temperature is best for human body cells and enzymes. If wound temperature drops even by 2 °C, the healing process can slow down or even stop. Therefore, if environmental temperature is higher than the normal range, it causes sweating, and as a result, skin loses its moisture and its temperature drops. Therefore, we draw the relationship between temperature and skin moisture in Equation (4).
where:
T = temperature
SM = Skin Moisture
Our proposed approach used Equation (4) for building the working rules shown in
Section 3.4, which was further implemented with SVM for classification.
3.1.2. Measuring Humidity
Environmental humidity has effects on temperature. If there is more humidity in the air, then a high temperature feels greater, e.g., if the temperature is 90°, it will feel like 90° in the presence of 30% humidity, but if the humidity is up to 65%, then a 90° temperature feels like 112°. This rise in feeling of temperature provokes the body to maintain body temperature by sweating, which ultimately cools down the body, and skin loses its moisture; therefore, the temperature of skin tissues drops.
The humidity level in the air also has a relationship with the skin moisture level, i.e., in the presence of less humidity in the air, water in the skin can be drawn out of the skin’s surface into the air, which ultimately dries out the skin’s outermost layer, called the epidermis; while, if the humidity level in air is high, the skin moisture level is sustained as the body uses its own natural moisturizing factors and absorbs water from the atmosphere to keep it hydrated. We depicted relationship between temperature and humidity is given Equations (5) and (6):
where:
H = Humidity
TF = Temperature Feel
SM = Skin Moisture
Equation (5) shows that humidity is directly proportional to the way the temperature feels, while Equation (6) shows the inverse proportionality between the way temperature feels and skin moisture.
Our proposed system used Equation (6) to design working rules, given in
Section 3.4, which were further used for the implementation of the SVM classifier.
3.1.3. Measuring Air Quality
Air quality is a combination of different elements, i.e., smoke, gases and dust particles. Mostly, the air quality of commercial buildings and public places is not so good: air in these places is mostly contaminated with harmful gases such as carbon dioxide (CO
2), carbon monoxide (CO), nitrogen dioxide (NO
2), ozone (O
3), and formaldehyde (CH
2O), and even bacteria. All these gases can negatively affect wound healing [
21]. Different indoor environments are also polluted with harmful pollutants, which may damage skin [
22].
The environment may contain smoke either coming from smoking, burning waste material or from production houses. This smoke can badly affect the wound healing process. Smoke prohibits the body from winning the battle against infections, as smoke chemicals cause respiratory problems, which ultimately reduce the tendency of skin tissues to absorb oxygen [
2].
An adequate amount of oxygen level in the body is very necessary for normal wound healing. The major source of oxygen is air. When humans take oxygen from the air, it passes from the blood and reaches the wound site, so the wound gets enough strength to fight infections for a smooth and fast recovery of the affected skin tissues. We represent the relationship of smoke and open skin wound healing by Equations (7) and (8).
where:
Ob = Oxygen in the body
We used Equation (7) to show that oxygen in the body is inversely proportional to infection, and Equation (8) shows the inverse proportional relation between smoke and oxygen in the body. We measured the air quality rule, i.e., air having more positive gases, i.e., oxygen is more favourable for skin wound healing, while the presence of negative constituents like smoke can disturb the normal level of positive gases, as shown in Equation (8).
3.1.4. Measuring Dust Particles
Air contains dust particles in which bacteria also exist, so with more dust particles in the air, there are more chances for bacteria to be within it. Skin wound infection usually occurs due to the presence and growth of bacteria on the wound site [
23]. Moreover, recently, epidemiological and mechanistic studies showed that air pollution negatively affects skin [
24]. These infections can delay the wound healing process as they negatively affect the immune system. Infection causes inflammation and tissue damage on the wound site, which ultimately delays the healing process. This effect is represented in Equation (9).
where:
D = Dust
M = Microbes
B = Bacteria.
Equation (9) shows that dust is directly proportional to the microbes’ union bacteria.
3.2. Proposed Methodology
The proposed wound monitoring system is designed with the capacity for intelligent classification of the environment on the basis of considering factors like air quality, humidity, temperature and dust particles. An intelligent air quality sensing system handles the effective utilization of sensors to ensure efficient sensing of current environmental factors.
The proposed approach specifically monitors wound healing by classifying the environment as feasible or not feasible with the proposed SVM classifier. The proposed approach is divided into two major systems, i.e., a sensor-based system named AQSS for data collection and an SVM classifier for data analysis, and mobile app for the display of the output. The proposed approach of environment classification for wound monitoring is broken up into the following steps.
Collecting the dataset from different environments by reading environmental factors, i.e., temperature, humidity, air quality and dust particles, by using the Air Quality Sensing System (AQSS) based on Arduino sensors.
Recording the obtained readings of AQSS in an Excel datasheet for further analysis.
Defining standard working rules for the SVM classifier, from the derived equations of the environmental factors’ relationship with wound healing, as referenced in
Section 3.1.
Designing the SVM classifier for the classification of environmental factors by training on a standard input dataset designed by using defined standard rules, as given in
Section 3.4.
Testing of the trained SVM classifier to get environment classes.
Analysis of the obtained SVM class to validate the trained SVM classifier.
Displaying the output, i.e., obtaining the class of the environment using the Android app.
Our proposed approach for wound monitoring is comprised of 4 major working phases, as shown in
Figure 3.
3.3. Hardware Used
Although there are many types of pollution measurement equipment available, they have two major issues: they are expensive and are present only locally as they are in fixed locations [
25]. Therefore, in our proposed approach, we designed an inexpensive and portable AQSS.
In order to read the values of observed environmental factors, i.e., humidity, temperature, air quality and dust particles, we designed an air quality sensing system composed of the following components.
DHT11 humidity and temperature sensor (See
Figure A2)
The features of all hardware components along with the corresponding configuration details are given in
Appendix A.
Design and Configuration of the AQSS Circuit
To measure the environmental factors, we built a circuit consisting of the abovementioned components. The interface and working of the circuit are shown in
Figure 4, and the circuit configuration is described in
Table 2.
We used this circuit to read and record the values of humidity and temperature with the DHT11 sensor attached, the values of the gases’ concentration using the MQ135 attached and the density of dust in the air with optical dust sensor attached. The proposed circuit used standard ranges of temperature, humidity, air pollutants and dust particles, as given in
Table 3,
Table 4,
Table 5 and
Table 6, respectively.
All input values were directly read in Excel with the help of PLX-DAQ, and we did the experiment in different indoor and outdoor environment setups to obtain a dataset having environmental factor values of diverse environments. On the basis of the extracted relationship of environmental factors and the skin wound healing process, we defined some standard rules to classify the environment either as “favourable “or “unfavourable”.
3.4. Working Rules for SVM Used
In our proposed system, we recorded environmental factor values with the proposed AQSS, then we needed some standard working rules to compare these values, in order to design the SVM classifier. We built working rules for the classifier, shown in
Table 7. We provided these working rules for the “favourable” environment type of each open skin wound type by analysing the relationship between the environment factors discussed in
Section 3.1 and the standard values of temperature, humidity, air pollutants and dust particles given in
Table 3,
Table 4,
Table 5 and
Table 6 respectively.
3.5. SVM Classifier Used
To facilitate the patient in the suggestion of a suitable environment for faster wound healing, we needed to classify the environment based on different factor readings obtained by AQSS. To do so, we used the linear SVM classifier. In recent years, many research applications have used machine learning classification techniques to obtain solutions in the medical domain. Most of these applications designed classifiers that could separate instance classes based on input attributes measured in each instance. The purpose of these applications is to analyse medical data and detect or diagnose disease [
26].
There are many classification techniques that can be applied on data to analyse output, e.g., naive Bayes classifiers, decision tress, KNN, NN, etc.
In our proposed approach, we chose SVM for the classification decision because of the following three reasons:
SVM is a suitable choice when data have clearly two distinct output classes, as in our proposed system that needs to classify the environment into one of two classes: either favourable or unfavourable.
SVM finds the best hyperplanes to classify the data points of one class from the data points of another class, by using its kernel functions. Different variations of the kernel function can handle linear, as well as nonlinear datasets.
When SVM classifies data with the resultant hyperplane having the maximum margin between the data points of the two classes, it will be considered as the best hyperplane. Although other classifiers can also separate the data points of one class from the data points of another class, their generated hyperplane does not achieve the maximum margin [
27].
Mathematically, the SVM hyperplane and max hyperplane are described by Equations (10) and (11), given by [
28]. The input is the training dataset having n data points:
where
, and the value of
y represents the class to which the data points
belong.
To obtain maximum margin hyperplane given concept used by SVM.
In the current problem, X = the input dataset, which consisted of sensor readings obtained by the AQSS system. It contains the values of temperature, humidity, air quality and dust particles. The output of the problem defined is the environment classes according to the AQSS reading, either “favourable” or “unfavourable”. The output is represented by Y.
Y = 0 to denote an unfavourable environment
Y = 1 to denote a favourable environment
4. Implementation of AQSS and the Linear SVM Classifier
To validate the working of the proposed model, we designed an experimental setup for the proposed AQSS and the linear SVM classifier of MATLAB. To predict the environment class successfully, we executed the given steps discussed in this section and depicted in
Figure 5.
The SVM classifier first needed the standard input dataset, which means all possible input data values with some pre-labelled class values, so that the SVM classifier could train on that dataset and further use it to predict the outcome of incoming data values. We did this by designing a standard dataset of labelled classes, which was prepared by using the rules mentioned in
Section 3.4. After training the SVM classifier, the next step was to export that training model to the MATLAB workspace for further use. Next, we used the proposed AQSS to read real-time environmental factor values in different indoor and outdoor environment setups and recorded these input datasets in an MS-Excel sheet. The trained model of SVM provided the output classes predicted.
4.1. Training Dataset Used
We took the training dataset at different time intervals by AQSS and used this dataset to train the SVM for future use. We collected 500 instances of the training dataset by AQSS. The design of the training dataset is given in
Table 8.
We did the labelling of the trained dataset by applying the rules given in
Table 6. We followed the steps below to prepare the labelled training data.
4.2. Training SVM
We designed the SVM classifier in MATLAB by using the following steps, shown in
Figure 6.
First, we opened the trained dataset in MATLAB.
We created a training dataset variable in the workspace by using the following commands.
Training data = read table (‘TrainingData.xlsx’);
Next, we opened the classification learner app and designed the SVM model after doing the required configuration, i.e., each parameter range depends on its stored values; for humidity, we provided a range from 20–164, for temperature 0–111, air quality 100–203 and dust particles 0.1–94.62. We set this range after carefully observing the break points of rules. We set Temperature, humidity, air quality and dust particles as predictors and environment type as the response.
Next, we trained the classifier on training dataset. The model was trained with an 87.2% accuracy rate.
After training, we exported the model in the workspace to use for the unlabelled input dataset obtained from the real-time reading of AQSS.
We opened the test dataset in MATLAB, which we recorded with our proposed AQSS.
We used the trained SVM to predict the environment type of the test dataset. We used the following commands to get the results of the predicted classes from the trained SVM.
yfit = predict(trainedClassifier, TestData{1:10,trainedClassifier.PredictorNames})
The yfit function took the trained SVM classifier’s name, the dataset name, the range of rows for which values of the unknown label were need to predict and the parameter of the predictor name as the input.
5. Results and Discussion
We did the experiment on three different datasets obtained by taking environment readings thorough AQSS in three different environment setups, i.e., indoors, outdoors and industrial area, to verify the working of the trained SVM.
5.1. Evaluation of the Trained SVM Classifier
We used the SVM classifier to predict environment type. The SVM has the capability to handle larger dataset values of approximately 2500 vectors, as presented by other researchers [
29]. Although Support Vector Machines (SVMs) are very accurate modern classifiers that deliver up-to-the-mark performance in pattern recognition problems of real-world scenarios, are also preferred in data mining applications such as text categorization, hand-written character recognition, image classification and bioinformatics and they generate very accurate solutions, they are not preferred in online applications where classification has to be done on a large number of vectors that require a high speed [
30].
The SVM model trained on the provided standard training dataset showed an 87.2% accuracy and a 12.8% error rate, as shown in
Figure 7. We obtained different plots that depicted the trained SVM classifier’s characteristics more precisely. We chose different parameters on the
X-axis and
Y-axis to view the change of the hyperplane of the trained SVM classifier.
In
Figure 8, a scatter plot is drawn between temperature and humidity. The red line shows that unfavourable classes were correctly classified, and the green line shows that favourable classes were correctly classified. The hyperplane shows the wider separation for temperature values of 18–23 and a humidity range of 20–50. In
Figure 9, the scatter plot is drawn between air quality and humidity in which the “favourable” class value is present in the humidity range between 20 and 60 and an air quality range of 100–120. In
Figure 10, the scatter plot shows the relationship between dust particles and humidity in which the “favourable” class values are shown for a humidity range of 0–70 and a dust particle range of 0–10.
Figure 11 shows the relationship between dust particles and air quality where the “favourable” class exists in an air quality range of 100–1200 and a dust particle range of 0–1.
The ROC curve of our proposed trained SVM classifier using the linear kernel function is shown in
Figure 12. The ROC showed a true positive rate of the trained SVM on the—axis and false positive on the
X-axis. The linear SVM classifier ROC showed an AUC = 0.930. The confusion matrix of the trained SVM classifier is shown in
Figure 13. The confusion matrix shows the % of correctly predicted classes and wrongly predicted classes. The matrix value showing the total predicted “favourable” classes was 89, out of which one class was truly unfavourable and wrongly predicted to be favourable, while the total unfavourable classes were 145, out of which 116 were predicted correctly, and 29 were truly favourable, but predicted to be unfavourable. By the given confusion matrix of the accuracy and error rate for both classes, prediction could be measured with the help of the formulae given in Equations (12) and (13).
Accuracy rate for favourable class prediction = 88/89 × 100 = 98%
Accuracy rate for unfavourable class prediction = 116/145 × 100 = 80%
Error rate for favourable class prediction = 1/89 × 100 = 1.122%
Error rate for unfavourable class prediction = 29/145 × 100 = 20%
5.2. Experiment Results of Classification
We used the trained SVM classifier to predict the environment type of three different datasets obtained by reading real-time environment values by AQSS in three different environment setups, i.e., indoors, outdoors and industrial area, as shown in
Table 9. The results obtained from the SVM classifier are given below in
Table 10. We used the statistical measures of precision, recall and accuracy to evaluate the performance of the trained SVM classifier. The evaluation parameters are given in
Figure 14; by using these, we drew the formulas for precision, recall and accuracy given below.
True Favourable (TF): SVM classifier predicted the real favourable class as favourable.
False Favourable (FF): SVM classifier predicted the real unfavourable class as favourable.
True Unfavourable (TUF): SVM classifier predicted the real unfavourable class as unfavourable.
False Unfavourable (FUF): SVM classifier predicted the real favourable class as unfavourable.
The SVM prediction results for three different datasets taken from indoors, a hospital and an industrial area are shown in
Figure 15, showing that the indoor environment had a high precision and accuracy rate compared to the other two environments. SVM predicted more favourable classes for the dataset for indoors with a 99% accuracy rate, as indoor environments have a suitable atmosphere for skin wound healing, while outdoor environments like hospitals have a lesser value for the favourable class, with an accuracy rate of 96%. The third dataset for the industrial area had a greater value for the unfavourable class, so SVM showed less precision of 92% and an accuracy rate of 96% as shown in
Figure 15.
5.3. Complexity of the Proposed System
Complexity measurement means the calculation of the time and memory requirement of the proposed system. According to our proposed system design, there was no big data store directly involved; therefore, only one complexity parameter affected the quality of the proposed system, i.e., the system response time, which depended on the sensors. The system response time depends on the sensor delay time interval. The delay time interval is set to create a gap between two readings; the larger the gap, the more time sensors require to complete a predefined number of readings, which ultimately increased the system response time. We set the standard delay time interval of 30 s to take two readings in a minute and maximum of 120 readings in an hour.
5.4. Quality of Experience for the Proposed System
The quality of experience facilitates improving the reliability of systems by checking users’ experiences with the system. By using QoX (Quality of Experience), different parameters necessary to evaluate the proposed system’s performance could be measured, e.g., privacy, service cost, delay, etc. [
31]. In order to ensure the quality of the proposed system, we focused on checking the quality of the experience of patients in monitoring wound healing at their site. We considered four important parameters to verify the quality of the proposed system, i.e., interface flexibility, response time, accuracy rate and portability. We did experiments with users of different ages and obtained the results given in
Table 11.
5.5. Limitations of the Proposed System
The proposed wound monitoring system was designed to check the current environment feasibility level, and it was very effective for this purpose. The limitations of proposed solution are described in
Table 12.
There are many machine learning classification algorithms, e.g., SVM, neural network, decision trees, KNN, linear regression etc. Neural network and SVM are more popular for solving classification problems. In our proposed wound monitoring system, we used SVM classification; the characteristics of the proposed SVM in comparison with other machine learning techniques are described in
Table 13.
6. Conclusions and Future Work
The proposed model provided a simple solution to monitor current environment feasibility for open skin wound healing. The given model has two components, i.e., AQSS and SVM classifier. We used AQSS to record the current environment readings with the help of an Arduino UNO-based circuit connected to three sensors, DHT11, MQ135 and optical dust. We programmed the Arduino Controller to record the temperature, humidity, air quality and dust particles from the environment and recorded the values in Excel. The next component of the presented model used the SVM classifier of MATLAB, which took the designed standard training dataset to train and then further used this trained SVM to predict the environment feasibility of the dataset, which were taking real-time environment readings by AQSS.
Two major components, AQSS and SVM, showed good quality of experience results for the user, i.e., around 80–90%. The trained SVM showed an 87% accuracy rate on the provided training dataset, and from the experiment results, we concluded that our proposed system could predict the environment type with an approximately 80–90% accuracy rate for the indoors, outdoors and an industrial area. Therefore, our proposed solution can easily predict environment feasibility based on current environment factor values, which ultimately help the patient to predict the current environment’s suitability for open skin wound healing. If the environment is not favourable enough to heal the wound faster, then the patient can take precautions to adjust the environment factors or he/she may change place to avoid unfavourable environmental conditions.
We implemented the proposed approach by using linear SVM classification. In the future, the current problem could be implemented by using other classification techniques, i.e., neural network, KNN, decision tress, fuzzy system, DBSCAN, random forest, etc. Additionally, the current approach can be reproduced by selecting more features from the environment to monitor wound healing.


