Article

A Rapid Recognition Method for Electronic Components Based on the Improved YOLO-V3 Network

School of Mechanical Engineering, Jiangsu University, Zhenjiang 212000, China
*
Authors to whom correspondence should be addressed.
Electronics 2019, 8(8), 825; https://doi.org/10.3390/electronics8080825
Submission received: 26 June 2019 / Revised: 20 July 2019 / Accepted: 22 July 2019 / Published: 25 July 2019
(This article belongs to the Special Issue Deep Neural Networks and Their Applications)

Abstract

:
Rapid object recognition in the industrial field is the key to intelligent manufacturing. The research on fast recognition methods based on deep learning was the focus of researchers in recent years, but the balance between detection speed and accuracy was not well solved. In this paper, a fast recognition method for electronic components in a complex background is presented. Firstly, we built the image dataset, including image acquisition, image augmentation, and image labeling. Secondly, a fast recognition method based on deep learning was proposed. The balance between detection accuracy and detection speed was solved through the lightweight improvement of YOLO (You Only Look Once)-V3 network model. Finally, the experiment was completed, and the proposed method was compared with several popular detection methods. The results showed that the accuracy reached 95.21% and the speed was 0.0794 s, which proved the superiority of this method for electronic component detection.

1. Introduction

Based on the environment of “Made in China 2025”, intelligent manufacturing became one of the key development fields [1,2]. Machine vision is an important development field of intelligent manufacturing, because image information can be obtained, which accurately judges the state information of industrial target products, so as to prepare for subsequent automatic operation. At present, some important links in the assembly line of integrated circuit board are still completed by skilled workers, such as inserting pins of electronic components (as shown in Figure 1) into corresponding holes (as shown in Figure 2), and quality control of finished products. Not only does manual labor consume time, but the results of installing and testing are affected by the dedication level and work experience of the installers. With the development of computer technology and information processing technology, object recognition based on deep learning is one of the most popular directions in machine vision field. Due to the complex background of industrial target products, problems such as aliasing, occlusion, and shadow often occur, and there is inter-class similarity, which leads to certain difficulties in object recognition.
Many researchers completed several studies in the field of object recognition. For example, Radeva et al. [3] introduced probability modeling using the Bayesian classification method in high-dimensional space to realize cork appearance detection and classification. Akhloufi et al. [4] proposed an effective color texture classification framework for the classification of complex industrial products, which was realized by combining the statistical features calculated by the generalized isotropic symbiosis matrix extracted from the ribbon with the image entropy. However, the limitation of these method is that it is difficult to identify products with similar color and same texture. Hao et al. [5] proposed a color threshold determination (CTD) method to identify color markers, aiming at the problem where traditional identification methods have low recognition accuracy or cannot be recognized in complex scenes and multi-objects. The Adaboost cascade classifier based on the Histograms of Oriented Gradients (HOG) [6] feature was used to determine the color of each pixel in the candidate region of interest. Then, the color feature was matched according to the preset threshold, and the matching region was reserved to obtain the final recognition result. This method has good performance in the task of color mark recognition in complex scene, but it is not suitable for the situation of dense and overlapping target objects. Due to the complex background and multi-target aliasing, there is a great similarity between the objects; thus, these detection algorithms cannot accurately segment each object area in the heavily overlapping industrial product objects, which makes it challenging to use traditional detection algorithms to recognize the objects, as shown in Figure 1.
In recent years, deep learning technology achieved great success in object recognition [7,8,9,10]. Apart from the artificial features of traditional algorithms, deep learning algorithms conduct representational learning on a large amount of data; thus, they are more generalized. At the same time, because the model is scalable, it is more flexible in practical application. At present, deep learning technology is widely used in industrial fields [10,11], such as industrial object classification [7,12], industrial product defect detection [9,13], and fault diagnosis [14,15]. For example, the R-CNN [16] method proposed by Girshick et al. was a successful case of applying deep learning to object recognition. This method combines a classical regional recommendation network (RPN) and convolutional neural network (CNN) for object detection and classification. It was further improved in Fast RCNN [17] and Faster RCNN [18]. In the literature [18], the region recommendation network (RPN) was firstly used to obtain the region of interest (ROI). The bounding boxes were then classified using a classifier. These algorithms provide guidance for industrial product detection. Although the accuracy of the R-CNN method is satisfactory, high computing force is needed, which leads to a low detection speed when using normal computers.
To overcome this problem, Redmon et al. [19] proposed a new neural network, YOLO, which can directly predict the target boundary box. The network is simpler and faster than R-CNN under the premise of high accuracy. The RPN network is not needed in the YOLO network, as it directly performs regression to detect the object in the image; thus, the detection speed is faster. Although the latest version of the YOLO network (YOLO-V3 [20]) improved the accuracy and speed of detection, and rendered it more suitable for small object detection, real-time detection in industrial applications requires too much hardware; thus, the network structure needs to be lightweight. Therefore, Google proposed the lightweight model Mobilenet [21] to improve the detection speed of the neural network algorithm. Mobilenet, based on streamlined architecture, uses depth-separable convolution to build lightweight deep neural networks. Mobilenet is an efficient network architecture; it can be used to build small, low-latency, and low-performance models by setting parameters.
Inspired by the above studies, this paper plans to use the improved YOLO-V3 algorithm for real-time detection of electronic components, though combining the Mobilenet network to improve the YOLO-V3 network.
The rest of this article is organized as follows: Section 2 introduces the construction of image dataset including image acquisition, image data enhancement, and label making. The improved YOLO-V3 algorithm is introduced in Section 3. Section 4 introduces the relevant contents of the experiment, and the proposed method is compared with the latest detection methods; then, the experimental result is discussed. Section 5 presents the conclusion and future prospects of this paper.

2. Dataset

2.1. Image Acquisition

In this study, 200 target images were acquired using a camera with 3264 × 2448 resolution, and the capturing distance was approximately 250–300 mm. The images were taken by an integrated circuit manufacturing company in Zhenjiang City, Jiangsu Province, China. The image data used in this paper were collected at the assembly line of the company using conventional lighting, a process which consumed one week.
The images included four different electronic components, as shown in Figure 3. Due to the large number of electronic components, there was inevitable overlap. The first electronic component was a capacitor of 470 μF, with the largest volume. The second type was a capacitor of 220 μF. Due to its similar shape to the capacitor of 470 μF, it was easily confused, which posed a challenge to machine vision. The third type was a capacitor of 22 μF, which was small, light-yellow, and different from the first two components. The last one was an inductor with reddish-brown color, but in small quantities.

2.2. Image Data Augmentation

Insufficient data in deep network training can lead to overfitting, which makes the model’s generalization ability worse. Therefore, the dataset needs to be augmented to improve the diversity of the sample. We used four data augmentation technologies: contrast enhancement processing, add noise processing, brightness transformation, and blur processing, as shown in Figure 4. The number of images was expanded from 200 to 1000, as shown in Table 1.

2.2.1. Contrast Enhancement Processing

Due to the particularity of machine vision, the colors in the image are inconsistent with the real environment under different lighting conditions. This may result in unclear outlines of electronic components in the images captured by industrial cameras, and the color contrast is not strong, thus affecting the recognition ability of the model. Therefore, the contrast enhancement algorithm was used to improve the contrast between the contour of the electronic component and the background color. Contrast enhancement is the stretching or compression of the range of brightness values in an image into the brightness display range specified by the display system, thereby increasing the overall or partial contrast of the image. Each luminance value in the original image was mapped to new values in the new image such that values between 0.3 and 1 mapped to values between 0 and 1.

2.2.2. Add Noise Processing

Adding noise means randomly adding a small amount of noise to the image, and the noise can randomly disturb the RGB of each pixel of the image. This method prevents the neural network from fitting all features of the input image, thereby preventing overfitting. Gaussian noise was added to this experiment. Gaussian noise often appears as an isolated pixel or pixel block that tends to cause strong visual effects on the image. This method added Gaussian white noise of mean 0.1 and variance 0.02 to the original images.

2.2.3. Brightness Transformation

On the assembly line, camera shooting is in an open environment, which causes ambient light to affect the brightness of the detection target, thus affecting the detection effect. Therefore, we used brightness transformation to simulate the brightness change caused by ambient light to the detection target, thereby improving the robustness of the model. In this paper, the original RGB values of the picture were multiplied by 1.5 to improve the overall brightness of the picture.

2.2.4. Blur Processing

This involves using a blurred template to produce a blurred image. In actual application scenarios, the image may be unclear due to the camera’s far distance, incorrect focal length, or camera movement. Therefore, this article used a rotationally symmetric Gaussian lowpass filter of size [5, 5] with standard deviation 5 to generate a blurred image. The blurred images were taken as samples to further improve the robustness of the detection model.

2.3. Image Annotation and Dataset Production

We used professional software to create image labels and combined them with images to generate the dataset. In order to better compare the performance of different algorithms, the labels in the dataset were uniformly converted into the PASCAL VOC2007 [22] format. The dataset was divided into three parts: the training set, the validation set, and the test set. The role of training data is to train the detection model, calculate the gradient, and update the weights. The validation data are used to avoid overfitting, while it can also be used to determine some super parameters (the size of the epoch, learning rate). Testing data are adopted to test the performance of the model. In this paper, the composition ratio of training set, verification set, and test set was 35%, 35%, and 30%, respectively. This article only focuses on the upper electronic components, whereas the components that block more than 70% were not considered. In particular, the two ends of the captured electronic components were not considered. Thus, the number of objects after augmentation was as shown in Table 2.

3. Method

For our object, a new YOLO-based network is proposed, which is a combination of YOLO-V3 and Mobilenet.

3.1. YOLO-V3

The YOLO (you only look once) network is an end-to-end [23] object detection model. Unlike the Faster R-CNN network, the YOLO network converts the classification regression problem directly into a regression problem. The YOLO detection model is shown in Figure 5. The YOLO network divides each image in the training set into S × S grids. If the center position of an object ground truth falls in the grid, the grid is responsible for detecting the target. Each grid predicts B bounding boxes and their confidence scores, as well as C objects belonging to a class of probability information. The bounding box information contains five data values, which are x, y, w, h and confidence, where x and y refer to the coordinates of the center position of the bounding box of the object predicted by the current grid, and w and h are the width and height of the bounding box. The definition of confidence is as follows:
C o n f i d e n c e = p r ( Object ) × I o U pred truth , p r ( Object ) { 0 , 1 } ,
where p r is an abbreviation for precision; when the target is in the grid, p r ( Object ) = 1 ; otherwise, it is equal to 0. I o U pred truth is used to indicate the consistency between the actual and predicted bounding boxes. Confidence reflects whether the grid contains objects and the accuracy of the predicted bounding box when it contains objects. When multiple bounding boxes detect the same target, non-maximum suppression (NMS) [24] is used to select the best bounding box.
Although YOLO offers faster speed than the Faster RCNN, it has a relatively high detection error. To solve this problem, the concept of “anchor” in Faster R-CNN was introduced in YOLO-V2 [25]. At the same time, YOLO-V2 optimized the network structure, using the convolution layer instead of the fully connected layer in the YOLO output layer, named Darknet19. YOLO-V2 also used high-resolution classifiers, direct location prediction, batch normalization, multi-scale training, and other methods, which greatly improved the detection accuracy compared to YOLO. However, YOLO-V2 was not ideal for multi-scale object detection.
In order to solve the above problem, YOLO-V3 proposed a method using the Resnet model and the feature pyramid networks for object detection [26] (FPN) architecture. The feature extractor for YOLO-V3 was a residual model that contained 53 convolutional layers, also known as Darknet53. From the perspective of the network structure, it can be constructed deeper, thereby improving the detection accuracy. Another point was to use the FPN architecture to achieve multi-scale prediction, making YOLO-V3 more effective for detecting small targets than YOLO-V2.

3.2. MobileNet Structure

The MobileNet model is based on depthwise separable convolutions which consist of two layers: depthwise convolutions and pointwise convolutions. The depthwise convolution applies a 3 × 3 convolution to apply a single filter to each input channel. The pointwise convolution applies a 1 × 1 convolution to output a deep convolution. Standard convolution can either filter or combine inputs into a new set of outputs. The depthwise separable convolutions divide it into two layers, a separate layer for filtering and another separate layer for combining, as shown in Figure 6. MobileNet’s detection time is 8–9 times faster than standard convolution at the expense of smaller detection accuracy.

3.3. Mixup Method

The Mixup method [27] was proven to play a significant role in the classification network. Subsequently, Zhang et al. [28] optimized this method and applied it to the field of object detection and achieved good results. The Mixup method is understood to be a data enhancement method that makes the neural network model appear linear when processing the region between samples. This linear modeling reduces the incompatibility of predicting data outside of the training sample. The Mixup method for object detection is shown in Figure 7.

3.4. The Proposed Algorithm

Figure 8 shows our proposed YOLOV3–Mobilenet network architecture, which uses the YOLO-V3 framework as the basic network architecture, uses the Mobilenet architecture to replace the original Darknet53 architecture, streamlines the network layer, and splits a standard convolution layer into depthwise convolutions and pointwise convolutions, where the former is responsible for applying a single filter to each input channel and the latter is responsible for combining the upper convolution.
The specific network parameters of YOLOV3–Mobilenet are shown in Figure 9. To better handle high-resolution images, we resized the resolution of the input image from the original 256 × 256 pixels to 416 × 416 pixels. The first layer of the improved network uses 3 × 3 standard convolutions. Starting from the second layer, the network splits the 3 × 3 standard convolution frame into 3 × 3 depthwise convolutions (Conv dw) and 1 × 1 pointwise convolutions (Conv). Specifically, the structure of the 3 × 3 Conv-BN-ReLU is changed into a 3 × 3 depthwise Conv-BN-ReLU-1 × 1 Conv-BN-ReLU structure, which is a contribution of convolution (Conv), batch normalization (BN), and rectified linear units (ReLU). Because the role of pointwise convolutions is to combine the results of the previous depthwise convolutions, you can delete the residual layer, which is responsible for the combination in the original network. The improved network reduces network layers and adopts the Mobilenet filters parameter setting, which makes the detection speed of the network closer to Mobilenet, and also ensures the detection accuracy to the greatest extent.
In the training process, we also used the Mixup method to improve the detection accuracy of the network. The Mixup method combines two images with a certain ratio, which increases the sample size of the image, thereby effectively improving the robustness of the system and enhancing the prediction ability of the model outside the training data range. At the same time, the Mixup method can make the model training more stable and reduce the fluctuations during training.

4. Experiments and Discussion

The YOLOV3–Mobilenet model was built on MXNet [29]. The detection model was trained and tested on the Dell Precision T7810 workstation. The workstation’s parameters were as follows: Xeon E5-2650 (central processing unit, CPU), 64 GB random-access memory (RAM), Nvidia Qudaro K5200 (graphics processing unit, GPU), 8 GB display memory, and Ubuntu 16.04 (operating system, OS). The initialization parameters of the network are shown in Table 3.

4.1. Evaluation Criterion

In order to evaluate the performance of our proposed network model, the evaluation criteria described below were used.

4.1.1. Precision and Recall

For binary classification problems, according to the combination of the learner’s ground truth class and the predictive class, the judging results can be divided into four types: true positive (TP), false positive (FP), true negative (TN), and false negative (FN). The confusion matrix of the classification results is shown in Table 4. Precision represents the ability of the model to identify related objects. It is the percentage of correct predictions. Recall stands for the ability of the model to find all relevant objects. It is the percentage of true positives detected in all ground truths.
The precision (P) and recall (R) are defined as follows:
P r e c i s i o n = T P T P + F P = T P all   detections .
R e c a l l = T P T P + F N = T P all   ground   truths .
With recall as the horizontal axis and precision as the vertical axis, an accurate alignment curve can be obtained, which is referred to as the P–R curve.

4.1.2. mAP

The dataset format of this paper is PASCAL VOC2007; thus, the 11-point interpolation average precision calculation method was used to calculate the AP (average precision). The calculation step was as follows: firstly, threshold values were set as [0, 0.1, 0.2, …, 1]. Then, whenever the recall value is greater than a threshold (such as recall > 0.3), we get a corresponding maximum precision. In this way, we calculated 11 precision values. AP was the average of these 11 precisions. The algorithm was as follows:
A P = 1 11 r { 0.0 , , 1.0 } A P r = 1 11 r { 0 , 0 , , 1 , 0 } p i n t e r p ( r ) ,
where
p interp ( r ) = max r ˜ r p ( r ˜ ) .
The AP stands for the performance of the test model for each category, while the mAP represents the performance of the test model across all categories, which is the average of all APs. The network reports information about the progress of the model learning at the end of each epoch. Therefore, the change of mAP can be seen during the model training process.

4.1.3. Loss Function

The loss function is an indicator of the performance of the model. The loss function in YOLOV3–Mobilenet is defined as follows:
L o s s = E r r o r c e n t e r + E r r o r s c a l e + E r r o r o b j + E r r o r c l a s s ,
where E r r o r c e n t e r (prediction error of the box center) and E r r o r s c a l e (prediction error of the box scale) are defined as follows:
E r r o r c e n t e r = λ coord i = 0 S 2 j = 0 B 𝟙 i j obj [ ( x i x i ^ ) 2 + ( y i y i ^ ) 2 ] ,
E r r o r s c a l e = λ coord i = 0 S 2 j = 0 B 𝟙 i j ob j [ ( w i w i ^ ) 2 + ( h i h i ^ ) 2 ] ,
where λ coord represents the weight of the coordinate error, S 2 means the number of grids of the input image, and B is the number of bounding boxes generated by each grid. We set the value of λ coord to 5, the value of S to 13, and the value of B to 9. The value of 𝟙 i j ob j in the formula is related to the picture. When there is an object in the j th bounding box in gird i, the value of 𝟙 i j ob j is 1; otherwise, it is 0. ( x i ^ , y i ^ ) and ( w i ^ ,     h i ^ ) respectively represent the center coordinates for width and height of the prediction box, while ( x i ,     y i ) and ( w i ,     h i ) are the true values.
E r r o r o b j (the confidence error), which means the objectness of the box, is defined as follows:
E r r o r o b j = i = 0 S 2 j = 0 B 𝟙 i j ob j ( C i C i ^ ) 2     + λ noobj i = 0 S 2 j = 0 B 1 i j noob j ( C i C i ^ ) 2 ,
where C i ^ is the confidence score of the j th bounding box in grid i, and the parameter 1 i j noob j is a complement of 𝟙 i j ob j . When an object is detected in the j th bounding box in gird i, 𝟙 i j ob j is set to 1, and 𝟙 i j noob j is set to 0; otherwise, 𝟙 i j ob j takes 0 and 𝟙 i j noob j takes 1. The function of the parameter λ noobj is to weigh down the loss when detecting the background.
E r r o r c l a s s (the classification error) is defined as follows:
E r r o r c l a s s = i = 0 S 2 𝟙 i ob j c classes ( p i ( c ) p i ^ ( c ) ) 2 ,
where c represents the class to which the detected object belongs, p i ( c ) represents the actual likelihood of the class c class in cell i, and p i ^ ( c ) is the predicted value. The classification loss at each cell is the squared error of the class conditional probabilities for each class.

4.1.4. Detection Speed

The detection speed was used to compare between different detection models, which was obtained using the following method: firstly, eight different images were selected; then, the same model was used to detect them three times, before finally taking the average of the three values.

4.2. Experimental Results

The dataset including four classes of electronic components was used to train the YOLOV3–Mobilenet network. The P–R curve is shown in Figure 10. The mAP scores of the corresponding electronic components are shown in Table 5.
It can be seen from the above data that the overall test results were ideal, with an mAP of 95.21%. However, Figure 10 shows that the curves of capacitor of 220 μF and capacitor of 22 μF were closer to the upper right corner than the curves of capacitor of 470 μF and inductor, and their P–R values were closer to the (1, 1) coordinate. This shows that the curves for capacitor of 220 μF and capacitor of 22 μF were better than those for capacitor of 470 μF and inductor. The AP value in Table 5 also supports this result. From the information in Table 2, it is known that capacitor of 220 μF and capacitor of 22 μF had more training samples, resulting in better test results.

4.3. Comparison of Different Algorithms

In order to verify the performance of the proposed model, the YOLOV3–Mobilenet trained with the dataset of the four electronic components was compared with YOLO V3, SSD (Single Shot Multibox Detector) [30], and Faster R-CNN with Resnet 101 models. In this way, the superior performance of the proposed method was demonstrated.
The mAP and detection speed of YOLOV3–Mobilenet, YOLO V3, SSD, and Faster R-CNN with Resnet 101 are shown in Table 6. Figure 11 shows the P–R curves of different electronic components for the detection models. The mAP curves of the four models are shown in Figure 12.
From Figure 11, we can see that the curves of the YOLO V3 and YOLOV3–Mobilenet models had significant advantages over SSD and Faster R-CNN, and their P–R values were closer to the coordinate (1, 1). Combined with the detection speed in Table 6, it can be observed that the detection speed of YOLOV3–Mobilenet was 49.4% higher than that of YOLO V3, and the advantage was remarkable. Figure 12 shows that our method was close to the mAP value of YOLO V3, but we can see that our method reached the steady state first.
In order to facilitate the observation of the bounding box, a, b, c, and d were used to replace the four electronic components (capacitor of 470 μF, capacitor of 220 μF, capacitor of 22 μF and inductor, respectively). The test results of the model are shown in Figure 13.
After careful comparison, several phenomena could be found in Figure 13. The detection effects of the YOLO V3 network and the YOLOV3–Mobilenet network were similar. There were lots of bounding boxes in the image detected by the SSD network that were greater in number and larger than the object, which affected the detection effect of the correct electronic components, the reason for which may be that the setting of the NMS value of the SSD was not suitable for our object. In the Faster R-CNN network, some detection errors occurred. In the upper right corner of Figure 13g, the ends of an electronic component were detected, which was not the scope we considered, but the Faster R-CNN misidentified it. Thus, we can conclude that Faster R-CNN was not well adapted to our object.

4.4. Analysis of Influencing Factors

4.4.1. Influence of the Quantity of Experimental Data

In this section, we mainly analyze the impact of the size of the image dataset on the YOLOV3–Mobilenet model. To achieve this, 50, 150, 250, 500, 750, and 1000 images were randomly selected from the image dataset to form corresponding datasets. Then, the P–R curve (Figure 14) and mAP value (Table 7) of the corresponding model were obtained.
From these results, we can conclude that the detection performance of the YOLOV3–Mobilenet model improved upon increasing the dataset size.

4.4.2. Influence of Data Augmentation Technologies

Four augmentation technologies were adopted in this paper. In order to explore the effect of different augmentation technologies on the performance of the model, we conducted several experiments. Experiments were conducted on the raw dataset and the augmentation (including four technologies) dataset, and the dataset removed one technology at a time. Finally, corresponding mAP values (Table 8) were obtained for comparison.
From the experimental results, data augmentation technologies greatly improved the performance of the model, and the mAP value rose from 83.01% to 95.21%. This shows that using these data augmentation technologies could efficiently improve the robustness and detection accuracy of the model.
As can be seen from Table 8, the three data augmentation technologies, including add noise processing, brightness transformation, and blur processing, resulted in a decrease in mAP values by 4.44%, 4.39%, and 3.5%, respectively. This means that these three technologies had a greater impact on mAP. In contrast, the removal of the contrast enhancement transformation technology resulted in a 0.41% drop in the mAP value, indicating that this technology had a weak effect on the performance of the model.

4.4.3. Influence of Mixup Method

In the training process of our network model, the use of the Mixup training method resulted in a 0.27% improvement in mAP, indicating that the detection accuracy was improved to some extent by this method, as shown in Table 9.
It can be seen from Figure 15 that the model using the Mixup training method had a smaller loss value during the training process, which was more stable than the training without the Mixup method, which is why it was easy to converge. Figure 16 strongly supports the above conclusions.

5. Conclusions

In this paper, the improved YOLO V3 (YOLOV3–Mobilenet) model for detection of electronic components in complex backgrounds was proposed. In order to balance the accuracy of detection and speed, we incorporated the Mobilenet network framework to lighten the YOLO V3 network.
We collected 200 images containing four electronic components (capacitor of 470 μF, capacitor of 220 μF, capacitor of 22 μF, and inductor), using four data augmentation technologies (contrast enhancement processing, add noise processing, brightness conversion, and blurring) to build a dataset, and manually labeled the dataset.
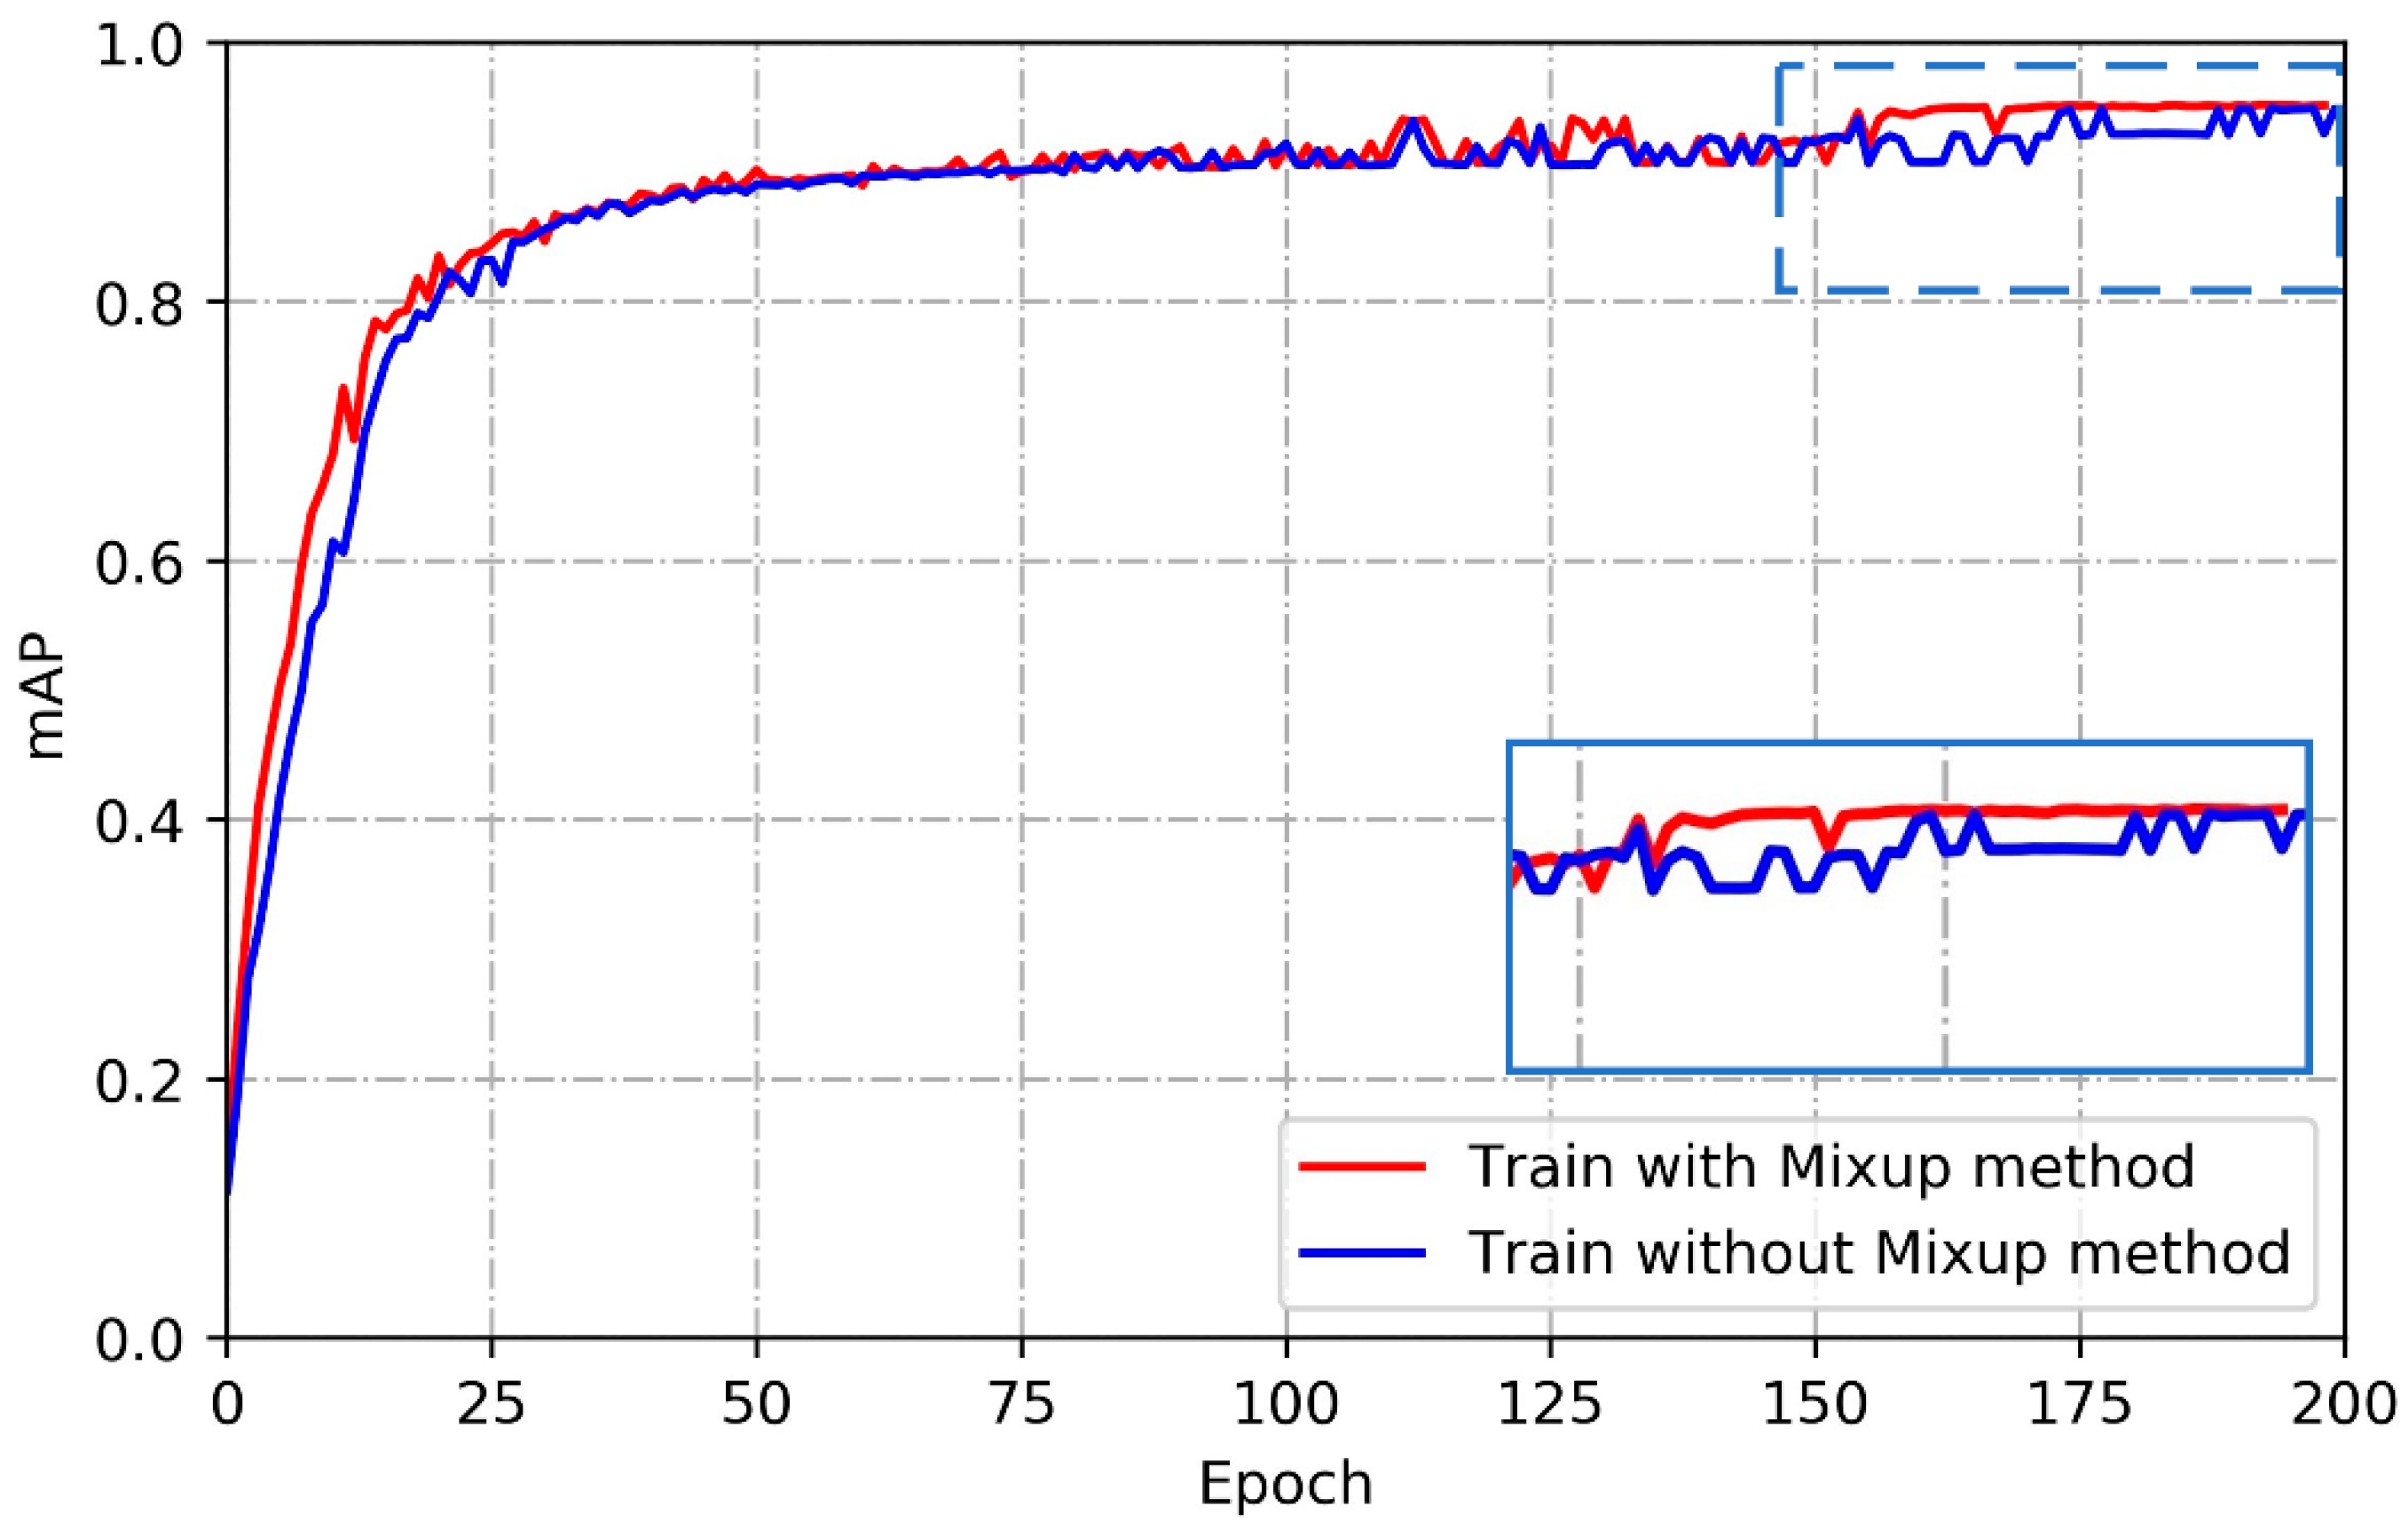
To prove the validity of our proposed method, it was compared with some of the latest detection methods. The experimental results showed that, compared with the YOLO V3 model, the YOLOV3–Mobilenet model had a significant improvement in detection speed with similar accuracy. Furthermore, it had significant advantages compared with SSD and Faster R-CNN with Resnet101 network.
YOLOV3–Mobilenet can now be used for the detection of electronic components, but there is still a certain gap between its performance real-time detection. Future work will focus on optimizing existing models to enable the detection of electronic components in video to meet real-time requirements. We also plan to deploy it in embedded devices, so that it can achieve better portability in use. In addition, we will also optimize the data augmentation technologies to further improve the detection accuracy.

Author Contributions

Conceptualization, R.H.; data curation, R.H. and X.S.; formal analysis, R.H. and X.S.; funding acquisition, J.G. and X.S.; investigation, R.H. and X.S.; methodology, R.H.; resources, R.H. and X.S.; software, R.H. and X.S.; supervision, J.G., Y.H., X.S., and S.U.; writing—original draft, R.H. and X.S.; writing—review and editing, R.H., X.S., J.G., Y.H., and S.U.

Funding

This research was funded by the National Natural Science Foundation of China (No. 51875266), and Jiangsu Province Graduate Research and Innovation Program (No. KYCX18-2227).

Conflicts of Interest

The authors declare no conflict of interest.

References

  1. Avinash, C.T. Towards a second green revolution. Irrig. Drain. 2016, 65, 388–389. [Google Scholar]
  2. Butollo, F.; Lüthje, B. ‘Made in China 2025’: Intelligent Manufacturing and Work. In The New Digital Workplace: How New Technologies Revolutionise Work; Macmilan: London, UK, 20; pp. 42–61. [Google Scholar]
  3. Radeva, P.; Bressan, M.; Tovar, A.; Vitria, J. Bayesian Classification for Inspection of Industrial Products. In Catalonian Conference on Artificial Intelligence; Springer: Berlin/Heidelberg, Germany, 2002; pp. 399–407. [Google Scholar]
  4. Akhloufi, M.A.; Larbi, W.B.; Maldague, X. Framework for Color-Texture Classification in Machine Vision Inspection of Industrial Products. In Proceedings of the 2007 IEEE International Conference on Systems, Man and Cybernetics, Montréal, QC, Canada, 7–10 October 2007; pp. 1067–1071. [Google Scholar]
  5. Hao, K.; Qu, Z.; Gong, Q. Color Flag Recognition Based on HOG and Color Features in Complex Scene. In Proceedings of the Ninth International Conference on Digital Image Processing (ICDIP 2017), International Society for Optics and Photonics, Hong Kong, China, 19–22 May 2017; Volume 10420, p. 104200A. [Google Scholar]
  6. Navneet, D.; Bill, T. Histograms of oriented gradients for human detection. In Proceedings of the International Conference on Computer Vision & Pattern Recognition (CVPR ’05), San Diego, CA, USA, 20–26 June 2005; pp. 886–893. [Google Scholar]
  7. Miškuf, M.; Zolotová, I. Comparison between Multi-Class Classifiers and Deep Learning with Focus on Industry 4.0. In Proceedings of the IEEE 2016 Cybernetics & Informatics (K&I), Levoca, Slovakia, 2–5 February 2016; pp. 1–5. [Google Scholar]
  8. Leo, M.; Furnari, A.; Medioni, G.G.; Trivedi, M.; Farinella, G.M. Deep Learning for Assistive Computer Vision. In Proceedings of the European Conference on Computer Vision (ECCV), Munich, Germany, 8–14 September 2018; pp. 3–14. [Google Scholar]
  9. Birlutiu, A.; Burlacu, A.; Kadar, M.; Onita, D. Defect Detection in Porcelain Industry Based on Deep Learning Techniques. In Proceedings of the 2017 19th International Symposium on Symbolic and Numeric Algorithms for Scientific Computing (SYNASC), Timisoara, Romania, 21–24 September 2017; pp. 263–270. [Google Scholar]
  10. Dutta, S. An overview on the evolution and adoption of deep learning applications used in the industry. Wiley Interdiscip. Rev. 2018, 8, e1257. [Google Scholar] [CrossRef]
  11. Subakti, H.; Jiang, J.R. Indoor Augmented Reality Using Deep Learning for Industry 4.0 Smart Factories. In Proceedings of the 2018 IEEE 42nd Annual Computer Software and Applications Conference (COMPSAC), Tokyo, Japan, 23–27 July 2018; Volume 2, pp. 63–68. [Google Scholar]
  12. Wood, S.; Muthyala, R.; Jin, Y.; Qin, Y.; Rukadikar, N.; Rai, A.; Gao, H. Automated industry classification with deep learning. In Proceedings of the 2017 IEEE International Conference on Big Data (Big Data), Boston, MA, USA, 11–14 December 2017; pp. 122–129. [Google Scholar]
  13. Sun, X.; Gu, J.; Tang, S.; Li, J. Research Progress of Visual Inspection Technology of Steel Products—A Review. Appl. Sci. 2018, 8, 2195. [Google Scholar] [CrossRef]
  14. Lacey, G.; Taylor, G.W.; Areibi, S. Deep learning on fpgas: Past, present, and future. arXiv 2016, arXiv:1602.04283. [Google Scholar]
  15. Lv, F.; Wen, C.; Bao, Z.; Liu, M. Fault Diagnosis Based on Deep Learning. In Proceedings of the 2016 American Control Conference (ACC), Boston, MA, USA, 6–8 July 2016; pp. 6851–6856. [Google Scholar]
  16. Girshick, R.; Donahue, J.; Darrell, T.; Malik, J. Rich Feature Hierarchies for Accurate Object Detection and Semantic Segmentation. In Proceedings of the IEEE Conference on Computer Vision and Pattern Recognition, Columbus, OH, USA, 24–27 June 2014; pp. 580–587. [Google Scholar]
  17. Girshick, R. Fast R-Cnn. In Proceedings of the IEEE International Conference on Computer Vision, Santiago, Chile, 7–13 December 2015; pp. 1440–1448. [Google Scholar]
  18. Ren, S.; He, K.; Girshick, R.; Sun, J. Faster r-cnn: Towards Real-Time Object Detection with Region Proposal Networks. In Proceedings of the Advances in Neural Information Processing Systems, Montreal, QC, Canada, 7–12 December 2015; pp. 91–99. [Google Scholar]
  19. Redmon, J.; Divvala, S.; Girshick, R.; Farhadi, A. You Only Look Once: Unified, Real-Time Object Detection. In Proceedings of the IEEE Conference on Computer Vision and Pattern Recognition, Las Vegas, NV, USA, 27–30 June 2016; pp. 779–788. [Google Scholar]
  20. Redmon, J.; Farhadi, A. Yolov3: An incremental improvement. arXiv 2018, arXiv:180402767. [Google Scholar]
  21. Howard, A.G.; Zhu, M.; Chen, B.; Kalenichenko, D.; Wang, W.; Weyand, T.; Adam, H. Mobilenets: Efficient convolutional neural networks for mobile vision applications. arXiv 2017, arXiv:170404861. [Google Scholar]
  22. Mark, E.; Luc, V.G.; Christopher, K.I.W.; John, W.; Andrew, Z. The pascal visual object classes (voc) challenge. Int. J. Comput. Vision 2010, 88, 303–338. [Google Scholar]
  23. Yi, L.; Li, G.; Jiang, M. An End-to-End Steel Strip Surface Defects Recognition System Basedon Convolutional Neural Networks. Steel Res. Int. 2016, 88, 176–187. [Google Scholar]
  24. Neubeck, A.; Van Gool, L. Efficient non-maximum suppression. In Proceedings of the 18th International Conference on Pattern Recognition (ICPR’06), Hong Kong, China, 20–24 August 2006; Volume 3, pp. 850–855. [Google Scholar]
  25. Redmon, J.; Farhadi, A. YOLO9000: Better, Faster, Stronger. In Proceedings of the IEEE Conference on Computer Vision and Pattern Recognition, Honolulu, HI, USA, 22–25 July 2017; pp. 7263–7271. [Google Scholar]
  26. Lin, T.Y.; Dollár, P.; Girshick, R.; He, K.; Hariharan, B.; Belongie, S. Feature Pyramid Networks for Object Detection. In Proceedings of the IEEE Conference on Computer Vision and Pattern Recognition, Honolulu, HI, USA, 22–25 July 2017; pp. 2117–2125. [Google Scholar]
  27. Zhang, H.; Cisse, M.; Dauphin, Y.N.; Lopez-Paz, D. Mixup: Beyond empirical risk minimization. arXiv 2017, arXiv:171009412. [Google Scholar]
  28. Zhang, Z.; He, T.; Zhang, H.; Zhang, Z.; Xie, J.; Li, M. Bag of Freebies for Training Object Detection Neural Networks. arXiv 2019, arXiv:190204103. [Google Scholar]
  29. Chen, T.; Li, M.; Li, Y.; Lin, M.; Wang, N.; Wang, M.; Zhang, Z. Mxnet: A flexible and efficient machine learning library for heterogeneous distributed systems. arXiv 2015, arXiv:151201274. [Google Scholar]
  30. Liu, W.; Anguelov, D.; Erhan, D.; Szegedy, C.; Reed, S.; Fu, C.Y.; Berg, A.C. Ssd: Single shot multibox detector. In Proceedings of the European Conference on Computer Vision 2016, Amsterdam, The Netherlands, 8–16 October 2016; Springer: Cham, The Netherlands, 2016; pp. 21–37. [Google Scholar]
Figure 1. Electronic components.
Electronics 08 00825 g001
Figure 2. Manual assembly.
Electronics 08 00825 g002
Figure 3. Four electronic components: (a) capacitor of 470 μF; (b) capacitor of 220 μF; (c) capacitor of 22 μF; (d) inductor.
Electronics 08 00825 g003
Figure 4. (a) Original picture; (b) contrast enhancement processing; (c) add noise processing; (d) brightness transformation; (e) blur processing.
Electronics 08 00825 g004
Figure 5. YOLO detection.
Electronics 08 00825 g005
Figure 6. Standard convolution vs. depthwise separable convolution.
Electronics 08 00825 g006
Figure 7. Mixup method for object detection. Image pixels are blended and object labels are merged to generated new image.
Electronics 08 00825 g007
Figure 8. YOLOV3–Mobilenet detection network.
Electronics 08 00825 g008
Figure 9. Network parameters of YOLOV3–Mobilenet and YOLO V3.
Electronics 08 00825 g009
Figure 10. Precision and recall (P–R) curves of the four electronic components.
Electronics 08 00825 g010
Figure 11. P–R curves of the four electronic components for the detection models: (a) capacitor of 470 μF; (b) capacitor of 220 μF; (c) capacitor of 22 μF; (d) inductor.
Electronics 08 00825 g011
Figure 12. Mean average precision (mAP) value as a function of gradually increasing epoch.
Electronics 08 00825 g012
Figure 13. Detection results: (a,b) YOLOV3–Mobilenet; (c,d) YOLO V3; (e,f) SSD; (g,h) Faster R-CNN with Resnet 101.
Electronics 08 00825 g013
Figure 14. P–R curves of four electronic components for the model trained with different numbers of images: (a) capacitor of 470 μF; (b) capacitor of 220 μF; (c) capacitor of 22 μF; (d) inductor.
Electronics 08 00825 g014
Figure 15. Loss curves of the two methods.
Electronics 08 00825 g015
Figure 16. mAP curves of the two methods.
Electronics 08 00825 g016
Table 1. The number of images generated by data augmentation technologies.
Original DataContrastNoiseBrightnessBlurTotal
Number of images2002002002002001000
Table 2. The numbers of different labels.
LabelsCapacitor of 470 μFCapacitor of 220 μFCapacitor of 22 μFInductor
No.619521,57510,0505340
Table 3. Initialization parameters of YOLOV3–Mobilenet network.
Size of Input ImagesBatch SizeMomentumLearning Rate Scheduler ModeLearning RateTraining Epoch
416 × 41680.9Step0.0001200
Table 4. Confusion matrix of the classification results. TP—true positive; FP—false positive; TN—true negative; FN—false negative.
LabeledPositiveNegative
Predicted
PositiveTPFP
NegativeFNTN
Table 5. Mean average precision (mAP) results of the four electronic components.
ClassmAP
Capacitor of 470 μF0.9090
Capacitor of 220 μF0.9955
Capacitor of 22 μF0.9950
Inductor0.9086
All0.9521
Table 6. mAP results and detection speed for several models.
ModelsYOLOV3–MobilenetYOLO-V3SSDFaster R-CNN with Resnet 101
mAP0.95210.95250.89040.9261
Detection speed (s)0.07940.15690.19620.6188
Table 7. mAP results of different dataset size.
Number of Images501502505007501000
mAP0.59230.82960.88370.90210.92390.9521
Table 8. mAP results for various situations.
Data Augmentation TechnologiesmAP
Raw dataset0.8301
Dataset after augmentation0.9521
Remove contrast enhancement transformation0.9480
Remove add noises processing0.9077
Remove brightness transformation0.9082
Remove blur processing0.9171
Table 9. mAP results for two different situations.
MethodTraining without Mixup MethodTraining with Mixup Method
mAP0.94940.9521

