Article

New Application of an Instantaneous Frequency Parameter for Assessing Far Infrared Fabric Effects in Aged Subjects

1
School of Electrical and Information Engineering, North Minzu University, No. 204 North Wenchang Street, Yinchuan 750021, Ningxia, China
2
Basic Experimental Teaching and Engineering Training Center, North Minzu University, No. 204 North Wenchang Street, Yinchuan 750021, Ningxia, China
3
School of Science, Ningxia Medical University, No. 1160, Shengli Street, Yinchuan 750004, Ningxia, China
4
Taichung Tzuchi Hospital, The Buddhist Tzuchi Medical Foundation, Taichung 42743, Taiwan
5
School of Post-baccalaureate Chinese Medicine, Tzu Chi University, Hualien 97002, Taiwan
6
Department of Electronics Engineering, Dong Hwa University, No. 1, Sec. 2, Ta Hsueh Rd., Shoufeng, Hualien 97401, Taiwan
*
Author to whom correspondence should be addressed.
Signifies equal contribution compared with the corresponding author.
Electronics 2020, 9(1), 138; https://doi.org/10.3390/electronics9010138
Submission received: 4 December 2019 / Revised: 6 January 2020 / Accepted: 9 January 2020 / Published: 10 January 2020
(This article belongs to the Section Bioelectronics)

Abstract

:
A microcirculation microscope has recently been introduced to reveal finger blood flow changes by visualization, before and after using far-infrared fabric. Digital volume pulses (DVPs) from the dominant index fingertip of healthy young subjects (Group 1, n = 66) and healthy upper middle-aged subjects (Group 2, n = 33) were acquired through a photoplethysmographic electrical device (PED). By using the one intrinsic mode function (i.e., IMF5), an instantaneous frequency difference (ΔfEmax) was revealed through the second part of the Hilbert–Huang transformation. Parameters from DVPs in the time domain, i.e., the stiffness index, crest time, crest time ratio, and finger perfusion index, were also obtained for comparison. The results showed significant differences in FPI and ΔfEmax between the two groups (p = 0.002 and p = 0.043, respectively). A significant ΔfEmax was also noted for the two groups under the effects of far-infrared radiation (FIR) (Group 1: p = 0.046; Group 2: p = 0.002). In conclusion, this study aimed to validate a self-developed and economical device, with a good extensibility, which can be operated in a domestic setting, and to demonstrate that the PED performed quantitative indexes on finger blood flow comparable to those investigated through a microcirculation microscope.

1. Introduction

Far-infrared radiation (FIR), which comprises electromagnetic waves of 3–100 μm [1], produces physiological actions not only because of its high power in human tissue but also because of its ability to elicit both heat-related [2] and non-heat-related [3] biological effects. It has been shown that FIR causes vessel vasodilatation, thereby improving human tissue perfusion [2,4,5] and skin micro perfusion in rats by enhancing the action of endothelial nitric oxide synthase in the vascular endothelium [6]. There are three types of techniques for FIR radiation delivery: FIR saunas, FIR heat lamps, and FIR-emitting ceramics and fabrics [1]. In general, FIR heat lamps are used widely in hospitals for different kinds of therapy [1,2,3,4,5,6,7]. In addition, a previous study demonstrated the benefits of combined acupuncture-FIR heat lamps in enhancing peripheral perfusion and parasympathetic activity [7]. FIR-emitting ceramics and fabrics can also play an important role in peripheral circulation effects for home medical use [8,9]. Some small particles (microparticles and nanoparticles) of FIR-emitting ceramic compounds have been incorporated into fibers, which are then woven into fabrics. The fabrics can be manufactured into various products that can be worn on different parts of the human body [1]. Preparations containing tourmaline powder have been attached to the skin, affecting blood flow [8]. Under normal human body temperature, FIR is produced from far-infrared fabric [8,9]. Subsequently, FIR is absorbed by the human body and then emitted by the body in the form of black body radiation (3–50 μm) [1]. The effect of far-infrared fabric can be verified directly with a microcirculation microscope, which is only capable of visualization. On the other hand, the analysis of blood velocity and flow state requires another expensive microcirculation 3D image analysis system [10]. In addition, the study in [11] reported a non-invasive 3D imaging technique for fingertip blood flow measurement by the use of Doppler optical microangiography. However, based on this physiological observation, a non-invasive instrument providing an impetus for continuous improvements in simple detection and multiple parameters is needed for the visualization of finger blood volume changes using a photoplethysmography (PPG) technique, before and after using far-infrared fabric.
Using PPG for acquiring index arterial waveforms, a previous study investigated the impacts of FIR heat lamps in improving peripheral circulation [7]. Some previous studies proposed the use of PPG to assess peripheral circulation in subjects without systemic diseases [12,13]. However, the validity of its use in FIR-emitting ceramics and fabrics, which are prone to microcirculation-induced effects, has not been addressed. The present study therefore aimed to evaluate the applications of PPG contour analysis in the time domain [14,15,16] and the Hilbert–Huang transformation (HHT) domain [17] to verify the benefits of far-infrared fabric, using a microcirculation microscope for comparison. Finger blood flow assessment-related parameters from PPG contour analysis in the time domain, i.e., the stiffness index (SI) [14], crest time (CT) [17], crest time ratio (CTR) [17], and finger perfusion index (FPI) [16], were also obtained by a photoplethysmographic electrical device (PED), which collected very long (i.e., 30 min) digital volume pulses (DVPs) on the index finger, all for the offline computation of parameters for comparison. The objectives of this study were to test the following two hypotheses. The first is that the PED can perform a quantitative index on microvascular blood flow change due to the attachment of far-infrared fabric. Our second hypothesis is that a novel parameter (i.e., instantaneous frequency difference, ΔfEmax), acquired through incorporating the concept of contour analysis into HHT using the LabVIEW G programming language (Figure 1), can be a new indicator for differentiating the states before and after far-infrared fabric is attached.
The rest of this paper is organized as follows: Section 2 shows the study population (i.e., study period and grouping), study protocol (i.e., comparison of the computational parameters with the demographic and anthropometric parameters of the two groups of testing subjects), and details on system design, data acquisition, and data analysis (including calculation of the crest time, crest time ratio, finger perfusion index, stiffness index, and instantaneous frequency difference (ΔfEmax)), as well as statistical analysis. In Section 3, the characteristics of testing subjects are first justified, followed by a comparison of computational parameters for finger blood flow assessment. In Section 4 and Section 5, discussion and conclusions derived from the study are summarized along with suggestions for future work.

2. Study Design, System Design, and Finger Blood Flow Assessment

2.1. Study Population and Study Protocol

2.1.1. Study Population and Grouping

Between September 2018 and August 2019, 108 volunteers were originally enrolled for this study. The study proceeded in accordance with the Declaration of Helsinki, and the protocol was approved by the Ethics Committee of Ningxia Medical University Hospital (Yinchuan City, Ningxia Province, PRC) (No. 2018-229). All subjects gave their informed consent for inclusion before they participated in the study. Of the 108 subjects, nine were excluded due to unstable or incomplete waveform data acquisition. The remaining 99 subjects were then divided into two groups, including 66 healthy young subjects (Group 1, age range: 18–40) and 33 healthy upper middle-aged subjects (Group 2, age range: 41–70) [18]. All of the subjects had no personal or family history of cardiovascular diseases.

2.1.2. Study Protocol

All measurements were performed during two periods in the morning and afternoon (i.e., 08:30–10:30 and 14:30–16.30). All subjects were asked to refrain from caffeine-containing beverages for at least 8 h before each testing. In addition, to minimize potential errors in the infrared sensor readings arising from involuntary vibrations of the subjects, all participants were allowed to rest in a supine position for 3 min in a quiet room with a temperature maintained at 26 ± 1 °C. The finger blood flow assessment-related parameters (i.e., SI, CT, CTR, FPI, and ΔfEmax) were measured and calculated by our new photoplethysmographic electrical device (PED) for finger blood flow assessment under the radiation effect of far-infrared fabric.

2.2. Photoplethysmographic Electrical Device (PED) for Data Analysis

2.2.1. Parameters for Finger Blood Flow Assessment

  • Stiffness Index (SI)
According to previous studies [14,19,20], it has been proposed that the stiffness index can be calculated from the body height divided by the transit time (TDVP) (i.e., the difference time between systolic pulse peak and the following diastolic pulse peak in seconds) (Figure 2). A higher SI value denotes impaired vessel status.
SI = body   height T DVP
In the present study, two SI values of each subject were calculated from two 1-min DVP waveforms, which were recorded in a PED for finger blood flow comparison under the effect of far-infrared fabric (Figure 2).
  • Crest Time (CT) and Crest Time Ratio (CTR)
The crest time is the time interval from the foot point of the DVP waveform to the first peak in seconds. The crest time ratio can be calculated from the CT divided by the cycle time (i.e., duration from the foot point of one wave to another in seconds) (Figure 2).
CTR = CT Cycle   time
Based on previous findings [14,15], CT and CTR indices showed significant positive correlations with SI. In the present study, we attempted to find the CT and CTR indices, irrespective of whether or not they reflect the effect of far-infrared fabric (Figure 2).
  • Finger Perfusion Index (FPI)
In accordance with the finding of previous studies [16,21] that the integral of blood flow under an arterial pulse waveform reflects blood perfusion within a defined time period, the area under the finger arterial waveform contour is a rational estimation of the perfusion volume of the finger blood flow.
The areas under the arterial waveforms within 1 min of the baseline recording were summated (AreaBaseline). The areas under the waveforms during SY2-attachment represented 1 min of recordings (AreaSY2). The change in blood flow every 1 min after SY2 attachment, compared with the baseline, was then equal to (AreaSY2 − AreaBaseline). Therefore, values were obtained for each testing subject. The figure perfusion index (FPI) was defined as the percentage change of blood flow every 1 min before/after SY2 attachment [16,21], defined as follows.
FPI = Area S Y 2 Area Baseline Area Baseline × 100 %
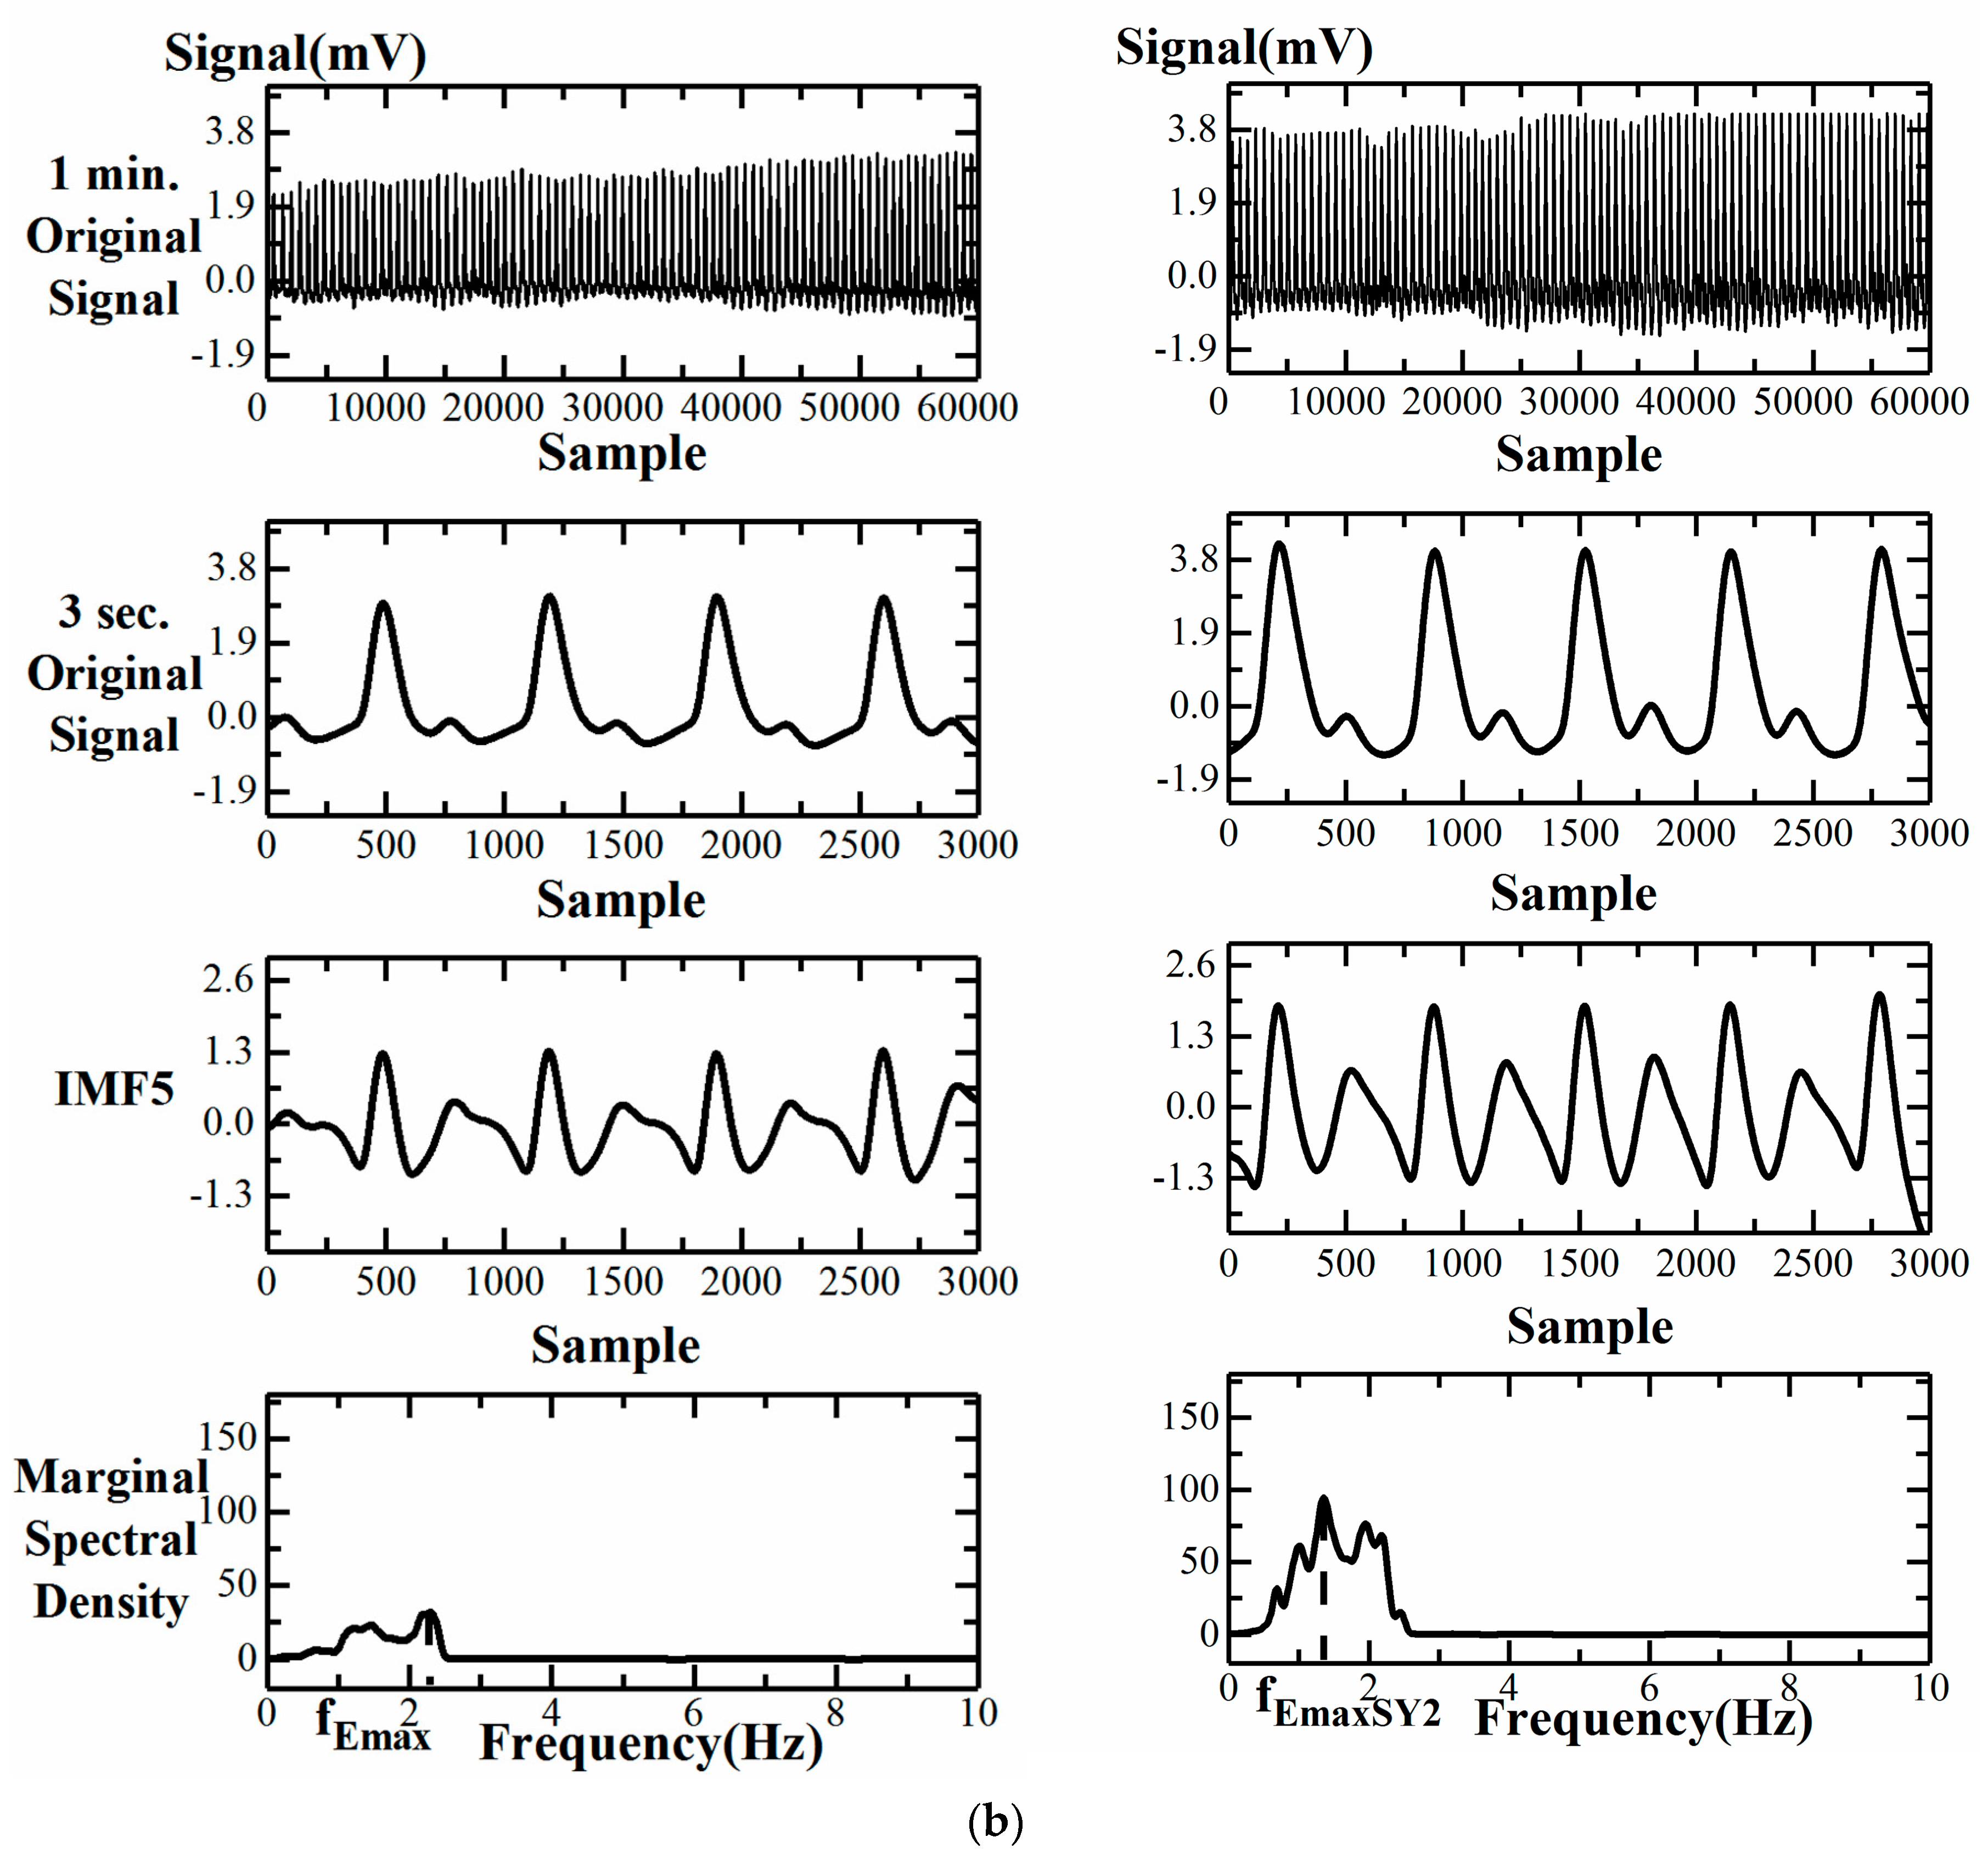
  • Instantaneous Frequency Difference, ΔfEmax
On the other hand, the significance of the Hilbert–Huang spectrum, which is the other component of HHT that investigates the relationship among energy, time, and frequency, has not been explored and verified in terms of the effect of far-infrared fabric. By recruiting diabetic patients and healthy subjects, a previous study aimed to investigate the significance of instantaneous frequency in vascular health. The values of the instantaneous frequency of maximal energy (fEmax) were higher in diabetic patients than those in non-diabetic volunteers [17].
In general, 3000 points of sampled DVP signals (i.e., y(t) in Equations (4) and (5)) comprise noise-free and noise components:
y(t) = s(t) + n(t)
in which s(t) and n(t) are the true signal and white noise, respectively.
As a result, the signal y(t), after ensemble empirical mode decomposition (EEMD), can be expressed as
y(t) = IMF1(t) + IMF2(t) + … + IMFn(t) + rn(t)
in which IMFn(t) and rn(t) are intrinsic mode functions and the residue function, respectively.
By using the one intrinsic mode function (IMF5) and marginal spectral density after Hilbert–Huang spectrum analysis, the instantaneous frequency of maximal energy (fEmax) was then obtained (Figure 2) after real time computation. The value of the instantaneous frequency of maximal energy within 3 s of the baseline recording was summated (fEmax), whereas fEmaxSY2 represented the instantaneous frequency of maximal energy with SY2 attachment. Hence, the instantaneous frequency difference (ΔfEmax) was defined as the difference change of the instantaneous frequency of maximal energy after SY2 was attached:
Δ f Emax = f Emax f Emax S Y 2

2.2.2. Procedures of Examinations

Each subject received two different stages of measurements: Session 1 (baseline stage) and Session 2 (far-infrared fabric attached). Before data acquisition, one PPG detector was attached to the index fingertip of the dominant hand. The digital volume pulse (DVP) waveforms were recorded for a 1-min duration in Session 1. Subsequently, a far-infrared fabric (i.e., Leadtek-SY2®, medical equipment, class 1, No. 004873, Taiwan Food and Drug Administration) was attached (i.e., SY2 attachment) on the dominant wrist of the testing subject for Session 2. Then, after 2 min of rest [11], the digital volume pulse (DVP) waveforms were also recorded for the second 1-min duration. In the seven-minute measurement, two 1-min DVP waveforms were recorded for the computation of parameters (i.e., SI, CT, CTR, FPI, and ΔfEmax) in the PED for finger blood flow assessment under the effect of far-infrared fabric. The values of all parameters were averaged from all the beats in a selected time interval (i.e., a 1-min DVP signal or a 3-s DVP signal).

2.2.3. Hardware of PED

The hardware of the PED system consists of four major components, namely, the PPG sensor, analog circuits for filters and analog amplification, a data acquisition module (i.e., USB-6008 DAQ, National Instruments, Austin, TX), and a notebook computer for real data analysis (Figure 1). The system was used as a diagnostic tool by Ningxia Medical University Hospital. With a PED, many useful experiments and applications can also be conducted in a home medical setting.
The function of each component is described as follows:
  • a PPG sensor: one pair of infrared transmitter and receiver with a 940 nm wavelength;
  • analog filters: a 2nd order band pass filter, with cut-off frequencies of 0.48–10 Hz;
  • an analog amplification circuit: digital volume pulses (DVPs) with 1–10 mV;
  • a USB-6008 DAQ: a sampling frequency of 1000 Hz and 12-bit ADC with USB (DVPs stored in a computer for later computation);
  • a notebook computer for real data analysis.
Although 30-min DVPs on the index finger of the dominant hand were collected, with the PED as described previously in [22,23] for offline computation, the two 1-min digitized DVP signals were processed through the USB-6008 DAQ for the calculation of real-time parameters using the LabVIEW G programming language in the current study. Immediate information on all of the parameters in Section 2.2.1, therefore, can be provided for all testing subjects (Figure 2).

2.3. Statistical Analysis

All average values are expressed as mean ± SD. One sample Kolmogorov-Smirnov test was adopted for testing the normality of the distribution, while the Statistical Package for the Social Sciences (SPSS, version 14.0 for Windows, SPSS Inc. Chicago, II) was used for verifying the homoscedasticity of the variables. The significance of difference in anthropometric and computational parameters (i.e., CT, CTR, SI, FPI, and ΔfEmax) between the two groups was proven using an independent sample t-test. The correlation between ΔfEmax and risk factors for the two different groups was determined using Pearson’s correlation test. A probability value (p) of less than 0.05 was considered statistically significant.

3. Results

3.1. Characteristics of the Testing Subjects

Comparison of the demographic and anthropometric parameters of the testing subjects showed no remarkable difference in body height and body weight between the two groups (both p > 0.05). On the other hand, significantly lower levels of age as well as a reduced body mass index were noted in Group 1, compared with Group 2 (both p < 0.05) (Table 1).

3.2. Failure of CT, CTR, SI, and FPI Change during SY2 Attachment for a Group 1 Subject

There are very similar DVP waveforms before vs. after SY2 was attached for the case of one young man. This is the reason why SI, CT, and CTR were not changed very much. In addition, the finger perfusion became smaller (FPI = −9.82%) (Figure 3a). As for one 48-year-old woman in Group 2, the DVP waves increased after SY2 was attached, with a notable increase in finger perfusion (i.e., FPI = 70.89%), whereas SI, CT, and CTR were still not changed very much (Figure 3b). As shown in Figure 3b, both FPI and ΔfEmax successfully discriminated between the two states, in which SY2 was attached or not for the 48-year-old woman. The parameters (i.e., SI, CT, CTR, FPI, and ΔfEmax) were calculated in 10 s on the PED and were then provided for all testing subjects.

3.3. Comparison of Computational Parameters for Finger Blood Flow Assessment

3.3.1. Impact of Far-Infrared Fabric for Five Parameters in the Same Group

In terms of the impact of far-infrared fabric (i.e., Leadtek-SY2) on the five parameters in Group 1, no significant difference was noted in CT, CTR, FP, and SI (p = 0.721, 0.787, 0.845, and 0.493, respectively), whereas fEmax (p = 0.046) was higher before SY2 was attached than after SY2 was attached (Table 2). As for Group 2, there were still no significant differences noted in CT, CTR, FP, and SI (p = 0.652, 0.986, 0.219, and 0.297, respectively), whereas fEmax (p = 0.002) was higher before SY2 was attached than after SY2 was attached (Table 2).

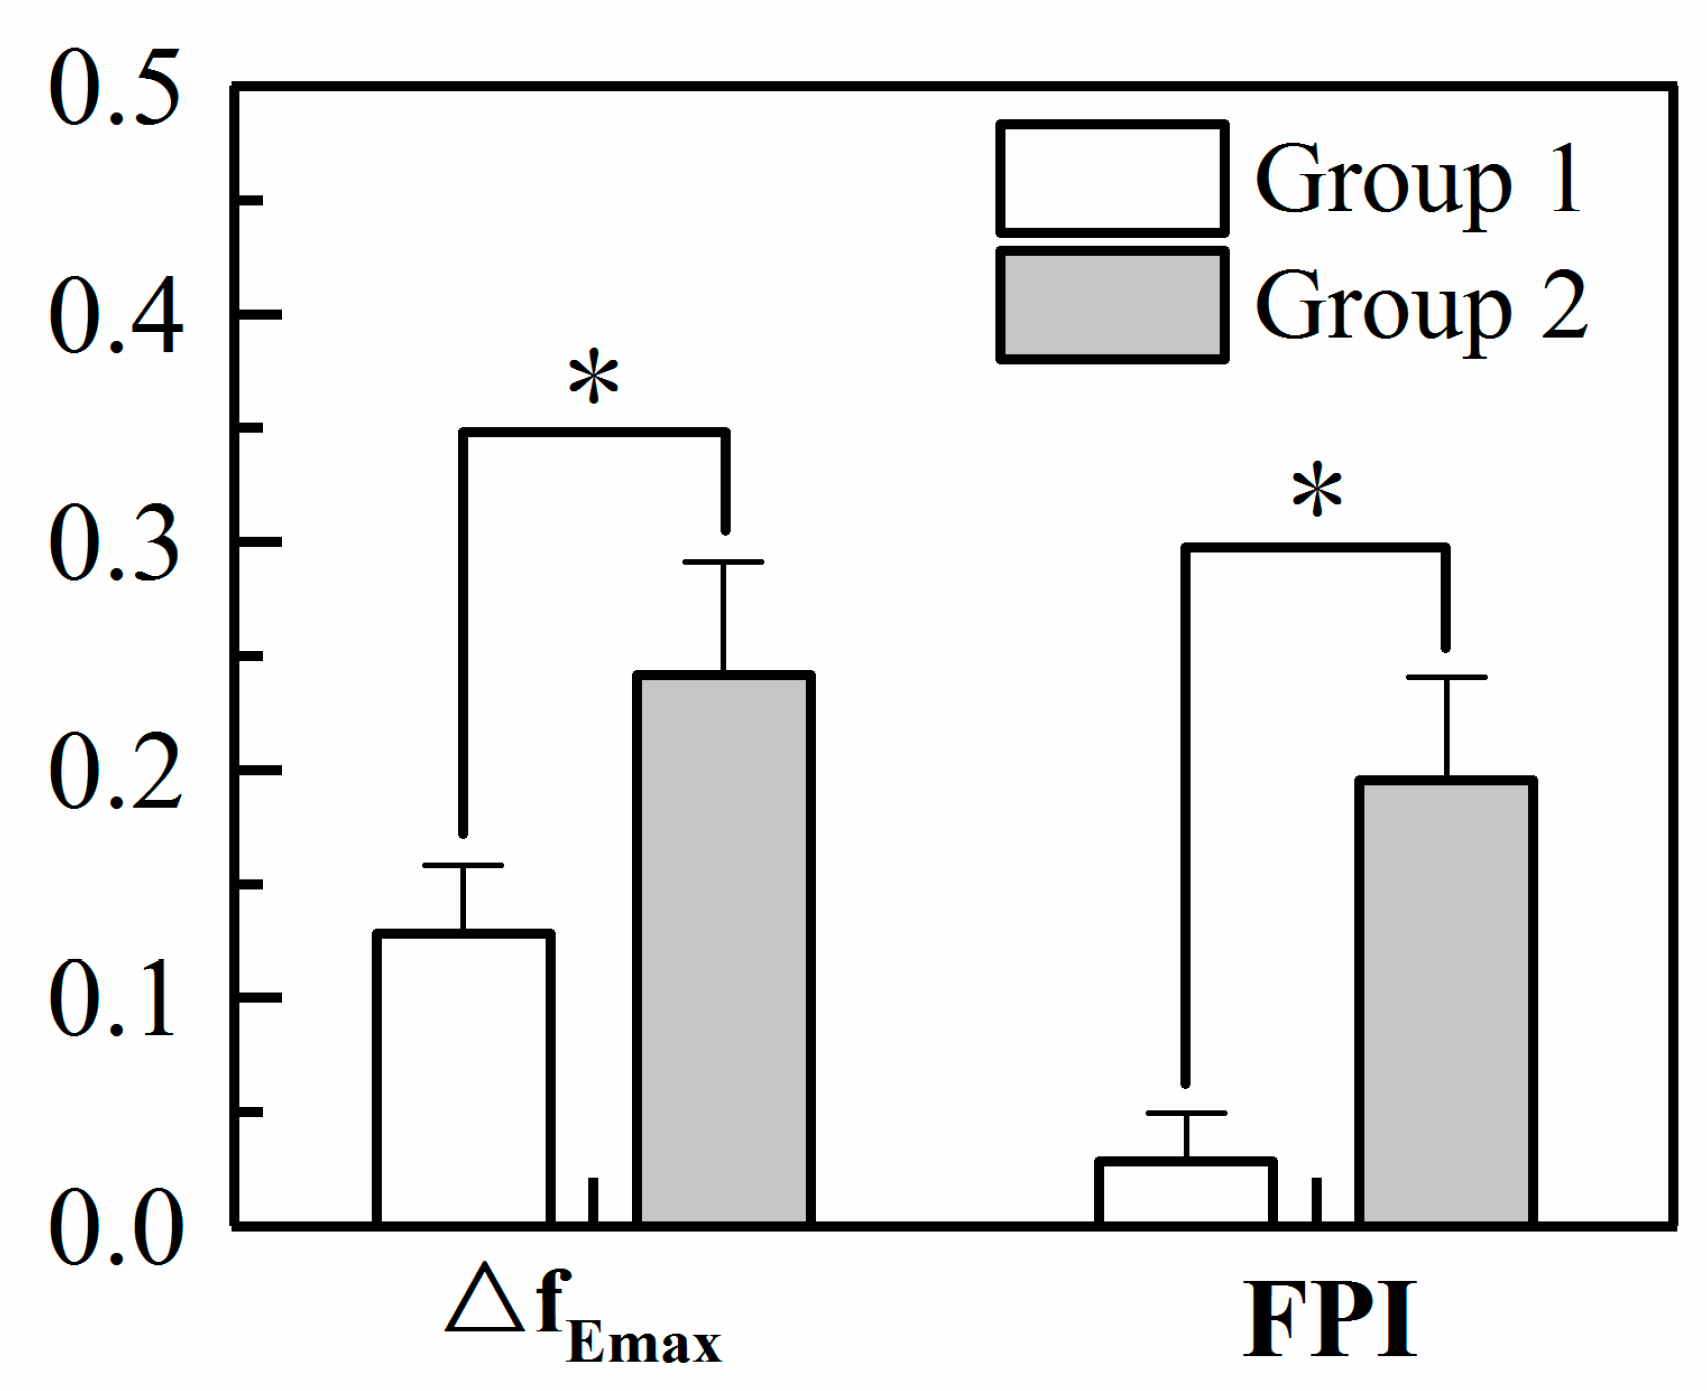
3.3.2. Comparison of FPI and ΔfEmax for the Two Groups

A significant difference was noted in FPI and ΔfEmax between the two groups (p = 0.002 and p = 0.043, respectively), with both values of FPI and ΔfEmax being lower in Group 1 than in Group 2 (Figure 4).

3.4. Multivariate Analysis for ΔfEmax

3.4.1. Correlations between ΔfEmax and Demographic and Anthropometric Parameters

Despite the lack of significant correlation between ΔfEmax and demographic and anthropometric parameters (i.e., age, body height, body weight, and BMI) for the subjects in Group 1, ΔfEmax was found to be positively associated with body weight (p = 0.021) and body mass index (BMI) (p = 0.005) (Table 3).

3.4.2. Multivariate Regression Analysis for ΔfEmax

The demographic and anthropometric parameters of the upper middle-aged subjects (i.e., Group 2) found to be significantly associated with ΔfEmax in this study using Pearson’s correlation test were body weight and body mass index (BMI), for which multivariate analysis was performed, as follows (p = 0.02):
Δ f Emax = 0.902 + 0.002 × Body   weight + 0.043 × BMI + error

4. Discussion

The clinical benefits of combined acupuncture-FIR heat lamps in enhancing peripheral perfusion and parasympathetic activity have been demonstrated [7]. Compared with FIR heat lamps, FIR-emitting ceramics, and fabrics with a low power of FIR can also be effective for finger blood perfusion. A microcirculation microscope has recently been introduced to reveal the finger blood flow changes by visualization, before and after the far-infrared fabric was attached to the wrist. There are some very interesting studies that focused on accurate measurements of finger blood flow velocity using a microcirculation image analysis system [10], magnetic resonance imaging [24], ultrasound [25], and a heat source chip and a temperature sensor [26]. However, those measuring instruments could be expensive, have complete technical independence, or be less portable. This study aimed to investigate the usefulness of a photoplethysmographic electrical device (PED) design, distinguishing healthy young subjects from elder subjects using quantitative data output. One PPG sensor, analog filtering and amplifying circuits, a USB-6008 DAQ open-ended program, and a notebook computer were needed for the PED in the present study, which it was able to provide quantitative data for proof of the effect of far-infrared fabric at a low cost.
As Figure 1 and Figure 2 show, a PED system was proposed, with the application of parameters (i.e., SI [14,17,19,20], CT and CTR [14,17], FPI [16,21], and ΔfEmax [17]) for finger blood flow (relative to microcirculation) assessment under the effect of far-infrared fabric. In general, microcirculation is known to be affected by cardiovascular risk factors, including aging, hypertension, and diabetes [27,28]. Therefore, both values of FPI and ΔfEmax in the present study were lower in Group 1 than in Group 2 (Figure 3). This verified the first hypothesis of this study that a PED can perform a quantitative index (i.e., FPI and ΔfEmax) on microvascular blood flow change due to the attachment of far-infrared fabric. Moreover, there was no significant difference noted in CT, CTR, FP, and SI (all p > 0.05) for the two groups, whereas fEmax (p < 0.05) was larger before SY2 was attached than after SY2 was attached (Table 2). In Table 2 with fEmax and in Figure 4 with FPI, significant differences are shown, but not in other parameters. It is shown that IMF5 best represents DVP signals, through which SI can be calculated. It was hypothesized in a previous study [17] that physiological information hidden in the inseparable signal of a noise-free IMF as reflected in the energy-frequency spectrum can be revealed through Hilbert–Huang spectrum analysis. The sensitivity and simplicity of the PED, shown in the present study, therefore have a significant implication for the development of the next generation of non-invasive portable finger microcirculation monitoring devices. In addition, people with high BMI may contribute to microvascular disease and affect clinical functional outcomes in the older population [29]. For healthy humans, body weight is a major determinant of the resting rate of muscle sympathetic nerve dysfunction [30]. This is consistent with the same findings that body weight and body mass index were found to be the two most important determining factors of finger microcirculation assessment in the present study (Table 3).
PPG is a non-invasive, low cost, and simple optical measurement technique applied at the fingertip to measure DVP signals for physiological parameters. Scientific interest has continued to look beyond the pulse oximetry and more into the new potential applications of this technology in clinical settings [31]. In the first generation of self-developed devices, utilizing 8-channel PPG and ECG, a previous study [16] showed significant elevations in peripheral blood flow and autonomic nervous function after acupuncture at zusanli st36 acupoint. However, the device had limitations. First, the process of data acquisition was time-consuming and took more than 30 min. Second, the offline computation for EEMD and short-time multiscale entropy index was not able to give immediate information to testing subjects. Furthermore, the first generation of proposed devices in [14] and [22] collected PPG signals for a very long period of time (i.e., 30 min) on the index finger, all for offline analysis for the computation of parameters. Although fEmax was computed using 5 min of sampled data in the first generation of self-developed devices in [17], offline computations also required the use of another package (i.e., Matlab) on a PC. On the other hand, the values of all parameters were averaged from DVPs in a selected time interval (i.e., a 1-min DVP signal for the comparison parameters or a 3-s DVP signal for instantaneous frequency difference), all for real-time computation in the new generation of self-developed devices (i.e., PED) in the current study.
This study has its limitations. First, although the current technique of PPG is a very popular non-invasive method of waveform contour analysis in assessing finger blood perfusion, the data obtained are always affected by various environmental and physiological factors. The conventional pulse wave velocity (PWV) was not measured in this study, because one pair of infrared transmitter and receiver was used. Secondly, it is not a large-scale investigation because of the limited number of subjects in each group. Thirdly, the DVP waveforms may also be affected by finger vibrations, which may lead to a distortion of the ensemble averaged signals for the subsequent CT, CTR, and SI determinations. Finally, only young and upper middle-aged healthy subjects were enrolled in this study, so the impact of disease on treatment outcomes was not evaluated.
Comparisons of the advantages and disadvantages of non-invasive devices for the evaluation of finger blood flow between the use of a microcirculation microscope and the method of the present study are summarized in Table 4.

5. Conclusions

The results of the current study not only propose a versatile photoplethysmographic electrical device for finger blood perfusion assessment under the effect of a far-infrared fabric, but also suggest the possibility of the clinical use of instantaneous frequency for FIR treatment. Moreover, with this self-developed device, many useful parameters and applications can be conducted by researchers. That is to say, the new generation of self-developed devices (i.e., PED) in the current study could be adopted in assessing the impact of acupuncture on peripheral blood flow and autonomic function for elder and overweight subjects. In addition, the PED could be used in the field of hyperbaric oxygen therapy for type 2 diabetes patients in glucose homeostasis improvement and diabetic foot wound care.

Author Contributions

Conceptualization: H.-C.W., J.-J.C., and H.-T.W.; data curation: Y.-Q.L., M.-X.X., and G.-S.W.; investigation: H.-C.W., X.-J.T., J.-J.C., and H.-T.W.; methodology: Y.-Q.L., M.-X.X., J.-J.C., and H.-T.W.; project administration: H.-C.W., X.-J.T., J.-J.C., and H.-T.W.; resources: H.-C.W., M.-X.X., and G.-S.W.; software: Y.-Q.L. and G.-S.W.; supervision: X.-J.T.; writing—original draft: H.-C.W. and H.-T.W. All authors have read and approved the submitted manuscript.

Funding

This research was funded by North Minzu University Scientific Research Projects (Major project No. 2019KJ37), the National Natural Science Foundation of China (No. 61861001), the Ningxia Municipal Health Commission Project (No.2018NW007), and the “Tian Cheng Hui Zhi” Innovation & Education Fund of the Chinese Ministry of Education (No. 2018A01016).

Acknowledgments

The authors are grateful for the support of LEADTEK Research Inc., New Taipei City, Taiwan, in sponsoring the far-infrared fabric and assisting in noninvasive instruments as a contribution to preventive medicine in this study. The authors would like to thank the Guest editors and Reviews for their insightful recommendations and honorable suggestions, which have contributed to the improvement of this work. Data processing was supported by the Ningxia Technology Innovative Team of Advanced Intelligent Perception & Control and the Key Laboratory of Intelligent Perception Control at North Minzu University.

Conflicts of Interest

The authors declare that there is no conflict of interest.

Abbreviations

BMIBody Mass Index
CTCrest Time
CTRCrest Time Ratio
DVPDigital Volume Pulse
ECGElectrocardiography
EMDEnsemble Empirical Mode Decomposition
fEmaxinstantaneous frequency of maximal energy
FIRFar-Infrared Radiation
FPFinger Perfusion
FPIFinger Perfusion Index
HHTHilbert–Huang transformation
IMF5the 5th decomposed Intrinsic Mode Function
LabVIEWLaboratory Virtual Instrumentation Engineering Workbench
MatlabMATrix LABoratory
PCPersonal Computer
PEDPhotoplethysmographic Electrical Device
PPGPhotoplethysmography
PWVPulse Wave Velocity
RRIR-R Interval of ECG
SIStiffness Index
SPSSStatistical Package for the Social Sciences
SY2a far infrared fabric
SDStandard Deviation
ΔfEmaxinstantaneous frequency difference

References

  1. Vatansever, F.; Hamblin, M.R. Far infrared radiation (FIR): Its biological effects and medical applications. Photonics Lasers Med. 2012, 4, 255–266. [Google Scholar] [CrossRef] [Green Version]
  2. Inoue, S.; Kabaya, M. Biological activities caused by far infrared radiation. Int. J. Biometeorol. 1989, 33, 145–150. [Google Scholar] [CrossRef]
  3. Pang, X.-F. Vibrational energy-spectra of protein molecules and non-thermally biological effect of infrared light. Int. J. Infrared Millim. Waves 2001, 22, 291–307. [Google Scholar] [CrossRef]
  4. Akasaki, Y.; Miyata, M.; Eto, H.; Shirasawa, T.; Hamada, N.; Ikeda, Y.; Biro, S.; Otsuji, Y.; Tei, C. Repeated thermal therapy up-regulates endothelial nitric oxide synthase and augments angiogenesis in a mouse model of hindlimb ischemia. Circ. J. 2006, 70, 463–470. [Google Scholar] [CrossRef] [PubMed] [Green Version]
  5. Lin, C.C.; Chang, C.F.; Lai, M.Y.; Chen, T.W.; Lee, P.C.; Yang, W.C. Far-infrared therapy: A novel treatment to improve access blood flow and unassisted patency of arteriovenous fistula in hemodialysis patients. J. Am. Soc. Nephrol. 2007, 18, 985–992. [Google Scholar] [CrossRef] [PubMed] [Green Version]
  6. Yu, S.Y.; Chiu, J.H.; Yang, S.D.; Hsu, Y.C.; Liu, W.Y.; Wu, C.W. Biological effect of far-infrared therapy on increasing skin microcirculation in rats. Photodermatol. Photoimmunol. Photomed. 2006, 22, 78–86. [Google Scholar] [CrossRef]
  7. Yang, C.C.; Lin, G.M.; Wang, J.H.; Chu, H.C.; Wu, H.T.; Chen, J.J.; Sun, C.K. Effects of combined far-infrared radiation and acupuncture at ST36 on peripheral blood perfusion and autonomic activities. Evidence-Based Complement. Altern. Med. 2017, 2017, 1947315. [Google Scholar] [CrossRef] [Green Version]
  8. Yoo, B.H.; Park, C.M.; Oh, T.J.; Han, S.H.; Kang, H.H.; Chang, I.S. Investigation of jewelry powders radiating far-infrared rays and the biological effects on human skin. J. Cosmet. Sci. 2002, 53, 175–184. [Google Scholar]
  9. Meng, J.; Jin, W.; Liang, J.; Ding, Y.; Gan, K.; Yuan, Y. Effects of particle size on far infrared emission properties of tourmaline superfine powders. J. Nanosci. Nanotechnol. 2010, 10, 2083–2087. [Google Scholar] [CrossRef]
  10. Chen, S.Z.; Li, J.; Li, X.Y.; Xu, L.S. Effects of vacuum-assisted closure on wound microcirculation: An experimental study. Asian J. Surg. 2005, 28, 211–217. [Google Scholar] [CrossRef] [Green Version]
  11. Baran, U.; Shi, L.; Wang, R.K. Capillary blood flow imaging within human finger cuticle using optical microangiography. J. Biophotonics 2015, 8, 46–51. [Google Scholar] [CrossRef] [PubMed] [Green Version]
  12. Komatsu, K.-I.; Fukutake, T.; Hattori, T. Fingertip photoplethysmography and migraine. J. Neurol. Sci. 2003, 216, 17–21. [Google Scholar] [CrossRef]
  13. Korhonen, I.; Yli-Hankala, A. Photoplethysmography and nociception. Acta Anaesthesiol. Scand. 2009, 53, 975–985. [Google Scholar] [CrossRef]
  14. Hsu, P.C.; Wu, H.T.; Sun, C.K. Assessment of subtle changes in diabetes-associated arteriosclerosis using photoplethysmographic pulse wave from index finger. J. Med. Syst. 2018, 42, 43. [Google Scholar] [CrossRef] [PubMed]
  15. Wu, H.T.; Lin, B.Y.; Yang, C.C.; Ou, Y.N.; Sun, C.K. Assessment of vascular health with photoplethysmographic waveforms from the fingertip. IEEE J. Biomed. Health Inform. 2017, 21, 382–386. [Google Scholar] [CrossRef] [PubMed]
  16. Yang, C.C.; Wu, H.T.; Chuang, W.Y.; Liu, T.C.; Tsai, I.T.; Chen, J.J.; Sun, C.K. Application of short time MSE in assessing the impact of acupuncture on peripheral blood flow and autonomic activities in normal and overweight subjects. J. Med. Biol. Eng. 2016, 36, 386–395. [Google Scholar] [CrossRef]
  17. Wei, H.C.; Xiao, M.X.; Chen, H.Y.; Li, Y.Q.; Wu, H.T.; Sun, C.K. Instantaneous frequency from Hilbert-Huang transformation of digital volume pulse as indicator of diabetes and arterial stiffness in upper-middle-aged subjects. Sci. Rep. 2018, 8, 15771. [Google Scholar] [CrossRef]
  18. Krzymińska-Siemaszko, R.; Fryzowicz, A.; Czepulis, N.; Kaluźniak-Szymanowska, A.; Dworak, L.B.; Wieczorowska-Tobis, K. The impact of the age range of young healthy reference population on the cut-off points for low muscle mass necessary for the diagnosis of sarcopenia. Eur. Rev. Med. Pharm. Sci. 2019, 23, 4321–4332. [Google Scholar] [CrossRef]
  19. Millasseau, S.; Kelly, R.; Ritter, J.; Chowienczyk, P. Determination of age-related increases in large artery stiffness by digital pulse contour analysis. Clin. Sci. 2002, 103, 371–377. [Google Scholar] [CrossRef] [Green Version]
  20. Alty, S.R.; Angarita-Jaimes, N.; Millasseau, S.C.; Chowienczyk, P.J. Predicting arterial stiffness from the digital volume pulse waveform. IEEE Trans. Biomed. Eng. 2007, 54, 2268–2275. [Google Scholar] [CrossRef]
  21. Wu, H.T.; Liu, C.C.; Lin, P.H.; Chung, H.M.; Liu, M.C.; Yip, H.K.; Liu, A.B.; Sun, C.K. Novel application of parameters in waveform contour analysis for assessing arterial stiffness in aged and atherosclerotic subjects. Atherosclerosis 2010, 213, 173–177. [Google Scholar] [CrossRef] [PubMed]
  22. Wu, H.T.; Hsu, P.C.; Lin, C.F.; Wang, H.J.; Sun, C.K.; Liu, A.B.; Lo, M.T.; Tang, C.J. Multiscale entropy analysis of pulse wave velocity for assessing atherosclerosis in the aged and diabetic. IEEE Trans. Biomed. Eng. 2011, 58, 2978–2981. [Google Scholar] [PubMed]
  23. Wu, H.T.; Lee, K.W.; Pan, W.Y.; Liu, A.B.; Sun, C.K. Difference in bilateral digital volume pulse as a novel noninvasive approach to assessing arteriosclerosis in aged and diabetic subjects: A preliminary study. Diabetesvasc. Dis. Res. 2017, 14, 254–257. [Google Scholar] [CrossRef] [PubMed]
  24. Klarhofer, M.; Csapo, B.; Balassy, C.; Szeles, J.C.; Moser, E. High-resolution blood flow velocity measurementsin the human finger. Magn. Reson. Med. 2001, 45, 716–719. [Google Scholar] [CrossRef]
  25. Zhang, T.; Xia, L.H.; Bian, Y.Y.; Feng, B.; Wang, C.; Meng, F.X.; Zhang, Y.H.; Chen, M. Blood flow of the acral finger arterioles in patients with type 2 diabetes by quality doppler profiles. Cell Biochem. Biophys. 2013, 67, 717–725. [Google Scholar] [CrossRef] [Green Version]
  26. Fu, Y.; Wang, Q.Y.; Yi, J.B.; Song, D.; Xiang, X. A numerical model of blood flow velocity measurement based on finger ring. J. Healthc. Eng. 2018, 2018, 3916481. [Google Scholar]
  27. Li, L.; Mac-Mary, S.; Sainthillier, J.-M.; Nouveau, S.; de Lacharriere, O.; Humbert, P. Age-related changes of the cutaneous microcirculation in vivo. Gerontology 2006, 52, 142–153. [Google Scholar] [CrossRef]
  28. Hile, C.; Veves, A. Diabetic neuropathy and microcirculation. Curr. Diab. Rep. 2003, 3, 446–451. [Google Scholar] [CrossRef]
  29. Selim, M.; Jones, R.; Novak, P.; Zhao, P.; Novak, V. The effects of body mass index on cerebral blood flow velocity. Clin Auton Res. 2008, 18, 331–338. [Google Scholar] [CrossRef] [Green Version]
  30. Scherrer, U.; Randin, D.; Tappy, L.; Vollenweider, P.; Jequier, E.; Nicod, P. Body fat and sympathetic nerve activity in healthy subjects. Circulation 1994, 89, 2634–2640. [Google Scholar] [CrossRef] [Green Version]
  31. Castaneda, D.; Esparza, A.; Ghamari, M.; Soltanpur, C.; Nazeran, H. A review on wearable photoplethysmography sensors and their potential future applications in health care. Int. J. Biosens. Bioelectron. 2018, 4, 195–202. [Google Scholar] [CrossRef] [PubMed] [Green Version]
Figure 1. Photoplethysmographic electrical device (PED) system. This system consists of (A) one photoplethysmography sensor, (B) filtration and amplification circuits, and a USB-6008 DAQ, and (C) a notebook computer for real data analysis. It can have great potential in both research and clinical applications.
Electronics 09 00138 g001
Figure 2. Hardware block diagram of the PED system. After filtration and amplification, waveform signals from the photoplethysmography (PPG) sensor went through a USB-6008 DAQ, which stored the digitized digital volume pulse signals in a computer using the LabVIEW G programming language for data analysis, evaluating the applications of PPG contour analysis in the time domain and the Hilbert–Huang transformation (HHT) domain. CT: crest time (i.e., time from the foot point to the peak of a waveform); CTR: crest time ratio; FPI: finger perfusion index; SI: stiffness index; ΔfEmax: instantaneous frequency difference (i.e., fEmax: the instantaneous frequency of maximal energy, before the use of far-infrared fabric (SY2); fEmaxSY2: the instantaneous frequency of maximal energy with the SY2 attached).
Electronics 09 00138 g002
Figure 3. Representative illustrations of the original DVP waveforms for 60 s and 3 s, intrinsic mode function 5 (IMF5) after ensemble empirical decomposition (EEMD), and the marginal spectral density of IMF5 from the dominant index fingertip. (a) DVP waveforms from a healthy 20-year-old man in Group 1. Left panel: waveforms before SY2 was attached, with the following calculated parameters: SI = 5.25 m/s, CT = 0.19 s, CTR = 0.15. Right panel: waveforms after SY2 was attached, with the following calculated parameters: SI = 5.40 m/s, CT = 0.20 s, CTR = 0.15, FPI = −9.82%, ΔfEmax = −0.05 (Hz). (b) DVP waveforms from a healthy 48-year-old woman in Group 2. Left panel: waveforms before SY2 was attached, with the following calculated parameters: SI = 5.41 m/s, CT = 0.20 s, CTR = 0.14. Right panel: waveforms after SY2 was attached, with the following calculated parameters: SI = 5.24 m/s, CT = 0.20 s, CTR = 0.15, FPI = 70.89%, ΔfEmax = 0.88 (Hz). These figures elevated the instantaneous frequency corresponding to the maximal energy (i.e., fEmax vs. fEmaxSY2) in the healthy young man, compared to the elder healthy subject.
Electronics 09 00138 g003aElectronics 09 00138 g003b
Figure 4. Comparison of two different parameters, FPI and ΔfEmax, between healthy young and healthy upper middle-aged subjects. Group 1: healthy young volunteers; Group 2: healthy upper middle-aged volunteers. FPI: finger perfusion index; ΔfEmax: instantaneous frequency difference; * p < 0.05 Group 1 vs. Group 2.
Electronics 09 00138 g004
Table 1. Comparison of demographic and anthropometric parameters between young and upper middle-aged subjects.
ParametersGroup 1
Male/Female: 44/22
Group 2
Male/Female: 17/16
P Value
Age (years)21.26 ± 2.4155.97 ± 11.88 **0.000
Body height (cm)169.23 ± 8.23167.15 ± 8.260.240
Body weight (kg)62.27 ± 12.0167.11 ± 10.810.054
BMI (kg/m2)21.61 ± 3.1123.93 ± 2.87 *0.001
Group 1: young subjects; Group 2: upper middle-aged subjects; values are expressed as mean ± SD; BMI = body mass index. * p < 0.05 Group 1 vs. Group 2; ** p < 0.001 Group 1 vs. Group 2.
Table 2. Changes in parameters from PED for without/with SY2 attachment in the same group of testing subjects.
Group 1Group 2
Pre-SY2Post-SY2Pre-SY2Post-SY2
CT (s)0.16 ± 0.030.17 ± 0.030.24 ± 0.050.23 ± 0.05
CTR0.14 ± 0.020.13 ± 0.020.16 ± 0.030.15 ± 0.03
FP (mV*s)4407.72 ± 1504.804458.50 ± 1482.615819.01 ± 2956.276905.21 ± 3920.59
SI (m/s)5.42 ± 0.665.34 ± 0.675.41 ± 0.925.17 ± 0.91
fEmax (Hz)2.28 ± 0.352.15 ± 0.38 *1.99 ± 0.301.75 ± 0.31 **
Group 1: young subjects; Group 2: upper middle-aged subjects; Pre-SY2: before far-infrared fabric was attached; Post-SY2: after far-infrared fabric was attached; values are expressed as mean ± SD; CT: crest time; CTR: crest time ratio; FP: finger perfusion; SI: stiffness index; fEmax: instantaneous frequency of maximal energy. * p < 0.05 Pre-SY2 vs. Post-SY2; ** p < 0.01 Pre-SY2 vs. Post-SY2.
Table 3. Pearson correlations between the instantaneous frequency difference ΔfEmax and demographic and anthropometric parameters in young and upper middle-aged subjects.
Group 1
Male/Female: 44/22
Group 2
Male/Female: 17/16
Age (years)r = −0.009
p = 0.945
r = −0.014
p = 0.937
Body height (cm)r = −0.041
p = 0.744
r = 0.103
p = 0.567
Body weight (kg)r = −0.073
p = 0.561
r = 0.401
p = 0.021 *
BMI (kg/m2)r = −0.054
p = 0.668
r = 0.477
p = 0.005 **
Group 1: healthy young subjects; Group 2: healthy upper middle-aged subjects; * p < 0.05 Group 1 vs. Group 2. ** p < 0.01 Group 1 vs. Group 2. BMI: body mass index; |r| ≦ 0.3: Pearson correlation of low significance; 0.3 ≦ |r| ≦ 0.7: Pearson correlation of moderate significance.
Table 4. Comparisons of advantages and disadvantages of non-invasive far infrared fabric effects verified in previous investigations and the present study.
AdvantagesDisadvantages
microcirculation microscope (DMX 980)
non-invasive and real time
reveals finger blood flow changes before and after far infrared fabric used, respectively
good versatility
visual effects of microvascular blood flow
fast operation
portable
no quantitative data output
poor expandability
expensive, about 1000 USD
Photoplethysmographic Electrical Device (PED)
non-invasive and real time
a self-developed, time-efficient, and economical device
embedded systems
good extensibility, many quantitative indexes for microvascular blood flow
low-cost photoplethysmographic and analysis software required
Signal acquisition from infrared sensors may be affected by circulation characteristics, involuntary vibrations, and temperature-induced changes in blood flow to the finger.
PPG sensor pressure affects the contour of waveforms.

