Perspective

Perspective on Commercial Li-ion Battery Testing, Best Practices for Simple and Effective Protocols

Hawaii Natural Energy Institute, University of Hawaii, 1680 East West Road, POST 109, Honolulu, HI 96815, USA
*
Author to whom correspondence should be addressed.
Electronics 2020, 9(1), 152; https://doi.org/10.3390/electronics9010152
Submission received: 14 December 2019 / Revised: 6 January 2020 / Accepted: 8 January 2020 / Published: 14 January 2020

Abstract

:
Validation is an integral part of any study dealing with modeling or development of new control algorithms for lithium ion batteries. Without proper validation, the impact of a study could be drastically reduced. In a perfect world, validation should involve testing in deployed systems, but it is often unpractical and costly. As a result, validation is more often conducted on single cells under control laboratory conditions. Laboratory testing is a complex task, and improper implementation could lead to fallacious results. Although common practice in open literature, the protocols used are usually too quickly detailed and important details are left out. This work intends to fully describe, explain, and exemplify a simple step-by-step single apparatus methodology for commercial battery testing in order to facilitate and standardize validation studies.

Graphical Abstract

1. Introduction

Today’s world relies more and more on energy storage technologies and, with several government incentives for larger integration of zero-emission electricity storage in electromobility and stationary applications, the demand will keep increasing in the future [1]. To match this demand, battery technology must improve year after year. To be more than incremental, such improvement could take the form of disruptive battery technologies [2,3] and, equally as important, the form of improved battery management systems with innovative control strategies to enable more efficient and safer battery packs. The latter topic is attracting enormous amount a research and a wide variety of algorithms have been proposed in recent years [4,5,6,7,8] for state-of-charge (SOC) and state-of-health (SOH) tracking. For all these studies, there is a dire need for experimental validation so that the effectiveness of the proposed methodology can be demonstrated. This is often neglected, and some studies, as promising as they could be, are disregarded because the work was not properly validated in the laboratory.
Laboratory testing is an expensive and complex task, especially when trying to replicate the behavior of large deployed battery packs such as the ones in electric vehicles or grid storage systems. Laboratory results can become non-significant if cells are not handled and characterized properly. In regard to characterization, laboratory testing at scale is often not possible because of logistical and cost limitations; most of the testing must then be performed at a much smaller scale and under slightly different conditions. This raises concerns about the presumptions that the tested cells are representative of the batch, the duty cycle is relevant to the application, and the pack behaves similarly to single cells at scale. To address the representativity issue, cell-to-cell variations need to be studied and quantified. To address the relevance issue, duty cycles must be illustrative of application data. To address the degradation and state-of-health issue, cells need to be periodically characterized in a non-intrusive and non-destructive way.
The purpose of this publication is to complement [9,10] and describe, in more detail than typical publications, a testing strategy to address all these issues together. This is meant to provide newcomers and non-battery specialists some details, definitions, and explanations on how to perform simple and effective battery testing in order to improve validation studies. This publication does not aim to compare different approaches to testing protocols nor discuss the complex question of battery SOH, such discussions can be found in [9,10], respectively, but is intended to describe the Hawaii Natural Energy Institute (HNEI) methodology. In the past decade and a half, HNEI has been in the forefront of the development of methodologies to improve non-intrusive characterization of commercial lithium ion cells to extract maximum relevant information from minimum amount of testing and instrumentation. In that timeframe, we tested over 1000 commercial cells and published upwards of 50 highly cited publications on commercial battery testing and modeling.
The HNEI testing strategy consists of five elements, Figure 1. First, a preparation step must be executed to assure the cells are properly installed, the testers are accurately calibrated, and the compulsory safety precautions are strictly implemented. Second, a formation protocol must be performed to verify the cell quality relative to the batch. Third, a reference performance test (RPT) should be completed at regular intervals to assess the evolution of battery performance over time. Fourth, a repetitive duty cycle is required to mimic battery usage for a given application. Lastly, an end-of-test evaluation is undertaken to provide a detailed characterization of cell performance at the end of life, which includes a final RPT and, if deemed necessary, some post-mortem analyses [11,12].

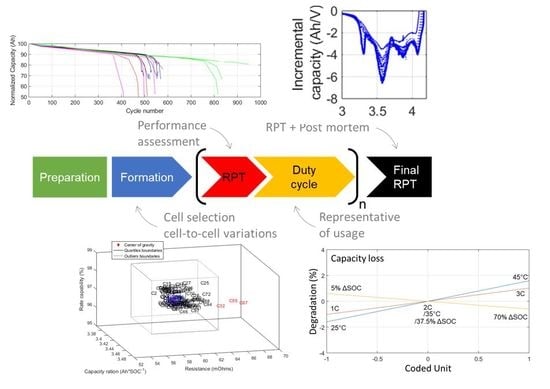
2. Methods and Discussion

2.1. Test Preparation

A recent study by Taylor et al. [13] showed that, without careful consideration, slight differences in the experimental setup could induce up to 4% difference in experimental results on similar cells. This error has environmental and procedural origins [13]. The environmental errors could stem from the ambient temperature and humidity; the equipment calibration, accuracy, and resolution; or the different manufacturing tolerances of the equipment and battery used. Procedural errors are induced during the testing, and include many circumstances such as moving a sample, loosening a connection, or not allowing batteries to acclimate to a new temperature properly [13].
Such a high error could drastically influence the conclusions of a study. Thus, steps should be taken to minimize it. First, battery tester calibrations should be verified. Second, battery holder contacts must be cleaned to avoid the possible impact of oxidation. Third, the placement of the connector cables and eventual spacers must be consistent. The measurement cables must be as close as possible to the battery tabs. In case of 4-point connection (2 for voltage, 2 for current), it is recommended that the current and voltage cables do not touch each other [13]. Fourth, the torque on the connections must be carefully controlled and kept constant. Taylor et al. [13] found the optimal torque to be 12.5 Nm for their connectors. If possible, all cells belonging to one set of experiments should be tested on the same machine and in the same temperature chamber if temperature is not a variable. Finally, thermocouples must be added, and their placement should also be consistent (same position, same amount of tape, etc.). With those steps, the experimental error should be limited to below 1% [13].
Another essential aspect to take into consideration while preparing an experiment is safety. Even if no abusive testing is performed, failure is always an option. Modern batteries pack a lot of energy as 55Ah worth of batteries is equivalent to the energy of a hand grenade (150 g of TNT) [14]. When first received, the batteries should be unpacked under a fume hood to prevent any exposure from potential electrolyte leakage during transport [14]. They should then be thoroughly checked for any physical damage, leak, or defect. Defective batteries should be disposed according to local health and environmental safety office recommendations. For storage, batteries should be discharged a low to mid SOCs, vacuum sealed in non-metallized plastic bag, and frozen to −27 °C in a commercial freezer. This is because low temperatures and SOCs were shown effective to prevent impact of calendar aging for all the major commercial Li-ion chemistries [15]. A plan should also be in place in case batteries undergo thermal runaway during testing. A discussion on thermal runaway is out of the scope of this publication and interested readers should refer to [16,17,18,19]. To maximize safety, all cells should be tested in temperature chambers with significant exhaust ventilation to evacuate fumes quickly in case of failure. Moreover, temperature should always be monitored as it is an excellent indicator of failure [16,17,18,19]. If cell temperature exceeds 80 °C, all testing should be stopped, and the temperature monitored closely for the next hour. Electrolyte decomposition is an exothermic reaction and if happening, the temperature of the cell will continue to rise. Therefore, if the cell temperature returns to room temperature quickly, the risk of dramatic failure is low. Some cooling aid could be applied to the cells in the form of ice packs [14]. Once cooled, and as precaution, the cell should be transferred to a sand-filled bucket [14], if possible, made of earthenware. Sand offers the advantage of acting like a sponge for any leak of boiling electrolyte without the risk of burning or melting. The container must be kept sealed, outdoor but protected from weather, and temperature monitored for 72 h. If the temperature keeps increasing, the risk of failure is high. Extreme caution must be exercised as venting or explosion is possible at any moment without notice. Standard operating procedures and proper training should be installed to be able to handle such events quickly and safely. These procedures could include aggressive cooling solutions such as ice packs, dry ice, and CO2 fire extinguishers and the placement of fire blankets over the overheated cell and on the adjacent cells to prevent propagation. Personal protective equipment such as heat resistant gloves, a fire-retardant lab-coat, and a full-face respirator, must be used in all cases. An adapted first aid kit must also be in close proximity [14].

2.2. Formation

Before the start of any cycle-life evaluation, it is extremely important to identify and quantify the nature of cell-to-cell variations within a batch of cells [20,21,22,23,24,25]. A discussion on their origins is out of the scope of this publication and interested readers should refer to an article by Rumpf et al. [26]. The results of the formation tests are not reported often enough. Several strategies are available in the literature from C/3 discharge and 50% SOC resistance test [27] to protocols such as HNEI’s initial conditioning characterization test (ICCT) [28,29,30,31]. Lasting less than a week, the ICCT consists only of C/2 and C/5 cycles, Figure 2, and serves two purposes. The first is to verify that the cells are working as they should be and that the solid electrolyte interphase layers are properly formed [32]. The second is to calculate the three parameters that were shown to be critical in determining the manufacturing variability in a batch of cells [28]. For the ICCT and all the other protocols in this publication, data collection must be controlled to ensure enough information is gathered while limiting file size. We recommend some variable time steps aiming for 2000 points per step. For the C/5 step that is supposed to last around 5 h, 1 point should be recorded every 9 s. For the C/2 cycle, that measurement rate is accelerated to 1 point every 3.6 s.
Figure 2 details the ICCT protocol. The aim of the first step is capacity stabilization. It is recommended to start by performing a few charge and discharge cycles (up to 6) to ensure the SEI layer on the negative electrode is properly formed. Once the capacity is stabilized (less than 0.2% difference between two consecutive cycles), the second step can be started. The second step consists of C/2 (discharge in 2 h) and C/5 (discharge in 5 h) discharges with 4-h rests and the manufacturer-recommended charging protocol.
The capacities and rest cell voltages (RCV), i.e., the voltage measured at the end of a resting period, measured throughout this test are used to calculate the three attributes that are critical in determining the manufacturing variability in a batch of cells. In order to fully characterize a batch of cells, it is important to fully compare the capacity vs. rate relationship for each cell. This relationship is not straightforward and it can be divided into 3 sections, Figure 3a.
In the first section at low rates, the capacity is constant because it is only limited by the amount of lithium that can be exchanged. This corresponds to the cell maximum capacity and it can be characterized by calculating the capacity ration (Qr, in mAh/% SOC, Figure 3b). The term capacity ration refers to the capacity (Ah) obtained for each one percent of SOC. RCV measurements at the beginning of discharge (BOD) and the end of discharge (EOD) are used to derive a SOC range by interpolation of the maximum and minimum SOCs (e.g., 99.7%–3.2%) from an open circuit voltage (OCV) vs. SOC curve. The capacity ration is then calculated by dividing the capacity returned during discharge by the SOC range variation. The maximum capacity corresponds to 100 x Qr, the capacity for 100% SOC.
In the second section at medium rates, the capacity becomes also limited by diffusion [33] and starts decreasing with rate following a power law. This section can be characterized either by the Peukert coefficient [34] or the rate capability (rC, Figure 3c). The Peukert coefficient [34] can be calculated by fitting the data in the middle section to a C = Int equation where n is the Peukert coefficient, I the current, and t the nominal discharge time for a specific C-rate. The rate capability represents a cell’s ability to deliver capacity when the discharge rate increases. It can be calculated by dividing the capacities at C/2 by the C/5 ones. Both parameters are unitless and, with only two rates tested in the ICCT, rC if often more appropriate.
In the last section, at high rates, in addition to being limited by the amount of lithium and diffusion, the capacity starts to be affected by polarization pushing some capacity outside of the potential window. This can be characterized by measuring the ohmic resistance (R, in Ohms, Figure 3d) [28]. The ohmic resistance represents the contact resistance of the cell in the circuit and the conductive resistance of the cell (which primarily comes from the electrolyte). Although several methods could be used to estimate the resistance, such as electrochemical impedance spectroscopy (EIS), the resistance estimation can be obtained simply by using the initial voltage drop associated with the C/2 and C/5 discharges. The method is based on the linear regime of the Tafel behavior [35] which, for small currents, shares some formal similarity with Ohm’s law. Figure 4a presents the calculation process that was described previously in [36]. If the cells were previously charged to the exact same SOC prior to the C/5 and C/2 discharges, i.e., that the RCVs were similar, the initial IR drop can be used to determine the resistance. To calculate the resistance, the measured voltage must be plotted as a function of rate or current. The slope of the curve is the resistance, normalized or not. It must be noted that if the data are gathered at different time steps for different rates, priority must be set on selecting points with similar elapsed time after the application of current. This approach is also valid to characterize the resistance evolution with temperature and aging.
Once the three attributes are calculated for all the cells in a batch, the statistical analysis of the cell-to-cell variations can be performed, and the normality of the three attributes examined. A convenient way to report the data is to represent all three attributes in a 3D space of which an example is presented in Figure 4b. To help visualize the cell-to-cell variations better, a couple of visual cues can be added to the plot. First, a full-line rectangle, in which the boundaries correspond to the lower and upper quartiles (i.e., the 75th and 25th percentiles of the data) for the three attributes of cell-to-cell variations. Cells located within this rectangle, color-coded in blue, are the closest to batch center of gravity (the median values for all three attributes) and can be considered the core of the batch. A second dotted rectangle, three times larger than the first one, was also added. Three times the interquartile range is often statistically considered as the outliers’ boundaries. Cells located outside of the outliers’ boundaries were color-coded in red and are excluded from further experimentation. In the example shown in Figure 4b, most cells were consistent. However, there were three cells that exhibited resistances higher than normal and, therefore, their use should be discontinued.

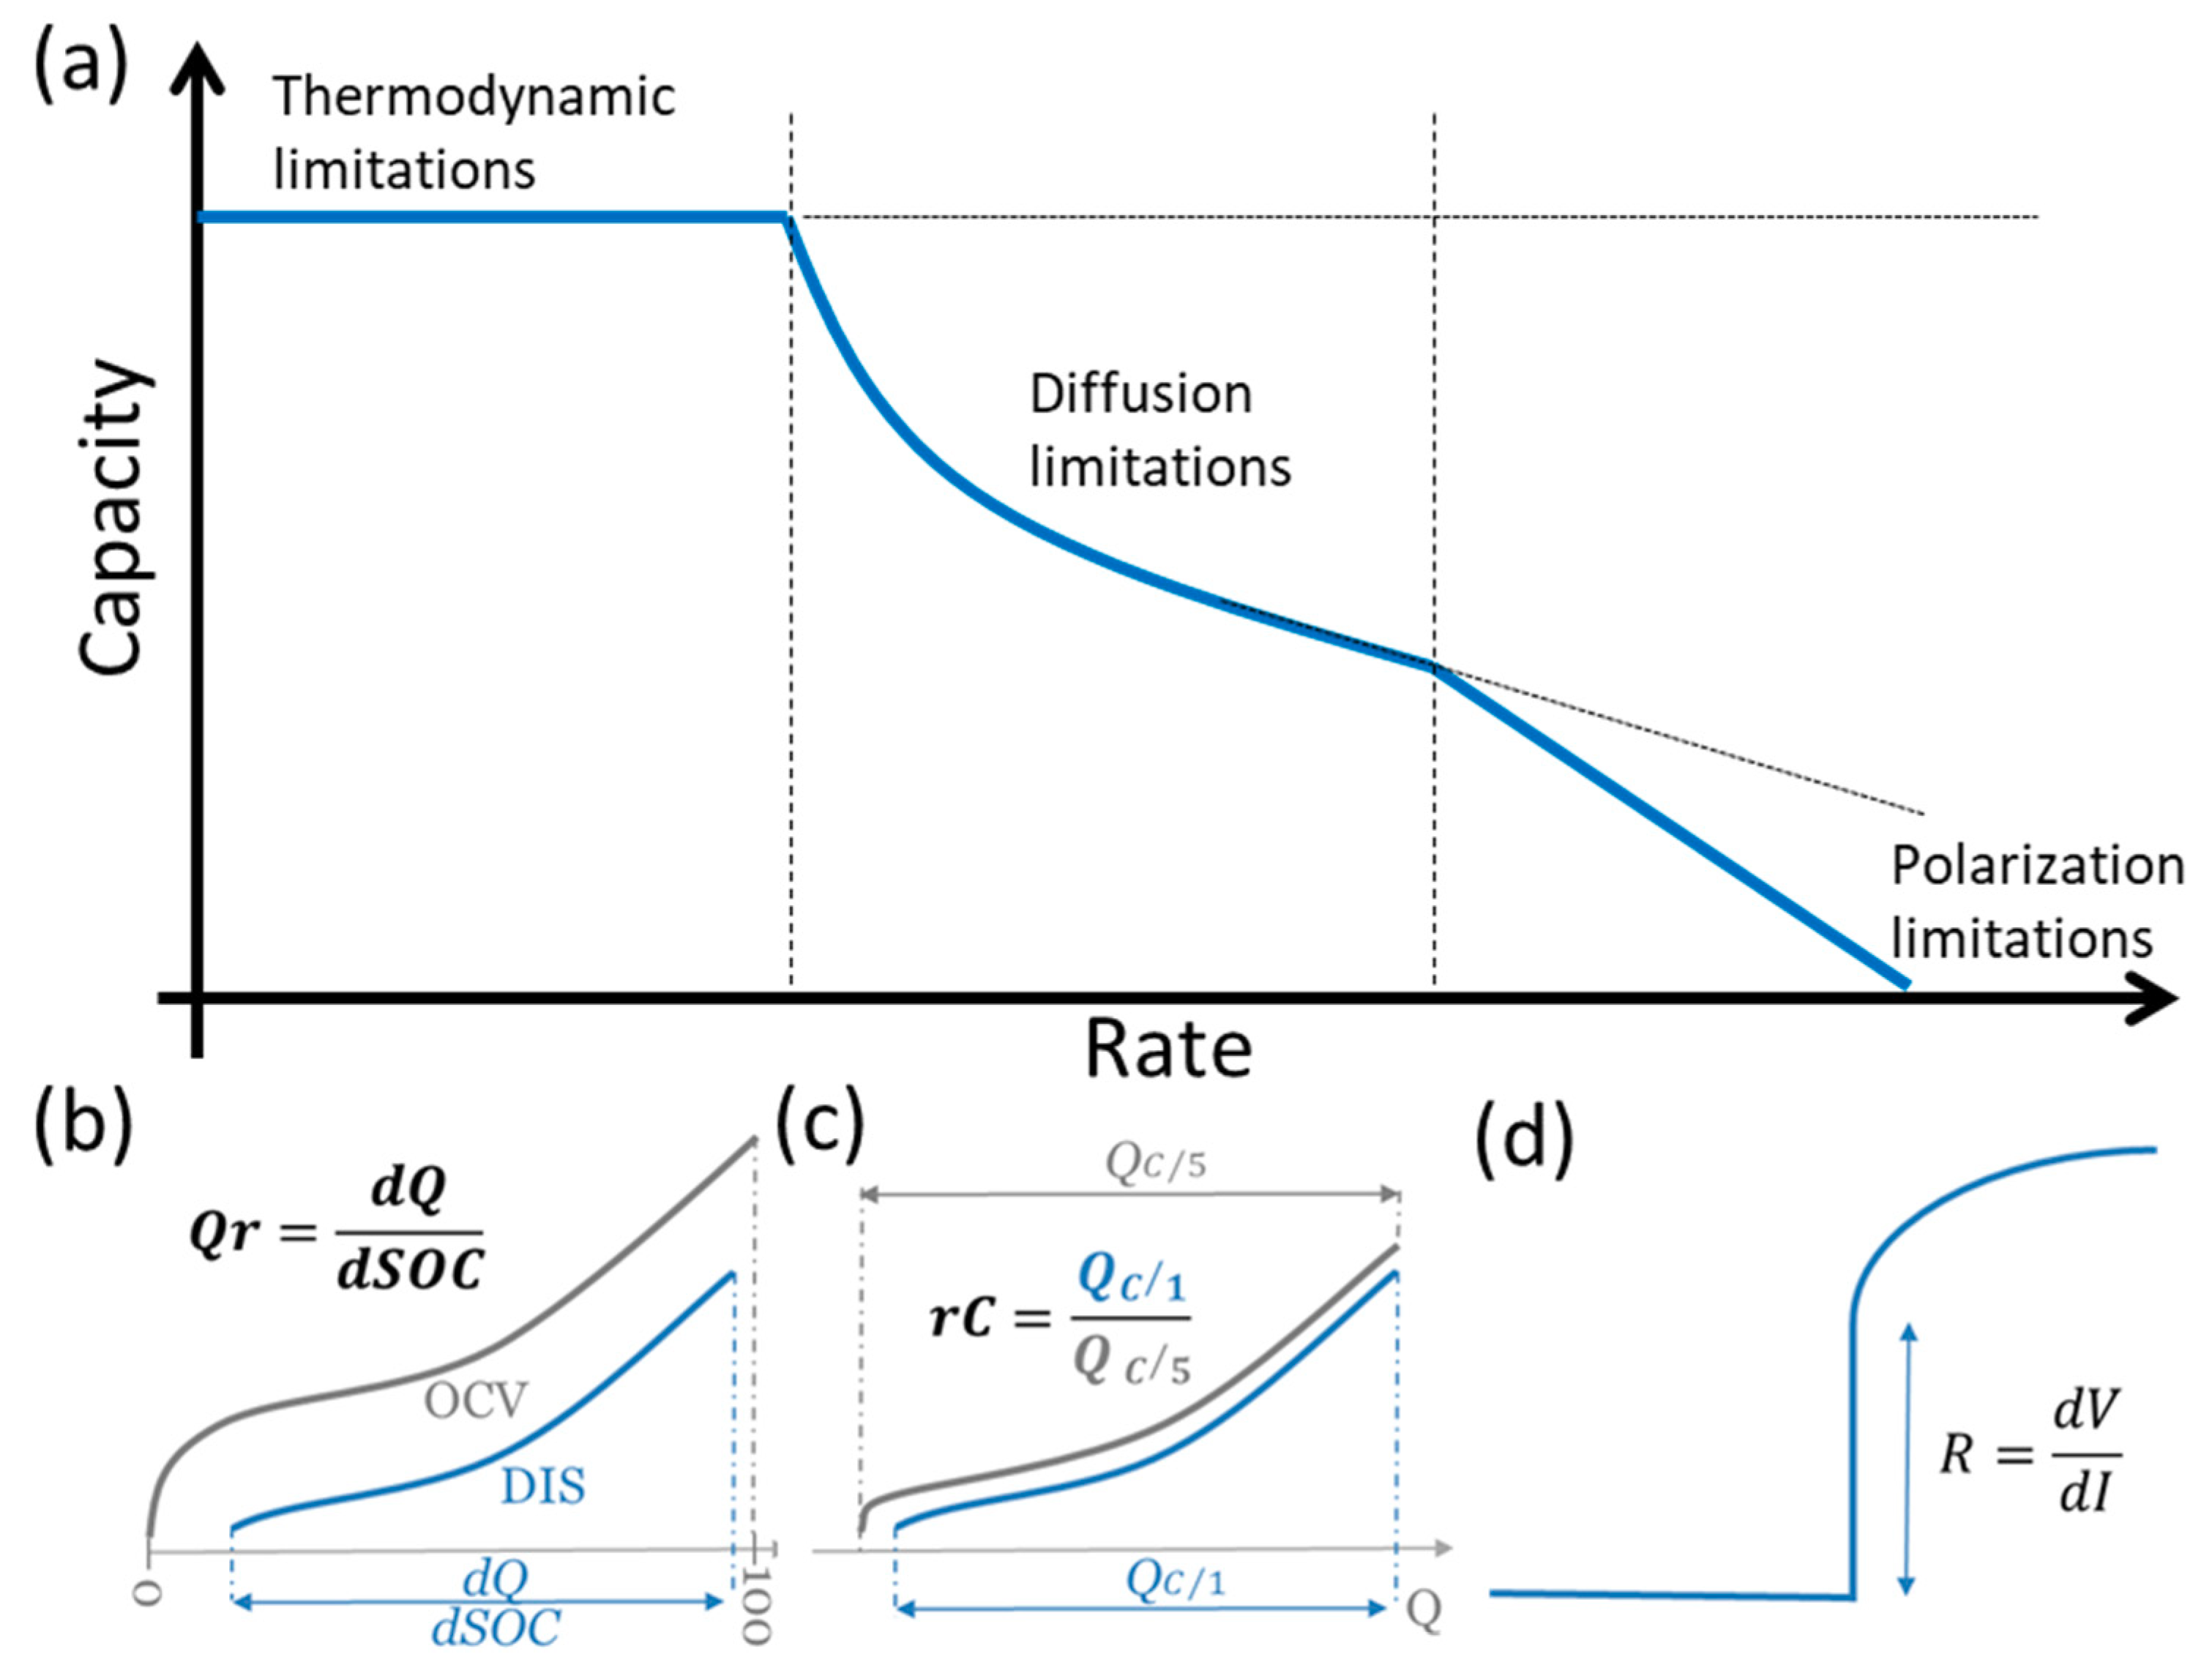
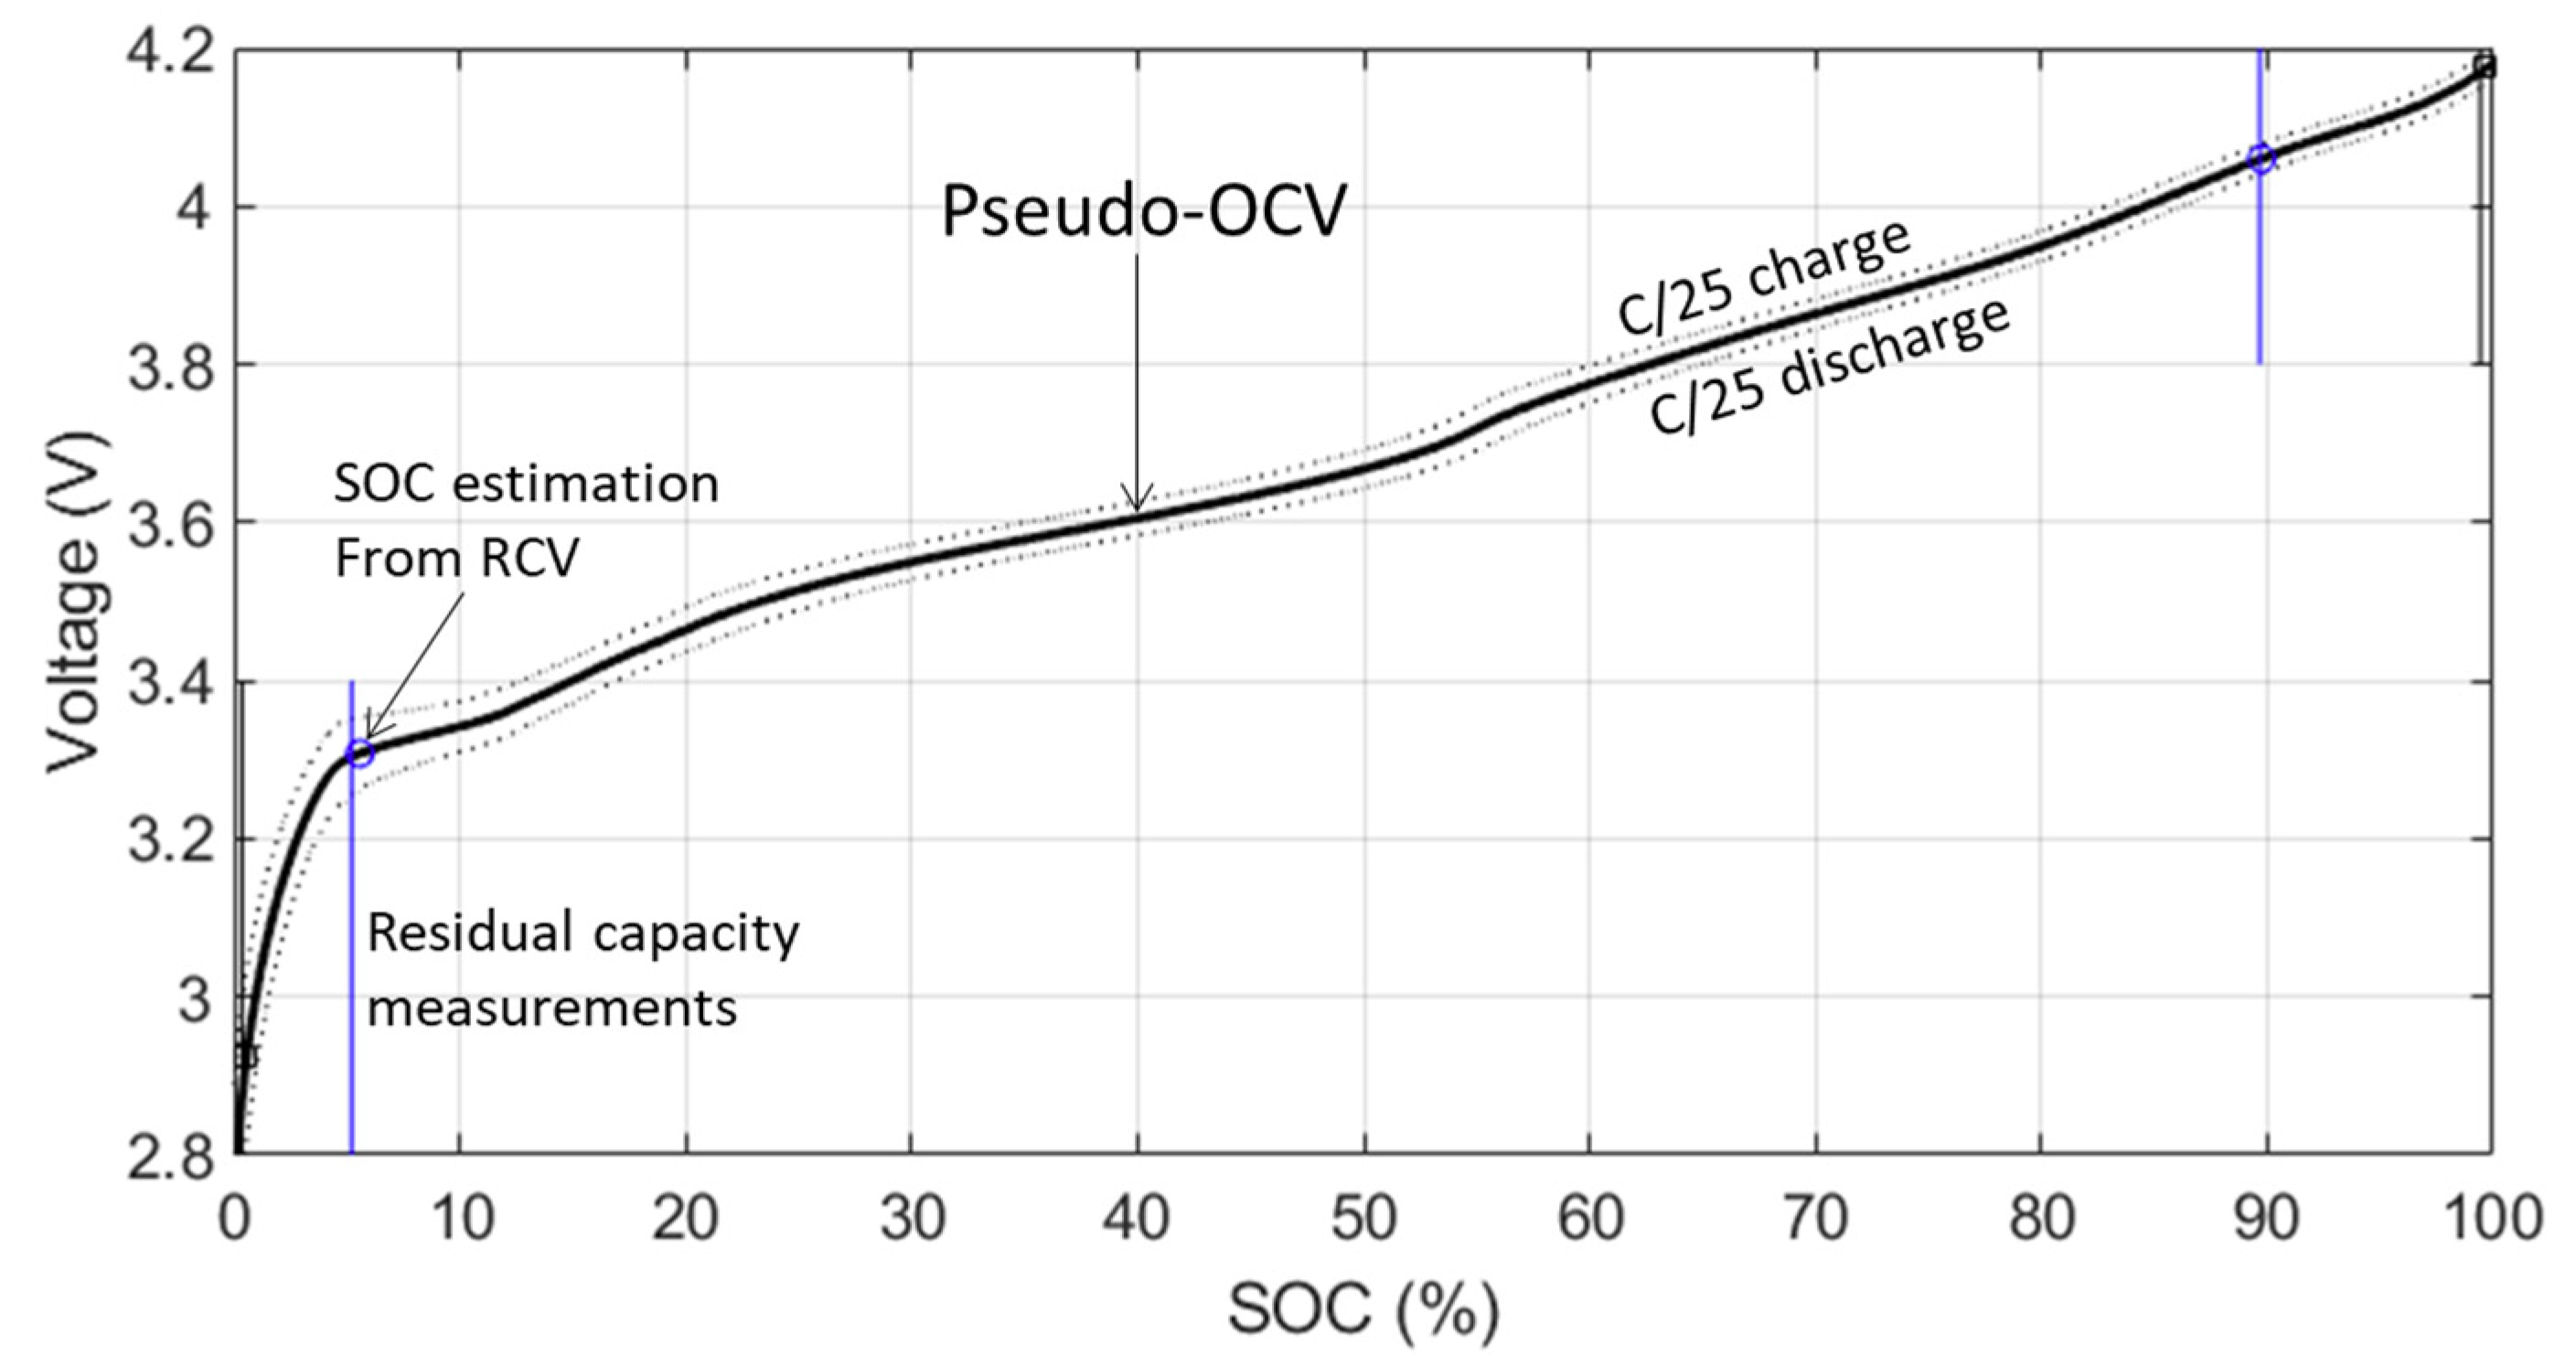
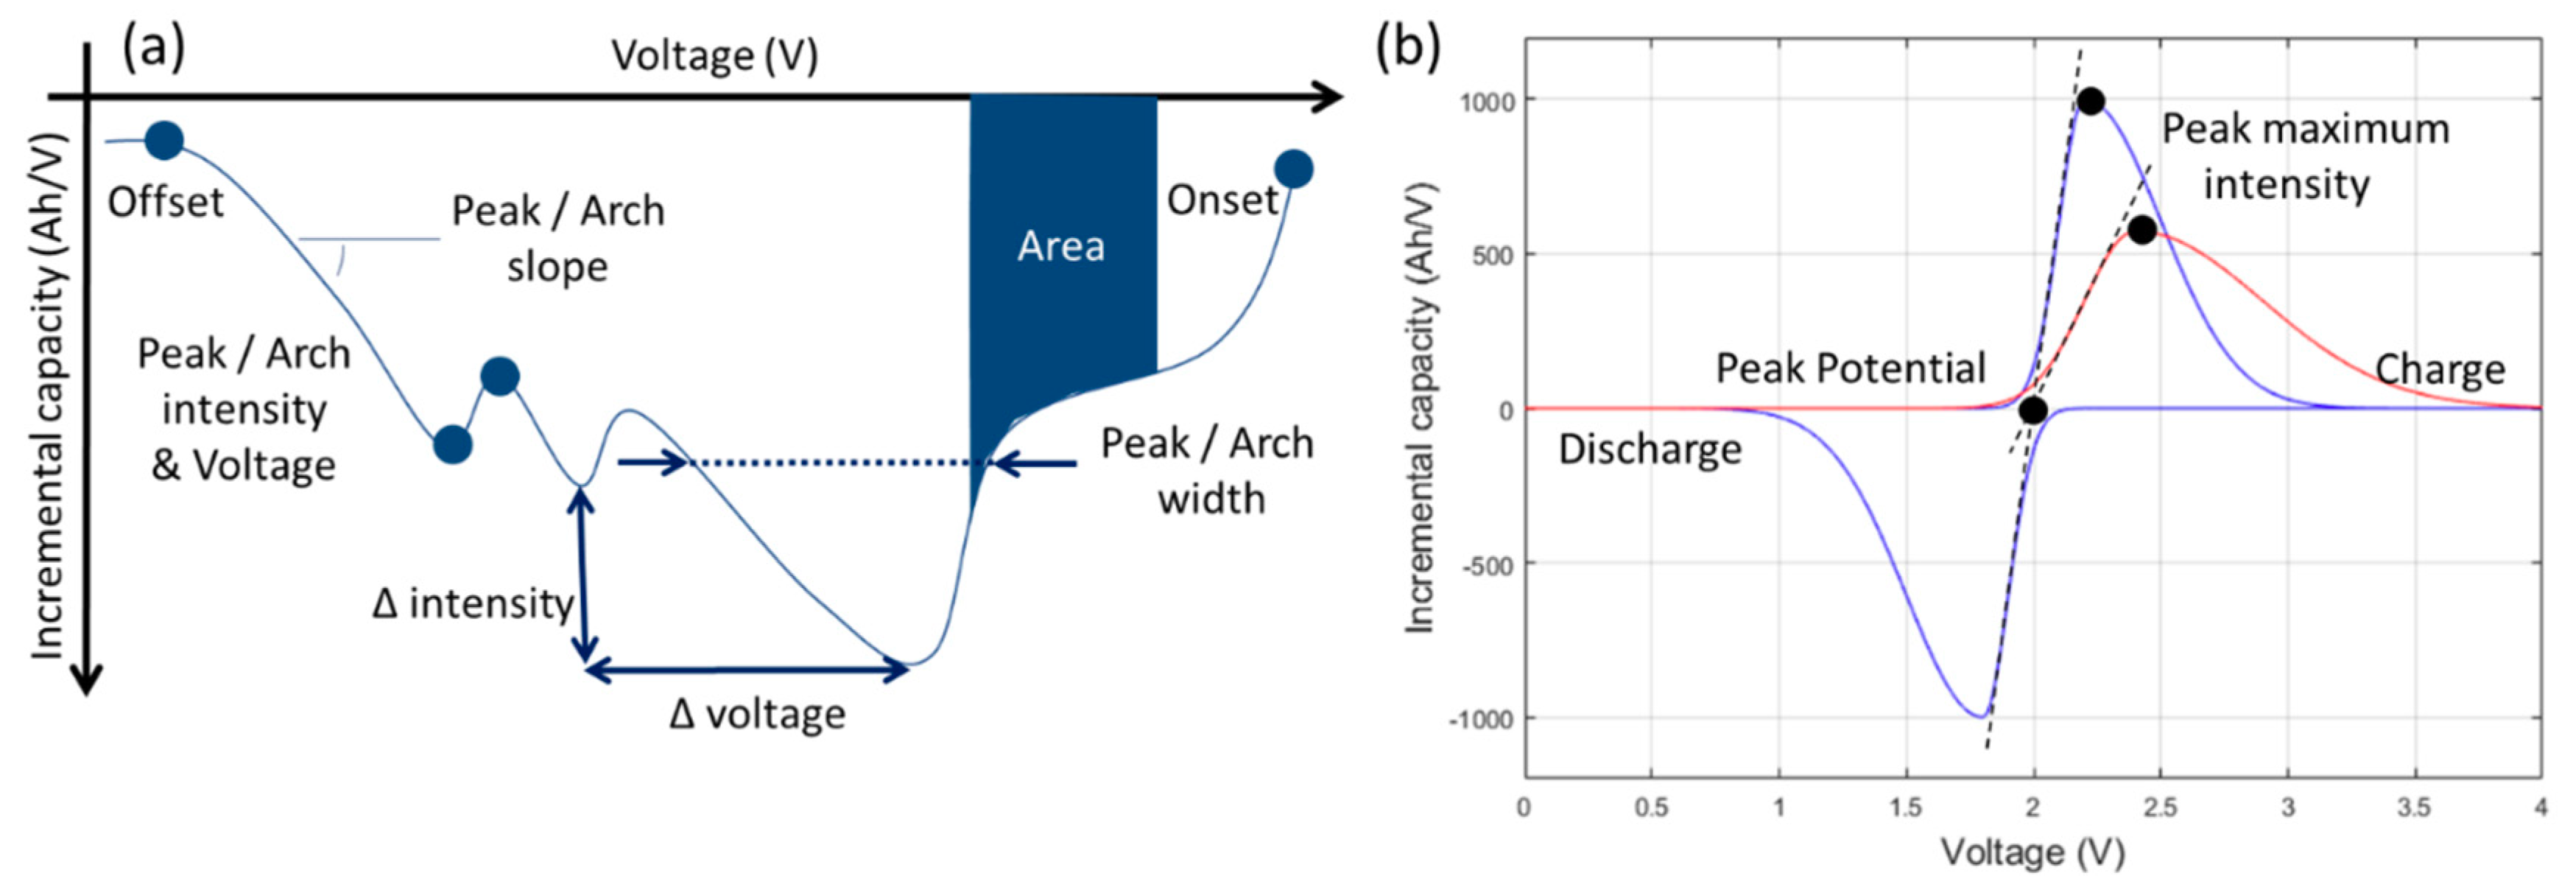
2.3. Reference Performance Test

The RPT needs to be performed on a regular interval and at a constant temperature, typically monthly or every 100 full equivalent cycles and at room temperature, to quantitatively assess battery performance and SOH. SOH is gauged from the quantification of the degradation modes, the loss of active material, loss of reactant, and kinetic degradation. A discussion on SOH is out of the scope of this paper and can be found in [10]. The RPT needs to provide as much information as possible on SOH without being intrusive [37]. Therefore, the test must be short and not stress the cells, but it needs to characterize the thermodynamic and kinetic changes. The proposed HNEI RPT protocol is detailed in Figure 5. It consists of three steps: Conditioning, low-rate cycling, and nominal rate cycling. The conditioning step ensures that the cells are fully charged before the start of the low-rate cycle. This is accomplished by performing a standard charge with an additional constant current step typically at C/50 (discharge in 50 h). The second step is a low-rate cycle, typically C/25 (discharge in 25 h) to assess thermodynamic aspects. The third step is a nominal rate cycle, typically C/2 (discharge in 2 h) to assess kinetic aspects. Rate for this step can be adapted to the situation. For example, higher rates can be applied for high-power cells; while lower rates are used for high-energy cells. The caveat being that this rate must be less aggressive than the rate used in the duty cycling. The RPT protocol is limited to two cycles to minimize its toll on the cell SOH but additional rates or procedures (constant power, electrochemical impedance spectroscopy, full OCV vs. SOC test, different temperatures) [27,38,39] could be added if necessary. This is often done in the literature for the first RPT only. All regimes are performed at constant current up to the cutoff voltage with the addition of a residual capacity step at C/50 in between two rests. This residual capacity step is primarily used to assure that both charges and discharges start from the same SOC independently of the previous rate. It is also used to calculate the maximum capacity the cell can deliver.
The data gathered during the RPT test allow the execution of several analyses. First, the same calculation as that of the ICCT test can be undertaken, specifically, the capacity ration, rate capability, and resistance can be measured. The main difference is that in this case, the capacity ration can be deciphered directly by adding the capacity measured during the residual capacity measurements at C/50 to the recorded capacities to obtain the cell maximum capacity to be divided by 100. Values calculated for the two rates should be similar and close to the one inferred during the ICCT test. With only two rates tested during the proposed RPT, the rC method is still recommended over the Peukert method to characterize rate capability. If more rates are tested, the Peukert curve (capacity vs. rate) could be used as long as the rates are within the section with diffusion limitation (Figure 3a).
The second set of information to be gathered from the RPT is the OCV vs. SOC relationship at the current SOH. A discussion on OCV is out of the scope of this paper and can be found in [9,40]. The OCV vs. SOC relationship can vary a lot with aging and, since gathering a proper OCV vs. SOC curve can take weeks of testing [9], it is not feasible to repeat the process on every cell at each RPT. A solution is to calculate a pseudo-OCV curve at each RPT. It has to be stated that, as discussed in [9], a low-rate charge or discharge cannot be considered as OCV or pseudo-OCV curves as they are not independent of the regime. The pseudo-OCV curve can be calculated by averaging the low-rate charge and discharge curves [9,41,42]. This method is usually accurate, but it is highly recommended to check the validity of the results. First, the residual capacity measurements for the low-rate cycle must be small, <1% of the maximum capacity. High residual capacity measurement for the low-rate cycles would suggest that some SOC was not utilized during the low-rate cycles. If so, no data for this additional capacity were gathered and thus the corresponding OCV voltage cannot be assessed [31]. In such occurrence, it is recommended to lower the current of the low-rate cycle and of the residual capacity cycle. The second verification is to compare the SOC obtained by reporting the RCVs from both cycles on the pseudo-OCV curve with the SOC calculated from the residual capacity measurements divided by the maximum capacity. The values should be similar.
Using the SOC calculated at end of charge and end of discharge (either from the residual capacity measurements or the pseudo-OCV curve), the SOC windows used by the different rates can be compared and tracked [43] so that differences between rates, temperature, or SOH can be compared and discussed. An increasing difference between low and high rate implies growing kinetic limitations. A decreasing difference is possible in case of electrochemical milling enhancing the surface area of the electrode [44]. This allows the comparison of SOC (the percentage of the maximum lithiation) and the depth-of-discharge (DOD, the percentage of the maximum lithiation under a given duty cycle) [9]. For the data collected during the RPT protocol, each charge or discharge corresponds to 100% DOD since the cells were fully charged or discharged prior to the start of the next regime. More details on the extremely important question of SOC definition can be found in [9].
An example of the pseudo-OCV calculation and validation is presented in Figure 6 for a commercial graphite/nickel aluminum cobalt oxide cell. The residual capacities were below 0.5% of the maximum capacity, consequently the pseudo-OCV curve was calculated. This pseudo-OCV curve was then used to infer the SOC from the RCV. For both cycles, the estimated SOCs were within 0.5% from the residual capacity measurements (highlighted by the vertical bars). In that case, the pseudo-OCV curve could be deemed accurate enough for use. From the SOC windows, 100% DOD at C/25 corresponds to 99.5% SOC versus 95% SOC in discharge and 90% SOC in charge at C/3. Examples of results obtainable from these analyses can be found in our previous work including the SOC range variation with rate [43] and the RCV and OCV evolution upon aging [45], at different temperatures [46], and for different electrode architectures [44].
The third set of information that can be gathered from the RPT is the voltage vs. capacity curves of the low and high-rate cycles. The low-rate cycle provides thermodynamic information; while the high-rate cycle reveals kinetic information. Since voltage variations are minute, derivatives are recommended, either incremental capacity (IC, dQ/dV = f(V)) [9,42,45,47,48,49] or differential voltage (DV, dV/dQ = f(Q)) [50,51,52]. Interested readers should refer to [9] for a complete discussion of the advantages and disadvantages of both these electrochemical voltage spectroscopies (EVS).
As mentioned in [9], there are two levels of analysis for the EVS curves. The qualitative way is the easiest and involves comparing the curves. Different features of interest (FOI) [53] (Figure 7a) can be discussed and characterized without a complete understanding of the underlying electrochemical process. To properly discuss changes, it is extremely important to describe the peaks properly (Figure 7b). By convention, for IC, discharge peaks are negative and charge peaks are positive. The peak potential is measured at the base of the peak and not at maximum intensity. Each peak corresponds to a thermodynamic property, a redox reaction, and thus the potential of the reaction is the same in charge and discharge. The voltage of the maximum of intensity could be affected by hysteresis [54], polarization, and kinetics [55]. For example, if a peak is broadening, the position of the intensity maximum changes, whereas the underlying reaction is still the same and thus starts at the same potential, Figure 7b. In that case, the slope of the front of the peak would be an interesting FOI to characterize kinetic changes. Another example is the shifting of all the peaks towards lower potential during discharge, which is usually a clear indication that the resistance is increasing (not observable on DV curves [9]). The resolution needed for IC and DV curves depends on the chemistry. Following common practices from X-ray diffraction studies, having 5 or 6 points above the half-width of the thinner peak would be considered sufficient resolution to trust peak intensity and position. Furthermore, 1 mV or 2 mV voltage steps usually provide good enough resolution for single cells, but this depends on chemistry and on the quality of the data. If noise filtering techniques are applied to clean the curves, particular attention must be set on possible peak displacements.
In addition to the traditional IC and DV analysis, with the same dataset, other voltage derivative techniques can be useful in the study of relaxation curves and the temperature variations. Analysis of dV/dt = f(t) plots have shown the potential to identify lithium plating from relaxation curves [56]. Differential temperature curves with respect to voltage (dT/dV = f(V)) can also provide additional information on degradation mechanisms [57].
The quantitative analysis is much more complex, but it determines the magnitudes of the degradation modes such as loss of active material, loss of reactant, and kinetic degradation [55,58,59]. The methodology concerning the interpretation of the incremental capacity curves is out of the scope of this paper and was extensively described in previous publications [9,58,59] with the introduction of the clepsydra analogy that visualized the problem as communicating vessels with the liquid representing the lithium in the system and the shapes of the vessels defined by the derivative of the voltage responses for both electrodes (Figure 8a). This step can be bypassed by using one of the publicly available mechanistic models [59,60,61] that relies on electrode half-cell data to build a virtual replicate and emulate the impact of all degradation mechanisms based on simple parameters such as the loading ratio (LR) between the capacities of the positive and negative electrodes and their offset (OFS), Figure 8b. Every degradation induces changes to LR and OFS, Figure 8c, and those changes can be related to the degradation modes via a simple set of equations [59].
The typical way of performing the analysis of IC or DV curves is to first select some FOIs [53,62], then compare their experimental evolution to predicted ones for individual degradation modes, and finally validate by simulating the full degradation to match the entire voltage response of the cell. The full match might only be possible with the exact same positive and negative electrodes as the ones used in the considered cells. For this reason, we recommend harvesting electrodes from one cell and test them versus a reference electrode to later be used in the mechanistic model. Discussion on how to open commercial cells and perform half-cell testing is out of the scope of this paper and more details can be found in [29,63,64,65,66,67,68,69]. Individual electrodes in half-cell should be tested with an RPT protocol similar to the one presented in Figure 5 but with more rates ranging from twice as low to twice as fast to enable simulation of loss of active material and kinetic changes [55]. Since only one RPT is performed on the half-cells and the capacity at each rate is normalized from the RCVs, the residual capacity measurements and the OCV curve, degradation between cycles is not an issue. Thus, increasing the number of rates tested improves the accuracy of the simulations. However, some attention needs to be spent on the procedure to minimize cell-to-cell variations and improve the agreement of the data from the half-cells and the full cell [66]. With one RPT for the full cell and one RPT for each electrode, enough information is available to build a virtual cell and use the mechanistic modeling tools. If one of the electrodes is a blend of several active materials, the best results will be obtained if half-cell data are available for each individual electrode component. If the cells cannot be opened, or if individual components of blended electrodes cannot be gathered, the same analysis can be done using reference materials [70]. However, in that case, only trends can be used to compare the mechanistic simulations to the experimental data.
For analysis, the FOI selection must only be made after an exhaustive sensibility analysis [10,53]. It is highly recommended to first simulate a degradation map with the voltage changes and capacity loss associated with all the individual modes to gain an understanding of which FOI is more sensible to a degradation mode. Logical deductions from this degradation map usually allow the direct estimation of at least one of the degradation modes. With one quantified, another is then usually unambiguously decipherable and so on until only one is remaining. Quantifying the last degradation mode directly is usually not possible because of combined effects with the others. This quantification usually necessitates a full fit match. This could be achieved through an automated calculation. Some algorithms were proposed in the literature based on FOIs but most of them neglected the proper sensibility analysis and hence should not be trusted to be universal. A detailed discussion on the necessity for sensibility analysis is presented in [53]. Among the others, examples of degradation maps can be found in [71] for graphite//nickel cobalt aluminum oxide cells, in [53,59] for graphite//lithium iron phosphate cells, and in [53,72] for lithium titanate oxide//manganese nickel cobalt oxide. Example of studies with blended electrodes can be found in [70,73]. In our past IC studies [44,53,59,65,70,71,72,73,74,75], we often used different FOIs and entry points for the IC analysis depending on the chemistry and the experimental trends. This highlights that a step-by-step instruction list on how to perform the analysis is not possible and that it should always be guided by a sensibility analysis to be repeated for every new study. It must be noted that IC or DV analysis are usually chemistry specific and, as such, results should never be extrapolated to other chemistries without careful considerations and verifications.

2.4. Duty Cycle

The definition of the duty cycle test is the most important part of any degradation or validation study. Battery degradation is path dependent [10,74,76,77,78,79,80] meaning that different conditions are degrading battery differently, not just increasing or decreasing the rate. Therefore, to be representative of a given application, the duty cycle to be applied needs to be as close as possible to the real use, which is most likely stochastic [74,76,77,78,79,80]. Depending on the cells, some cycling profiles could be surprisingly harsh. For example, our fast charging studies showed no impact of 4C constant-current discharges compared to 1C but fast degradation under EV type pulsing discharges in which the average current was around C/3 and the maximum current 4C [10,65,75]. This stresses that significant time needs to be allocated to properly define the duty cycle based on the targeted application. If datasets are available, fuzzy logic [81] and statistical analysis [82] are good options to define a representative usage cycle. Alternatively, literature might suggest adapted duty cycles, although they might not be fully representative [74].
Even if a representative usage is determined, real-life conditions can fluctuate significantly. Therefore, it might be valuable to test conditions around the representative usage to look for optimal or detrimental conditions for performance or durability. Testing every possible condition is not possible. Fortunately, some statistical tools allow the sampling of a wide range of values for meaningful parameters with an optimal number of experiments. This is called design of experiments and it is effective in battery testing. Interested readers are referred to [83,84,85,86] for more details on how to set them up and how to interpret the results. Such a methodology was already proposed and successfully applied to battery testing in recent years [30,87,88,89,90,91,92].
The duty cycle is the center part of any study. The RPT will help diagnosis and enable prognosis on the cells but these results need to be relevant to different duty cycles. With a well-defined testing plan, some statistical analyses, such as the analysis of variance (ANOVA), can be executed to establish the significance of the different factors in the duty cycle (e.g., current, depth of discharge, and temperature). An example of significance analysis from [70] is presented in Figure 9. It shows the relative significance of the different factors: The SOC swings, the rate, and the temperature on the different degradation modes. Such results can then be used to derive the optimal conditions to limit capacity loss or the effectiveness of a given control algorithm.
For studies focused on long-term ramifications, it is important to quantify the intrinsic variability in cycle aging and calendar aging, in other words, how much difference is observed between several cells performing the exact same duty cycle. Several studies reported a noticeable spread in cycle-lives [20,23,31,93,94] that could be detrimental to the durability of battery packs. Moreover, as discussed in [10], for the deployment of algorithms, validation on one duty cycle is not enough. The entirety of the degradation paths should be tested. If this is not possible experimentally, modeling solutions should be considered [10,95,96]. In some cases, the capacity is shown to be increased after performing an RPT compared to the last cycles before the RPT. This could be associated with negative electrode overhang [97,98] and its impact will usually fade away after a few cycles.

2.5. Post-Mortem

If necessary, and to validate the diagnosis gathered from the analysis of the RPT, some post-mortem tests can be carried out. This will require multiple apparatus and thus details are out of the scope of this publication. The range of post-mortem tests proposed in the literature is wide [11,12,99] and some techniques might require a lot of resources. They are typically performed by opening the aged cells to test individual electrodes but some can be performed on full cells [11]. Electrochemical tests on aged electrodes can verify changes in OFS and LR and validate the loss of reactant and loss of active material quantifications [64] and other tests can be used to discover the origin of the losses.

3. Conclusions

In summary, laboratory battery testing is a much more complex task than it appears. Properly defined and executed plans expedites a deeper understanding of the performance and SOH of commercial batteries. Inadequate validation can delegitimize a good study. This paper presents best practices for simple and effective testing of batteries. For the most part, execution only requires a multichannel potentiostat/galvanostat without the need for other complex instrumentation. This will allow characterization of not only the cell-to-cell variations, but also evolution of SOH throughout the lifetime of the cells. Although this publication was centered on single cell testing, the same approach can also be used for modules or packs if safety controls are in place so that no single cell can be overcharged or overdischarged.

Author Contributions

Conceptualization, M.D.; methodology, M.D.; software, M.D.; validation, M.D. and G.B.; formal analysis, M.D. and G.B.; resources, M.D.; data curation, M.D.; writing—original draft preparation, M.D.; writing—review and editing, M.D. and G.B.; visualization, M.D.; supervision, M.D.; project administration, M.D.; funding acquisition, M.D. All authors have read and agreed to the published version of the manuscript.

Funding

This work was funded by ONR Asia Pacific Research Initiative for Sustainable Energy Systems (APRISES), award number N00014-18-1-2127. M.D. is also supported by the State of Hawaii.

Acknowledgments

The authors are thankful to all the past staff that helped define and affine these protocols, most notably Bor Yann Liaw, Cyril Truchot, and Arnaud Devie. M.D. would also like to thank the University of Hawaii Material Science Consortium for Research and Education for advanced material characterizations.

Conflicts of Interest

The authors declare no conflict of interest.

References

  1. Lee, T.; Glick, M.B.; Lee, J.-H. Island energy transition: Assessing Hawaii’s multi-level, policy-driven approach. Renew. Sustain. Energy Rev. 2020, 118. [Google Scholar] [CrossRef]
  2. Zhao, W.; Yi, J.; He, P.; Zhou, H. Solid-state electrolytes for lithium-ion batteries: Fundamentals, challenges and perspectives. Electrochem. Energy Rev. 2019, 2, 574–605. [Google Scholar] [CrossRef] [Green Version]
  3. Wang, L.; Wu, Z.; Zou, J.; Gao, P.; Niu, X.; Li, H.; Chen, L. Li-free cathode materials for high energy density lithium batteries. Joule 2019, 3, 2086–2102. [Google Scholar] [CrossRef]
  4. Shen, M.; Gao, Q. A review on battery management system from the modeling efforts to its multiapplication and integration. Int. J. Energy Res. 2019. [Google Scholar] [CrossRef]
  5. Plett, G.L. Review and some perspectives on different methods to estimate state of charge of lithium-Ion batteries. J. Automot. Saf. Energy 2019, 10, 249–272. [Google Scholar] [CrossRef]
  6. Meng, H.; Li, Y.-F. A review on prognostics and health management (PHM) methods of lithium-ion batteries. Renew. Sustain. Energy Rev. 2019, 116. [Google Scholar] [CrossRef]
  7. Lin, Q.; Wang, J.; Xiong, R.; Shen, W.; He, H. Towards a smarter battery management system: A critical review on optimal charging methods of lithium ion batteries. Energy 2019. [Google Scholar] [CrossRef]
  8. Li, Y.; Liu, K.; Foley, A.M.; Zülke, A.; Berecibar, M.; Nanini-Maury, E.; Van Mierlo, J.; Hoster, H.E. Data-driven health estimation and lifetime prediction of lithium-ion batteries: A review. Renew. Sustain. Energy Rev. 2019, 113. [Google Scholar] [CrossRef]
  9. Barai, A.; Uddin, K.; Dubarry, M.; Somerville, L.; McGordon, A.; Jennings, P.; Bloom, I. A comparison of methodologies for the non-invasive characterisation of commercial Li-ion cells. Progr. Energy Combust. Sci. 2019, 72, 1–31. [Google Scholar] [CrossRef]
  10. Dubarry, M.; Baure, G.; Anseán, D. Perspective on state of health determination in lithium ion batteries. J. Electrochem. Energy Convers. Storage 2020, 1–25, in press. [Google Scholar] [CrossRef]
  11. Waldmann, T.; Iturrondobeitia, A.; Kasper, M.; Ghanbari, N.; Aguesse, F.; Bekaert, E.; Daniel, L.; Genies, S.; Jimenez Gordon, I.; Loble, M.; et al. Review—Post-mortem analysis of aged lithium-ion batteries: Disassembly methodology and physico-chemical analysis techniques. J. Electrochem. Soc. 2016, 163, A2149–A2164. [Google Scholar] [CrossRef]
  12. Lu, J.; Wu, T.; Amine, K. State-of-the-art characterization techniques for advanced lithium-ion batteries. Nat. Energy 2017, 2, 17011. [Google Scholar] [CrossRef]
  13. Taylor, J.; Barai, A.; Ashwin, T.R.; Guo, Y.; Amor-Segan, M.; Marco, J. An insight into the errors and uncertainty of the lithium-ion battery characterisation experiments. J. Energy Storage 2019, 24. [Google Scholar] [CrossRef]
  14. De-Leon, S. Battery safety training for portable & stationary applications. In Proceedings of the Next Generation Energy Storage, San Diego, CA, USA, 18–20 April 2016. [Google Scholar]
  15. Dubarry, M.; Qin, N.; Brooker, P. Calendar aging of commercial Li-ion cells of different chemistries—A review. Curr. Opin. Electrochem. 2018, 9, 106–113. [Google Scholar] [CrossRef]
  16. Feng, X.; Ouyang, M.; Liu, X.; Lu, L.; Xia, Y.; He, X. Thermal runaway mechanism of lithium ion battery for electric vehicles: A review. Energy Storage Mater. 2017. [Google Scholar] [CrossRef]
  17. Börger, A.; Mertens, J.; Wenzl, H. Thermal runaway and thermal runaway propagation in batteries: What do we talk about? J. Energy Storage 2019, 24. [Google Scholar] [CrossRef]
  18. Wang, Q.; Mao, B.; Stoliarov, S.I.; Sun, J. A review of lithium ion battery failure mechanisms and fire prevention strategies. Progr. Energy Combust. Sci. 2019, 73, 95–131. [Google Scholar] [CrossRef]
  19. Wu, X.; Song, K.; Zhang, X.; Hu, N.; Li, L.; Li, W.; Zhang, L.; Zhang, H. Safety issues in lithium Ion batteries: Materials and cell design. Front. Energy Res. 2019, 7. [Google Scholar] [CrossRef] [Green Version]
  20. Cripps, E.; Pecht, M. A bayesian nonlinear random effects model for identification of defective batteries from lot samples. J. Power Sources 2017, 342, 342–350. [Google Scholar] [CrossRef]
  21. An, F.; Chen, L.; Huang, J.; Zhang, J.; Li, P. Rate dependence of cell-to-cell variations of lithium-ion cells. Sci. Rep. 2016, 6, 35051. [Google Scholar] [CrossRef]
  22. Schuster, S.F.; Brand, M.J.; Berg, P.; Gleissenberger, M.; Jossen, A. Lithium-ion cell-to-cell variation during battery electric vehicle operation. J. Power Sources 2015, 297, 242–251. [Google Scholar] [CrossRef]
  23. Baumhöfer, T.; Brühl, M.; Rothgang, S.; Sauer, D.U. Production caused variation in capacity aging trend and correlation to initial cell performance. J. Power Sources 2014, 247, 332–338. [Google Scholar] [CrossRef]
  24. Santhanagopalan, S.; White, R.E. Quantifying cell-to-cell variations in lithium Ion batteries. Int. J. Electrochem. 2012, 2012, 1–10. [Google Scholar] [CrossRef] [Green Version]
  25. Kim, J.; Shin, J. Screening process of Li-ion series battery pack for improved voltage soc balancing. In Proceedings of the International Power Electronics Conference, Sapporo, Japan, 21–24 June 2010. [Google Scholar]
  26. Rumpf, K.; Naumann, M.; Jossen, A. Experimental investigation of parametric cell-to-cell variation and correlation based on 1100 commercial lithium-ion cells. J. Energy Storage 2017, 14, 224–243. [Google Scholar] [CrossRef]
  27. Robertson, D.C.; Christophersen, J.P.; Bennett, T.; Walker, L.K.; Wang, F.; Liu, S.; Fan, B.; Bloom, I. A comparison of battery testing protocols: Those used by the U.S. advanced battery consortium and those used in China. J. Power Sources 2016, 306, 268–273. [Google Scholar] [CrossRef] [Green Version]
  28. Dubarry, M.; Vuillaume, N.; Liaw, B.Y. Origins and accommodation of cell variations in Li-ion battery pack modeling. Int. J. Energy Res. 2010, 34, 216–231. [Google Scholar] [CrossRef]
  29. Devie, A.; Dubarry, M. Durability and reliability of electric vehicle batteries under electric utility grid operations. Part 1: Cell-to-cell variations and preliminary testing. Batteries 2016, 2, 28. [Google Scholar] [CrossRef]
  30. Dubarry, M.; Devie, A. Battery durability and reliability under electric utility grid operations: Representative usage aging and calendar aging. J. Energy Storage 2018, 18, 185–195. [Google Scholar] [CrossRef]
  31. Devie, A.; Baure, G.; Dubarry, M. Intrinsic variability in the degradation of a batch of commercial 18650 Lithium-Ion cells. Energies 2018, 11, 1031. [Google Scholar] [CrossRef] [Green Version]
  32. Wood, D.L.; Li, J.; An, S.J. Formation challenges of lithium-ion battery manufacturing. Joule 2019, 3, 2884–2888. [Google Scholar] [CrossRef]
  33. Heubner, C.; Schneider, M.; Michaelis, A. Diffusion-limited c-rate: A fundamental principle quantifying the intrinsic limits of Li-Ion batteries. Adv. Energy Mater. 2019. [Google Scholar] [CrossRef] [Green Version]
  34. Peukert, W. An equation forrelating capacity to discharge rate. Electrotech. Z. 1897, 1, 287–288. [Google Scholar]
  35. Bard, A.; Faulkner, L. Electrochemical Methods—Fundamentals and Applications, 2nd ed.; Wiley: Hoboken, NJ, USA, 2001. [Google Scholar]
  36. Liaw, B.Y.; Dubarry, M. A roadmap to understand battery performance in electric and hybrid vehicle operation. In Electric and Hybrid Vehicles; Pistoia, G., Ed.; Elsevier: Amsterdam, The Netherlands, 2010; pp. 375–403. [Google Scholar] [CrossRef]
  37. Christophersen, J.P.; Ho, C.D.; Motloch, C.G.; Howell, D.; Hess, H.L. Effects of reference performance testing during aging using commercial Lithium-Ion cells. J. Electrochem. Soc. 2006, 153, A1406. [Google Scholar] [CrossRef]
  38. INL. Battery Test Manual For Electric Vehicles; INL: Idaho Falls, ID, USA, 2015. [Google Scholar]
  39. Soto, A.; Berrueta, A.; Sanchis, P.; Ursúa, A. Analysis of the main battery characterization techniques and experimental comparison of commercial 18650 Li-ion cells. In Proceedings of the 2019 IEEE International Conference on Environment and Electrical Engineering and 2019 IEEE Industrial and Commercial Power Systems Europe (EEEIC/I&CPS Europe), Genova, Italy, 11–14 June 2019. [Google Scholar]
  40. Liu, C.; Neale, Z.G.; Cao, G. Understanding electrochemical potentials of cathode materials in rechargeable batteries. Mater. Today 2016, 19, 109–123. [Google Scholar] [CrossRef]
  41. Truchot, C.; Dubarry, M.; Liaw, B.Y. State-of-charge estimation and uncertainty for lithium-ion battery strings. Appl. Energy 2014, 119, 218–227. [Google Scholar] [CrossRef]
  42. Dubarry, M.; Truchot, C.; Cugnet, M.; Liaw, B.Y.; Gering, K.; Sazhin, S.; Jamison, D.; Michelbacher, C. Evaluation of commercial lithium-ion cells based on composite positive electrode for plug-in hybrid electric vehicle applications. Part I: Initial characterizations. J. Power Sources 2011, 196, 10328–10335. [Google Scholar] [CrossRef]
  43. Dubarry, M.; Svoboda, V.; Hwu, R.; Liaw, B.Y. Capacity loss in rechargeable lithium cells during cycle life testing: The importance of determining state-of-charge. J. Power Sources 2007, 174, 1121–1125. [Google Scholar] [CrossRef]
  44. Dubarry, M.; Truchot, C.; Liaw, B.Y. Cell degradation in commercial LiFePO4 cells with high-power and high-energy designs. J. Power Sources 2014, 258, 408–419. [Google Scholar] [CrossRef]
  45. Dubarry, M.; Truchot, C.; Liaw, B.Y.; Gering, K.; Sazhin, S.; Jamison, D.; Michelbacher, C. Evaluation of commercial lithium-ion cells based on composite positive electrode for plug-in hybrid electric vehicle applications. Part II. Degradation mechanism under 2C cycle aging. J. Power Sources 2011, 196, 10336–10343. [Google Scholar] [CrossRef]
  46. Dubarry, M.; Truchot, C.; Liaw, B.Y.; Gering, K.; Sazhin, S.; Jamison, D.; Michelbacher, C. Evaluation of commercial lithium-ion cells based on composite positive electrode for plug-in hybrid electric vehicle applications: III. Effect of thermal excursions without prolonged thermal aging. J. Electrochem. Soc. 2013, 160, A191–A199. [Google Scholar] [CrossRef]
  47. Balewski, L.; Brenet, J.P. A new method for the study of the electrochemical reactivity of manganese dioxide. Electrochem. Technol. 1967, 5, 527–531. [Google Scholar]
  48. Dubarry, M.; Svoboda, V.; Hwu, R.; Liaw, B.Y. Incremental capacity analysis and close-to-equilibrium OCV measurements to quantify capacity fade in commercial rechargeable lithium batteries. Electrochem. Solid State Lett. 2006, 9, A454–A457. [Google Scholar] [CrossRef]
  49. Dubarry, M.; Liaw, B.Y. Identify capacity fading mechanism in a commercial LiFePO4 cell. J. Power Sources 2009, 194, 541–549. [Google Scholar] [CrossRef]
  50. Bloom, I.; Christophersen, J.; Gering, K. Differential voltage analyses of high-power, lithium-ion cells. 2. Applications. J. Power Sources 2005, 139, 304–313. [Google Scholar] [CrossRef]
  51. Bloom, I.; Jansen, A.N.; Abraham, D.P.; Knuth, J.; Jones, S.A.; Battaglia, V.S.; Henriksen, G.L. Differential voltage analyses of high-power, lithium-ion cells. 1. Technique and applications. J. Power Sources 2005, 139, 295–303. [Google Scholar] [CrossRef]
  52. Bloom, I.; Christophersen, J.P.; Abraham, D.P.; Gering, K.L. Differential voltage analyses of high-power, lithium-ion cells. 3. Another anode phenomenon. J. Power Sources 2006, 157, 537–542. [Google Scholar] [CrossRef]
  53. Dubarry, M.; Berecibar, M.; Devie, A.; Anseán, D.; Omar, N.; Villarreal, I. State of health battery estimator enabling degradation diagnosis: Model and algorithm description. J. Power Sources 2017, 360, 59–69. [Google Scholar] [CrossRef]
  54. Dubarry, M.; Gaubicher, J.; Guyomard, D.; Wallez, G.; Quarton, M.; Baehtz, C. Uncommon potential hysteresis in the Li/Li2xVO(H2−xPO4)2 (0 ≤ x ≤ 2) system. Electrochim. Acta 2008, 53, 4564–4572. [Google Scholar] [CrossRef]
  55. Schindler, S.; Baure, G.; Danzer, M.A.; Dubarry, M. Kinetics accommodation in Li-ion mechanistic modeling. J. Power Sources 2019, 440, 227117. [Google Scholar] [CrossRef]
  56. Schindler, S.; Bauer, M.; Petzl, M.; Danzer, M.A. Voltage relaxation and impedance spectroscopy as in-operando methods for the detection of lithium plating on graphitic anodes in commercial lithium-ion cells. J. Power Sources 2016, 304, 170–180. [Google Scholar] [CrossRef]
  57. Wu, B.; Yufit, V.; Merla, Y.; Martinez-Botas, R.F.; Brandon, N.P.; Offer, G.J. Differential thermal voltammetry for tracking of degradation in lithium-ion batteries. J. Power Sources 2015, 273, 495–501. [Google Scholar] [CrossRef]
  58. Dubarry, M.; Devie, A.; Liaw, B.Y. The value of battery diagnostics and prognostics. J. Energy Power Sources 2014, 1, 242–249. [Google Scholar]
  59. Dubarry, M.; Truchot, C.; Liaw, B.Y. Synthesize battery degradation modes via a diagnostic and prognostic model. J. Power Sources 2012, 219, 204–216. [Google Scholar] [CrossRef]
  60. Dahn, H.M.; Smith, A.J.; Burns, J.C.; Stevens, D.A.; Dahn, J.R. User-friendly differential voltage analysis freeware for the analysis of degradation mechanisms in Li-Ion batteries. J. Electrochem. Soc. 2012, 159, A1405–A1409. [Google Scholar] [CrossRef]
  61. HNEI. Alawa Central. Available online: https://www.soest.hawaii.edu/HNEI/alawa/ (accessed on 9 January 2020).
  62. Berecibar, M.; Devriendt, F.; Dubarry, M.; Villarreal, I.; Omar, N.; Verbeke, W.; Van Mierlo, J. Online state of health estimation on NMC cells based on predictive analytics. J. Power Sources 2016, 320, 239–250. [Google Scholar] [CrossRef]
  63. Abraham, D.P.; Knuth, J.L.; Dees, D.W.; Bloom, I.; Christophersen, J.P. Performance degradation of high-power lithium-ion cells—Electrochemistry of harvested electrodes. J. Power Sources 2007, 170, 465–475. [Google Scholar] [CrossRef]
  64. Kassem, M.; Delacourt, C. Postmortem analysis of calendar-aged graphite/LiFePO4 cells. J. Power Sources 2013, 235, 159–171. [Google Scholar] [CrossRef]
  65. Anseán, D.; Dubarry, M.; Devie, A.; Liaw, B.Y.; García, V.M.; Viera, J.C.; González, M. Fast charging technique for high power LiFePO4 batteries: A mechanistic analysis of aging. J. Power Sources 2016, 321, 201–209. [Google Scholar] [CrossRef]
  66. Schmid, A.U.; Kurka, M.; Birke, K.P. Reproducibility of Li-ion cell reassembling processes and their influence on coin cell aging. J. Energy Storage 2019, 24. [Google Scholar] [CrossRef]
  67. Murray, V.; Hall, D.S.; Dahn, J.R. A guide to full coin cell making for academic researchers. J. Electrochem. Soc. 2019, 166, A329–A333. [Google Scholar] [CrossRef]
  68. Zhou, G.; Wang, Q.; Wang, S.; Ling, S.; Zheng, J.; Yu, X.; Li, H. A facile electrode preparation method for accurate electrochemical measurements of double-side-coated electrode from commercial Li-ion batteries. J. Power Sources 2018, 384, 172–177. [Google Scholar] [CrossRef]
  69. Wu, B.; Yang, Y.; Liu, D.; Niu, C.; Gross, M.; Seymour, L.; Lee, H.; Le, P.M.L.; Vo, T.D.; Deng, Z.D.; et al. Good practices for rechargeable lithium metal batteries. J. Electrochem. Soc. 2019, 166, A4141–A4149. [Google Scholar] [CrossRef]
  70. Baure, G.; Devie, A.; Dubarry, M. Battery durability and reliability under electric utility grid operations: Path dependence of battery degradation. J. Electrochem. Soc. 2019, 166, A1991–A2001. [Google Scholar] [CrossRef]
  71. Dubarry, M.; Baure, G.; Devie, A. Durability and reliability of EV batteries under electric utility grid operations: Path dependence of battery degradation. J. Electrochem. Soc. 2018, 165, A773–A783. [Google Scholar] [CrossRef]
  72. Devie, A.; Dubarry, M.; Liaw, B.Y. Overcharge study in Li4Ti5O12 based Lithium-Ion pouch cell: I. Quantitative diagnosis of degradation modes. J. Electrochem. Soc. 2015, 162, A1033–A1040. [Google Scholar] [CrossRef]
  73. Anseán, D.; Baure, G.; González, M.; Cameán, I.; García, A.B.; Dubarry, M. Mechanistic investigation of Silicon–Graphite//LiNi0.8Mn0.1Co0.1O2 commercial cells for non-intrusive diagnosis and prognosis. J. Power Sources 2020. submitted. [Google Scholar]
  74. Baure, G.; Dubarry, M. Synthetic vs. real driving cycles: A comparison of electric vehicle battery degradation. Batteries 2019, 5, 42. [Google Scholar] [CrossRef] [Green Version]
  75. Anseán, D.; Dubarry, M.; Devie, A.; Liaw, B.Y.; García, V.M.; Viera, J.C.; González, M. Operando lithium plating quantification and early detection of a commercial LiFePO 4 cell cycled under dynamic driving schedule. J. Power Sources 2017, 356, 36–46. [Google Scholar] [CrossRef] [Green Version]
  76. Gering, K.L.; Sazhin, S.V.; Jamison, D.K.; Michelbacher, C.J.; Liaw, B.Y.; Dubarry, M.; Cugnet, M. Investigation of path dependence in commercial lithium-ion cells chosen for plug-in hybrid vehicle duty cycle protocols. J. Power Sources 2011, 196, 3395–3403. [Google Scholar] [CrossRef]
  77. Wu, W.; Wu, W.; Qiu, X.; Wang, S. Low-temperature reversible capacity loss and aging mechanism in lithium-ion batteries for different discharge profiles. Int. J. Energy Res. 2018, 43, 243–253. [Google Scholar] [CrossRef] [Green Version]
  78. Radhakrishnan, K.N.; Coupar, T.; Nelson, D.J.; Ellis, M.W. Experimental evaluation of the effect of cycle profile on the durability of commercial Lithium Ion power cells. J. Electrochem. Energy Convers. Storage 2019, 16. [Google Scholar] [CrossRef]
  79. Klett, M.; Eriksson, R.; Groot, J.; Svens, P.; Ciosek Högström, K.; Lindström, R.W.; Berg, H.; Gustafson, T.; Lindbergh, G.; Edström, K. Non-uniform aging of cycled commercial LiFePO4//graphite cylindrical cells revealed by post-mortem analysis. J. Power Sources 2014, 257, 126–137. [Google Scholar] [CrossRef]
  80. Keil, P.; Jossen, A. Charging protocols for lithium-ion batteries and their impact on cycle life—An experimental study with different 18650 high-power cells. J. Energy Storage 2016, 6, 125–141. [Google Scholar] [CrossRef]
  81. Liaw, B.Y.; Dubarry, M. From driving cycle analysis to understanding battery performance in real-life electric hybrid vehicle operation. J. Power Sources 2007, 174, 76–88. [Google Scholar] [CrossRef]
  82. Dubarry, M.; Devie, A.; Stein, K.; Tun, M.; Matsuura, M.; Rocheleau, R. Battery energy storage system battery durability and reliability under electric utility grid operations: Analysis of 3 years of real usage. J. Power Sources 2017, 338, 65–73. [Google Scholar] [CrossRef]
  83. Montgomery, D. Design and Analysis of Experiments, 8th ed.; Wiley: Hoboken, NJ, USA, 2013. [Google Scholar]
  84. Antony, J. Design of Experiments for Engineers and Scientists; Elsevier Science & Technology Books: Amsterdam, The Netherlands, 2003. [Google Scholar]
  85. Rynne, O.; Dubarry, M.; Molson, C.; Nicolas, E.; Lepage, D.; Prébé, A.; Aymé-Perrot, D.; Rochefort, D.; Dollé, M. Designs of experiments to optimize Li-ion battery electrodes’ formulation. J. Electrochem. Soc. 2020, submitted. [Google Scholar]
  86. Rynne, O.; Dubarry, M.; Molson, C.; Lepage, D.; Prébé, A.; Aymé-Perrot, D.; Rochefort, D.; Dollé, M. Designs of experiments for beginners—A quick start guide for application to electrode formulation. Batteries 2019, 5, 72. [Google Scholar] [CrossRef] [Green Version]
  87. Su, L.; Zhang, J.; Wang, C.; Zhang, Y.; Li, Z.; Song, Y.; Jin, T.; Ma, Z. Identifying main factors of capacity fading in lithium ion cells using orthogonal design of experiments. Appl. Energy 2016, 163, 201–210. [Google Scholar] [CrossRef]
  88. Cui, Y.; Du, C.; Yin, G.; Gao, Y.; Zhang, L.; Guan, T.; Yang, L.; Wang, F. Multi-stress factor model for cycle lifetime prediction of lithium ion batteries with shallow-depth discharge. J. Power Sources 2015, 279, 123–132. [Google Scholar] [CrossRef]
  89. Prochazka, W.; Pregartner, G.; Cifrain, M. Design-of-experiment and statistical modeling of a large scale aging experiment for two popular Lithium Ion cell chemistries. J. Electrochem. Soc. 2013, 160, A1039–A1051. [Google Scholar] [CrossRef]
  90. Dubarry, M.; Devie, A.; McKenzie, K. Durability and reliability of electric vehicle batteries under electric utility grid operations: Bidirectional charging impact analysis. J. Power Sources 2017, 358, 39–49. [Google Scholar] [CrossRef]
  91. Mathieu, R.; Baghdadi, I.; Briat, O.; Gyan, P.; Vinassa, J.-M. D-optimal design of experiments applied to lithium battery for ageing model calibration. Energy 2017, 141, 2108. [Google Scholar] [CrossRef]
  92. Baghdadi, I.; Mathieu, R.; Briat, O.; Gyan, P.; Vinassa, J.-M. Lithium-ion battery ageing assessment based on a reduced design of experiments. In Proceedings of the 2017 IEEE Vehicle Power and Propulsion Conference (VPPC), Belfort, France, 11–14 December 2017. [Google Scholar]
  93. Rohr, S.; Müller, S.; Baumann, M.; Kerler, M.; Ebert, F.; Kaden, D.; Lienkamp, M. Quantifying uncertainties in reusing Lithium-Ion batteries from electric vehicles. Procedia Manuf. 2017, 8, 603–610. [Google Scholar] [CrossRef]
  94. Harris, S.J.; Harris, D.J.; Li, C. Failure statistics for commercial lithium ion batteries: A study of 24 pouch cells. J. Power Sources 2017, 342, 589–597. [Google Scholar] [CrossRef] [Green Version]
  95. Dubarry, M.; Pastor-Fernández, C.; Baure, G.; Yu, T.F.; Widanage, W.D.; Marco, J. Battery energy storage system modeling: Investigation of intrinsic cell-to-cell variations. J. Energy Storage 2019, 23, 19–28. [Google Scholar] [CrossRef]
  96. Dubarry, M.; Baure, G.; Pastor-Fernández, C.; Yu, T.F.; Widanage, W.D.; Marco, J. Battery energy storage system modeling: A combined comprehensive approach. J. Energy Storage 2019, 21, 172–185. [Google Scholar] [CrossRef]
  97. Lewerenz, M.; Fuchs, G.; Becker, L.; Sauer, D.U. Irreversible calendar aging and quantification of the reversible capacity loss caused by anode overhang. J. Energy Storage 2018, 18, 149–159. [Google Scholar] [CrossRef]
  98. Lewerenz, M.; Warnecke, A.; Sauer, D.U. Introduction of capacity difference analysis (CDA) for analyzing lateral Lithium-Ion flow to determine the state of covering layer evolution. J. Power Sources 2017, 354, 157–166. [Google Scholar] [CrossRef]
  99. Kovachev, G.; Schröttner, H.; Gstrein, G.; Aiello, L.; Hanzu, I.; Wilkening, H.M.R.; Foitzik, A.; Wellm, M.; Sinz, W.; Ellersdorfer, C. Analytical dissection of an automotive Li-Ion pouch cell. Batteries 2019, 5, 67. [Google Scholar] [CrossRef] [Green Version]
Figure 1. Testing sequence within proposed protocols.
Electronics 09 00152 g001
Figure 2. Initial conditioning characterization test (ICCT) formation test protocol.
Electronics 09 00152 g002
Figure 3. (a) Capacity vs. rate relationship and (bd) the three attributes that quantify cell-to-cell variations.
Electronics 09 00152 g003
Figure 4. (a) Initial voltage vs. rate for the resistance calculation and (b) cell-to-cell variation representation in a 3D space adapted from [29].
Electronics 09 00152 g004
Figure 5. The reference performance test (RPT) test protocol. EoR stands for end of regime and BoR stands for beginning of regime.
Electronics 09 00152 g005
Figure 6. The C/25 charge and discharge curves and associated pseudo-open circuit voltage (OCV) curve. Black squares and blue circles indicate the state-of-charge (SOC) estimated from C/3 and C/25 rest cell voltages, respectively. Vertical lines indicate the amount of additional capacity added by the residual capacity steps.
Electronics 09 00152 g006
Figure 7. (a) Feature of interest (adapted from [53]) and (b) incremental capacity (IC) peak description.
Electronics 09 00152 g007
Figure 8. (a) Clepsydra analogy, (b) parameterization for mechanistic modeling, and (c) the effect of changes of loading ratio and electrode offset.
Electronics 09 00152 g008
Figure 9. Example of a significance analysis taken from [70].
Electronics 09 00152 g009

