1. Introduction
With the rapid development of technology and the strengthening of environmental awareness, the use of electronic documents is more and more extensive. Compared with traditional paper documents, electronic documents have advantages of small footprint, easy saving, easy modification, and easy transmission. Therefore, we often scan some paper documents to convert them into electronic documents [
1,
2,
3,
4]. During the scanning process of the documents, the documents may be skew due to human factors. Skew document images cause inconvenience to subsequent image processing, and may even lead to wrong results, so skew detection and correction are important steps in image preprocessing. Several methods have been proposed for skew detection and correction of document. The most popular methods are projection profile (PP), Hough transform (HT), and nearest neighbor (NN) methods. Besides, some other methods based on the textual characteristics of document have also been proposed [
5,
6,
7,
8]. As far as we know, processing speed is important when high volumes of scanned documents have to be processed using optical character recognition, especially in some systems with high real-time requirements. So, in addition to the accuracy of angle detection, the speed of angle detection also needs to be concerned. However, some methods require extensive computation, such as Hough transform-based methods. Some methods such as PP-based methods can only deal with small skew angles because they have high computational cost of exhaustive search. And some other methods sacrifice the accuracy in order to increase the calculation speed, such as the axes-parallel bounding box method in [
9].
In this paper, we propose a novel method for skew angle detection. On one hand, our method uses bounding boxes and probability model to calculate the slopes of the document, which has the advantage of low computation cost compared with other methods. On the other hand, we combine the Dixon’s Q test and PP method to find a more accurate skew angle to improve the performance of the algorithm.
The structure of this paper is as follows. In
Section 2, we present a survey of previous works dedicated to the skew detection subject.
Section 3 describes our proposed skew angle detection method in detail. The experimental results and comparative study are presented in
Section 4. Finally, we conclude the paper and illustrate our future work in
Section 5.
2. Related Work
Over the last few years, various methods have been developed by researchers for skew angle detection, which can be mainly divided into three types: the projection profile analysis method, the Hough transform method, and the nearest neighbor method [
10]. In addition to the above three commonly used methods, some novel methods can also be found which are based on the features of the documents.
Postl [
11] first proposed the projection profile method. In his method, histograms of the number of the black pixels along horizontal line through the document for a range of angles are calculated. In 1995, Bloomberg [
12] proposed an efficient, accurate, and robust method for measuring document image skew and orientation. He used the sample image instead of the whole document image to calculate the skew angle, which greatly increases the speed of the image skew angle calculation. In 2014, Jain [
13] presented two algorithms, which were vertical projection profile analysis and horizontal projection profile analysis, and his experiment results show that the horizontal projection profile had better performance than the vertical projection profile. Moreover, the horizontal profile technique could be used for skew correction with noisy images. Although projection profile methods are easy to implement and relatively intuitive, they have high computational complexity and a small range of angle estimation limitation. Additionally, these methods are very sensitive to diagrams, graphs, or noise.
The Hough transform is a well-known skew detection method detecting lines and curves in digital images. However, in this method, every black pixel of document image needs to be transferred from Cartesian space to Hough space, which makes Hough transform method computationally expensive. The Hough transform method was initially proposed by Hough [
14] in 1962. In order to improve the calculation speed, in 1990, Xu proposed randomized Hough transform (RHT) method [
15]. He randomly picked n pixels and mapped them into one point in the parameter space. Boukharouba [
16] used randomized Hough transform method to detect the lower baseline of the text lines of an Arabic document, but this method requires a line of text with a distinct bottom baseline. In 2000, Matas [
17] presented the progressive probabilistic Hough transform (PPHT). They minimized the amount of computation needed to detect lines by exploiting the difference in the fraction of votes needed to reliably detect lines with different numbers of supporting points. Boudraa [
18] introduced morphological skeleton method to remove the redundant pixels and only retain the central curves of the input document image, which achieved high accuracy but reduced the speed of angle detection.
Nearest neighbor (NN) method is based on finding the connected components of a document. Hashizume et al. [
19] first proposed NN method. They computed all the orientations of connected components (CC), then calculated a histogram of all the above orientations, in which the peak value indicates the skew angle of the document. In 2003, Lu and Tan [
20] improved the NN method. They proposed a nearest-neighbor chain (NCC)-based approach. In the NCC method, they extracted all the eligible NCCs, calculated the slope of each NCC, and then used the slope of the most number of times to represent the slope of the true document skew. The NCC method achieved an improved accuracy for estimating skew angle and applied to a variety of different languages. Fabrizio [
21] proposed a simple and accurate method, which first used a KNN clustering to preprocess the input document image and then estimated the skew angle in the frequency domain.
In addition to the three commonly used methods mentioned above, some other innovative methods have also been found. For instance, [
9] presented a novel approach in skew detection of a document by minimizing the area of the axis-parallel bounding box. Chou et al. [
22] proposed a fast and robust skew detection method by using piecewise covering of objects, such as text lines, figures, or tables. Finally, the overview of existing skew detection methods is summarized in
Table 1.
In statistics, Dixon’s
Q test [
23] (also named
Q test) is a method to find outliers in very small datasets, which are usually defined as somewhere between 3 and 10 items. It is commonly used in chemistry, where datasets sometimes include one suspect observation that is much lower or higher than the average. Researchers often use Dixon’s
Q test to check whether the suspect observation is an outlier. Dixon’s
Q test usually includes the following steps: (1) sort all observations from small to large; (2) calculate the maximum difference
between all observations; (3) find the absolute difference
between the suspect observation and its closest observation; (4) calculate the ratio
of
to
; (5) compare the
value with the
value in
Table 2. If
is larger than
, the suspect observation is an outlier and needs to be removed.
Table 2 shows critical values
at different numbers of observations (NO) and different confidence levels (CL).
3. Proposed Method
In this part, we propose a method based primarily on connected components (CC). The CC mainly exists in the binary image, which is a small area unit composed of same intensity pixels, where the pixel value is generally 1. The types of CC can be divided into 4-adjacency connectivity and 8-adjacency connectivity according to different adjacency modes [
24]. Our method uses 8-adjacency connectivity method to search the document image. Hashizume [
19] first proposed a nearest neighbor-based method. In their method, the connected components are detected first. They use the direction vector of connected components to indicate the skew of the document. Some previous research works also use the connected component as the basic processing unit to calculate the skew angle of the document [
6,
25,
26,
27].
Different from other CC-based methods, our proposed method randomly selects two different CCs rather than the nearest CC to calculate the document skew slope. In order to improve the calculation speed, we only consider some eligible connected components (ECC) instead of all the CCs of the document. Bounding boxes are used to pick out the ECCs from the document and calculate the locations of the corresponding ECCs [
28]. After detecting several skew slope values, Dixon’s
Q test or PP method is performed to find the optimal skew angle. Then, the skew document is rotated with the nearest neighbor interpolation method. The approach of skew document normalization in this paper is generally divided into three steps: (1) Detect and obtain the skew slopes of the document. (2) Select the most accurate slope value to calculate the final skew angle. (3) Rotate the document image to achieve the proposed correction. From the above three steps we can see that the skew slope detection and angle calculation are the core steps of the whole technology. And the detailed flowchart of our proposed method is shown in
Figure 1.
3.1. Document Image Preprocessing
In this procedure, we mainly preprocess the input document, which including three steps: (1) document image binarization; (2) noise processing; (3) image morphology operation. These processes are necessary for skew angle detection. On one hand, they can improve the accuracy of the results. On the other hand, they speed up the calculation by removing some redundant pixels.
3.1.1. Image Binarization
Since the input document is usually multicolor or gray, we first perform binarization on the document. The existing document image binarization methods are classified in two categories, namely global and local [
29]. Global thresholding methods use a single threshold for the whole document, while local methods find a local threshold based on window operation. Considering the obvious difference between the text-lines and the background in the document, we apply Otsu’s method [
30] to the input gray image. In comparison with other local thresholding methods, Otsu’s method also has the advantage of simple computation. After image binarization with Otsu’s method, a binary image is output where the relevant information (text-lines) is set to 0 (black intensity), then we need to invert the binary image, because morphological operation deals with white intensity pixels.
3.1.2. Noise Removal
When performing a connected component search, some punctuation (comma and dot) and isolated noises can be identified as connected components, which seriously affect the result whether the current CC is an ECC or not. Therefore, we need to remove the noise components from the document. Since the input document image is a binary image, we do not use common image denoising methods [
31,
32], such as median filtering [
33], mean filtering [
34], or fast fourier transform (FFT) methods [
35], and so on.
In this stage, a CC with less than 25 pixels is considered a punctuation mark or noise and will be removed. We consider the threshold value of 25 after conducting a number of experiments on the scanned document. Experiment shows that some non-text content such as dots, common, isolate pixels, and noise components are removed.
3.1.3. Morphological Operation
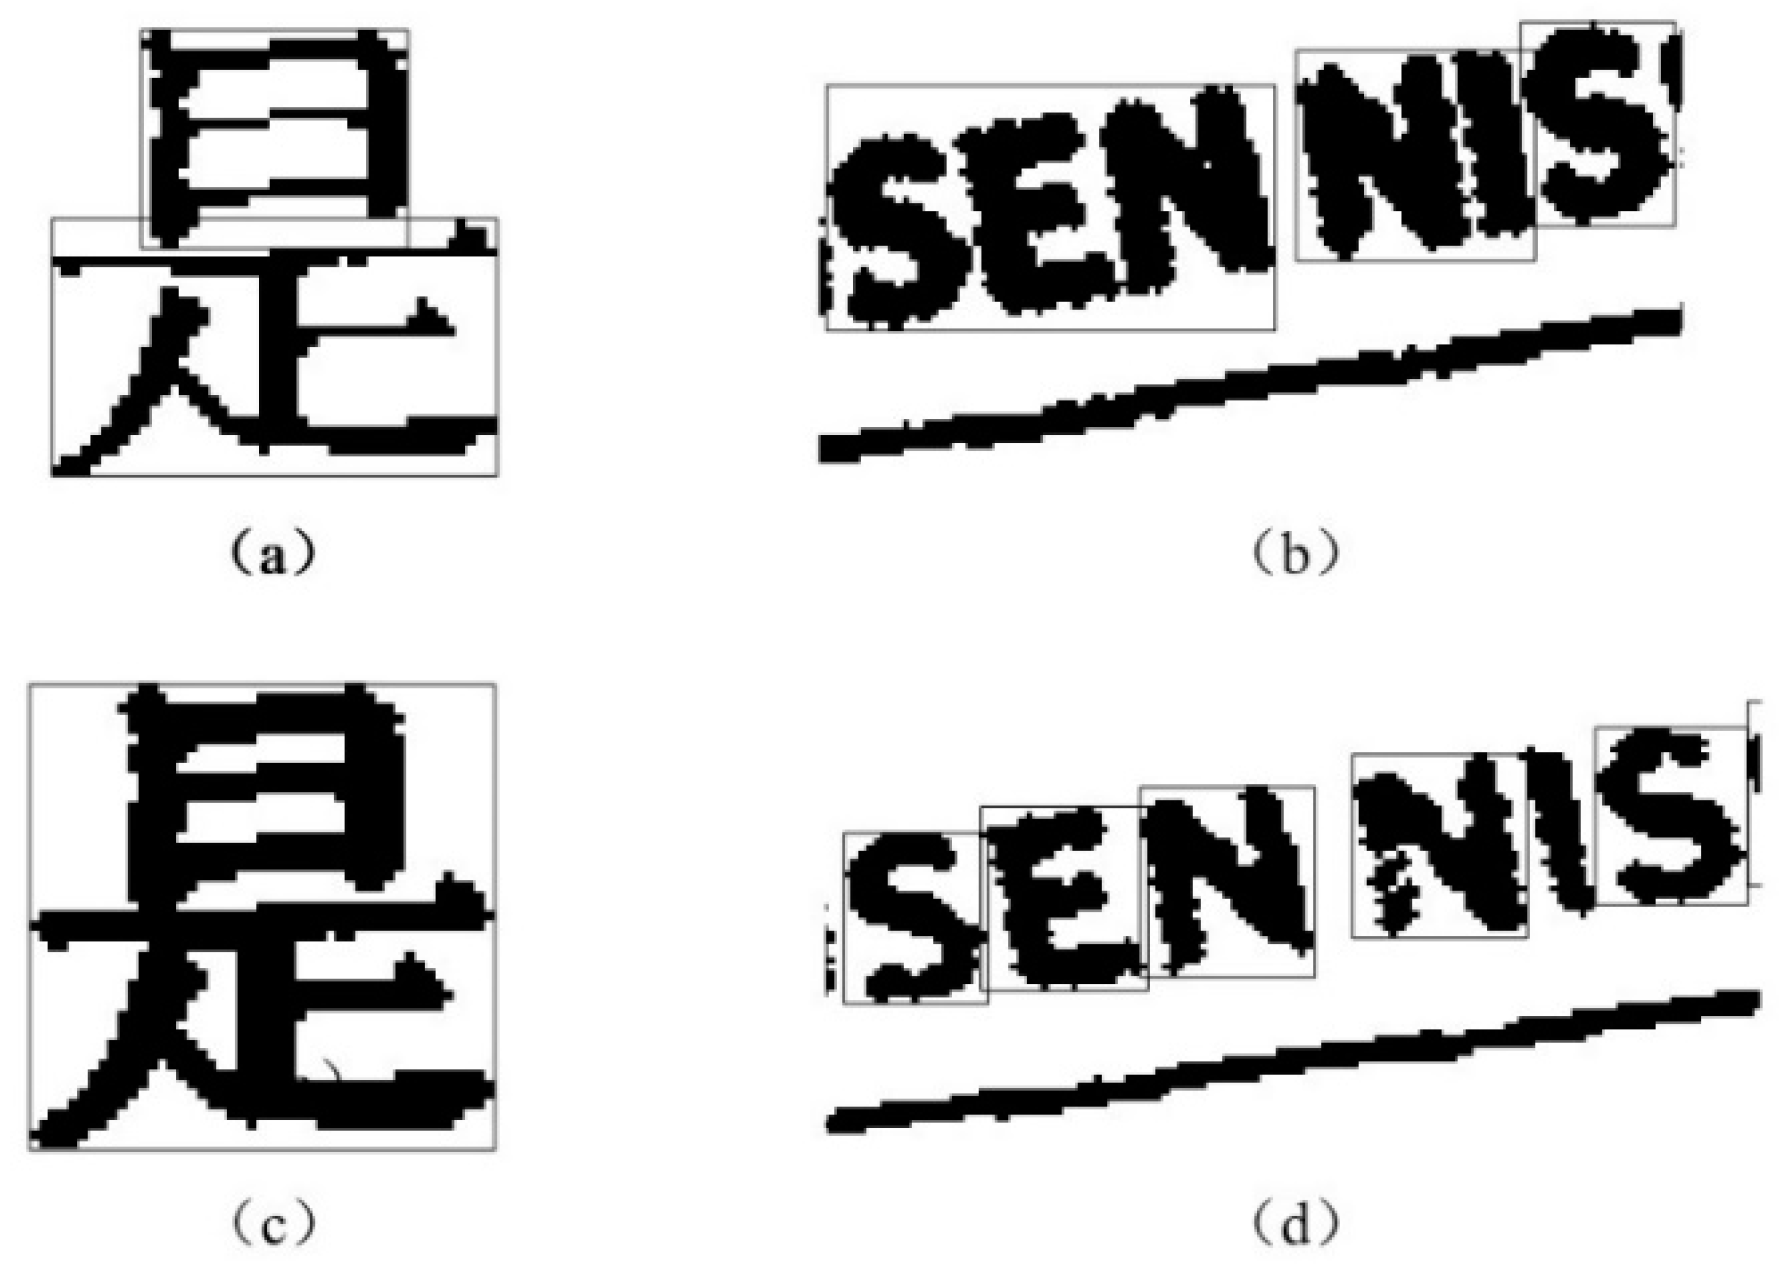
In our method, aimed to get accurate skew angle, we hope that every Chinese character or English letter only has one CC. But under actual circumstances, as shown in
Figure 2a, a Chinese character is recognized as upper and lower two connected components which are surrounded by bounding boxes. As can also be seen from
Figure 2b, several English letters connect to each other so that they are considered to be one CC.
In order to solve the above problems, we first apply erode method to the document image by considering a
line-shaped structuring element, this erode operation can separate connected letters, as shown in
Figure 2d. Then, we use dilation operation to connect the Chinese character’s upper part and lower part to form a connected region by considering a circular structuring element with radius 1, and the result is shown in
Figure 2c.
3.2. Eligible Connected Components Selection
After document image preprocessing, we find all the CCs in the document. In general, documents not only contain text-lines, but also contain tables, images, symbols, and so on. Different from the text-line CCs, these table or image CCs, named non-text CCs, are usually very large or extremely small and randomly distributed, which seriously affects the result, meaning they need to be removed. Therefore, we need to filter these non-text CCs by analyzing their bounding boxes’ size.
In our method, we achieve the locations of CCs using the centers of their bounding boxes. In an English word, it is difficult to ensure that the centers of all the letters are on a line, so some researchers used least squares method to estimate the text-line orientation, which is a little bit more complicated [
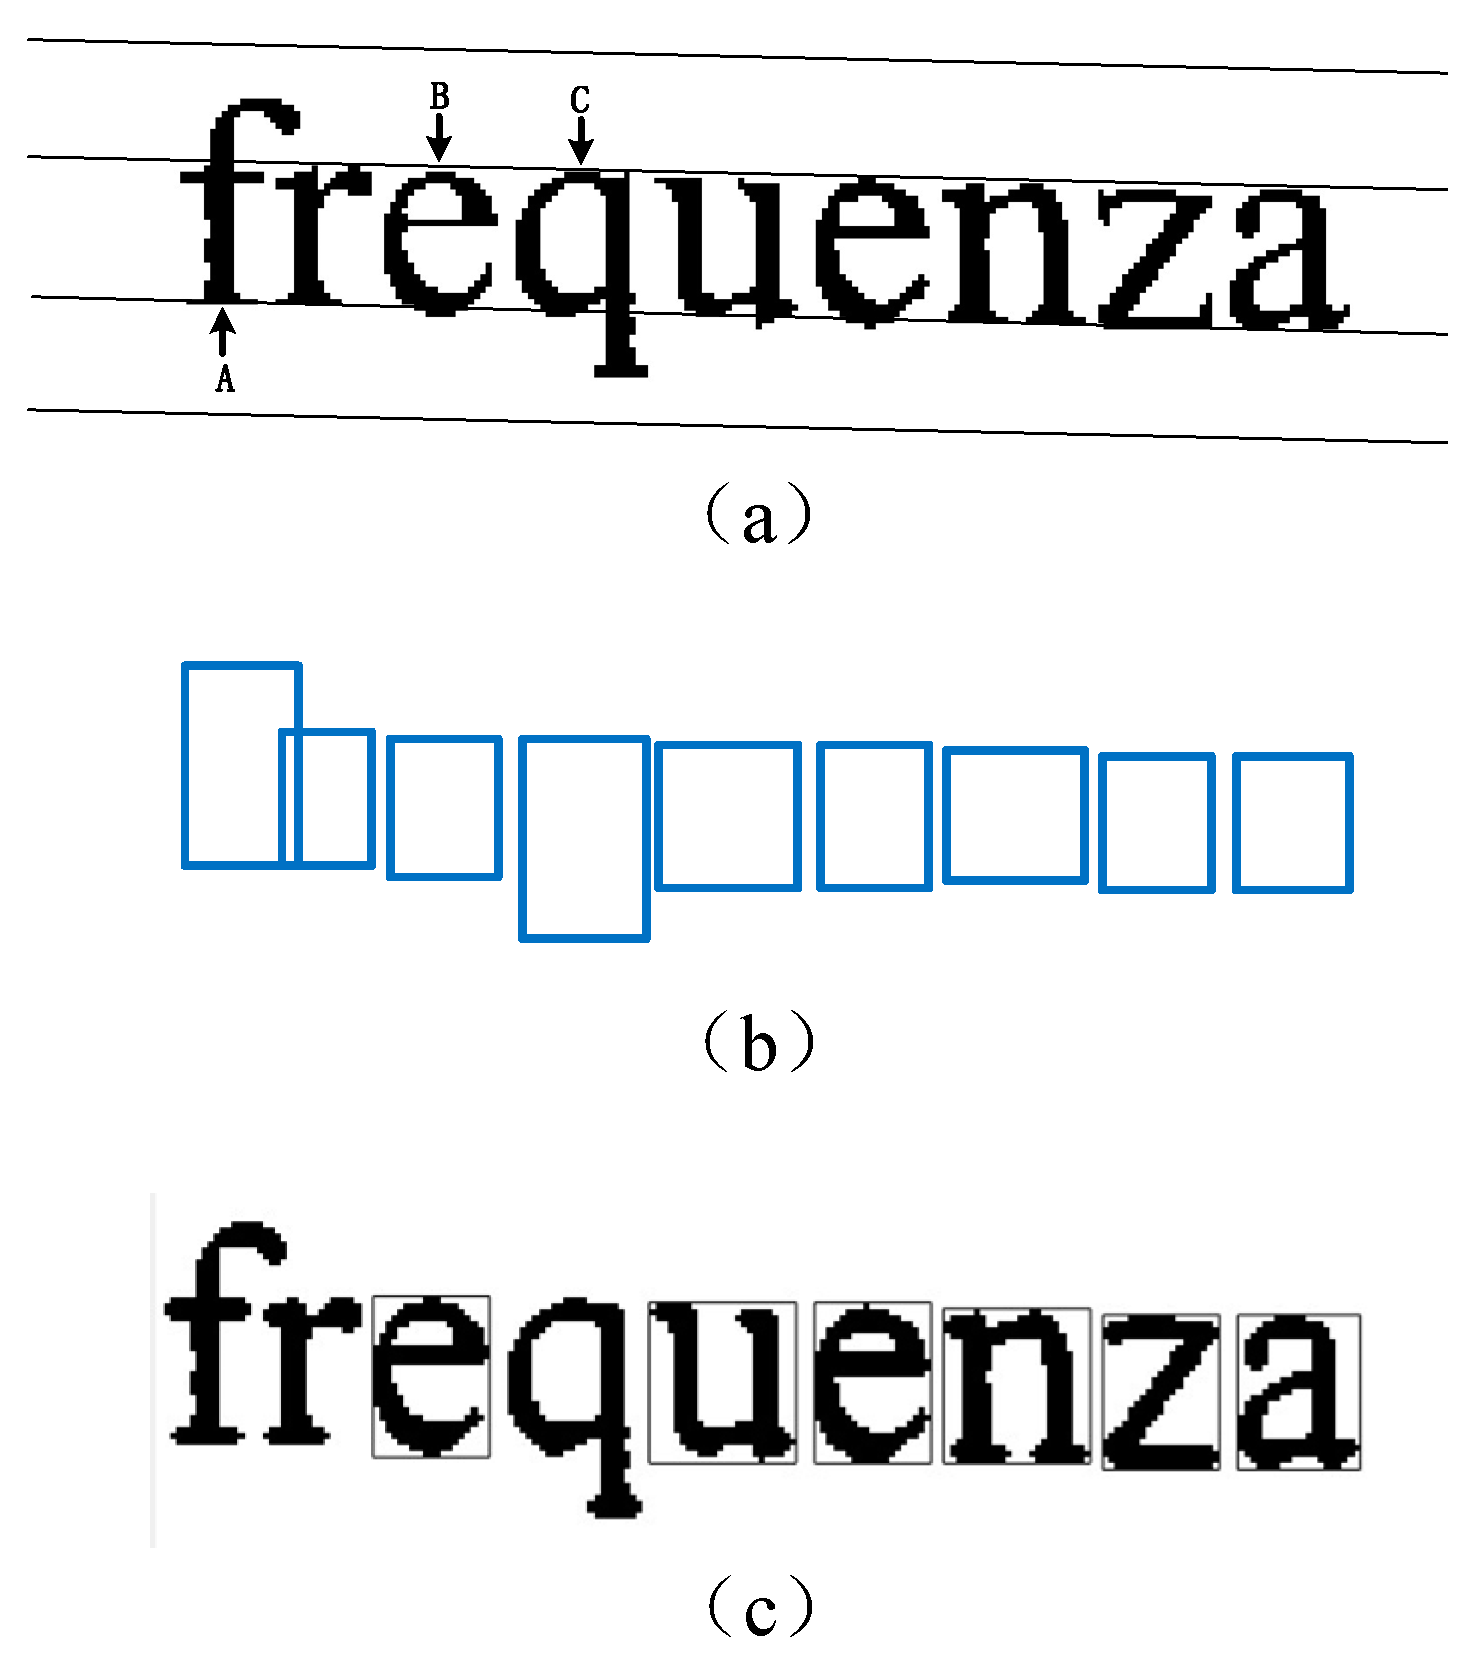
10]. In order to reduce the computation, in our algorithm, an English letter whose center of its corresponding bounding box is offset from the text-line needs to be remove. As shown in
Figure 3a, the 26 English letters can be classified into three types: A type such as the letter “f”, which is on the upper two lines; B type such as letter “e” is in the middle line; C type such as letter “q” is located in the lower two lines.
Figure 3b shows the bounding boxes of all the letters in the
Figure 3a. In our method, we need to save the bounding boxes of B type letters while removing the bounding boxes of A and C type letters. The result is as in
Figure 3c.
In summary, after searching for CCs in a document, we pick out the ECCs by following two steps: (1) use adaptive area threshold to remove non-text CCs, and (2) remove A and C type CCs by analyzing their bounding boxes’ aspect ratio.
3.2.1. Non-text CCs Removal
In this procedure, we mainly analyze the size of bounding boxes of non-text CCs instead of non-text CCs themselves, because the bounding boxes can more accurately represent the spatial position of the CCs. Then, we filter these non-text CCs by analyzing their bounding boxes’ size. Let us denote a set of bounding boxes in the binarized document as
. Then, we remove the CCs that violate
where
and
are thresholds for the size-based filtering. Both of them are document-based adaptive parameters. They can be defined by using following formulas:
where
is the mean width value of all the bounding boxes, and
is the mean height value of all the bounding boxes. Through the above processing, most of the non-text CCs will be filtered out and not involved in subsequent processes.
3.2.2. A and C Type CCs Filtering
As we can see from
Figure 3a,b, the bounding boxes of A type letters and C type letters are generally higher than the average bounding box height of letters in an English word. And the bounding boxes’ centers of them are also away from the text-line. Therefore, we impose constraints on the bounding boxes’ aspect ratios to remove A and C type CCs. We denote the widths and heights of bounding boxes as
and
, we remove CCs that violate
where
and
are two constants 0.6 and 2, respectively. These two parameters were determined by our extensive experiments, and
Figure 3c shows the ECCs after removing A and C type CCs by using bounding boxes.
With the help of the above two constrains, our approach can process complex documents with pictures and charts, which shows the robustness of our algorithm.
3.3. Skew Slopes Calculation
After image preprocessing and non-text CCs filtering, we get the ECCs to calculate the document skew slope values.
Figure 4b is a part of
Figure 4a which is surrounded by a red rectangular frame. From
Figure 4b we can see that the ECCs is picked out, and these ECCs’ centers are marked in
Figure 4c. The position coordinates of centers in
Figure 4c are used to indicate the positions of ECCs of
Figure 4b in our method.
In this procedure, we refer to the classical probability model to calculate the slope of the skewed document. From
Figure 4c, we can find that these centers are regularly distributed. They form several parallel lines because they are extracted from parallel text-lines. Through mathematical analysis, all the points of
Figure 4c have an equal probability to be taken. If we randomly select two different centers from
Figure 4c to form a line segment, this line segment has the highest probability of being approximately parallel to the text-line. The classical probability model indicates that when the number of samples is large enough, we can find that there are the most line segments parallel to the text-line.
Therefore, we first randomly select two ECCs of a document to calculate its slope, and put the resulting slope into a histogram. Then, we repeat the centers selection and slope calculation until the number of selections reaches a predefined threshold. Generally, the peak of histogram gives the slope of skew document. Considering that some documents with a small number of ECCs need repeated centers selection to increase the accuracy of the results, but too many times of repetition will undoubtedly increase the amount of computation, we chose a value of eight times the number of ECCs as the adaptive threshold value with the help of our experiments.
In order to improve the accuracy of our method, we select several slope values with the most accumulations instead of the one corresponding to the peak in histogram. On the one hand, in reality, there are several slope values that approximate the text-line slope due to the position errors, so we need to choose the best slope value to represent the skew of the document. On the other hand, some complex documents have multidirectional text-lines, and the slope value corresponding to peak of histogram may vary greatly at different times.
3.4. Skew Angle Estimation
In this section, we combine the
Q test and PP method to find the optimal skew angle value from the detected slope values of previous section (
Section 3.3). Here, we assume that we detect
slope values in
Section 3.3, and these slope values are
. We can find the optimal slope value for the above slope values using the Algorithm 1:
| Algorithm 1. A procedure to find the optimal skew angle value. |
| Input: Slope values after slope calculation (Section 3.3), original image |
| Output: The optimal angle |
| 1: array ; |
| 2: find range in array (); |
| 3: calculate each angle () corresponding to each slope of ; |
| 4: if |
| 5: use Q test to find the optimal slope value and calculate the skew angle ; |
| 6: else |
| 7: for |
| 8: ; |
| 9: project image horizontally or vertically and count the number () of blank rows or columns; |
| 10: end |
| 11: find the maximum value of , and analysis it to calculate the optimal angle ; |
| 12: end |
In this procedure, we mainly use Q test to find a more accurate result. But in some cases, the document has more than one text-line direction, and using classical probability model may result in very different slope values. Q test can only find outliers between some approximations, and if we continue to use Q test method, it may lead to serious errors. Therefore, if detected slope values are very different, we choose to use PP method to pick out the best slope value. Since we only need to rotate the original image times based on the detected slope values, there is no significant increase in calculation complexity. The detailed steps will be described in following part.
3.4.1. Skew Angle Calculation with Dixon’s Q Test
In statistics, Dixon’s Q test (also named Q test) is used to test if one single value is an outlier in a sample size between 3 and 10. In this procedure, we use Q test to check whether each slope value is an outlier by the following steps (assume there five detected slope values):
Step 1: Arrange five slope values in ascending order (smallest to largest). Assume
Step 2: Find the difference between the maximum value and the minimum value
Range.
Step 3: Find the absolute difference
Gap between the suspected outlier (assume
) and its closest number.
Step 4: Calculate the experiment
Q value (
).
Step 5: Find the
Q critical value
in the
Q table, where
Q table is a reference value corresponding to the sample size and confidence level. As shown in
Table 2, with four observations and at 90% confidence, the
Q critical value is 0.765.
Step 6: Compare with . If is larger than , this observation is considered to be an outlier, and mark it.
Step 7: Repeat step 3~step 6 to check whether each slope value is an outlier, then delete the marked outliers in step 6, and choose the mean of the remaining slope values to be the optimal slope value .
According to above slope value correction, we finally get the optimal slope value
. The skew angle can be calculated using the following formula:
where,
is the slope value of document. Here, the right part of above equation is appended to have degree representation (
), instead of the radian representation (
). The
is the document skew angle.
3.4.2. Skew Angle Detection with PP Method
As described in Algorithm 1 if the range of the detected slope values is larger than , which means the document may have more than one text-line direction, we will use the PP method to find the most accurate skew angle. This method consists of the following steps:
Step 1: Use Equation (9) to calculation the angle for each detected slope value, .
Step 2: Rotate the document counterclockwise if , else rotate clockwise.
Step 3: Project the document horizontally if , else project it vertically, and count the number of blank rows or columns in the document.
Step 4: Select another angle that has not been rotated, repeat step 2 and step 3 until all the above angles have been processed.
Step 5: Find the angle corresponding to the maximum number of blank rows or columns, which is the skew angle of the document.
Additionally, if the documents have different text orientations (i.e., vertical and horizontal), the skew angle
detected by above two methods requires further analysis using the following formula:
This extension is for some special cases, for instance, some traditional Chinese or Japanese documents are written vertically from top to bottom and starting at the right side of them.
3.5. Skew Document Correction
The final step is to rectify this inclination, the original document image is rotated by the calculated angle
. It is advised to use interpolation in image rotation. The interpolation method used in this paper is nearest neighbor interpolation [
36], because it is the simplest and least time-consuming compared with other interpolation methods. In addition, the phenomenon of contour jaggies caused by the nearest neighbor interpolation has little effect on the reading of the document.
Figure 4d illustrates an example of skew detection and image rotation using our proposed method.
5. Conclusions
In this paper, a novel fast and accurate method for skew angle detection and correction is proposed. The main novelty of our approach is that we combine the probability model, Q test, and PP method to achieve a good balance between computational complexity and accuracy. Comprehensive experiments have demonstrated the advantage of our method in terms of efficiency, robustness, and accuracy. Especially in terms of high efficiency, our approach greatly reduces the runtime by randomly selecting two center points to calculate the slopes. In addition to the above advantages, our method also attains high accuracy in skew estimation over the most popular dataset involving various document types: books, papers, newspapers, letters, forms, and even cartoons, and so on. This dataset also includes diverse linguistic writings such as English, Chinese, Japanese, and Greek.
Moreover, with the aim of developing our work, some further research may need to be done. For instance:
Improve our approach by replacing the fix number of random selections in the slope calculation step with an adaptive value, which can further improve the speed of the algorithm.
Develop a new extension of our method allowing to detect documents without characters or words, such as design drawings and so forth.


