Abstract
The insulated gate bipolar transistor (IGBT) is a crucial component of power converters (PCVs) and is commonly used in several PCVs topologies. On the other hand, the investigation and the study of the IGBT component show several changes within its behavior and lifetime, while this component is highly influenced by the operating conditions. Indeed, the monitoring of this component is necessary to minimize unexpected downtime of the wind energy system (WES). However, an accurate prediction of IGBTs remaining useful life (RUL) is the key enabler for life-time-optimized operation. Consequently, this work proposes a new prognostic approach for online IGBTs monitoring that adopts the time-domain analysis to extract useful information that is used as an input in the generation of the health indicator. Moreover, this approach is based on combining both of principal component analysis (PCA) technique and the feedforward neural network (FFNN) technique. PCA is used to reduce features extracted from IGBTs and the FFNN is implemented to achieve online regression of the trend parameter obtained from the PCA technique. To investigate and evaluate the performance of our idea we used the NASA Ames Laboratory Prognostics Center of Excellence IGBTs accelerated aging database. Finally, the achieved results clearly show the strength of the new trend parameter for IGBTs RUL prediction. The most notable strong correlation within the proposed approach is in relation to accuracy value, with an acceptable average accuracy rate of 60.4%.
1. Introduction
Ambitious worldwide renewable energy targets are pushing wind energy systems (WESs) to become a mainstream power source. Depending on the turbine type, WESs offer high power availability of more than 96%. Despite this high availability rate, this system is subject to various failures, such as mechanical and electrical failures. The survey indicated that the electrical failure rate is much higher than the mechanical failure rate in WES [1].
As it is revealed in Figure 1, the typical structure of a WES based on a doubly-fed induction generator (DFIG) comprises the wind turbine, the gearbox, the DFIG, the transformer, and the power electronics converters (PCVs), that is, the rectifier and the inverter. The electrical part comprises the doubly-fed induction generator (DFIG), the PCVs, and the transformer [1]. Nowadays, the actual service life of PCVs is less than the other subsystems, where the annual failure rate of PCVs is about 20% of WES total failures [2].
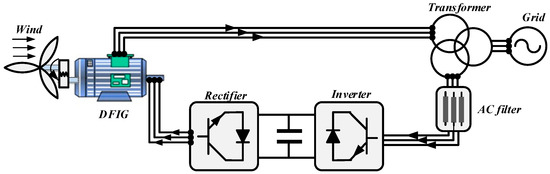
Figure 1.
Typical wind energy system (WES) structure based on the doubly-fed induction generator (DFIG).
Failures in PCVs can be found at several components such as capacitors, gate drives, and power semiconductor switches. According to a recent survey, the power semiconductor devices are the most vulnerable components in PCVs with a high failure rate [1].
Noteworthily, the insulated gate bipolar transistor (IGBT) is the most widely used power semiconductor switches in PCVs medium- and high-power supplies, where about 42% of power semiconductor switch used in WES are IGBTs [3]. In this regard, the reliability problem of IGBTs has been a research topic in the last few years [4].
For instance, a recent WES industry survey showed that the ratio of the IGBT failure cost is around 80% of the WES cost [5]. To prevent WES shut down due to IGBT failures, the implementation of an accurate prognostics health management (PHM) system is necessary. The investigation of the PHM optimizes the maintenance cost by predicting the damage accumulation and RUL. It is considered an intelligent maintenance way [6,7].
Usually, the mission profile of a component can be classified into three time-term categories; long, medium, and short cycles. As revealed in Figure 2 electrical failure appears in around a millisecond, it is classified as a short term failure. For this reason, it is necessary to protect the WES from electrical failures by investigating a prognostic approach. It should be noted that the prediction of the damage is also varied according to the time-term.
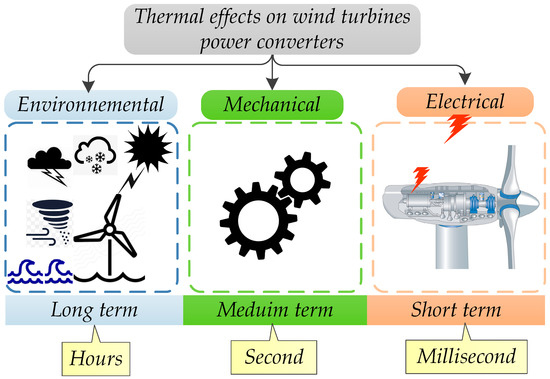
Figure 2.
Wind power converter thermal cycles.
It is common knowledge that prognostic approaches can be classified into three different types, specifically: physics-based, data-based, and hybrid approaches. Each approach makes use of different information. To begin with, the physics-based approach is based on an analytical model to follow-up the degradation process [7,8].
There is a considerable amount of literature on physics-based approaches. Often, the physics-based approach assumes that the degradation health state is described by a complex physical model combined with the usage conditions to define the physical model parameters. These parameters are used in the prediction of future behavior and the remaining useful life (RUL) of the IGBT device.
Several studies have been carried out on Bayesian estimation techniques employed in a physics-based approach. For instance, Haque et al. presented in [9] a new method to estimate the IGBT health state using the collector-emitter-on state voltage. The authors investigate the auxiliary particle filter technique with an additional option that identifies the time when the destruction is evident in IGBT. Then, Saha et al. [10] suggested a new prognostic tool for IGBT devices, wherein this prognostic method the particle filter was a starting point. Celaya et al. [11] developed two model-based approaches; the first one is based on the extended Kalman filter technique and the second one is based on the particle filter technique. They investigated the ON-state resistance signal. They compared the results and the particle filter was more efficient.
On the other hand, many papers document the data-driven strategy, with data-driven approaches focusing on the real data collected from the test boards. This approach uses several techniques to identify the characteristics of degradation phenomena and to predict the future trend of the analyzed component. There are two kinds of data-based approaches; the first one is artificial intelligence techniques and the second one is statistical techniques.
In the literature of artificial intelligence techniques, there seems to assume that the most used tool is the artificial neural network method. For example Hong et al. investigated in [12], an extended version of the neural network, once the training process is performed, the degradation level is extracted. This approach is realized using the junction temperature training signal. The main drawback of this method, it requires a very large database. Additionally, Alghassi et al. [13] proposed an IGBT’s RUL prediction method using a machine learning tool. They implemented the time-delay neural network method with the investigation of the collector-emitter voltage signal as a training signal. This method suffers from complexity. Then, Hu et al. [14] proposed an online RUL prediction method for IGBT. The RUL prediction was realized by the artificial neural network (ANN) in the input layer they use three precursor signals; the on-state collector-emitter voltage Vce, the Miller platform voltage Vm, and Miller platform time. The experimental results proved the effectiveness of this method however it suffers from the very high number of the precursor signals.
On the other hand, statistical approaches are habitually used in a data-based prognostic approach. For example, in [15], Ali et al. presented an IGBT data-based prognostic approach using the on-state collector-emitter voltage. They proposed a model parameter identification using the Gaussian process method for applying a Bayesian inference on RUL estimation. Therefore, Ismail et al. presented in [16,17] an IGBT’s RUL prediction approach using the collector-emitter voltage signal, and the estimation model is realized through the collector-emitter voltage precursor signal, and they proposed a RUL estimation model that uses the Gaussian regression process for thermally aged power IGBTs. This method predicts accurately the RUL. Additionally; Ismail et al. presented in [18] a modified maximum likelihood RUL estimator combined with a time-domain analysis of the available data to prognosis the IGBT failure. This approach is based on the case temperature signal. This method provides a good RUL prediction result, however, it requires initialization. Additionally, Wu et al. [19] used the maximum likelihood estimation (MLE) to predict the IGBT life cycle; they employed the junction temperature and vibration as a precursor signal. This method suffers from complexity and a high number of precursor signals.
A comprehensive and detailed review of various data-driven algorithms with comparison can be found in [20].
In this work, the focus has been to overcome the trend parameter choice problem. To overcome this problem, we propose to use linear feature reduction techniques. These techniques act as a fusion technique for the extracted features. In this way, we propose a new health indicator for the IGBT device. Thereby, the principal component analysis (PCA) technique is used in this work to reduce original features extracted from measured data. In the second step, we recommend using the feedforward neural network (FFNN) as a regression algorithm for prognostic purposes.
2. Prognostic: Definition and Relationship
2.1. PHM Definition
The main advantage of the PHM concept is its cost-effective maintenance. Where the maintenance process is achieved based on the results provided by diagnostics and prognostic purposes.
The development of a PHM system is considered as the concatenation of seven purposes. All of them anticipate failure mechanisms and improve life cycle management [21].
These purposes are organized as follows to generate a robust life cycle management: (1) The first stage is related to the data acquisition; this step consists in the collection of data from different sensors and (2) the second step is the data processing. This step consists of the extraction of the degradation features from the measured data. (3) The third is the condition assessment. This step is related to the analysis of the current state and the degradation state, which can also be used in (4) the fourth step corresponding to the fault detection and diagnostics. (5) The fifth step aims at predicting degradation trends to evaluate the RUL. (6) The sixth step is the decision-making step, which is considered as feedback support. (7) Finally, the seventh step presents human intervention [21].
As is seen in Figure 3, these purposes are grouped into three main stages; observation, analysis, and action. The observation stage starts from the data acquisition step until the data processing step. The analysis stage starts from the condition assessment step until the prognostics step. The action stage starts from the decision support step, until the human-machine step.
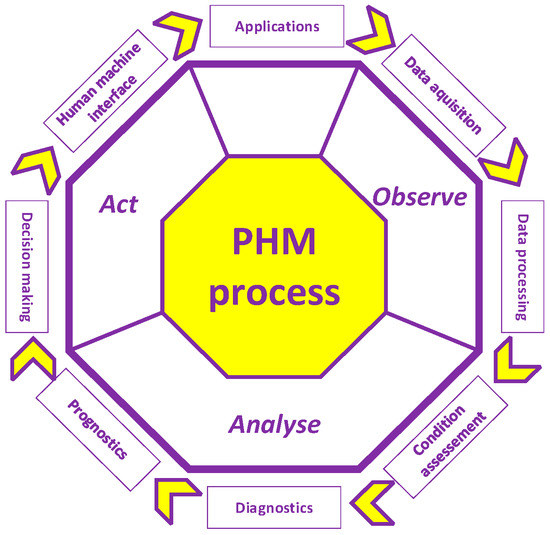
Figure 3.
Prognostics health management (PHM) process.
Indeed, the observation function has become a challenge. Even when the measured data does not show the degradation behavior clearly. There are various ways to view and survey the degradation behavior of the monitored IGBT using the data processing step. The main benefit of this step is the ability to extract the degrading trends whether the fault occurs or not yet, it is related only to the precursor data. This function provides useful features, which will be used in the analysis function (i.e., diagnostics and prognostics).
In PHM industries, the analysis function manifests the actual health state of the system through two main tasks the diagnostic and the prognostic. Furthermore, the analysis function is developed to forecast the future health state and to compute the RUL using an effective prognostic algorithm.
Finally, the action function is a decision-making unit, which executes the decided maintenance actions regarding the current health state of the asset. All these functions provide useful health information that can be used to satisfy the operating conditions.
2.2. Precursor Signal
Several measured data are used in the open literature. Therefore, the question is always arises in the last few years: what is the most suitable and the best data? The choice of the adequate data depends on many factors such as noises and fluctuation. In general, measured data contain noises and fluctuations, which raise problems for the PHM concept. Therefore, the definition of adequate measured data will surely facilitate PHM implementation [22].
There are many measured data obtained from sensors. The main measured data can be listed as follow:
- -
- Collector-emitter voltage (Vce).
- -
- Collector-current (Ic).
- -
- Gate-emitter voltage (Vge).
- -
- Thermal and electrical resistance (turn ON (Ton) and turn OFF (Toff)).
During the analysis of the fault and the sensor system, many required performance should be considered. The relevant performances include:
Sensitivity (S): The variation of the output signal concerning the variation in the input signal (slope of the calibration curve). It is expressed as follows:
where the M denotes measurement and t denotes time.
Linearity (L): The relation between the calibration curve and the theoretical behavior in terms of closeness. The linearity is expressed as follows:
where the C denotes calibration and T denotes theoretical behavior.
Accuracy (A): minimizing the error between the measurement quantity value and its true value. The accuracy can be written as follows:
Online measurement: The time quantity a sensor takes to act and give a measurement.
Calibration: Both of the maximum and minimum values of the measured quantity.
For all PHM applications, the technicians, experts, and researchers need to consider all of factors detailed above.
The performances of all the measured data are summarized in Figure 4. The performances are summarized in terms of six main metrics; sensitivity, linearity, accuracy, capability, and online measurement. As it is shown in Figure 4 the Vce data performances are higher compared to the other measured data [23,24]. Therefore, in this paper, we use only the Vce signal. The most achievement is to use only one signal as a failure signature for the IGBT failure prognostic.
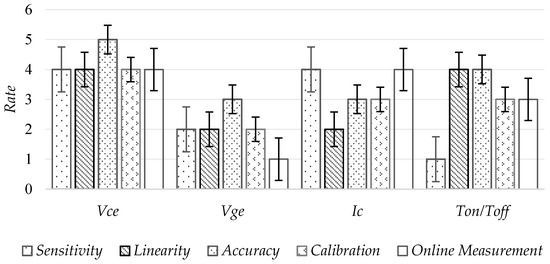
Figure 4.
Performance comparisons of the measured data from insulated gate bipolar transistor (IGBT).
3. Methods
3.1. Proposed Prognostic Approach
The proposed approach for IGBT failure prognostic is summarized in Figure 5. The proposed approach is divided mainly into three steps; during the first step of the proposed approach, a preprocessing phase is organized to collect data from sensors. Once the preprocessing phase has been done, we can then pass to the processing phase in which we manipulate collected data to extract useful features and extract health indicators using the PCA technique. With the completion of the processing phase, we are now ready to carry out the results and the degradation level of the analyzed IGBT component by the post-processing phase using the FFNN technique.
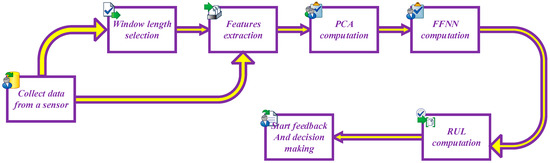
Figure 5.
Block diagram of the proposed method.
The basic task in the proposed approach is the feature extraction task. The crucial task is the feature reduction task. The prognostic task is the decisive task in our approach. The benefit of our approach is observed in the predicted RUL.
We believe this solution will aid the industrialists in the maintenance process.
3.2. Feedforward Neural Network (FFNN)
Several prognostic methods put forward learning automatically from previous degradation behavior to solve this issue. This learning technique can be viewed as an artificial intelligence technique. The past years have seen a renewed importance in artificial intelligence techniques, where researchers have produced numerous advances in wide fields and applications.
The artificial intelligence techniques include the neural network (NN), and the feedforward neural network (FFNN) is an extended version of NN. We chose the FFNN to investigate artificial intelligence techniques because it is the common one [5].
Generally, the FFNN is composed of neurons, these neurons are grouped into layers, and layers are divided into three types; the first layer is named the input layer, its role is receiving data from outside. Then, the last layer named the output layer, this layer provides the processed data by the FFNN. While the hidden layer performs the interconnection between the input layer and the output layer. It should be noted that FFNN conveys information in only one direction [25].
For a detailed description, the FFNN is based on a training process that aims to search the optimal parameters of the FFNN. There are two categories of parameters; weights and biases. Weights are the interconnection between different nodes and biases are coefficients attached to each neuron of hidden and output layers [25].
Once the FFNN is trained, the model is founded using a transfer function. Where the FFNN parameters are the input of the transfer function.
Noteworthily, the structure of the FFNN should be determined after the analysis of the problem statement, where the structure describes the mechanism between the input layer and the output layer. In this paper, we explore the structure presented in Figure 6.
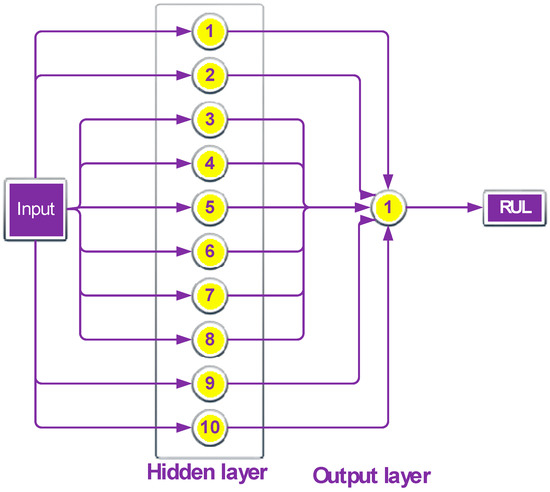
Figure 6.
Structure of the proposed feedforward neural network (FFNN) for the remaining useful life (RUL) prediction task.
3.3. Correlation Dimension Estimator
In this work, we investigate the estimating dimensionality purpose to estimate the new dimensional space of the extracted features. In the field of dimension estimation, various techniques can be found. One of these techniques is the correlation dimension estimator (CDE). The CDE estimates the reduced dimensional space by analyzing the relationship between nearest-neighbors within the extracted features; it is built on the assumption that the dimensional set scales (d) with its size (r) are combined as rd. Therefore, the number of samples covered by a hypersphere with the radius (a) grows proportionally to rd. The algorithm that describes the CDE method is presented in Algorithm 1.
| Algorithm 1 CDE |
| 1. find the k nearest neighbors for all features data points. |
| K is the number of neighbors that are stored |
| Space distance matrix D |
| 2. extract an index of the non-zero value D |
| 3. for i = 1, 2, …, N (where N is the features data cycles) |
| Do |
| Compute the distance |
| where V is one’s vector |
| Compute the number of elements within the median value S1 |
| Compute the number of elements within the maximum value S2 |
| End for |
| Dim E |
3.4. Principal Component Analysis
In the literature, the principal component analysis (PCA) is the widely used technique for feature reduction purposes. The PCA technique was chosen because it is one of the most practical and feasible ways to reduce features. In general, the PCA is considered as a statistical technique, which transforms an original set of features in a multi-dimensional space into a smaller dimensional space, which represents most of the useful information provided by the original features. To carry out the PCA technique, a linear transform was used.
The PCA technique aims to generate principal components (PCs), they can be viewed as a new set of features. The PC should be found by sorting the eigenvectors in descending order of the eigenvalues and select the first PC with maximum eigenvalues.
The resulted PCs are characterized by; a maximum variance value, they are correlated, no redundant information, a minimum mean squared approximation error, a high variability, and finally, PCs are orthogonal to each other.
In this work, the PCA technique is investigated to provide an optimized HI from the statistical features extracted from IGBT.
4. Experimental Results
4.1. Raw Data of IGBT Device (Data Collection)
The IGBT device degradation aging experiment data involved in this work are collected from the NASA Ames Laboratory Prognostics Center of Excellence [23]. A professional data-acquisition board was used to collect the measured Vce signal, then the acquired signal was stored on a computer via the professional LabVIEW software. The sampling rate of the acquired data is equal to 10 kHz. The degradation data set had been recorded from a transistor test board at NASA comprising commercially available IRG4BC30KDPBF IGBT (Infineon Technologies, Neubiberg, Germany). The IGBT devices were run through thermal-electrical stress operational profiles at room temperature (controlled temperature) [26,27].
In the real industrial world, the degradation cycle may be much longer than this aging experiment. Noteworthily, these experiments were stopped when the IGBT latch-up and thermal runaway which are the end-of-life (EOL) criteria. Under the aging experiment, the collector-emitter voltage (Vce), gate-emitter voltage (Vge), collector-current (Ic), Thermal and electrical resistance, and switch turn On (Ton) and turn Off (Toff) and time (seconds) were measured (physical quantities) [28]. In the rest of this paper, we use the collector-emitter voltage (Vce) as a precursor signal [29].
4.2. Feature Extraction
In the real industrial world, time-domain features are considered as statistical features. Regarding the simple implementation and the low computation time of these features, they are the most useful tool in the feature extraction task. Additionally, they provide suitable features for prognosis.
This work is built on the statistical features contained in Table 1. We note that N is the window length of the analysis Vce measurement slice, i is the sample in unit time, is the value of the precursor signal in unit time i.

Table 1.
Time-domain features.
In this work, let us consider the IGBT No. 5 obtained from the NASA database. This IGBT measurement contains 1,300,000 data samples, Figure 7 shows the Vce signal with 1300 thousand measures.
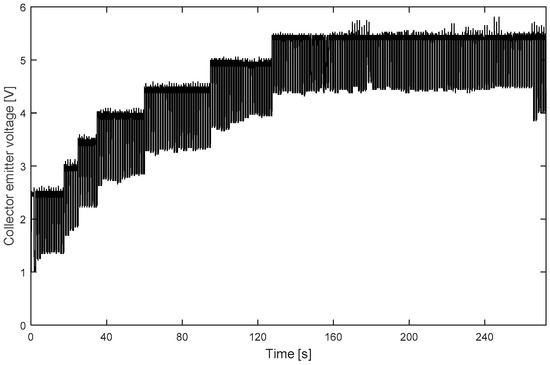
Figure 7.
The collector-emitter voltage signal ending with IGBT burns out.
The chosen time-domain features are used to highlight the degradation behavior of the analyzed device using the available Vce measurement data.
Firstly, the time-domain features are computed; therefore, degradation trends appear as it is revealed in Figure 8.
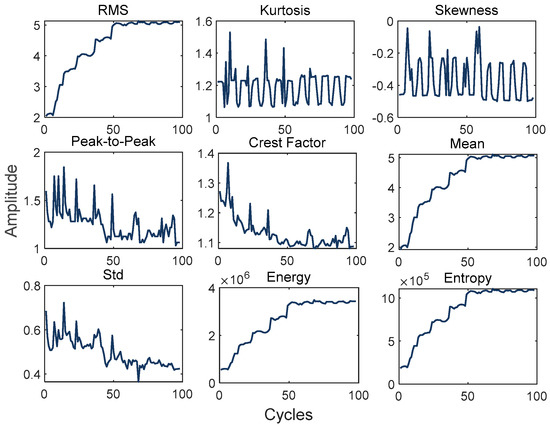
Figure 8.
The evolution of the extracted features using a time-domain analysis of the Vce measurement.
Secondly, the features are normalized using a whitening linear transform process. This process can be outlined in the following equation.
where . The scale denotes the last cycle point value of each feature and the offset stands for the first cycle point value of each feature [16,18,21].
4.3. Features Reduction
As stated in the introduction, our main target is to reduce the dimensionality space of the extracted features obtained in the feature extraction task. In this paper, we propose to transform features presented in Figure 8 into a lower-dimensional space using the PCA technique. The correlation between feature extraction and feature redaction techniques is interesting because it provides suitable trend parameters for the prognosis step.
Firstly, the CDE is implemented to estimate the dimensionality of the new reduced dimensional space. The CDE result dives a new size of the new space equal to 1.38. Thus, in the rest of this paper, we fix the dimensional space to one dimension. Therefore, the dimension of the original feature matrix is fixed to {90 × 1} elements. After that, by applying the PCA technique, the new suitable feature is obtained and the non-significant features are eliminated. In this paper, only the first features in the new spaces are considered to estimate the IGBT degradation health state due to its highest eigenvalue. Figure 9 shows, the first PCA component, which is used as a trend parameter for four cases of IGBT component. In the rest of this paper, the time evolution of the IGBT is considered as a HI.
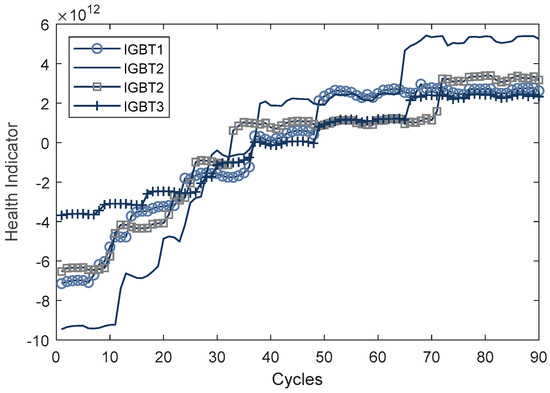
Figure 9.
The evolution of the first principal component analysis (PCA) component for four IGBTs components.
4.4. Online Prognostic
This sub-section explains the prognosis step the results of four IGBT degradation scenarios are analyzed in detail. The scenarios differ from each other in terms of the threshold. We use four IGBTs to evaluate the strength of the proposed approach. The first step in the prognostic purpose is the prediction of future degradation. Figure 10 shows the degradation of the health state results of the proposed prognostic. The future degradation health state prediction approach is made at cycles: 10, 20, 30, and 40 until the EOL event. In the rest of this paper, the threshold is fixed equal to the EOL. As shown in Figure 10 the FFNN technique can forecast the PCA even when measurement data are no longer available. The prediction of the degradation of the health state starts after the last measurement data acquired.
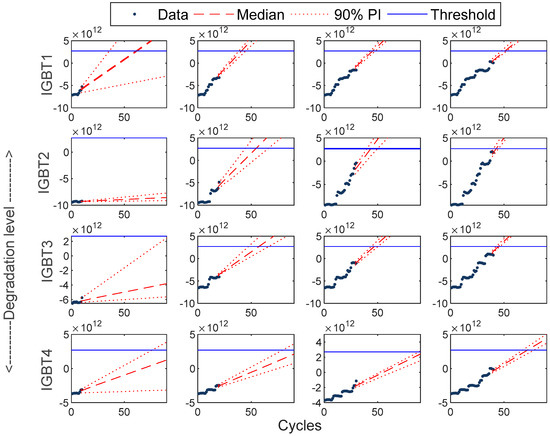
Figure 10.
Prediction of degradation level with a different number of data points.
As seen in Figure 10, it is fundamental to note that IGBT failure can be predicted easily by the proposed prognostic approach. The results from the proposed prognostic approach are evident by considering the degradation of the health state and the high prediction ability. We conclude from Figure 10 more the data is larger, the predictions task is expected to be easier, more accurate, and precise.
The main importance of the proposed failure prognosis approach over other approaches explored in the literature is considering the uncertainty in prediction degradation points. In this work, the uncertainty provides the mean prediction of the FFNN technique and the 90% Prediction Interval (PI). As is revealed in Figure 10 in all cases as more data become available, the PI is smaller.
By analyzing the subplots presented in Figure 10 from left to right we deduct that with the increasing number of available data, the prediction task becomes more robust and accurate. Therefore, the degradation gets closer to real EOL.
The results of the health degradation state presented in Figure 10 do not allow a leasable and scientific presentation of the health state. Therefore it is necessary to compute and present the RUL graphically. The RUL can be computed as follow:
where CRUL presents the RUL cycle, CEOL presents the EOL cycle and CActual presents the actual cycle.
Noteworthily, the CEOL is obtained by solving the following equation.
where presents the degradation level in the EOL cycle.
Figure 11 represents the predicted RUL of the four IGBTs components. This prediction is realized through our proposed approach. The proposed approach investigates the combination of PCA and FFNN methods. Figure 11 proves that our findings appear to be well supported by the feature reduction technique. There is a good agreement between real and predicted RUL.
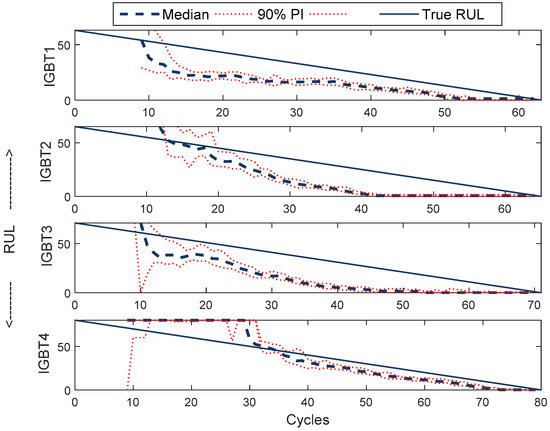
Figure 11.
True and predicted RUL within the prediction interval.
The convention for predicted RUL plots is explained as follows; since its remaining life starts with the initial x-axis at 10 cycles, going towards the remaining cycles. In Figure 11, we observe that the proposed RUL prediction approach can predict the RUL at all the testing cycles, even with a few data set.
Noteworthily, in the four cases the RUL predicted by our method starts with a relatively high RUL value comparing to the true RUL, then it decreases rapidly in the same way as the true RUL. Note that the predicted RUL tracks closely with the True RUL even at an early cycle before decreasing. After all, with our approach after the predicted RUL reached exactly the threshold at the true EOL IGBT device. Eventually, these results prove the efficiency and the robustness of the proposed prognostic approach in the RUL prediction.
This result has further strengthened our confidence in the feature redaction technique to provide a suitable trends parameter and to enhance the prognostic results.
To quantify the RUL prediction performance, different metrics were defined in the literature [8]. In this work, we used three common metrics to evaluate and analyze the performance of our approach. They are listed as follow:
Normalized root mean square error (RMSE), this metric evaluates the RUL prediction accuracy to be the same magnitude as the true RUL, it allows the error [8]. The NRMSE is expressed as:
Fitness degree R2, within this metric high performance of RUL prediction results, is achieved when the R2 result value is near to 1 [8]. The R2 is computed as follow:
Accuracy (A): this metric presents the accuracy between the true RUL and predicted RUL; the result of this metric is given as a percentage [8].
It is necessary to expose a direct evaluation of the proposed method to exploit the performance. In this work, the evaluation task is achieved through three statistical properties as follows; NRMSE, R, and Accuracy metrics. According to the results summarized in Table 2, the proposed approach is a suitable prognostic approach to predict IGBT failure. In the case of IGBT number 3, the RUL prediction performance is a bit lesser than the other IGBT cases but it is still considered as acceptable performance.
Table 2.
Proposed approach evaluation.
According to Table 2, it was found that the average of NRMSE result is equal to 0.2, this value is reduced, which proves the ability of the proposed approach to predict the RUL. On the other hand, we found that the R2 average result is equal to 0.74. This value is relatively close to 1 and confirms that our approach is powerful. Additionally, that leads us to deduct that the predicted RUL is in the same way as the real RUL. Therefore, it was found that the average accuracy metric is equal to 60%; this metric result is above 50%, proving the acceptable accuracy of the proposed RUL prediction approach.
The single most marked observation to emerge from Table 2 was in all the IGBTs cases the RUL prediction performance is high and within high norms. Our technique shows a clear advantage over previous studies. It should be noted, this is the first study in which the trend parameter depends on only one signal and needs only one sensor. The percent of the accuracy metric that confirmed our finding was acceptable.
5. Conclusions
This paper addressed IGBT RUL prediction purposes. The proposed approach uses time-domain features to extract useful information. Therefore, the proposed method exploits the feature reduction purpose using the PCA method. The principal advantage of the proposed method is that once the HI is identified using the PCA method. It is easy to predict degradation damage.
The results presented in this paper were obtained using just the Vce database without any needed extra sensors. Besides, the proposed approach does not need a model. These are the main advantages targeted in real applications.
Experimental results have proven that the proposed method has good performance. Nevertheless, this method requires initialization. As future work, further data collection would be needed to determine exactly how the proposed approach affects the PHM purpose. Additionally, we will need to apply the proposed method to a real-world WES. Indeed, a comparison with other prognostic approaches will be also pointed out.
Author Contributions
Conceptualization, A.I. and L.S.; methodology, A.I., L.S., M.S. and M.B.; software, A.I. and L.S.; validation, L.S., M.B. and M.S.; formal analysis, A.I., L.S., M.B. and M.S.; investigation, L.S. and M.B.; writing—original draft preparation, A.I., L.S. and M.B.; writing—review and editing, L.S., M.B. and M.S. All authors have read and agreed to the published version of the manuscript.
Funding
This research received no external funding.
Conflicts of Interest
The authors declare no conflict of interest.
References
- Tavner, P. How are we going to make offshore wind farms more reliable? In Proceedings of the Supergen Wind 2011 General Assembly, Durham, UK, 20 March 2011. [Google Scholar]
- Council, G.W.E. Global Wind Statistics 2017; Global Wind Energy Council: Brussels, Belgium, 2018. [Google Scholar]
- Yang, S.; Bryant, A.; Mawby, P.; Xiang, D.; Ran, L.; Tavner, P. An industry-based survey of reliability in power electronic converters. IEEE Trans. Ind. Appl. 2011, 47, 1441–1451. [Google Scholar] [CrossRef]
- Ismail, A.; Saidi, L.; Sayadi, M. Wind turbine power converter fault diagnosis using DC-link voltage time-frequency analysis. Wind Eng. 2019, 43, 329–343. [Google Scholar] [CrossRef]
- Pecht, M.; Kang, M. Introduction to PHM. In Prognostics and Health Management of Electronics: Fundamentals. Machine Learning, and the Internet of Things, 2nd ed.; John Wiley and Sons, Inc.: Hoboken, NJ, USA, 2018. [Google Scholar] [CrossRef]
- Lu, B.; Sharma, S.K. A literature review of IGBT fault diagnostic and protection methods for power inverters. IEEE Trans. Ind. Appl. 2009, 45, 1770–1777. [Google Scholar]
- Kim, N.H.; An, D.; Choi, J.H. Prognostics and Health Management of Engineering Systems: An Introduction; Springer: Cham, Switzerland, 2017. [Google Scholar]
- Niu, G. Data-Driven Technology for Engineering Systems Health Management; Springer: Beijing, China, 2017. [Google Scholar]
- Haque, M.S.; Choi, S.; Baek, J. Auxiliary particle filtering-based estimation of remaining useful life of IGBT. IEEE Trans. Ind. Electron. 2017, 65, 2693–2703. [Google Scholar] [CrossRef]
- Saha, B.; Celaya, J.R.; Wysocki, P.F.; Goebel, K.F. Towards prognostics for electronics components. In Proceedings of the 2009 IEEE Aerospace Conference, Big Sky, MT, USA, 7–14 March 2009; pp. 1–7. [Google Scholar]
- Celaya, J.; Saxena, A.; Saha, S.; Goebel, K.F. Prognostics of power MOSFETs under thermal stress accelerated aging using data-driven and model-based methodologies. In Proceedings of the Annual Conference of the Prognostics and Health Management Society, Montreal, QC, Canada, 25–29 September 2011. [Google Scholar]
- Hong, S.; Zhou, Z.; Lv, C.; Guo, H. Prognosis for insulated gate bipolar transistor based on Gaussian process regression. In Proceedings of the 2013 IEEE Conference on Prognostics and Health Management, Gaithersburg, MD, USA, 24–27 June 2013; pp. 1–5. [Google Scholar]
- Alghassi, A.; Perinpanayagam, S.; Samie, M. Stochastic RUL calculation enhanced with TDNN-based IGBT failure modeling. IEEE Trans. Reliab. 2015, 65, 558–573. [Google Scholar] [CrossRef]
- Hu, Z.; Ge, X.; Xie, D.; Zhang, Y.; Yao, B.; Dai, J.; Yang, F. An Aging-Degree Evaluation Method for IGBT Bond Wire with Online Multivariate Monitoring. Energies 2019, 12, 3962. [Google Scholar] [CrossRef]
- Ali, S.H.; Heydarzadeh, M.; Dusmez, S.; Li, X.; Kamath, A.S.; Akin, B. Lifetime estimation of discrete IGBT devices based on Gaussian process. IEEE Trans. Ind. Appl. 2017, 54, 395–403. [Google Scholar] [CrossRef]
- Ismail, A.; Saidi, L.; Sayadi, M.; Benbouzid, M. Remaining useful lifetime prediction of thermally aged power insulated gate bipolar transistor based on Gaussian process regression. Trans. Inst. Meas. Control 2020, 42, 6004–6009. [Google Scholar] [CrossRef]
- Ismail, A.; Saidi, L.; Sayadi, M.; Benbouzid, M. Gaussian process regression remaining useful lifetime prediction of thermally aged power IGBT. In Proceedings of the IECON 2019—45th Annual Conference of the IEEE Industrial Electronics Society, Lisbon, Portugal, 14–17 October 2019; pp. 6004–6009. [Google Scholar]
- Ismail, A.; Saidi, L.; Sayadi, M.; Benbouzid, M. Remaining useful life estimation for thermally aged power insulated gate bipolar transistors based on a modified maximum likelihood estimator. Int. Trans. Electr. Energy Syst. 2020, 30, e12358. [Google Scholar] [CrossRef]
- Wu, H.; Ye, C.; Zhang, Y.; Nie, J.; Kuang, Y.; Li, Z. Remaining Useful Life Prediction of an IGBT Module in Electric Vehicles Statistical Analysis. Symmetry 2020, 12, 1325. [Google Scholar] [CrossRef]
- Fang, X.; Lin, S.; Huang, X.; Lin, F.; Yang, Z.; Igarashi, S. A review of data-driven prognostic for IGBT remaining useful life. Chin. J. Electr. Eng. 2018, 4, 73–79. [Google Scholar]
- Saidi, L.; Ali, J.B.; Benbouzid, M.; Bechhofer, E. An integrated wind turbine failures prognostic approach implementing Kalman smoother with confidence bounds. Appl. Acoust. 2018, 138, 199–208. [Google Scholar] [CrossRef]
- Oh, H.; Han, B.; McCluskey, P.; Han, C.; Youn, B.D. Physics-of-failure, condition monitoring, and prognostics of insulated gate bipolar transistor modules: A review. IEEE Trans. Power Electron. 2014, 30, 2413–2426. [Google Scholar] [CrossRef]
- Sonnenfeld, G.; Goebel, K.; Celaya, J.R. An agile accelerated aging, characterization and scenario simulation system for gate controlled power transistors. In Proceedings of the 2008 IEEE AUTOTESTCON, Salt Lake City, UT, USA, 8–11 September 2008; pp. 208–215. [Google Scholar]
- Astigarraga, D.; Ibanez, F.M.; Galarza, A.; Echeverria, J.M.; Unanue, I.; Baraldi, P.; Zio, E. Analysis of the results of accelerated aging tests in insulated gate bipolar transistors. IEEE Trans. Power Electron. 2015, 31, 7953–7962. [Google Scholar] [CrossRef]
- Svozil, D.; Kvasnicka, V.; Pospichal, J. Introduction to multi-layer feed-forward neural networks. Chemom. Intell. Lab. Syst. 1997, 39, 43–62. [Google Scholar] [CrossRef]
- Saxena, A.; Celaya, J.; Saha, B.; Saha, S.; Goebel, K. On applying the prognostic performance metrics. In Proceedings of the Annual Conference of the Prognostics and Health Management Society, San Diego, CA, USA, 27 September–1 October 2009. [Google Scholar]
- Celaya, J.R.; Saxena, A.; Wysocki, P.; Saha, S.; Goebel, K. Towards Prognostics of Power MOSFETs: Accelerated Aging and Precursors of Failure. NASA Ames Prognostics Data Repository; NASA Ames Research Center: Moffett Field, CA, USA, 2009. [Google Scholar]
- Ahsan, M.; Hon, S.T.; Batunlu, C.; Albarbar, A. Reliability assessment of IGBT through modelling and experimental testing. IEEE Access. 2020, 8, 39561–39573. [Google Scholar] [CrossRef]
- Patil, N.; Celaya, J.; Das, D.; Goebel, K.; Pecht, M. Precursor parameter identification for insulated gate bipolar transistor (IGBT) prognostics. IEEE Trans. Reliab. 2009, 58, 271–276. [Google Scholar] [CrossRef]


© 2020 by the authors. Licensee MDPI, Basel, Switzerland. This article is an open access article distributed under the terms and conditions of the Creative Commons Attribution (CC BY) license (http://creativecommons.org/licenses/by/4.0/).