1. Introduction
Modern life is more and more digitized; the dependency of most human activities on information technology is inescapable. The use of smartphones and wearable gadgets significantly expands the domains of users. Based on the investigation of Baer et al. [
1], studying the increase in the amount of communication devices and electricity demand in the US, the researchers concluded that even a large growth in the deployment and use of digital technologies will only modestly increase electricity consumption. On the other hand, global resource consumption will exceed planetary supply by 2030, according to the data from U.S. Energy Information Administration [
2], as the consumption of energy has increased by more than three times starting from 1980 until 2018. In absolute terms, the world consumed about 23,000 billion kWh in 2017. These numbers show that the energy consumption issue is becoming much more globalized.
If we look at the daily behavior of people—digital consumers—related to energy consumption, we find lots of wasteful habits followed by several people, where they do not even think about it. For example, there is a tendency of leaving the personal workstation or laptop running 24/7 even if it is necessary to the job only for a fraction of time. A running computer, estimating a typical desktop workstation with a 17-inch display, consumes about 65–100 watts and 35 watts of electricity/hour for the computer and display, respectively. If the computer system is left on 24/7 for a year, it will consume 874 kilowatt-hours of electricity that is enough to release 341 kg of carbon dioxide into the atmosphere, and can also be equated to driving 1312 km in an average car [
3].
Keeping in mind the importance of the above-mentioned problems, many organizations have started to design their products in order to consume less energy not only in terms of financial costs, but also to minimize the heat emission and support a green environment. The energy consumption analysis process nowadays is becoming one of the major issues for any software development project. Namely, the analysis of software development process can interpret the processes that require the power and other resources the most and provide insights for their optimization. In order to analyze the process, its metrics should be captured throughout the software development life cycle by measuring and collecting them.
This paper is concerned with collecting and analyzing some energy consumption metrics, and making visible how the software development process include activities which are very expensive in terms of energy consumed by the hardware infrastructure. The rationale behind this project is to guide the software developers as well as management to get the general picture of the power consumption in their software development activities. We also try to suggest some ways to minimize the power consumption in some specific development activities.
The Outline of the Paper
The paper is organized into five sections and several subsections, where we address the general topic of defining and calculating the energy consumption during a software development process which happens using personal computers or laptops. In
Section 2, we describe some related works. In
Section 3, we give some information about the types of data to be collected from developers and present our approach for developing a framework and its detailed description of architecture. We discuss also the common energy consumption metrics that can be gathered in different types of operating systems (OS), the challenges in deriving these metrics, and the detailed information on how to measure the power consumption knowing some hardware and software properties.
Section 4 presents the methods and experiments conducted during the development of the framework; in addition to the use case diagrams of the main operations in the system, the structure of the back-end is introduced.
Section 5 includes the results derived while implementing the framework on our own project team, where we explain what insights we get for sufficient minimization of power consumption. Finally,
Section 6 concludes this paper and gives hints for future work following this project.
2. Related Work
According to the rising growth of smart computing technologies like Internet-of-Things, cloud computing, machine learning, etc., energy saving is one of the main issues. Pinto et al. [
4] argue that most of the research that connects computing and energy efficiency has concentrated on the lower levels of the hardware and software technological stacks. Nevertheless, these lower-level approaches do not capture the whole picture in terms of energy consumption. Apparently software systems do not consume energy themselves but affect hardware utilization, leading to indirect energy consumption. The authors of this paper also reviewed the existing tools and techniques with the help of which the energy-efficient software systems can be developed. They argue that the developers currently do not know the ways of developing energy-efficient software systems, and the reason is the lack of knowledge and the lack of tools. Another way for promoting and developing environmentally sustainable software is to build a two-level green software model that covers the sustainable life cycle of a software product.
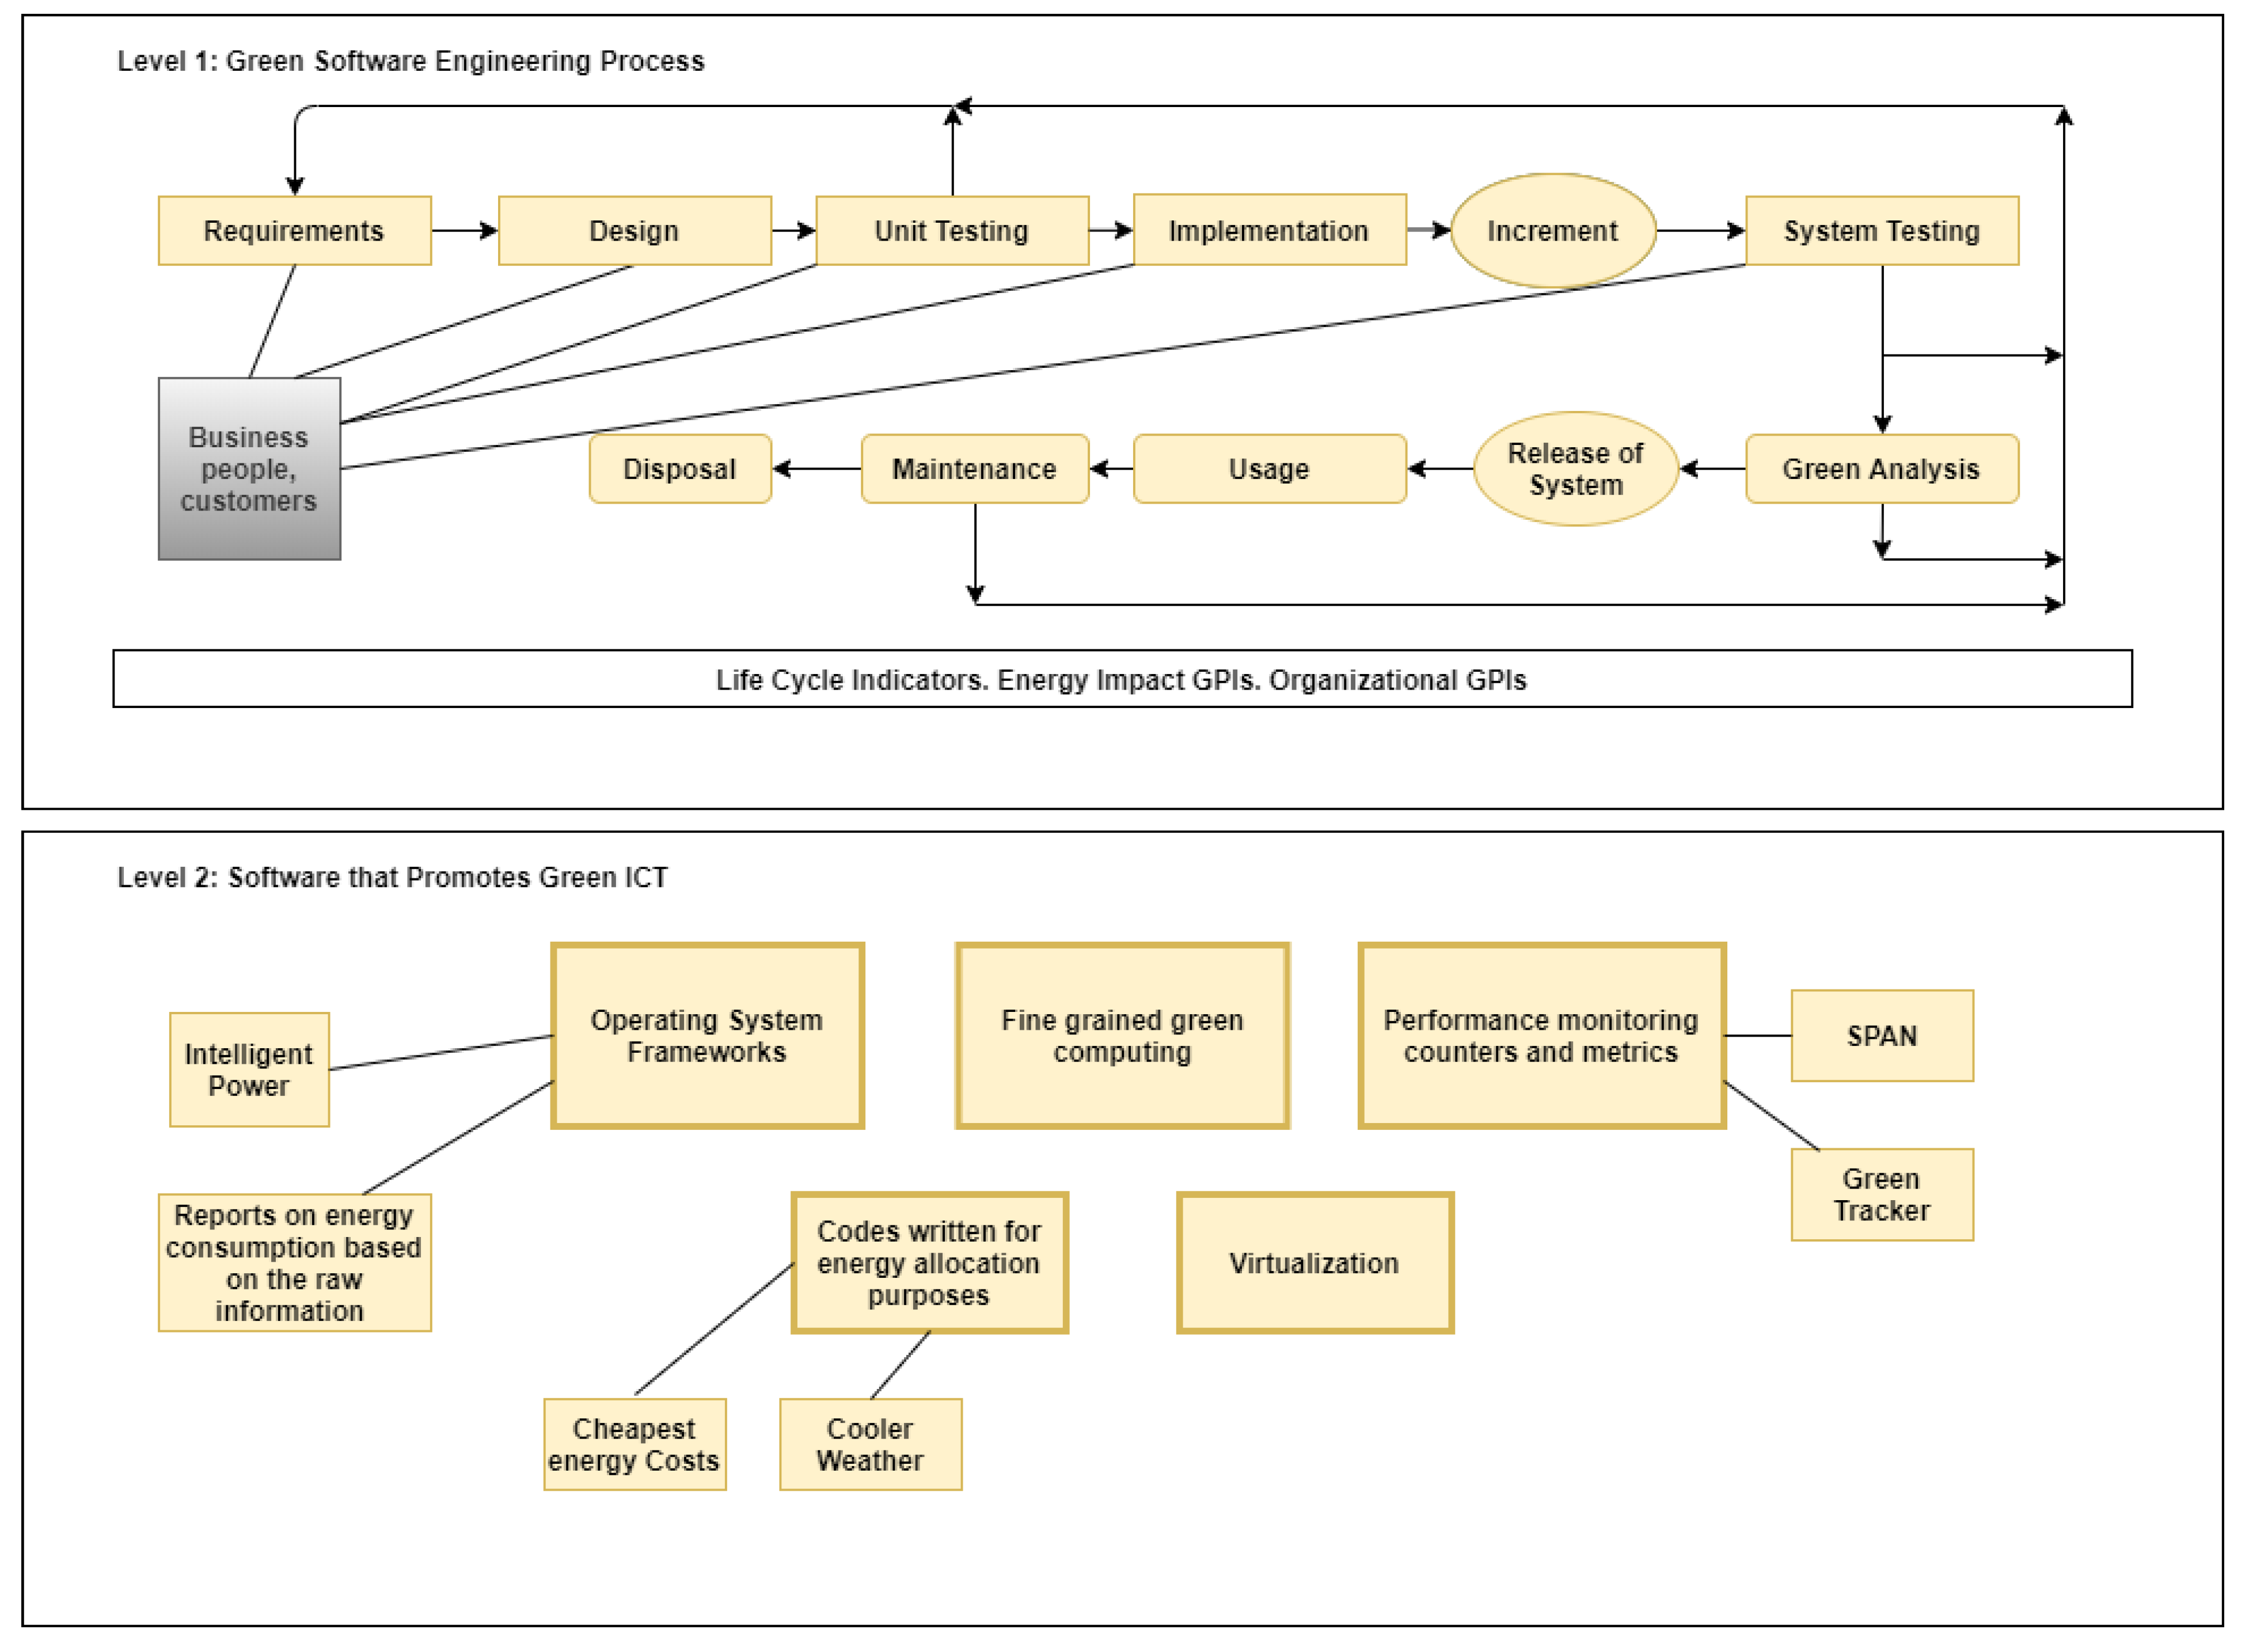
Mahmoud et al. [
5] stated the hybrid software engineering process as a first-level model among different types of software development processes (see
Figure 1). It was designed based upon the development processes of sequential, iterative, and agile methods. At the second level, the authors defined a set of existing software tools that provide runtime tracking of various metrics on energy efficiency. By relating both categories to each other, they concluded that the first level concepts like the possibility of changing requirements, early development tests before implementation, working of customers and developers in collaboration, and refusal of long requirements documents lead to the green and sustainable software engineering process. This work serves as a good example of the systematization of knowledge on the topic of energy efficiency, but it lacks the practical implementation of the proposed theoretical concepts.
Acar et al. [
6] introduced a tool model for energy consumption estimation using CPU, memory, and disk due to the execution of an application at run time. The tool that determines the parts of the source code that consumes the power more helps to obtain less energy-consuming software with the same functionalities. Our system operates with similar metrics to analyze energy efficiency, and the main difference is that we consider both product and process aspects for optimization, whilst in this research the focus is on product (code) optimization by introducing energy-efficient design patterns.
Jagroep et al. stated that the software is treated as a single entity which in terms fails in providing detailed insight about energy consumption behavior [
7]. In the paper, the researchers propose an energy consumption perspective on software architecture to enable the analysis of architectural elements as the main drivers behind energy consumption. As a result of applying commercial software and software quality attribute sustainability, the potential of the energy-saving approach attains 67%.
Eastep et al. have created an open source runtime framework for profiling and optimizing energy efficiency of high performance computing (HPC) systems [
8]. The authors focused on adjusting the hardware components’ performance according to the discovered design patterns in an application. A similar research on the runtime optimization of HPC applications was performed by Roberts et al. [
9]. They developed the POSE model that allows developers to compare the potential benefits of power and runtime optimization and determine which approach is most suitable for their code. While the importance of the fine-tuning of system components based on the thorough analysis of software structure and runtime behavior should not be underestimated in the context of energy efficiency, it is also important to optimize the software development process itself, by observing the behavioral patterns of developers. This is the primary focus of the given research.
Ivanov et al. [
10] considered more detailed issues, like defining which information the developers need to see in a dashboard and how developers want to use a dashboard with given information. In order to derive useful information from the survey they conducted, they used the framework Goal Question Metrics (GQM). The method of GQM applied to improving adaptive systems was also proposed by Ergasheva et al. [
11]. This approach was used because it allowed the authors to determine the strength and weaknesses of the dashboard system in terms of the products quality.
Meanwhile, Bykov et al. proposed a new architecture for non-invasive software measurement systems [
12]. By using a novel approach, they ensure the data privacy and gave full control over the developer’s own data.
3. Proposed Framework
If we look into the history of collecting data for actual software projects, it can be divided into two generations: invasive and non-invasive. The invasive method of data collection is performed with the close involvement of software developers. The main drawback of the invasive method is stated as the overwhelming of the participants during the data collection with the activities like a direct log of the effort, size, and defect data—which in turn burden the developers switching between tasks of development and data collection. Instead, the non-invasive data collection method we are proposing aims at supporting developers without requiring their direct involvement or any process optimization, and guaranteeing the maintenance of the data privacy and configuration.
The framework we describe here, named InnoMetrics, is mainly focused on energy consumption metric collection [
13] and analysis, and on software development process improvement based on the insights derived from the framework. InnoMetrics automatically collects some data throughout the development process and for further analysis sends the data to a server periodically using a time interval decided by the developer. It allows both the developers and the managers to be aware of the software development process’s strengths and weaknesses; in particular, the data report about the energy consumption of both the development process and the resulting software product. By virtue of the data, its visualized representation concerning metric and analysis gives a clear vision of the overall process in real time. The framework is flexible and can be configured depending on the size and collocation of the company and the development team. For instance, it has been used for supporting Scrum-like agile developments [
14].
The main prerequisite for our non-invasive measurement system is to define the main power consuming processes of the developers without distracting them from the main job. Nonetheless, the last word is on the developers’ side since the control over the time of sending the data to the server is given to the developer. Besides that, our software measurement system considers various third-party systems (like SonarQube, Jira, Trello, and GitHub) to collect metrics.
3.1. High-Level Architecture of the System
The framework that we propose in this paper is a software development process tracking system that measures and analyzes the active and passive processes within a software development project using the employees’ computer systems where we install the executable code of client-side data collectors for any chosen OS (Mac, Windows, or Linux).
With the help of these data collectors, both software and hardware energy consumption measurements are collected client-side. Then, the collected data are transferred to the server where further analysis of the collected data are proceeded by different algorithms.
Considering the non-functional requirements and quality attributes like modifiability, maintainability, adaptability, and security, the framework architecture decisions [
15] were taken to use micro-services. The advantages of micro-services can be characterized as the ease of maintainability, scalability, and cross-functional team maintenance. In order to provide a prototype that will help us to start the data collection process and validate our data model, a system with a monolithic API has been developed that contains all the required functionalities such as handling the requests of the data collection components and providing the information needed in the dashboard [
16] to be used for data analysis.
The framework consists mainly of the components described below (see
Figure 2):
User devices-data collecting frameworks (Windows, macOS [
17], Linux) that represent the user devices which are tracked and focus on the data collection, storage, and transmission;
Managers—represents the user with a manager role of each of the projects, they will have access to a dashboard that will make available to them information of the data collected from their work team;
InnoMetrics Server—includes an analytic module of obtained data referring to quantitative and qualitative analysis. For an initial deployment of the solution, there is a server that hosts all the services that compose it. With the purpose to provide an agile way to deploy and scale the system, Docker container is used as a virtualization engine, having OpenJDK as the main JVM of the services and PostgreSQL as RDBMS;
Dashboard—the component of the control module, in which the users responsible for a specific project have the ability to visualize graphs and information about the measurements collected towards their work team [
18];
InnoMetrics API—is an API developed in Java under the Spring Boot framework [
19], which provides the interfaces used by both the data collection components to store it within the central repository, and the Dashboard as a data source, which contains the resources needed for the data analysis;
InnoMetrics DB—is a PostgreSQL instance on which the data collected by the different monitoring components are stored. In this initial stage, it is being used as a source of information for the generation of graphics and reports in the Dashboard, but as it going to be explained later, this responsibility will be delegated to a second repository.
3.2. Data Collection
The data collection is separated into two different processes: one for tracking activities that the user is performing in the system (applications in focus); another instance performs a sampling of the processes (both system and user ones) that are being executed on the device. Thus, we are able to analyze the resources utilization based on these perspectives.
Given that one of our objectives is to collect the data measurement without generating a significant impact on the performance of the device, we have decided not to perform the measurements process in real time; this would not just impact the performance of the device, but also generate an overload in our database due to the high amount of data generated.
Then, the data consolidation process and the data processing start when the collector components are synchronized in a timely manner with one of the InnoMetrics Server instances. Once this step was done, an inner process starts to run, in which we transform and analyze the data collected to make it ready to be presented either in a dashboard or even in raw format.
Technical Architecture of Data Collector
The high-level perspective on the implementation of the API used by the data collector components is given in
Figure 3. The API is developed under the Spring Boot framework, using Spring Boot Security for user validation processes and authorization, and Spring Boot Data as a persistence engine. Additionally, there is the support of third-party libraries that will be described later.
If we look to the architecture [
12] of the data collector, in the controller package, there are REST services divided into three classes:
AdminAPI exposes those methods that are related to the administration of users, roles, and system configurations;
AuthAPI provides the mechanisms for user authentication and token generation;
Data Collector API, the controller in charge of exposing the methods that are used by the different collection modules for the transmission of data to the central repository.
The Service Layer contains the business logic needed in each of the processes exposed by the controllers and also provides an abstraction layer between the controllers that make use of data transfer objects (DTO) and the persistence layer that naturally maps the entities contained in the database.
The Repository Layer contains the persistence interfaces of the entities modeled within the entity package, using the functionalities provided by the implementation of JPA in the Spring Boot framework through the JPA Repository interface.
In the Entity package, we have the models of the entities that are involved in the data collection process, which are an abstraction of the database entities.
The DTO Layer models the objects used in the request and response processes of each method exposed in the controller layer, this layer allows us to decouple the data collection components and the model that is being persisted in the database.
Within the Config Layer are those classes that provide the configuration mechanisms for the libraries used, such as, Spring Boot security configuration to integrate it with the JsonWebToken (JWT) library, which is in charge of the generation of authentication tokens. In addition, the configuration spring fox-swagger libraries was used for the generation of the API documentation.
Finally, the Exception Layer allows us to make an extension of the RuntimeException class to provide a unified exceptions handling mechanism.
3.3. Main Operations
Going deeper into the implementation of the system, we can highlight the data collection operations, sending activity reports, reporting processes, and user authentication as the basis for the operation of the set of tools that make up the InnoMetrics framework. These operations will be described in more detail below.
3.3.1. Collecting User Activity Data
Figure 4 shows the steps followed by the data collection components to obtain the information of the activities executed by the user. Initially, the component is triggered from a hook to track the system events, specifically when the user switches from one window to any other, based on this fact, we can easily determine how long the previous application has been used, and additionally the data necessary to identify the specific action performed. In addition, there is a second process in charge of tracking the interactions between the user and the input devices such as the keyboard and mouse, which help us to determine the real presence of the user; therefore, if, over time, we did not detect any type of interaction between the user and the device, the activity that has the main focus of execution will become an activity in an idle state.
3.3.2. Collecting Device Processes Data
The data we are collecting can be divided into a two metrics cluster: Process metrics and energy metrics (
Figure 5). When the data collected through the user devices are sent to the server, the data in the central repository would have the following process metrics:
Activity name (application name/Process name);
Activity status (on focus/idle);
Process description;
User information (username, email, IP address);
Timestamp of the opening of the app/process;
Timestamp of the quitting the app/process;
Duration of the process open;
Tab name (browser);
Tab URL (browser);
Category of the process.
Using the findings from the research, we conducted [
20], it was clear that energy consumption of the applications depend on variety system resources like processor, device uses, memory architecture, display settings, and active sensors. In addition, it also depends on conditions like the signal strength used for data transfer, user settings like screen brightness levels, and many more user and system settings. In the end, we decided to use some of the most impacting and meaningful metrics for calculating process energy consumption with following energy metrics:
Battery percentage;
Battery status;
RAM;
VRAM;
CPU utilization.
The data collection includes the information about the processes executed on the user’s device and the resources they use. The collection process follows the sequence presented in
Figure 5, where the information is gathered periodically. The measurements cannot be taken in real time because it is not a viable strategy, due to the fact that the consumption of resources can affect the measurements quality continuously. After getting the list of processes that are being executed in the device, the process obtains the information about the resources used and estimate its energy consumption.
4. Methods and Experiments
After developing a functional prototype with the most relevant features, we have managed to perform an early testing phase with the help of the project team. This phase has involved around 18 members, who, after being authenticated in the system, automatically and continuously ran the data collector components. We have tracked every N minute the processes that have been executed in each device. During this phase, we have focused on obtaining metrics.
As a result of this experimentation phase, we would like to state the appropriate time interval to perform the measurements process, which must give us the certainty that we have a good degree of reliability and, at the same time, we are not overcharging the device and in turn adding noise to the measurement process.
Based on the testing phase implemented into our project team members, we consider that we have an initial consistent data set, in which we can conduct an early phase of analysis, with which we can construct an initial data model to estimate the energy used, evaluate possible areas of improvement, and implement the necessary changes.
As a sample of the data obtained, in
Table 1, we provide a snapshot of which the format of the collected data are seen; in the next stage, the data will be sorted according to the category to a given process belongs. The details of the application categorization process are being described in the next section.
4.1. Data Categorization
After the data collection process, we classify the processes into various categories as follows. The categories are derived from the research from the related fields and systems. Starting from about 20 categories, we selected the most meaningful categories for our framework. The selected categories consist of the following types:
Communication—chats, messengers, social networks, communication systems like Skype, IMO, etc.;
Productivity—Microsoft Office applications, Google docs, Google slides, OS utilities;
Education—all types of knowledge gaining applications like Readers, educational websites;
Development—IDE’s and Development tools, Text editors (Notepad++, Sublime, etc.);
Entertainment—games, music players, video players, and entertaining websites;
Design and Creativity—Photo editors, constructional and design applications (CAD applications, 3DsMAX, Corel applications, etc.);
Management—Project Management Instruments, calendars, Tracking tools, etc.
The applications and the processes that are not included in the above-mentioned categories are sorted as uncategorized. Such Uncategorized category is used as a storage for the applications that have not yet been sorted automatically by our system. Nonetheless, it is supposed to have few applications and processes in this category day by day unless the automatic categorization feature is in a working condition. We evaluate our approach with machine learning algorithms for categorization from the open-source repository SourceForge [
21] containing currently 685,792 open source projects. Previously, McMillan et al. [
22] used the SourceForge repository to test on 3286 projects for automatic categorization with three different machine learning algorithms.
As a result of the data, we collected from SourceForge, we got more than 350,000 names of applications that are widely used by open source developers. For our framework, the easiest way to find a process name that corresponds to the process name was to use regular expressions. As far as creating regular expressions for a lot of types of application names, finding the best candidate application name for a given process will take a lot of time.
We decided to use the query likelihood language model [
23]. This approach suggests to construct from every document
d in the collection of documents a language model
. The goal of this method is to rank documents by
—the likelihood that the document
d is relevant to the query
q. We will have the following result, according to Bayes rule:
can be treated as uniform across all d, and is the same for all documents. Thus, these terms can be ignored, and we simply need to rank the documents by .
In our case, we consider the application names as documents
d and windows titles of processes as queries
q. All window titles were prepossessed before using this method: we removed stop words (“the”, “not”, etc.) and all non-alphabet symbols from them. In addition, we made both application names and window titles lowercase. To rank all documents, we used the following estimation of conditional probability:
where
is the language model of an application name
dd,
is a term frequency of term
t in an application name
d, and
is the number of words in an application name
d.
The problem of this approach is that, if a term t misses in an application name d, then . It means that the application name will give us a non-zero probability only if all terms of a window title appear in this document. To overcome this problem, we used additive smoothing: we add a very small number to the observed values. The term can not appear in an application name and its probability will be close to zero, but not exactly zero.
In addition, we considered the situation where all application names do not contain a term from a window title. In this case, we try to find the closest one by Levenshtein distance [
24] (the minimum number of one character edits—insertions, deletions, or substitutions, required to change one word into another) application name to our process name.
4.2. Energy Consumption Calculation Theory
To get significant numbers from this collected data, we decided to use data-driven development [
25] techniques to calculate CPU usage, RAM usage, time spent for all categories, and energy consumption metrics manually with data management algorithms. Under the assumption that all team members’ workstations (personal computers, PC in short) have the same specifications, on the basis of the fact that the involved PCs are of the same generation and model, further data details derived for our project team are explained in this section. First, let us see the tight relation of metrics we collected and energy consumption data of PCs.
In general, there are several solutions for measuring the resulting power consumption. For the last few years, many kinds of methods were proposed for measurement, such as hardware based methods, software based methods, CPU usage minimization methods and so on.
The framework we are proposing exploits software based methods for power consumption measurement in PCs. For now, we are referring to the resource consumption and time frequency of the processes the user is working on. We use the Time-out approach, which is supported by some popular operating systems like Windows, Linux, and Mac OS. We track the processes on a timely manner according to the early stages of this approach. According to the approach, we set the time-out value for the idle state transition and, when the process reaches the time we set, the system switches automatically to a low power mode.
Hirao et al. proved that one of the most energy-consuming devices is the CPU [
26]. Nowadays, many algorithms are designed around the CPU utilization. Lien et al. defined the correlation between CPU utilization
U and power consumption
P[
27]. In addition,
P shows only a little variation in idle state, and on average its value maintains constant. Further details of our energy consumption calculations are given in the next section. We track both idle and focus time on the process, so that we excluded idle time on the process to get pure CPU working time period. Once we get the idle time on the process during sampling time, based on the results of idle time, we get CPU utilization (
U = %) of the process.
Processor Power (Watts) during the sampling time similarly remain almost constant. We took base power as
D for idle time average power consumption. In addition,
M is full load power to represent the power consumption. It was found that
P relates to
U nonlinearly and, as it was suggested in the paper, we used exponential power model to estimate the power consumption
P
where
and
of the power model were determined by applying corresponding P’s and U’s to regression analysis.
Figure 6 represents the relationship between CPU Utilization (%) and Processor Power (Wt) for the PCs (or laptops) used by our developers.
We interpolate these data as function
where
x is the CPU usage in percentage, and
y is the EC (energy consumption) measurement in Wt.
5. Results and Discussion
Overall data collection details for the testing period can be summarized as 18 users with different types of OS devices, more than 125K activities (applications used by the users) were collected, where the data consist of more than 165K processes (resource usage of activities).
Results of Power Calculation
We used this function in order to obtain the estimated values for EC for all values of the CPU that we had from our data collector. In addition, we got the following results for the CPU usage (see
Figure 7a,b ).
From the two pie charts shown in
Figure 7, one may see that the most time is spent in this particular category and, consequently, the category which takes the most CPU usage is communication processes. One of the reasons that explains this result is that, when team members are geographically distributed, the consequent necessity of online communication is inescapable. In addition, we need to take into account that the development process itself cannot be measured just by usage of the development environments and text editors because the development process includes the preparation and learning processes. Subsequently, the education and utilities take moderate amount of resources and power. Memory impact on EC measurement and time spent for each category in the framework in particular are seen from
Figure 8 below.
For now, we have results derived with the help of CPU utilization and time spent on the particular processes. In further development, the implementation of CPU, GPU, and RAM metrics calculation at a hardware level will be considered as well-in particular, by implementing Intel RAPL, NVAPI, and AMD CodeXL.
Basically, for minimizing the Energy Consumption parameters, one can proceed in different ways:
Minimizing CPU usage. Some researchers propose systematic approaches to keep track of resource consumption, including CPU time. The CPU time utilization is updated at a given time interval. In addition, there are machine learning algorithms to predict CPU idle states and activity patterns. They concentrate on CPU power management and on CPU sharing for power consumption minimization [
28,
29,
30].
Power management of the PC. Keeping in mind the issue with running idle PCs, there are several options of human inactivity for addressing power management. If we consider in particular the Microsoft Windows OS, there are some options of entering automatically the sleep mode, standby mode, monitor turn off, and hibernate switching modes. All of these settings depend on the system default or the user preferences. In addition, there is a power plan of hardware and system settings (like display brightness, sleep, etc.) that manage how the computer uses power. The fact that the systems suggests choosing shorter times for screen and sleep settings shows effective minimization of power consumption.
However, these power management schemes are PCs’ and peripheral oriented and they are unable to predict the users inactivity. According to Gupta [
31], we are not able to minimize power consumption of PCs without predicting the inactivity period of the user.
Usage of algorithmic approaches. Many researchers are working with different algorithms to minimize the power consumption with the help of computer systems (CPU, HDD). There are algorithms like the Back-off algorithm [
32] to switch on/off the device to save the power, the PowerNap algorithm [
33] to enable the entire system to transition rapidly low power state, and the Power-scheduling algorithm [
34,
35,
36] that can reduce the power consumption of portable embedded devices, schedules, and set the deadline of the tasks to indicated by user value.
6. Conclusions
In this paper, we have described a new framework for analyzing energy consumption in the software development processes. We set out how energy consumption can be determined in the scope of software engineering activities. We started by stating the importance of energy efficiency in the IT-sphere, following the related works done in the field of information and communications technologies. We positioned our framework and its detailed architecture components. In order to test the implemented framework, we adopted it within our agile team while it was engaged in some research projects including software development.
Considering the deployed features and functions, we described sequence diagrams and entity relations that the user and the system can proceed. As an initial validation of the framework, we derive energy-related attributes of different applications that are used during the development process. Using the open-source databases, we collected more than 3500 application lists, distributing them into eight meaningful categories relevant for our system. Based on the results derived from the categorization, we implemented an automatic categorization of the applications using Machine Learning algorithms.
We intend to study the problem of energy consumption in different software process models, like, for instance, in waterfall and in iterative models.
Author Contributions
Conceptualization, G.S. and P.C.; methodology, G.S. and A.K.; software, X.V.; validation, P.C. and E.Z.; formal analysis, Z.K.; investigation, S.E., X.V. and Z.K.; resources, S.E. and A.K.; data curation, Z.K.; writing—original draft preparation, S.E.; writing—review and editing, P.C. and A.K.; visualization, X.V.; supervision, G.S.; project administration, A.K.; funding acquisition, G.S. All authors have read and agreed to the published version of the manuscript.
Funding
This research project is carried out under the support of the Russian Science Foundation Grant No. 19-19-00623.
Conflicts of Interest
The authors declare no conflict of interest.
References
- Aebischer, B.; Hilty, L.M. The Energy Demand of ICT: A Historical Perspective and Current Methodological Challenges. In Advances in Intelligent Systems and Computing; Springer International Publishing: New York City, NY, USA, 2014; pp. 71–103. [Google Scholar] [CrossRef] [Green Version]
- Energy Information Administration. Available online: https://www.eia.gov/international/overview/world (accessed on 12 June 2020).
- Green Facts. Available online: https://www.greenlivingpedia.org/Green_facts (accessed on 12 June 2020).
- Pinto, G.; Castor, F. Energy efficiency. Commun. ACM 2017, 60, 68–75. [Google Scholar] [CrossRef]
- Mahmoud, S.S.; Ahmad, I. A Green Model for Sustainable Software Engineering. Int. J. Software Eng. Appl. 2013, 7, 55–74. [Google Scholar]
- Acar, H.; Alptekin, G.I.; Gelas, J.P.; Ghodous, P. The Impact of Source Code in Software on Power Consumption. Int. J. Electron. Bus. Manag. 2016, 14, 42–52. [Google Scholar]
- Jagroep, E.; van der Werf, J.M.; Brinkkemper, S.; Blom, L.; van Vliet, R. Extending software architecture views with an energy consumption perspective. Computing 2016, 99, 553–573. [Google Scholar] [CrossRef] [Green Version]
- Eastep, J.; Sylvester, S.; Cantalupo, C.; Geltz, B.; Ardanaz, F.; Al-Rawi, A.; Livingston, K.; Keceli, F.; Maiterth, M.; Jana, S. Global Extensible Open Power Manager: A Vehicle for HPC Community Collaboration on Co-Designed Energy Management Solutions. In Lecture Notes in Computer Science; Springer International Publishing: New York City, NY, USA, 2017; pp. 394–412. [Google Scholar] [CrossRef]
- Roberts, S.I.; Wright, S.A.; Fahmy, S.A.; Jarvis, S.A. The Power-optimised Software Envelope. ACM Trans. Archit. Code Optim. 2019, 16, 1–27. [Google Scholar] [CrossRef] [Green Version]
- Ivanov, V.; Pischulin, V.; Rogers, A.; Succi, G.; Yi, J.; Zorin, V. Design and validation of precooked developer dashboards. In Proceedings of the 2018 26th ACM Joint Meeting on European Software Engineering Conference and Symposium on the Foundations of Software Engineering-ESEC/FSE 2018, Lake Buena Vista, FL, USA, 4–9 November 2018. [Google Scholar] [CrossRef]
- Ergasheva, S.; Kruglov, A.; Shulhan, I. Development and evaluation of GQM method to improve adaptive systems. In Proceedings of the 6th International Young Scientists Conference on Information Technologies, Telecommunications and Control Systems (ITTCS 2019), Innopolis/Yekaterinburg, Russia, 6 December 2019. [Google Scholar]
- Bykov, A.; Zaplatnikov, D.; Ivanov, V.; Rogers, A.; Shunevich, A.; Sillitti, A.; Succi, G.; Tormasov, A.; Yi, J.; Zabirov, A. A new architecture and implementation strategy for non-invasive software measurement systems. In Proceedings of the 33rd Annual ACM Symposium on Applied Computing—SAC18, Pau, France, 9–13 April 2018. [Google Scholar] [CrossRef]
- Ergasheva, S.; Khomyakov, I.; Kruglov, A.; Succil, G. Metrics of energy consumption in software systems: A systematic literature review. In IOP Conference Series: Earth and Environmental Science; IOP: London, UK, 2020. [Google Scholar] [CrossRef]
- Ciancarini, P.; Missiroli, M.; Poggi, F.; Russo, D. An Open Source Environment for an Agile Development Model. In Open Source Systems; Springer: Berlin/Heidelberg, Germany, 2020; pp. 148–162. [Google Scholar]
- Kassab, M.; Mazzara, M.; Lee, J.; Succi, G. Software architectural patterns in practice: an empirical study. Innov. Syst. Software Eng. 2018, 14, 263–271. [Google Scholar] [CrossRef]
- Ergasheva, S.; Ivanov, V.; Khomyakov, I.; Kruglov, A.; Strugar, D.; Succi, G. InnoMetrics Dashboard: The Design, and Implementation of the Adaptable Dashboard for Energy-Efficient Applications Using Open Source Tools. In Open Source Systems; Springer: Berlin/Heidelberg, Germany, 2020; pp. 163–176. [Google Scholar]
- Ergasheva, S.; Strugar, D.; Kruglov, A.; Succi, G. Energy Efficient Software Development Process Evaluation for MacOS Devices. In Open Source Systems; Springer: Berlin/Heidelberg, Germany, 2020; pp. 196–206. [Google Scholar]
- Ivanov, V.; Larionova, D.; Strugar, D.; Succi, G. Design of a Dashboard of Software Metrics for Adaptable, Energy Efficient Applications. In Proceedings of the 25th International Conference on Distributed Multimedia Systems, Lisbon, Portugal, 8–9 July 2019; pp. 75–91. [Google Scholar]
- Spring Boot. Available online: https://spring.io/projects/spring-boot (accessed on 28 August 2020).
- Atonge, D.; Ivanov, V.; Kruglov, A.; Khomyakov, I.; Sadovykh, A.; Strugar, D.; Succi, G.; Vasquez, X.Z.; Zouev, E. The Development of Data Collectors in Open-Source System for Energy Efficiency Assessment. In IFIP Advances in Information and Communication Technology; Springer International Publishing: New York City, NY, USA, 2020; pp. 14–24. [Google Scholar] [CrossRef]
- SourceForge. Available online: https://sourceforge.net/ (accessed on 25 May 2020).
- McMillan, C.; Linares-Vasquez, M.; Poshyvanyk, D.; Grechanik, M. Categorizing software applications for maintenance. In Proceedings of the 27th IEEE International Conference on Software Maintenance (ICSM), Williamsburg, VA, USA, 25–30 September 2011. [Google Scholar] [CrossRef] [Green Version]
- Manning, C.; Raghavan, P.; Schütze, H. Introduction to Information Retrieval; Cambridge University Press: Cambridge, UK, 2008. [Google Scholar]
- Rani, S.; Singh, J. Enhancing Levenshtein’s Edit Distance Algorithm for Evaluating Document Similarity. In Communications in Computer and Information Science; Springer: Singapore, 2018; pp. 72–80. [Google Scholar] [CrossRef] [Green Version]
- Dogdu, E.; Hakimov, S.; Yumusak, S. A Data-Model Driven Web Application Development Framework. In Proceedings of the ACM Southeast Regional Conference, Kennesaw, GA, USA, 28–29 March 2014; pp. 1–4. [Google Scholar] [CrossRef] [Green Version]
- Hirao, E.; Miyamoto, S.; Hasegawa, M.; Harada, H. Power Consumption Monitoring System for Personal Computers by Analyzing Their Operating States. In Proceedings of the 4th International Symposium on Environmentally Conscious Design and Inverse Manufacturing, Tokyo, Japan, 12–14 December 2005. [Google Scholar] [CrossRef]
- Lien, C.H.; Bai, Y.W.; Lin, M.B. Estimation by Software for the Power Consumption of Streaming-Media Servers. IEEE Trans. Instrum. Meas. 2007, 56, 1859–1870. [Google Scholar] [CrossRef]
- Oh, S.; Kim, S. Reducing CPU Power Cost of Cluster System. In Proceedings of the 2008 10th International Conference on Advanced Communication Technology, Gangwon-Do, South Korea, 17–20 February 2008, 17–20 February 2008; Volume 3, pp. 2076–2079. [Google Scholar]
- Moses, J.; Illikkal, R.; Iyer, R.; Huggahalli, R.; Newell, D. ASPEN: towards effective simulation of threads & engines in evolving platforms. In Proceedings of the 12th Annual International Symposium on Modeling, Analysis, and Simulation of Computer and Telecommunication Systems (MASCOTS 2004), Volendam, The Netherlands, 8 October 2004. [Google Scholar] [CrossRef]
- Dumitrescu, C.; Foster, I. Usage policy-based CPU sharing in virtual organizations. In Proceedings of the 5th IEEE/ACM International Workshop on Grid Computing; IEEE Computer Society: Washington, DC, USA, 2004; pp. 53–60. [Google Scholar]
- Gupta, P.K.; Singh, G. Minimizing Power Consumption by Personal Computers: A Technical Survey. Int. J. Inf. Technol. Comput. Sci. 2012, 4, 57–66. [Google Scholar] [CrossRef] [Green Version]
- Das, D.; Das, D. Back-off algorithm based power saving mechanism in a multi-RAT UE. In Proceedings of the 2011 IEEE 5th International Conference on Internet Multimedia Systems Architecture and Application, Bangalore, India, 12–14 December 2011; pp. 1–6. [Google Scholar]
- Meisner, D.; Gold, B.T.; Wenisch, T.F. PowerNap: Eliminating Server Idle Power. In Proceedings of the 14th International Conference on Architectural Support for Programming Languages and Operating Systems, Washington, DC, USA, 7–11 March 2009; pp. 205–216. [Google Scholar] [CrossRef]
- Cho, K.; Liang, C.; Huang, J.; Yang, C. Design and implementation of a general purpose power-saving scheduling algorithm for embedded systems. In Proceedings of the 2011 IEEE International Conference on Signal Processing, Communications and Computing (ICSPCC), Xi’an, China, 14–16 September 2011; pp. 1–5. [Google Scholar]
- Kim, J.; Kim, D.; Hong, J. Estimating power consumption of mobile embedded software based on behavioral model. In Proceedings of the 2010 Digest of Technical Papers International Conference on Consumer Electronics (ICCE), Las Vegas, NV, USA, 11–13 January 2010; pp. 105–106. [Google Scholar]
- Shan, L.; Lai, E.M.K.; Absar, M.J. Minimizing embedded software power consumption through reduction of data memory access. In Proceedings of the Fourth International Conference on Information, Communications and Signal Processing, 2003 and the Fourth Pacific Rim Conference on Multimedia. Proceedings of the 2003 Joint, Singapore, 15–18 December 2003; Volume 1, pp. 309–313.
| Publisher’s Note: MDPI stays neutral with regard to jurisdictional claims in published maps and institutional affiliations. |
© 2020 by the authors. Licensee MDPI, Basel, Switzerland. This article is an open access article distributed under the terms and conditions of the Creative Commons Attribution (CC BY) license (http://creativecommons.org/licenses/by/4.0/).

 ,
, 


