Article

Real-Time Remote Health Monitoring System Driven by 5G MEC-IoT

1
State Key Laboratory of Information Photonics and Optical Communications, Beijing University of Posts and Telecommunications, Beijing 100876, China
2
École de Technologie Supérieure, Université du Québec, Montreal, QC H3C 3J7, Canada
*
Author to whom correspondence should be addressed.
Electronics 2020, 9(11), 1753; https://doi.org/10.3390/electronics9111753
Submission received: 27 August 2020 / Revised: 12 October 2020 / Accepted: 16 October 2020 / Published: 22 October 2020
(This article belongs to the Section Networks)

Abstract

:
Telemedicine over Internet of Things (IoT) generates an unprecedented amount of data, which further requires transmission, analysis, and storage. Deploying cloud computing to handle data of this magnitude will introduce unacceptable data analysis latency and high storage costs. Thus, mobile edge computing (MEC) deployed between the cloud and users, which is close to the nodes of data generation, can tackle these problems in 5G scenarios with the help of artificial intelligence. This paper proposes a telemedicine system based on MEC and artificial intelligence for remote health monitoring and automatic disease diagnosis. The integration of different technologies such as computers, medicine, and telecommunications will significantly improve the efficiency of patient treatment and reduce the cost of health care.

1. Introduction

Telemedicine is an emerging mode of modern medical services, which can not only meet the real-time monitoring and health management of people’s daily health at home, but also greatly relieve the pressure of outpatient visits in hospitals. Considering the two major current conditions of the global population, the health problems of people have risen to become concerns of the whole society. The first is that the aging population is becoming increasingly serious. In the future, many elderly people will have to face the problem of the difficulty in receiving medical treatment in hospitals. The second is that the sub-health phenomenon of young people is becoming more common with the increasing pace and pressure of the current society. The in-depth integration of the healthcare industry with the Internet of Things (IoT), 5G, Artificial Intelligence (AI), big data, cloud computing, and other advanced technologies will hopefully solve the abovementioned health problems. In particular, the 5G-enabled IoT and AI are continuously driving innovative applications in the telemedicine industry.
In the fields of medical health and medical sciences, the application scenarios of telemedicine mainly include remote monitoring, remote ultrasound, remote consultation, remote surgery, mobile medicine, as well as intelligent control of medical drugs and equipment to achieve personal medical management and health data management.
At present, wearable biomedical devices for vital signs monitoring are developing rapidly. Low cost, low power consumption, small size, and intelligence are the keys to developing wearable biomedical devices. Wearable health devices have many advantages such as the continuity of medical services and real-time perception of health data. They can realize real-time monitoring of human life characteristics and health conditions, helping people understand their physical conditions and detect symptoms early. Advanced semiconductor technology has greatly reduced the cost and power consumption of wearable devices, where the performance has been greatly improved. The combination of AI and the IoT has enhanced the degree of intelligence of wearable devices. The research and development of wearable biomedical devices have become an important direction in the field of telemedicine. In addition, it is important to guarantee the rapid development of telemedicine. It is expected that wearable devices related to medicine and health will occupy the majority of the entire wearable device market.
In recent years, the 5G network has attracted great interest in various vertical industries due to its high speed, large connections, and low latency, among others. The high-speed characteristic of 5G enables it to support the 4K/8K remote high-definition consultation and high-speed transmission and sharing of medical image data; furthermore, it allows experts to conduct consultations anytime and anywhere, improves diagnosis accuracy and guidance efficiency, and extends high-quality medical resources to the patients’ homes. The large-connection characteristic of 5G makes it possible to connect a large number of medical sensor terminals, related video devices, and wearable biomedical devices to achieve real-time perception and measurements, capture and transfer patient health information, and to realize the continuous and accurate monitoring of health information without time and space restrictions. In addition, in special wards such as radiology wards and infectious wards, medical staff can also control the medical assistant robot to move to the designated bed and complete the remote nursing service under the premise of protecting medical staff.
Various medical sensors and wearable biomedical devices can collect real-time patient health indicators, including body temperature, heart rate, blood pressure, blood glucose, and electrocardiogram, among others. These devices can be connected to the cloud; the latter performs AI analysis of patient health-related data, records the patient’s health status, provides disease analysis for doctors and patients, and provides auxiliary decision-making for patient treatment. The doctor remotely evaluates the patient’s condition and provides immediate feedback on the patient’s health. Some wearable health monitors can perform local data analysis without connecting to the cloud. For example, a heart rate monitor that can independently analyze health data can provide the necessary response immediately to alert caregivers when patients need help.
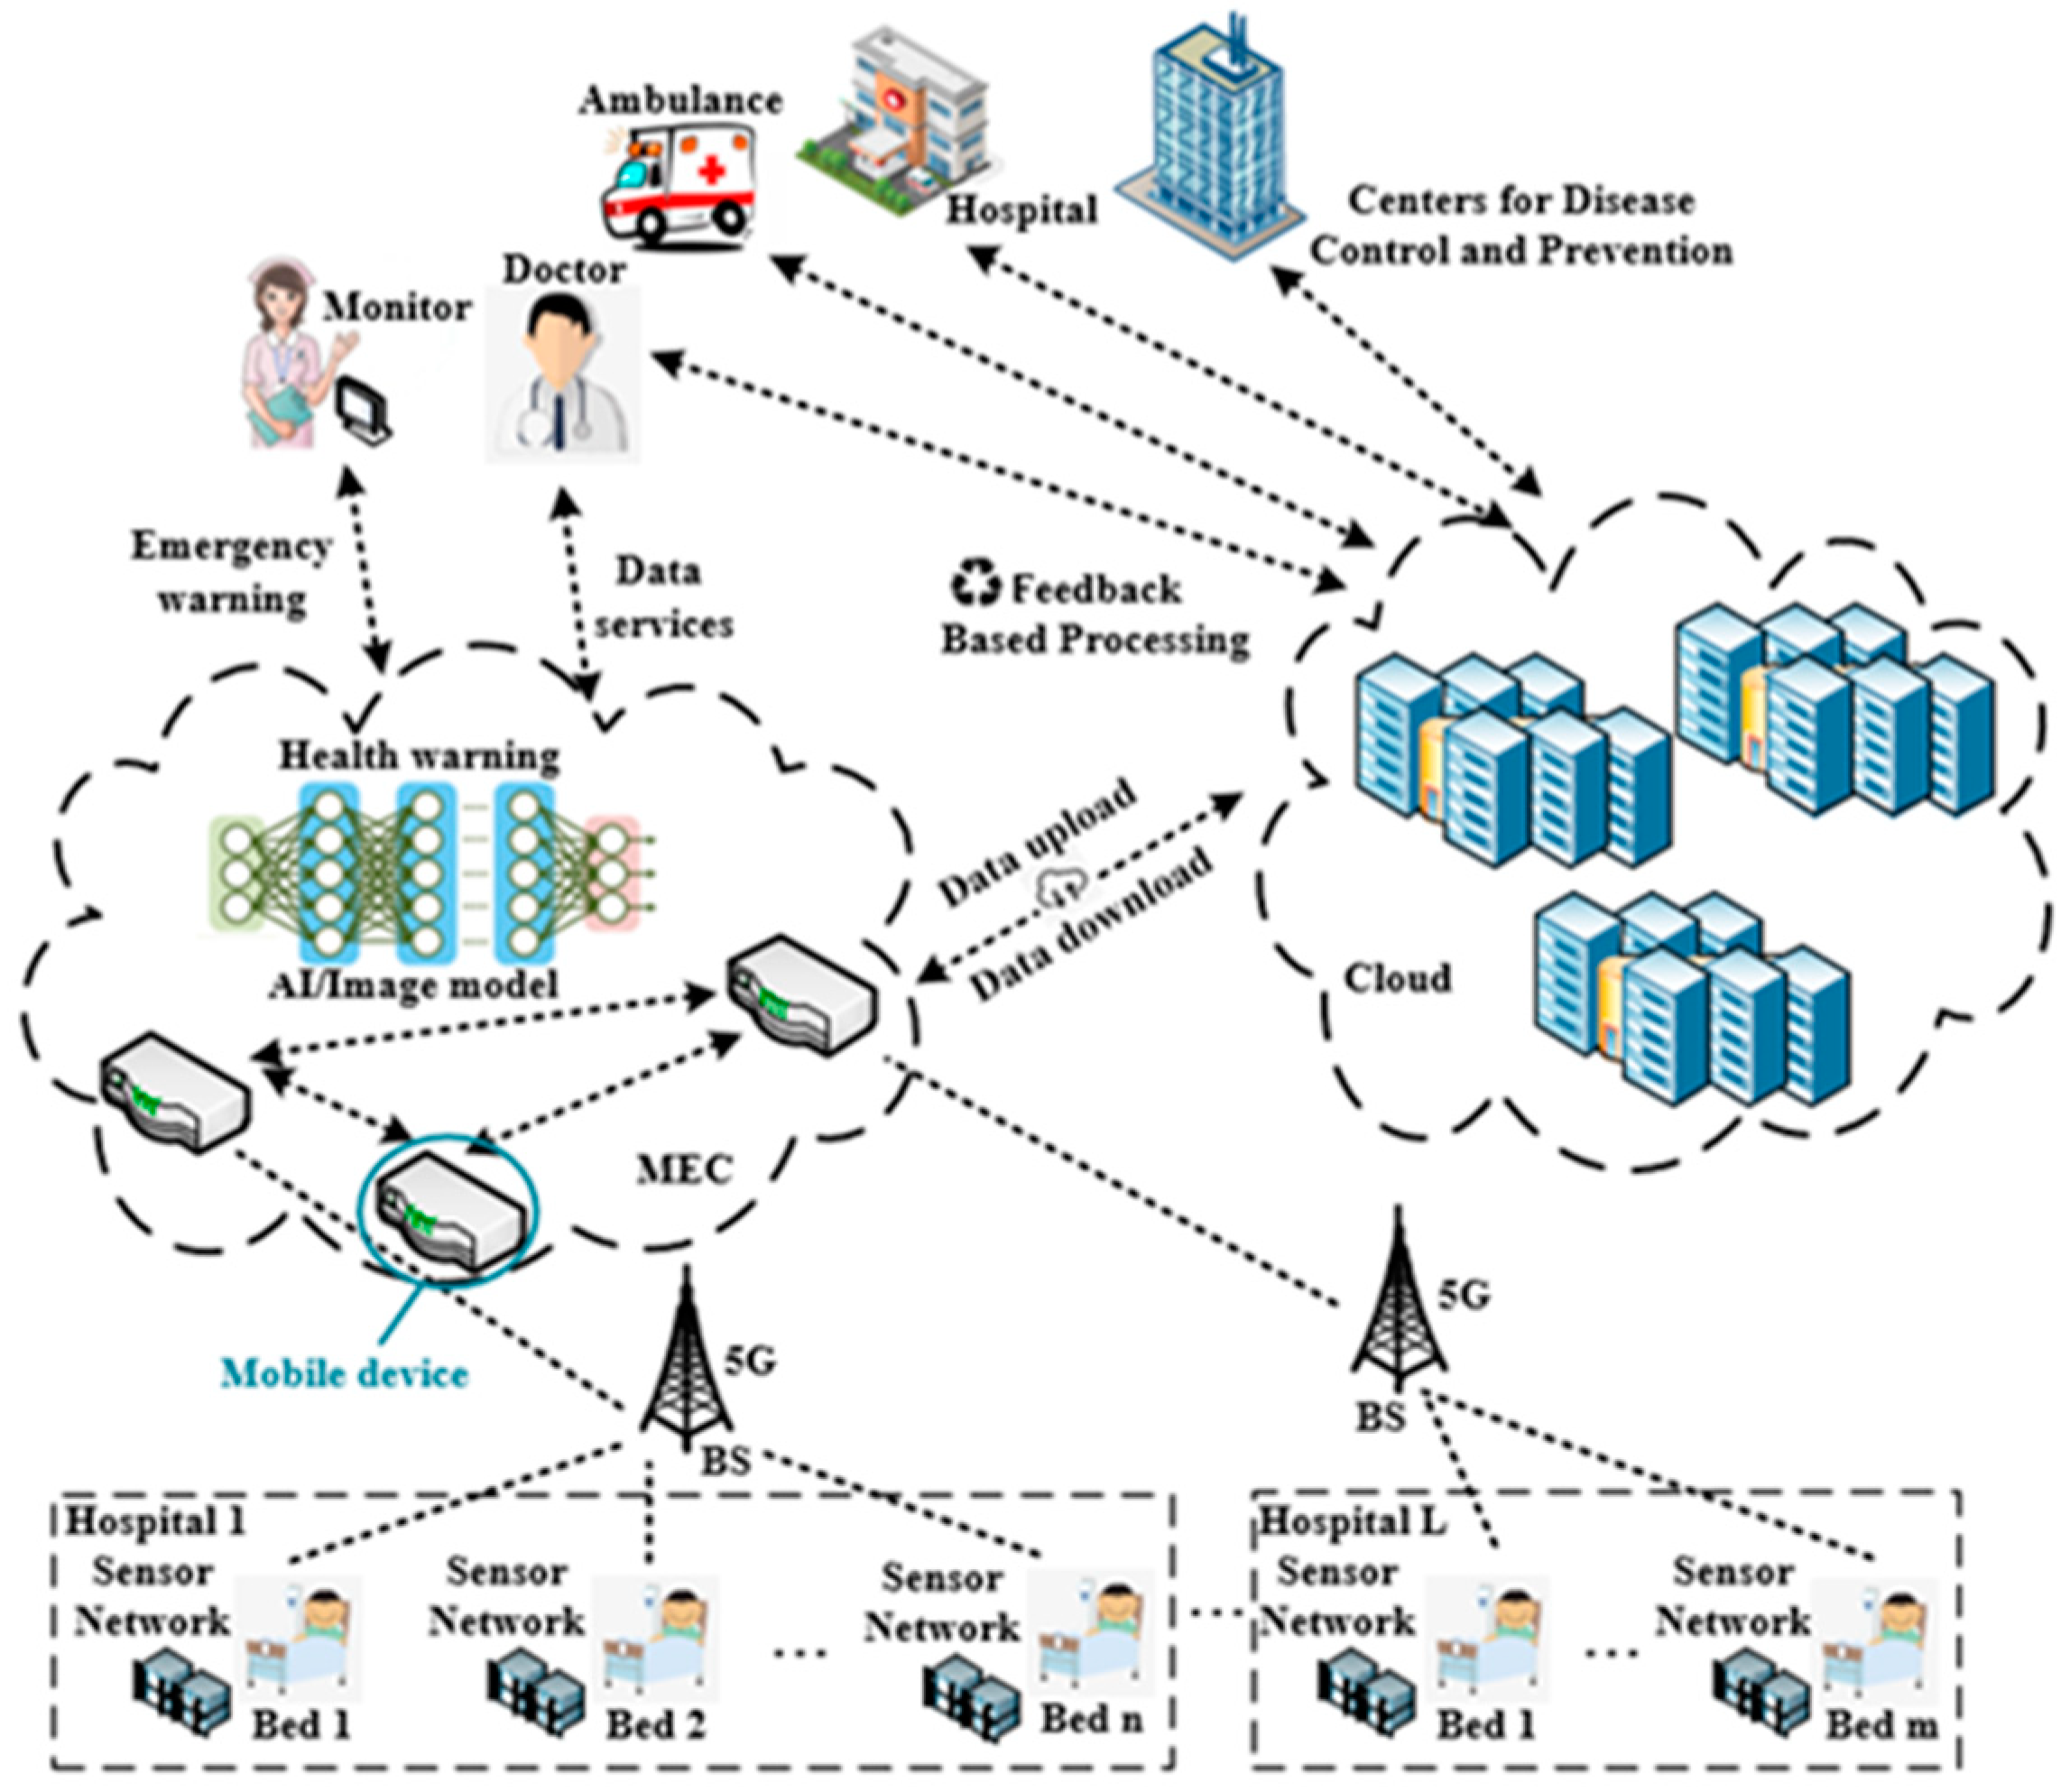
IoT devices in the medical health field will generate massive data, including some highly sensitive data, and some health data require quick analysis and an immediate decision. The telemedicine applications based on IoT cannot be executed locally on the terminals, due to the limited computing, storage capabilities, and the restricted energy supply of the IoT devices. However, uploading all health data to the cloud will not only cause tremendous pressure on the cloud, but also cause huge challenges to the network bandwidth and end-to-end delay. Moreover, the cloud computing center cannot provide location-aware applications. 5G-based mobile edge computing (MEC) provides a better infrastructure network architecture for telemedicine. MEC provides computing, storage, and other infrastructures close to the end users or data sources. The essence of MEC is the extension of the traditional cloud computing to the edge aggregation nodes (e.g., at base stations). It integrates computing, storage, network, and application capabilities at the edge of the network. Unlike traditional cloud computing, network capabilities are one of the core capabilities of MEC. MEC has the characteristics of decentralization, data localization, and low latency. The combination of MEC and telemedicine is of great significance.
However, MEC and cloud computing need to work closely together to better meet the needs of various scenarios, thereby maximizing the value of cloud computing and edge computing services. The data collected by the medical health-related terminal devices are uploaded to the MEC servers, where the data are processed and stored locally. In addition, some emergency data are processed and analyzed in real time, and feedback is immediately made. As most of the data are not uploaded to the remote cloud computing center, the end-to-end delay is greatly reduced, and the bandwidth pressure on the backhaul link is also reduced. However, this does not mean that the cloud computing center will not participate in the telemedicine process. Some data still need to be transferred from the edge nodes to the cloud computing center. The cloud computing center performs big data analysis and mining, data sharing, and simultaneously carries out training and upgrading of the AI algorithm model. The trained or upgraded AI model is pushed to the edge nodes, allowing the real-time intelligent decision-making of health data at the edge nodes to become possible. Moreover, the medical health data also need to be stored and backed up in the cloud computing center to ensure storage reliability and facilitate data sharing among different medical institutions.
Stimulated by commercial profits, some technology giants have attached importance to the layout and application of smart healthcare. IBM invested $1 billion in 2014 to establish the Watson business group. IBM Watson is a technology platform that uses AI technology to gain insight into the regularity of the unstructured data [1]. At present, the system has been applied to the diagnosis and treatment of tumors, cardiovascular diseases, and diabetes, and has been used in other fields, as well. Tencent launched its first AI product, Tencent Miying [2], in the medical field in August 2017. It integrates image recognition and deep learning (DL) with medical science to assist doctors in screening for esophageal cancer, effectively improving screening accuracy and promoting accurate treatment. It also supports early screening for lung cancer, diabetic retinopathy, breast cancer, and other diseases.
In 2019, Ghulam et al. [3] proposed a new intelligent pathology detection system using DL, cloud computing, and edge computing. The sensor will capture the human electroencephalogram (EEG) signal, which will be sent to a nearby edge computing server. The server inserts preprocessing steps and assigns them to available edge devices. Then, the advanced signals will be sent to the cloud computing server. In the cloud server, the proposed tree-based depth model replaces the EEG signal to extract depth features. The classification decision of whether it belongs to a normal person or a pathological person will be sent to the stakeholders. Li et al. [4] proposed an Edge Learning as a Service (EdgeLaaS) framework to process health supervision data locally. Under this framework, edge learning nodes can help patients choose better suggestions from the right guardians in real time when certain emergencies occur. Prabal et al. [5] proposed a remote patient health monitoring system based on fog computing in smart homes. It uses IoT devices to monitor patients in smart home environments. It implements event classification based on fog computing for real-time response and provides real-time decision-making information to doctors and caregivers in various situations.
The proposed work is able to obtain the physiological indicators of users through electrocardiogram (ECG) data. Existing algorithms for the automated ECG analysis of cardiac arrhythmia are based on the assessment of morphological features. After feature extraction, analysis is done by K-Nearest Neighbor (KNN) [6], support vector machine (SVM) [7], and Random Forest (RF) [8] traditionally. Recent state-of-the-art performances achieved by deep learning methods in pattern recognition problems have motivated researchers to implement these techniques to the field of biomedical signal processing. Deep learning technology is based on neural networks for feature extraction and decision-making, of which the convolutional neural network (CNN) and recurrent neural network (RNN) are the two main neural network paradigms. In addition, [9] and [10] utilize the CNN to realize localized origins of premature ventricular contraction and Human Identification through ECGs. Attention-based recurrent neural network (MLDA-RNN) is used for the automated diagnosis of myocardial infarction severity stage [11].
Other than the previous work, our proposed system can provide users with remote medical services through IoT, MEC, and machine learning technologies by monitoring the user’s physical indicators in real time and predicting the patient’s health. The system obtains health-based statistical information and user environment data effectively, including electrocardiogram (ECG) data, global positioning system (GPS) data, weather, and temperature data. In the MEC layer, the collected data are first pre-processed, and AI technology is then used for data analysis to obtain indicators for health monitoring. The physiological indicators monitored by the system come from ECG mostly, so achieving fast and accurate ECG automatic diagnosis and properties recognition are of great significance to the entire system. Therefore, an ECG diagnosis model based on AI is deployed in the MEC layer to improve the whole system. After data analysis, the analysis results and health information are finally transferred to the cloud server for storage and management. Compared with only cloud computing, edge computing platforms perform sensor data analysis tasks at the edge of the network, which reduces the distance of data transmission, thereby making the system run faster. As the nodes of data analysis are closer to the nodes of data generation, it is more difficult for hackers to tamper with the data. The system can reduce or avoid communication delays with the cloud so that key decisions can be immediately implemented at the edge through the deployed machine learning model. The machine learning algorithm proposed in this paper is a one-dimensional convolutional neural network (1D-CNN) model, which can diagnose and predict the type of heart disease. Experimental results prove the effectiveness of the algorithm. Putting the proposed 1D-CNN model on the MEC layer can make full use of the advantages of the proposed system and can provide users with real-time heart disease detection.
The proposed work created a multi-layer system to provide telemedicine for users, which can reduce the medical burden and provide better medical services. However, three problems need to be solved to build the system: First, continuous massive sensor data transmission; second, large amounts of medical data processing with low latency for effective response to emergency medical situations; third, intelligent algorithm for ECG diagnosis with high accuracy. The proposed system combines 5G, MEC, and AI to provide telemedicine services and solve the above problems. The AI model for automatic ECG analysis tackled the problem of data analysis. 5G and MEC guarantee the transmission of massive data with high quality of service (QoS) and allow the computation near the data source to avoid unnecessary data movement, which accelerate service delivery to improve the practicality of the system. Besides being close to the data sources, MEC provides the ability to process the collected data by deploying the AI model on it, and the task of data processing and storage can be done. There are many works using MEC to tackle the problems that exist in telemedicine. For example, one study proposed a three-tier network architecture for mobile-health applications based on MEC [12]. Another discussed the benefits of healthcare systems with MEC-based architecture [13].
The rest of this article is organized as follows. Section 2 introduces the system model with details on the network framework for telemedicine and machine learning-based 5G MEC. Section 3 develops our ECG diagnosis model, including wavelet-transformed data preprocessing and 1D-CNN automata. Section 4 presents the experimental simulation results to justify the performance of our scheme, followed by Section 5 to conclude the paper.

2. System Model

2.1. Network Framework for Telemedicine

The proposed system consists of the IoT layer, MEC layer, and cloud computing layer. The three layers are responsible for different tasks. Medical data are generated in the lower IoT layer, and then transmitted to the MEC layer in the middle for data processing. Finally, it reaches the upper cloud layer for storage and further analysis. These three layers are combined together to form the complete system. The system combines edge computing and AI technology to provide predictive functions, which can monitor abnormalities occurring on the IoT device in real time. The system recognizes ECG abnormalities on the IoT edge device itself instead of the cloud, and notifies the system to take the necessary measures. Edge computing technology provides a way to deploy the proposed ECG diagnostic model on the edge. Figure 1 illustrates the entire system framework. The proposed system performs data preprocessing and data analysis at the MEC layer, and then transmits the analysis results and user health information to the cloud layer for storage and management. Therefore, compared to using cloud computing only, edge computing platforms undertake sensor data analysis tasks at the edge of the network. This reduces the distance of data transmission, thus making the system run faster. It can also eliminate or mitigate transmission noise in sensor data to some extent. The nodes of data analysis are closer to the nodes of data generation, making it difficult for hackers to steal them. The system can reduce or avoid transmission delays to the cloud, so key decisions can be implemented immediately at the edge by deploying machine learning models.
Figure 1 illustrates the workflow of the entire system in a hospital scenario. The IoT layer is composed of a multiple-sensor network deployed around the hospital beds to obtain physiological and environmental data and transmit them to MEC layer. There are many schemes to accomplish the transmission task with Wi-Fi, zig-bee, 4G, or 5G. Among them, the system chooses 5G to connect the IoT with the MEC layer directly to transmit large quantities of IoT sensing data with high QoS every second. As shown in Figure 1, the data stored in the cloud layer can be accessed by the authorized entities, which includes associated hospitals and the Center for Disease Control and Prevention if needed. In addition, the authorized doctors are able to directly acquire the ECG data and analysis results of their patients from the MEC layer. With the aid of artificial intelligence algorithms for automatic ECG diagnosis in the MEC layer, doctors can make a quick decision on what treatment to use or whether to further evaluate the patient’s condition based on the diagnosis results generated by the proposed ECG diagnosis model. Furthermore, nurses can monitor the patients’ physical condition in real time through the monitoring terminal, which is connected to the MEC layer, so they can make a quick response in emergencies.
The IoT-based user subsystem is responsible for the real-time acquisition of health-based statistical information and user environmental data, including ECG data, GPS data, weather, and temperature data. These data are obtained from wireless sensing devices connected to the human body. The wearable sensor node is composed of sportswear inlaid with electrodes and processing hardware. Sportswear is made of soft and stretchable materials. The hardware module is responsible for ECG signal detection, digitization, and wireless data transmission, which can achieve reliable ECG measurements. The cloud subsystem is responsible for storing various user data and the final result of ECG analysis. It consists of a large amount of storage space. In addition to storing the analysis results, it will also summarize the medical information of each user and share it among authorized medical personnel, users, and hospitals. Users and authorized entities can access medical records anytime and anywhere. The MEC layer will periodically send the collected ECG data information to the cloud system for permanent storage to facilitate the management of historical ECG data. It can also be accessed by any other server in the MEC layer at any time. Similarly, the historical alarm messages of the user’s cardiovascular health status are also stored on the cloud server for further analysis by experts to provide emergency plans in case of emergency.
The proposed system can provide high-quality telemedicine services through IoT, MEC, and AI technologies. Telemedicine is a medical service based on advanced technology. Telemedicine is a promising and cost-effective method that can prevent death and improve the functional recovery of patients. This technology has been proven effective and is a viable option for future healthcare. Compared with alternative methods such as conventional care, successful telemedicine can provide high-quality care at low costs.

2.2. 5G MEC with AI

Preventive telemedicine needs a high data transmission rate and very low delay with massive data analysis to achieve the best performance. The traditional base station-centered mobile communication and cloud infrastructure is unable to load a large amount of data, which brings about the high delay and redundant data transmission. The exponential growth of mobile communications has significantly improved the quality of human interactions regardless of distance [14,15,16,17,18]. Mobile edge computing and 5G technology will help the proposed system overcome these problems. Figure 2 shows how the MEC server works with the help of 5G. Moreover, if the large amounts of data are directly handed over to medical experts for analysis, it will prolong the diagnosis time and increase costs. It is necessary to use AI technology as a part of data analysis to implement efficient and accurate diagnosis.
Figure 2 shows the general workflow of the data transmitting and processing over the MEC layer in a nonspecific scenario. The ECG data are generated by users from the sensors in the IoT layer and transmitted to the MEC servers via 5G for further data processing. The tasks of the MEC layer include data receiving, temporary data storage, artificial intelligence-based ECG automatic diagnosis, diagnosis results generation, and data access. In a hospital, the abundance of patient physiological data and environmental data are important factors for doctors to make accurate decisions on disease diagnosis and treatment. Therefore, the hospitalized patients use a sensor network to obtain multiple types of data to accurately reflect their health status. Moreover, the nonhospitalized users could use a similar sensor network at home, or only a wearable device for ECG detection attached on their skin. It depends on the application scenario and the level of health monitoring service the user needs.
Recently, AI technology has flourished. The DL model has been widely used in image recognition, speech recognition, and other fields. Compared with the common machine learning model based on feature extraction, the performance of the DL model has significantly improved. For the classification of arrhythmias, many scientists have put forward their own opinions. Ziman et al. used spectrum transformation technology to input ECG data into a convolution recurrent neural network after spectrum transformation. Hannun et al. used the 34-layer CNN model to analyze the 30 s single lead ECG rhythm, and then classified the arrhythmia. Murugesan et al. used the spatial and temporal characteristics of ECG combined with the characteristics of the long short-term memory (LSTM) and CNN models for analysis. The combination of the neural network, MEC layer, and 5G transmission will greatly improve the efficiency of the whole system.
The proposed system is designed to provide health monitoring services for large-scale users in multiple scenarios. The IoT layer is responsible for collecting the user’s physiological and environmental data through a variety of sensors and uploading them to the cloud, while the cloud provides corresponding computing resources for ECG automatic diagnosis and data storage, and allows authorized individuals or entities to perform further disease analysis or recording through the stored data. It is a data-intensive service related to medical care, so the proposed system utilizes the MEC layer between the IoT layer and cloud layer to shorten data transmission and processing delays, reduce transmission pressure, and increase the response speed to emergency medical conditions. The MEC layer is closed to the nodes of data generation. Compared to using cloud computing only, edge computing undertakes data analysis tasks at the edge of the network. This reduces the distance of data transmission, thus making the system run faster and greatly improves the practicability of the overall architecture of the proposed system. MEC is developed from the edge network. Some MEC hosts can be deployed close to the end users. MEC hosts have sufficient computing and storage capacities. The main advantage of the MEC layer is to reduce the network delay through the storage and computing capacity of the MEC host. In this case, the base station acts as the real server. In addition, it reduces the bandwidth of the device and overcomes the limitations of existing resources such as storage capacity and processing capacity. The main objective of the previous generations of wireless networks is to provide faster internet access to realize the transition from voice-centric networks to multimedia-centric networks. The task of the 5G network is to maintain the stability of communication, computing, control, and content delivery. It is a completely different and more complex task. The purpose of the 5G network is to not only connect users, but also provide a connection for any device or application in the access network. The evolution of mobile technology is a key part of the overall development of machine-to-machine communication and IoT. 5G technology will have a significant impact on many telemedicine scenarios.

3. ECG Diagnosis Model Design

3.1. Denoising with Wavelet Transforms

When the wearable devices are used to collect the ECG signal of the user, it is necessary to use electrodes to detect and record the electrical activation from the user’s skin. Unavoidably, the recorded electrical signals may be biased due to the improper electrode sticking or the influence of the body’s life activities. Moreover, the current flow in the wearable device changes all the time; the magnetic field generated by the current will also have certain interference on the stage of ECG record acquisition. These unavoidable situations will introduce noise into the recorded ECG. These noises mainly consist of baseline wandering and some high-frequency vibration. The baseline wandering may be caused by incorrect electrode contact or the user’s breathing behavior, showing a low-frequency characteristic, which is manifested as the baseline of the ECG changing periodically. To eliminate baseline wandering and high-frequency vibration in recorded signals, this study uses wavelet transforms to accomplish data preprocessing.
The wavelet transform is a kind of mathematical tool for signal processing with many algorithms like continuous wavelet transforms and discrete wavelet transforms (DWTs, which is the algorithm this study uses). DWTs can provide the time and frequency information in signals and are used to detect overlapping noise, which is popular in the field of nonstationary signal processing [19]. The DWT decomposes the signal into approximate coefficients (CA) and detailed coefficients (CD). Then, the CAs are divided into new CAs and CDs. This process is shown in Figure 3. This process will generate a set of CAs and CDs at different scales (n) iteratively.
The ECG denoising approach in this study is composed of three stages: Forward DWT, soft thresholding, and inverse DWT. The wavelet used in this study is db4 from the wavelet family of Daubechies. The stage of forward calculation can be expressed by the following equation:
x ( t ) =   k = + k = + A n , k φ ( 2 n t k ) + j = 1 n k = k = + B j , k 2 2 / j ψ ( 2 j t k )
A n , k is the approximation coefficients at scale n; B j , k denotes the detailed coefficients at scale j; and ψ ( t ) and φ ( t ) are the wavelet function and scaling function, respectively. Wavelet thresholding can be employed where the noisy signal is decomposed into several levels, denoised, and reconstructed. In this study, each of the detailed coefficients is thresholded using the soft thresholding method, in which the threshold is computed using the Rigorous SURE (Stein’s Unbiased Risk Estimator) criterion. The soft thresholding can be described as follows:
B ^ j , k = { s i g n ( B j , k ) ( | B j , k | t ) | B j , k | t 0 o t h e r w i s e
Suppose the B j , k denotes the coefficients of wavelet transforms in scale j, an approximate coefficient B ^ j , k can be generated by a suitable soft threshold t. The function sign ( B j , k ) is used to extract the sign of the number, and the threshold t is selected using the Rigorous SURE criterion. After the stage of inverse DWT, the denoised ECG records are obtained.

3.2. Machine Learning Structure Design

One of the important waveforms existing in ECGs is called the QRS complex [20]. The QRS complexes in an ECG record always appear periodically. When analyzing an ECG waveform, it is necessary to capture the morphological features of QRS complexes at different time steps. The difficulty in analyzing ECGs is to distinguish the subtle differences between different features to make an accurate decision. This study trains a 1D-CNN model to accomplish the tasks of important features captured in different time regions, the high-dimensional abstraction of features, and decision-making.
The structure of the model is shown in Figure 4. Hierarchical residual units similar to those in ResNet are used to construct the main body of the model [21,22], and the pre-activation structure of residual units is used. The shortcut connection provided by the residual unit can connect the input and output of the unit together. This structure allows the network to learn a simpler function that represents a residual value of the input relative to the output and mitigates the gradient vanishing effect, thereby reducing the difficulty of model training. According to [20], the general form of residual units is as follows:
y l + 1 = x l + F ( x l , W l )
x l + 1 = f ( y l + 1 )
In (2), F ( x l , W l ) is the residual function learned by the model, x l + 1 is the output of the l -th layer, x l is the input of the l -th layer, W l is the weight of the l -th layer, and f is generally a rectified linear unit (ReLu) function. After the general unit, He et al. constructed a variety of variants based on the original structure of the residual unit, and finally proposed a full pre-activation structure. This structure uses the function f as another identity mapping such that x l + 1 = y l + 1 ; then, the structure of full pre-activation can be expressed as follows:
x L = x l + i = l L F ( x i , W i )
This allows the feature x l located in the lower layer l to be passed to any high-level L -th layer without obstruction. The output feature x L of the L -th layer can be represented as the feature x l of the lower layer l plus the residual function of all the middle layers, which forms a shortcut connection at the scale of the entire network. According to this structure, a max pooling layer was added after each element-wise addition operation of shortcut connections to extract key features and reduce the dimension of features, so that low-level features were continuously modified by the mapping of the max pooling layer and had an impact on the high-level features.
In each residual unit of the model, there are three ReLu activation function layers, batch normalization layers, and convolutional layers. These layers respectively form three units of hierarchical structures to extract a variety of abstract features in the ECG records with convolutional manner. The ReLu activation function is:
f ( x ) = max ( 0 , x )
This function is usually used to generate nonlinear transformation for the results obtained by the linear transformation of neurons in the network. This function has a simple form and its gradient is easy to calculate, so it is widely used in DL networks to provide the hierarchically connected layers with nonlinear mapping.
The batch normalization (BN) layer in the model is capable of adjusting the distribution of its input in every mini-batch [23,24], which will reduce the internal covariate shift and allow the model to converge faster. Suppose the number of input features of a BN layer in one mini-batch is M, and each feature has a length of N with several channels. The operation of a BN layer on the input can be expressed as:
μ c = 1 N M i = 1 M j = 1 N x i j c
σ c 2 = 1 N M i = 1 M j = 1 N ( x i j c u c ) 2
x ^ i j c = x i j c μ c σ 2 + ϵ
y i j c = γ c x ^ i j c + β c
In the above equations, x i j c denotes a feature value of a particular channel c in one mini-batch, where i [ 1 , M ] and j [ 1 , N ] . μ c and σ c 2 represent the mean and variance of the feature corresponding to the c -th channel across the whole mini-batch, respectively. x ^ i j c is the normalized value of x i j c , and y i j c is the scaled and shifted value after the operations of a BN layer. The layer calculates the mean and variance of the input activation values inside each channel during every iteration and adjusts the mean of the input to 0 while the variance is adjusted to 1. Finally, the input features will be adjusted to a reasonable distribution through two trainable parameters γ c and β c of a particular channel c . By adjusting the data distribution, the internal covariate shift effect in the deep network can be reduced, so the speed of the convergence of the network can be accelerated.
Multiple arrhythmia categories may be present in one ECG record at the same time, which gives the model output multiple diagnosis results. In this study, the model is designed to output each result in the form of binary classification, using the sigmoid function as the activation function of the neuron outputs:
y = 1 1 + e z ,
z = W x + b ,
where x represents the input features of the output layer, W and b are the weights and biases of the layer, and z is the values obtained by the linear mapping of x . The sigmoid function limits the neuron output values z inside the interval of 0 to 1 through nonlinear mapping. Its output value changes rapidly around the position where the independent variable value is zero but changes slowly when it approaches negative infinity or positive infinity. By appropriately transforming the sigmoid function, the following can be obtained:
ln ( y 1 y ) = z =   W x + b
where y ( 0 , 1 ) , which indicates the probability that the ECG record represented by the input feature x is a positive example in a certain category; then, 1 y represents the probability that it is a negative example. The logarithm of the ratio of y and 1 y is called logit. The larger the logarithmic value, the greater the probability that the corresponding ECG record is a positive example. This is the method using a linear regression algorithm to make the model’s diagnosis results approach the logits of the ground truth labels.

3.3. Loss Function and Optimizer

As the model outputs are in the form of multiple binary classifications, these results will be used during training to calculate the model deviation of diagnosis through a kind of appropriate loss function called cross-entropy loss. With the help of a loss function, the model weights can be continuously adjusted through backpropagation to effectively reduce model classification loss. After a number of epochs of training, the model loss will achieve an optimal value, which means the model acquires a good automatic diagnosis and generalization performance. The commonly used cross-entropy loss function is binary cross-entropy (CE) loss, and the design of this function is as follows:
l C E ( y , y ^ ) = { l o g ( y ^ ) y = 1 l o g ( 1 y ^ ) y = 0
When the ground truth label of the ECG record is y = 1 or y = 0 , the CE loss function l C E has different expressions for the model prediction value y ^ and the ground truth y , which represents how severe the model’s diagnostic error on the input ECG record is. During training, as the loss function decreases, the model’s distribution of predictions will become closer and closer to the distribution of the ground truth labels. However, l C E uses the same weights to evaluate the loss produced by the positive and negative samples in the training set. When the number of positive and negative samples in the training set is extremely out of balance, it is more appropriate to use the improved CE loss called focal loss (FL) to address the imbalance problem [25]. As the proportion of the people who receive an ECG examination suffering from cardiovascular diseases is relatively small, the abnormal ECG waveform of some kinds of arrhythmia does not appear every time during ECG monitoring. Therefore, in ECG datasets, the appearance of abnormal ECG patterns of each arrhythmia type occupy only a small part of all recorded ECG waveforms, which has caused an imbalance of the number of positive and negative ECG samples in the training set. FL introduces two hyperparameters for CE loss, which effectively improves the performance of the latter in the imbalanced datasets:
l F L ( y , y ^ ) = { α ( 1 y ^ ) γ log ( y ^ ) y = 1 ( 1 α ) y ^ γ log ( 1 y ^ ) y = 0
l F L ( y , y ^ ) represents the focal loss of the ground truth label y and the model prediction value y ^ . Here, a negative example indicates that an ECG record does not show the characteristics of arrhythmia, and a positive example shows the opposite. The two hyperparameters γ and α introduced in the function have different capabilities. α is used to adjust the proportion of the positive and negative loss function values, so that the integrated loss is not occupied by the loss values caused by a large number of negative samples, so that the model can obtain more information from the positive samples. γ is used to increase the proportion of the loss values caused by hard samples in the total loss to implement weight adjustment for samples with different learning difficulties. With the help of hyperparameter γ , the model can learn more approaches to make decisions on hard samples.
FL is the basic loss function of the model in this study. When calculating the integrated loss of the mini-batches during training, a problem of practical application needs to be considered. When users use wearable devices to collect ECG records by themselves, the collected waveform will be distorted due to operational error or excessive body movement during the data acquisition process. As a result, in this type of ECG record, the valid information that can be used for diagnosis is missing. This type of ECG record is labeled as interference. When constructing the training set, these records cannot simply be discarded because applications in actual scenarios require the pattern to be discriminated. Therefore, when designing the integrated loss function, the existence of inferenced ECG records needs to be considered. The overall loss function structure is as follows:
L n i f ( y , y ^ ) = ( 1 y i f ) l a b i f , l F L ( y l a b , y ^ l a b )
L i f ( y , y ^ ) = l F L ( y i f , y ^ i f )
L ( y , y ^ ) = 1 k ( L n i f ( y , y ^ ) + α i f L i f ( y , y ^ ) )
where i f , n i f , and l a b mean the label of inference, labels of not inference, and labels the input ECG records have, respectively. L i f ( y , y ^ ) represents the focal loss value of the predicted output of interference y ^ i f and the ground truth label of inference y i f . L c l s ( y , y ^ ) indicates that when the ground truth interference label of the input ECG record is marked as 0, the loss value of the predicted results other than the prediction of interference is generated. If the ground truth label of inference is marked as 1, only the loss generated by y ^ i f is considered. k represents the total number of labels on one ECG record. The integrated loss L ( y , y ^ ) of input data is the weighted average of the loss value generated by L i f ( y , y ^ ) and L c l s ( y , y ^ ) , where the parameter α i f represents the weight on the loss value of interference. The loss function is constructed this way because of the special characteristic of the category of interference. The inference category of an ECG record is labeled as 1, denoting that this record is seriously distorted and cannot be used for disease diagnosis. However, in some cases, this kind of ECG record consists of both valid and invalid waveforms, which will cause the model to capture features corresponding to the valid waveform and make the diagnosis of arrhythmia in view of these features. However, the behavior of performing a diagnosis on distorted records is unreasonable; no matter what the model has predicted, these results should not be used as part of the integrated loss. Otherwise it will increase the difficulty of model convergence.
After the loss function is determined, the optimizer can be used to optimize the model parameters through the established loss function [26,27,28]. As the optimization goes on, the model loss will become smaller and smaller and the diagnostic accuracy will improve gradually. The optimizer used in this study is the adaptive moment estimation (Adam) [5]. Adam combines the first and second raw moments of gradients to update the parameters of the model, which can realize the adaptive learning rate calculation on different parameters. Its basic form can be expressed as follows:
m t = β 1 m t 1 + ( 1 β 1 ) g t
v t = β 2 v t 1 + ( 1 β 2 ) g t 2
m ^ t = m t 1 β 1 t
v ^ t = v t 1 β 2 t
W t = W t 1 α v ^ t + ϵ m ^ t
where t represents the gradient descent at time step t; g t is the gradients of model weights W t 1 before the gradient descent; and m t and v t are the moving averages of gradients and the square of gradients, respectively. The parameters β 1 , β 2 ∈ [0,1) are used to control the decay of the moving averages at different time steps. As the estimation of m t and v t is inaccurate at the beginning of the gradient descent, they need to be corrected respectively to m ^ t and v ^ t , where β 1 t and β 2 t represent the squares of β 1 and β 2 for t , respectively. α is the learning rate during gradient descent, and ϵ is a small value to prevent the situation where the denominator is zero. Through the corrected value and the model weight W t 1 , the weight W t updated at time step t can be obtained. With the gradient descent, the model will obtain an optimal configuration of weights.

4. Experimental Simulation Results and Analysis

To train the proposed model and perform tests on it, the ECG dataset used in the present study contains a total of 160,948 records. The data distribution of the dataset in four categories is shown in Table 1. It can be seen that the category of normal occupies a large part of the dataset, while the quantity of other categories is relatively small. The least among them is the premature beat, which only occupies 6% of all records in the training set. It should be noted that some kinds of abnormal heartbeats in the dataset are not included in the existing labels. These records are retained, so the total number of labels in Table 1 will be slightly less than the number of records in the dataset.
Figure 5 plots the four categories of the ECG segments in the dataset, each row of which illustrates 12 s with 3000 data points in one ECG record. From top to bottom, the category of each row is normal, premature beat, retardant, and interference, respectively. Interference means the corresponding record cannot be used in the ECG analysis because of a bad waveform or having too much noise.
Figure 6 shows the training curve of the proposed model. The model was trained using the training set with the initial learning rate of 0.001 and exponential learning rate decay. After 200 epochs of training, the model performance tends to be stable. As illustrated in Figure 1, the fluctuation of the training curve of the heart block is relatively strong. It is difficult for the model to converge in this category because of the small amount.
Fivefold cross-validation was performed on the whole dataset. In Figure 7, the stars denote the average value of the F1 score in every category, while the vertical lines show the variation in the value of the F1 score. As can be observed, the difference between the maximum and minimum F1 score of the category of premature beat is the largest. This may be because the waveform of the premature beat is intermittent and does not always follow a certain period, which brings uncertainty to the model.
Table 2 shows the detail of the performance of the proposed model in the four categories. These results are calculated through the test set and include five metrics to measure model performance from multiple perspectives: acc, spe, sen, ppr, and F1 score. Among the four categories, the performance of the model in the normal category is the best. It can achieve or exceed 0.90 on the five metrics, and the ppr even reaches a high score of 0.961, indicating that the positive prediction made by the model has very high accuracy. In addition to the category of normal, the other three categories have higher accuracy to distinguish the negative samples from the positive ones. This is because the negative samples in the three categories occupy the majority of the whole category, respectively. The model can learn more features for decision making on negative samples. In the ECG dataset used in this study, the heart block category has the smallest number of records, and the ratio of positive samples (samples with heart block) to negative samples (without heart block) is about 1:20. This causes the model’s decision on the heart block category to tilt toward the negative sample during the training process, making the score on the two metrics of spe and ppr relatively low. The high value of acc shows that the model has achieved very good performance in terms of classification accuracy. In ECG datasets, the records without disease often occupy the majority, while the number of records with disease is relatively small. The high-quality performance of the model in classification accuracy is mostly generated from the health records. However, in actual application scenarios, it is particularly important to make accurate predictions on diseased records.
Figure 8 illustrates the simulation results of the model. The little markers with color plot the variation in the metrics used in simulation among the four categories. It is obvious that the F1 score will go down gradually as the number of positive samples decreases in different categories, except the category of inference. The records of inference gain a low F1 score with a relatively considerable number of positive samples because there are too many different patterns of interference for the model to learn.
In the proposed system, the IoT layer continuously generates new data that need to be processed and analyzed every second. These data come from dozens of entities or thousands of sensors and are distributed in different regions. However, sending all these data to the cloud poses several immense problems. First, the volume of data will create capacity issues. Second, it is costly to transmit that much data from its location of origin to centralized data centers in terms of energy, bandwidth, and compute power. This clearly outlines operational efficiency issues that need addressing. Third, the power consumption of transmitting and analyzing data is enormous, and finding an effective way to reduce that cost and waste is clearly needed. Figure 9 shows the time consumption of the ECG model with the increase in data volume. The simulation experiment is performed on an Intel Xeon Platinum 8163 CPU, manufactured by Intel Corporation, CA, USA. It takes 2.63 s to process 100 ECG records with 2.77 mega floating-point operations (MFLOPs). However, the time consumption raised to 19.14 s when processing 1000 ECG records, which needs an MEC layer with multiple machines to improve the computational efficiency of the model.
In addition to improving computational efficiency, introducing an MEC layer to process data locally reduces transmission costs. However, automated data analysis techniques are also required for ECG data analysis, and one of the most effective methods is to utilize the capabilities of AI. Therefore, all servers in the MEC layer are equipped with the ECG diagnosis model based on AI.

5. Conclusions

Mobile edge computing is a promising network paradigm in telemedicine with great potential to reduce the time of data transmission and further accelerate the data analysis process with the help of AI technology. MEC makes a cloud computing system more powerful by extending the computation and storage facilities to the edge of the IoT network. In this paper, a telemedicine system based on MEC and AI for remote health monitoring and automatic disease diagnosis was presented. The system consists of an IoT layer, MEC layer, and cloud computing layer. The DL model for ECG diagnosis is deployed on the MEC layer. In the simulation results, the proposed model shows the high accuracy of prediction on multiple categories in the ECG dataset, enabling the whole system to present a more efficient medical information analysis ability.

Author Contributions

Y.Z. contributed the central idea and designed the structure of the whole system. G.C. contributed the algorithm for the diagnosis of ECG and conducted the simulation experiment. H.D. contributed the analysis of data and wrote the draft of the paper. X.Y. contributed computational resources to perform the simulation. M.K. contributed the validation of experimental data and results. M.C. contributed important suggestions for manuscript revision. All authors have read and agreed to the published version of the manuscript.

Funding

This research received no external funding.

Acknowledgments

Thanks to the authors for their ideas and constructive comments, and to the editors and reviewers for their careful review, all of which contribute to the enrichment of the paper and the improvement of quality.

Conflicts of Interest

The authors declare no conflict of interest.

References

  1. Zhang, J.; Yang, L.; Cao, W.; Wang, Q. Formal Analysis of 5G EAP-TLS Authentication Protocol Using Proverif. IEEE Access 2020, 8, 23674–23688. [Google Scholar] [CrossRef]
  2. Prodhan, U.K.; Rahman, M.Z.; Jahan, I.; Abid, A.; Bellah, M. Development of a portable telemedicine tool for remote diagnosis of telemedicine application. In Proceedings of the 2017 International Conference on Computing, Communication and Automation (ICCCA), Greater Noida, India, 5–6 May 2017; pp. 287–292. [Google Scholar]
  3. Perez, R.R.; Marques, A.; Mohammadi, F. The application of supervised learning through feed-forward neural networks for ECG signal classification. In Proceedings of the 2016 IEEE Canadian Conference on Electrical and Computer Engineering (CCECE), Vancouver, BC, Canada, 15–18 May 2016; pp. 1–4. [Google Scholar]
  4. Yu, X.; Yu, Z.; Ramalingam, S. Learning Strict Identity Mappings in Deep Residual Networks. In Proceedings of the 2018 IEEE/CVF Conference on Computer Vision and Pattern Recognition, Salt Lake City, UT, USA, 18–22 June 2018; pp. 4432–4440. [Google Scholar]
  5. Wang, X.; Cheng, P.; Liu, X.; Uzochukwu, B. Focal loss dense detector for vehicle surveillance. In Proceedings of the 2018 International Conference on Intelligent Systems and Computer Vision (ISCV), Fez, Morocco, 2–4 April 2018; pp. 1–5. [Google Scholar]
  6. Sharma, L.N.; Tripathy, R.K.; Dandapat, S. Multiscale Energy and Eigenspace Approach to Detection and Localization of Myocardial Infarction. IEEE Trans. Biomed. Eng. 2015, 62, 1827–1837. [Google Scholar] [CrossRef] [PubMed]
  7. Zhu, W.; Chen, X.; Wang, Y.; Wang, L. Arrhythmia Recognition and Classification Using ECG Morphology and Segment Feature Analysis. IEEE/ACM Trans. Comput. Biol. Bioinform. 2018, 16, 131–138. [Google Scholar] [CrossRef] [PubMed]
  8. Rahman, Q.A.; Tereshchenko, L.G.; Kongkatong, M.; Abraham, T.; Abraham, M.R.; Shatkay, H. Utilizing ECG-Based Heartbeat Classification for Hypertrophic Cardiomyopathy Identification. IEEE Trans. Nanobiosci. 2015, 14, 505–512. [Google Scholar] [CrossRef]
  9. Yang, T.; Yu, L.; Jin, Q.; Wu, L.; He, B. Localization of Origins of Premature Ventricular Contraction by Means of Convolutional Neural Network From 12-Lead ECG. IEEE Trans. Biomed. Eng. 2017, 65, 1662–1671. [Google Scholar] [CrossRef]
  10. Abdeldayem, S.S.; Bourlai, T. A Novel Approach for ECG-Based Human Identification Using Spectral Correlation and Deep Learning. IEEE Trans. Biom. Behav. Identity Sci. 2019, 2, 1–14. [Google Scholar] [CrossRef]
  11. Prabhakararao, E.; Dandapat, S. Myocardial Infarction Severity Stages Classification from ECG Signals Using Attentional Recurrent Neural Network. IEEE Sens. J. 2020, 20, 8711–8720. [Google Scholar] [CrossRef]
  12. Lin, D.; Tang, Y. Edge Computing-Based Mobile Health System: Network Architecture and Resource Allocation. IEEE Syst. J. 2020, 14, 1716–1727. [Google Scholar] [CrossRef]
  13. Abdellatif, A.A.; Mohamed, A.; Chiasserini, C.F.; Tlili, M.; Erbad, A. Edge Computing for Smart Health: Context-Aware Approaches, Opportunities, and Challenges. IEEE Netw. 2019, 33, 196–203. [Google Scholar] [CrossRef] [Green Version]
  14. Sun, S.; Kadoch, M.; Gong, L.; Rong, B. Integrating network function virtualization with SDR and SDN for 4G/5G networks. IEEE Netw. 2015, 29, 54–59. [Google Scholar] [CrossRef]
  15. Zhang, N.; Cheng, N.; Gamage, A.T.; Zhang, K.; Mark, J.W.; Shen, X. Cloud assisted HetNets toward 5G wireless networks. IEEE Commun. Mag. 2015, 53, 59–65. [Google Scholar] [CrossRef]
  16. Wu, Y.; Rong, B.; Salehian, K.; Gagnon, G. Cloud Transmission: A New Spectrum-Reuse Friendly Digital Terrestrial Broadcasting Transmission System. IEEE Trans. Broadcast. 2012, 58, 329–337. [Google Scholar] [CrossRef]
  17. Rong, B.; Qian, Y.; Lu, K.; Chen, H.; Guizani, M. Call Admission Control Optimization in WiMAX Networks. IEEE Trans. Veh. Technol. 2008, 57, 2509–2522. [Google Scholar] [CrossRef]
  18. Chen, N.; Rong, B.; Zhang, X.; Kadoch, M. Scalable and Flexible Massive MIMO Precoding for 5G H-CRAN. IEEE Wirel. Commun. 2017, 24, 46–52. [Google Scholar] [CrossRef]
  19. Rajankar, S.O.; Talbar, S.N. An optimum ECG denoising with wavelet neural network. In Proceedings of the 2015 International Conference on Pervasive Computing (ICPC), Pune, India, 8–10 January 2015; pp. 1–4. [Google Scholar]
  20. Majumder, S.; Chen, L.; Marinov, O.; Chen, C.; Mondal, T.; Deen, M.J. Noncontact Wearable Wireless ECG Systems for Long-Term Monitoring. IEEE Rev. Biomed. Eng. 2018, 11, 306–321. [Google Scholar] [CrossRef] [PubMed]
  21. Ke, H.; Chen, D.; Shi, B.; Zhang, J.; Liu, X.; Zhang, X.; Li, X. Improving Brain E-Health Services via High-Performance EEG Classification with Grouping Bayesian Optimization. IEEE Trans. Serv. Comput. 2020, 13, 696–708. [Google Scholar] [CrossRef]
  22. Jalali, A.; Lee, M. Atrial Fibrillation Prediction with Residual Network Using Sensitivity and Orthogonality Constraints. IEEE J. Biomed. Health Inform. 2020, 24, 407–413. [Google Scholar] [CrossRef] [PubMed]
  23. Wu, S.; Li, G.; Deng, L.; Liu, L.; Wu, D.; Xie, Y.; Shi, L. L1-Norm Batch Normalization for Efficient Training of Deep Neural Networks. IEEE Trans. Neural Netw. Learn. Syst. 2019, 30, 2043–2051. [Google Scholar] [CrossRef] [PubMed] [Green Version]
  24. Nie, D.; Wang, L.; Adeli, E.; Lao, C.; Lin, W.; Shen, D. 3-D Fully Convolutional Networks for Multimodal Isointense Infant Brain Image Segmentation. IEEE Trans. Cybern. 2019, 49, 1123–1136. [Google Scholar] [CrossRef] [PubMed]
  25. Lin, T.; Goyal, P.; Girshick, R.; He, K.; Dollár, P. Focal Loss for Dense Object Detection. IEEE Trans. Pattern Anal. Mach. Intell. 2020, 42, 318–327. [Google Scholar] [CrossRef] [PubMed] [Green Version]
  26. Duan, A.; Guo, L.; Gao, H.; Wu, X.; Dong, X. Deep Focus Parallel Convolutional Neural Network for Imbalanced Classification of Machinery Fault Diagnostics. IEEE Trans. Instrum. Meas. 2020, 69, 8680–8689. [Google Scholar] [CrossRef]
  27. Saha, B.; Gupta, S.; Phung, D.; Venkatesh, S. A Framework for Mixed-Type Multioutcome Prediction with Applications in Healthcare. IEEE J. Biomed. Health Inform. 2017, 21, 1182–1191. [Google Scholar] [CrossRef] [PubMed]
  28. Lv, Q.; Chen, H.; Zhong, W.; Wang, Y.; Song, J.; Guo, S.; Qi, L.; Chen, C.Y. A Multi-Task Group Bi-LSTM Networks Application on Electrocardiogram Classification. IEEE J. Transl. Eng. Health Med. 2020, 8, 1–11. [Google Scholar] [CrossRef]
Figure 1. Framework of the system model.
Electronics 09 01753 g001
Figure 2. Dataflow over the system model.
Electronics 09 01753 g002
Figure 3. Decomposition of a signal into approximate and detailed components.
Electronics 09 01753 g003
Figure 4. Structure of the proposed one-dimensional convolutional neural network (1D-CNN) model.
Electronics 09 01753 g004
Figure 5. Four categories of ECG records in the dataset.
Electronics 09 01753 g005
Figure 6. Training curve of the model.
Electronics 09 01753 g006
Figure 7. Fivefold cross-validation results.
Electronics 09 01753 g007
Figure 8. Visualization of the simulation results.
Electronics 09 01753 g008
Figure 9. The time consumption as the amount of ECG data increases.
Electronics 09 01753 g009
Table 1. Data distribution of electrocardiogram (ECG) dataset.
NormalPremature BeatHeart BlockInterference
DatasetNumber66,38411,065572219,728
Proportion65%11%6%19%
Table 2. Performance of the proposed model for ECG diagnosis.
AccSpeSenPprF1 Score
Normal0.9080.8960.9310.9610.928
Premature beat0.9730.9090.9810.8570.882
Heart block0.9790.8180.9880.8010.809
Interference0.9160.8830.9220.6880.773
Publisher’s Note: MDPI stays neutral with regard to jurisdictional claims in published maps and institutional affiliations.

