Article

CNN-Based Fall Detection Strategy with Edge Computing Scheduling in Smart Cities

1
School of Computer Science and Technology, Harbin Institute of Technology, Harbin 150001, China
2
Department of Electronic and Information Engineering, Heilongjiang Vocational College for Nationalities, Harbin 150066, China
3
Department of Financial Technology, China Construction Bank, Harbin 150001, China
*
Author to whom correspondence should be addressed.
Electronics 2020, 9(11), 1780; https://doi.org/10.3390/electronics9111780
Submission received: 11 October 2020 / Revised: 20 October 2020 / Accepted: 21 October 2020 / Published: 27 October 2020
(This article belongs to the Section Artificial Intelligence)

Abstract

:
The livelihood problem, especially the medical wisdom, has played an important role during the process of the building of smart cities. For the medical wisdom, the fall detection has attracted the considerable attention from the global researchers and medical institutions. It is very difficult for the traditional fall detection strategies to realize the intelligent detection with the following three reasons: (i) the data collection cannot reach the real-time level; (ii) the adopted detection methods cannot satisfy the enough stability; and (iii) the computation overhead of collection device is very high, which causes the barely satisfactory detection effect. Therefore, this paper proposes Convolutional Neural Network (CNN)-based fall detection strategy with edge computing consideration, where the global network view ability of Software-Defined Networking (SDN) is used to collect the generated data from smartphone. Meanwhile, on one hand, the edge computing is exploited to put some computation tasks at the edge server by the scheduling technique. On the other hand, CNN is equipped with both edge server and smartphone, and it is leveraged to train the related data and further give the guidance of fall detection. The experimental results show that the novel fall detection strategy has a more accurate rate, transmission delay, and stability than two cutting-edge strategies.

1. Introduction

The definition of a smart city was first proposed in the 1990s, referring to the use of Information and Communications Technologies (ICT) and modern infrastructures within cities [1]. Consider the purpose of improving the citizens’ living quality, and the smart city is conceptualized as a scenario where the citizens are the center of all applications and services [2]. In this context, many cities, such as Shenzhen (China), Busan (South Korea), Santander (Spain), Chicago (United States), and Milton Keynes (United Kingdom) are trying their best to become smarter by using ICT to optimize various aspects of city operation and management.
As we know, the medical wisdom plays an important role during the process of building smart cities because it belongs to the non-negligible livelihood problem. Although many countries have improved the healthcare systems to increase the average life expectancy, it is very difficult to provide the proper care for the older people because the frequent workplace changes have the great increasing influence on the average distance between family members (children and parents). Furthermore, the falling behavior has been regarded as one of the significant issues faced by older people, in which a fall behavior can be very dangerous and often results in the severe health problem [3]. Therefore, the fall detection in the field of medical wisdom has attracted the considerable attention from the global researchers and medical institutions.
At present, there have been some methods being used for fall detection. For example, from the perspective of detection pathway, they usually include wearable sensors based ones, site environmental installation based ones, and video installation based ones [4]. Among them, the first type is to obtain the fall signal from the sensors equipped at the body; the second type determines whether the older people fall according to both site environment and body posture; the last type uses the video surveillance with the continuous monitoring actions to analyze the fall probability. It is obvious that the video surveillance based detection pathway is the most popular because such technique does not have excessive interference with the older people. Furthermore, from the perspective of detection devices, these methods can be usually divided into two forms, i.e., sensors and smart devices [5]. However, these sensors are equipped at the body with some limitations, such as inconvenience and being nonsynchronous. Thus, more and more researchers are inclined to use the smart devices, which shows the important popularity with the rapid development of Internet of Things (IoT). Nowadays, the smartphone is a great choice to make such fall detection. According to the above statements, it is the relatively optimal fall detection solution by using the combination of video surveillance and smartphone.
However, in fact, if the smartphone is used, it is not necessary to analyze the fall probability via the video surveillance because the continuous monitoring actions consume the transmission traffic and easily lead to the delay jitter [6]. Instead, we can analyze the collected data from the smartphone and make the timely judgment. In spite of this, it is very difficult for the previous fall detection strategies to realize the intelligent detection with the following three reasons: (i) the data collection cannot reach the real-time level; (ii) the adopted detection methods cannot satisfy the enough stability; and (iii) the computation overhead of the collection device is very high, which causes the barely satisfactory detection effect [7,8,9]. Therefore, it is considerably significant to study the novel fall detection method based on smartphones.
Nevertheless, the cache size of smartphone is limited, which prevents the smartphone from storing much data. On the other hand, the computation resources of smartphone are also limited, which prevents the smartphone from making efficient computing. Under such situations, the analyzed effect fails to reach the accurate level. To this end, it requires employing the other devices with the large cache size to help store a large proportion of data from the smartphone and support the high performance computing. Regarding this, the edge computing [10,11,12] framework can be considered as the candidate solution, where the edge servers are responsible for providing storage resources and computation resources.
With the above considerations, this paper proposes Convolutional Neural Network (CNN)-based fall detection strategy with edge computing, called EdCNN. In particular, the global network view ability of Software-Defined Networking (SDN) is used to collect the generated data from smartphone. The contributions of this paper are recognized as follows: (i) The edge computing is exploited to put some computation tasks at the edge server by the scheduling technique. (ii) CNN is equipped with both edge server and smartphone to train the related data and give the guidance of fall detection. (iii) The simulation experiments are made by testing the accurate rate, transmission delay, and stability to demonstrate the efficiency. To the best of our knowledge, this paper is the first to do fall detection with SDN, edge computing, and CNN.
The rest paper is structured as follows: Section 2 reviews the existing literature. Section 3 presents a system framework of EdCNN. A scheduling strategy is proposed in Section 4. Section 5 introduces the CNN-based data training method. The experimental results are shown in Section 6. Section 7 discusses and concludes this paper.

2. Literature Review

There have been a number of research papers on fall detection. For example, Lgual et al. [13] reviewed 327 related literature, which mainly concentrated on the context-aware systems further including based on cameras, floor sensors, microphones, and pressure sensors. Meanwhile, they emphasized that there was no standardized context-aware technique widely accepted by the research community in this field even though many feature extractions and machine learning techniques were adopted by researchers. Ward et al. [14] made a comprehensive review on fall detection from the perspective of applications. Therein, these technique methods could be divided into based on manually operated devices, body worn automatic alarm systems and devices to detect such changes that might increase the falling risk. In addition, Refs. [15,16,17,18,19,20] also presented the survey contributions to address the similar issues. Different from them, this paper plans to review the latest and representative research achievements since 2017.
In [21], this research made use of a comprehensive bounding box and a dynamic state machine in a new way to do fall detection. The proposed approach offered a way to track and analyze continuous data streams of the visual images to automatically predict a fall event prior to the fall state in a single-phase instead of the typical two-phases. In [22], the authors regarded the fall detection as an example of action detection and proposed to locate its temporal extent, which was achieved by exploiting the effectiveness of deep networks. In the training stage, the trimmed video clips of four phases (standing, falling, fallen, and not moving) in a fall were converted into four categories of so-called dynamic images to train and predict the label of each dynamic image. In the testing stage, a set of sub-videos was generated by using a sliding window on an untrimmed video. In [23], this paper aimed to detect human fall by utilizing the built inertial measurement unit sensors of a smartphone attached to the body with the signals wirelessly transmitted to remote PC for processing, where a threshold based fall detection algorithm was implemented while a supervised machine learning algorithm was used to classify activity daily living. In [24], a new dataset of movement traces acquired through the systematic emulation of a set of predefined activities of daily life and falls was described to provide the reference for research.
In [25], the authors concentrated on energy efficiency of a wearable sensor node and proposed the design of a tiny, lightweight, flexible, and energy efficient wearable device, in which different parameters (e.g., sampling rate, communication bus interface, transmission protocol, and transmission rate) impacting on energy consumption of the wearable device were studied. In [26], a framework by using acoustic local ternary patterns and analyzing environmental sounds was proposed, which suppressed silence zones in sound signals and distinguished overlapping sounds. Specifically, acoustic features were extracted from the separated source components by using the acoustic local ternary patterns, and then fall events were detected through a support vector machine based classifier. In [27], an intelligent system to detect human fall events by using a physics-based myoskeletal simulation was proposed, which demonstrated that the use of fall recordings was unnecessary for modeling the fall since the simulation engine could produce a variety of fall events customized to the individual’s physical characteristics. In [28], a fuzzy logic-based fall detection algorithm was developed to process the output signals from the accelerometer and sound sensor, where a valid fall activity detected by the accelerometer, coupled with a detected sound pressure from the resultant fall could infer an occurrence of a valid fall. In [29], a methodology for acquisition and preprocessing of measurement data from infrared depth sensors was proposed. Therein, the data processing was initiated with extraction of the silhouette from the depth image and estimation of the coordinates of the center of that silhouette.
In [30], a hierarchical classifier based on fisher discriminant analysis was developed to improve detection accuracy and reduce false alarms. It divided human activities into three categories: non-fall, backward fall, and forward fall with the hierarchical classifier. In [31], a computer vision based framework was proposed to detect falls from surveillance videos. It introduced a novel three-stream CNN as an event classifier, where silhouettes and their motion history images serve as input to the first two streams, while dynamic images whose temporal duration were equal to motion history images, were used as input to the third stream. In [32], the authors presented an automated analysis algorithm for remote detection of high impact falls, based on a physical model of a fall, aiming at universality and robustness. In [33], a fall detection system based on a 2D CNN inference method and multiple cameras was devised. This approach analyzed images in fixed time windows and extracted features by using an optical flow method that obtained information on the relative motion between two consecutive images. In [34], the authors presented the design of an embedded software for wearable devices connected in wireless mode to a remote monitoring system. In particular, the work proposed the embedding of a recurrent neural network architecture on a micro controller unit. Furthermore, to address the feasibility of such resource-costrained deep learning approach, the work presented a few general formulas to determine memory occupation, computational load and power consumption. In [35], a new fall detection system relying on different signals acquired with multiple wearable sensors was proposed. The system made use of the covariance of the raw signals and the nearest neighbor classifier, at the same time, it also employed the covariance matrix as a straightforward mean for fusing signals from multiple sensors to enhance the classification performance. In [36], combining ensemble stacked autoencoders with one-class classification based on the convex hull, the authors proposed a novel intelligent fall detection method based on accelerometer data from a wrist-worn smart watch. In the proposed method, the first role was adopted for unsupervised feature extraction to overcome the disadvantages of artificial feature extraction while the second role was used for pattern recognition.
In [37], the authors presented a dedicated system for detecting falls caused by complications in hemodialysis patients using RF signals. In particular, they designed a residual feature extraction algorithm based on the hemodialysis patient safety process model, and the fall detection of hemodialysis patient was treated as a machine learning problem where four classification models were built via learning residual feature space. In [38], an innovative highly-efficient intelligent system based on a fog-cloud computing architecture was proposed to timely detect falls using deep learning techniques deployed on resource-constrained fog nodes. In [39], the authors devised a scalable architecture of a system that could monitor thousands of older adults, detect falls, and notify caregivers, in which several machine learning models were employed to evaluate their suitability in the detection process. In [40], the paper proposed a centralized unobtrusive IoT based device-type invariant fall detection and rescue system for monitoring of a large population in real time. It supported that any type of device could be used to monitor a large population in the proposed system. In [41], the authors introduced an effective and optimized fall detection system that used an approach based on a killer heuristics optimized AlexNet convolution neural network, in which the feature searching was performed by applying the alpha-beta pruning move.
According the above reviewed literature, it is observed that the new emerging techniques have been used to help fall detection. In spite of this, the current research achievements always have some limitations which need to be improved and enhanced. For example, the data collection cannot reach the real-time level; the adopted detection methods cannot satisfy the enough stability; and the computation overhead of collection device is very high. Given this, this paper will exploit the emerging techniques (e.g., CNN and edge computing) and networking paradigms (e.g., SDN) to further study fall detection. In other words, SDN, edge computing and CNN are novel elements in this paper which are different from the traditional methods.

3. System Framework

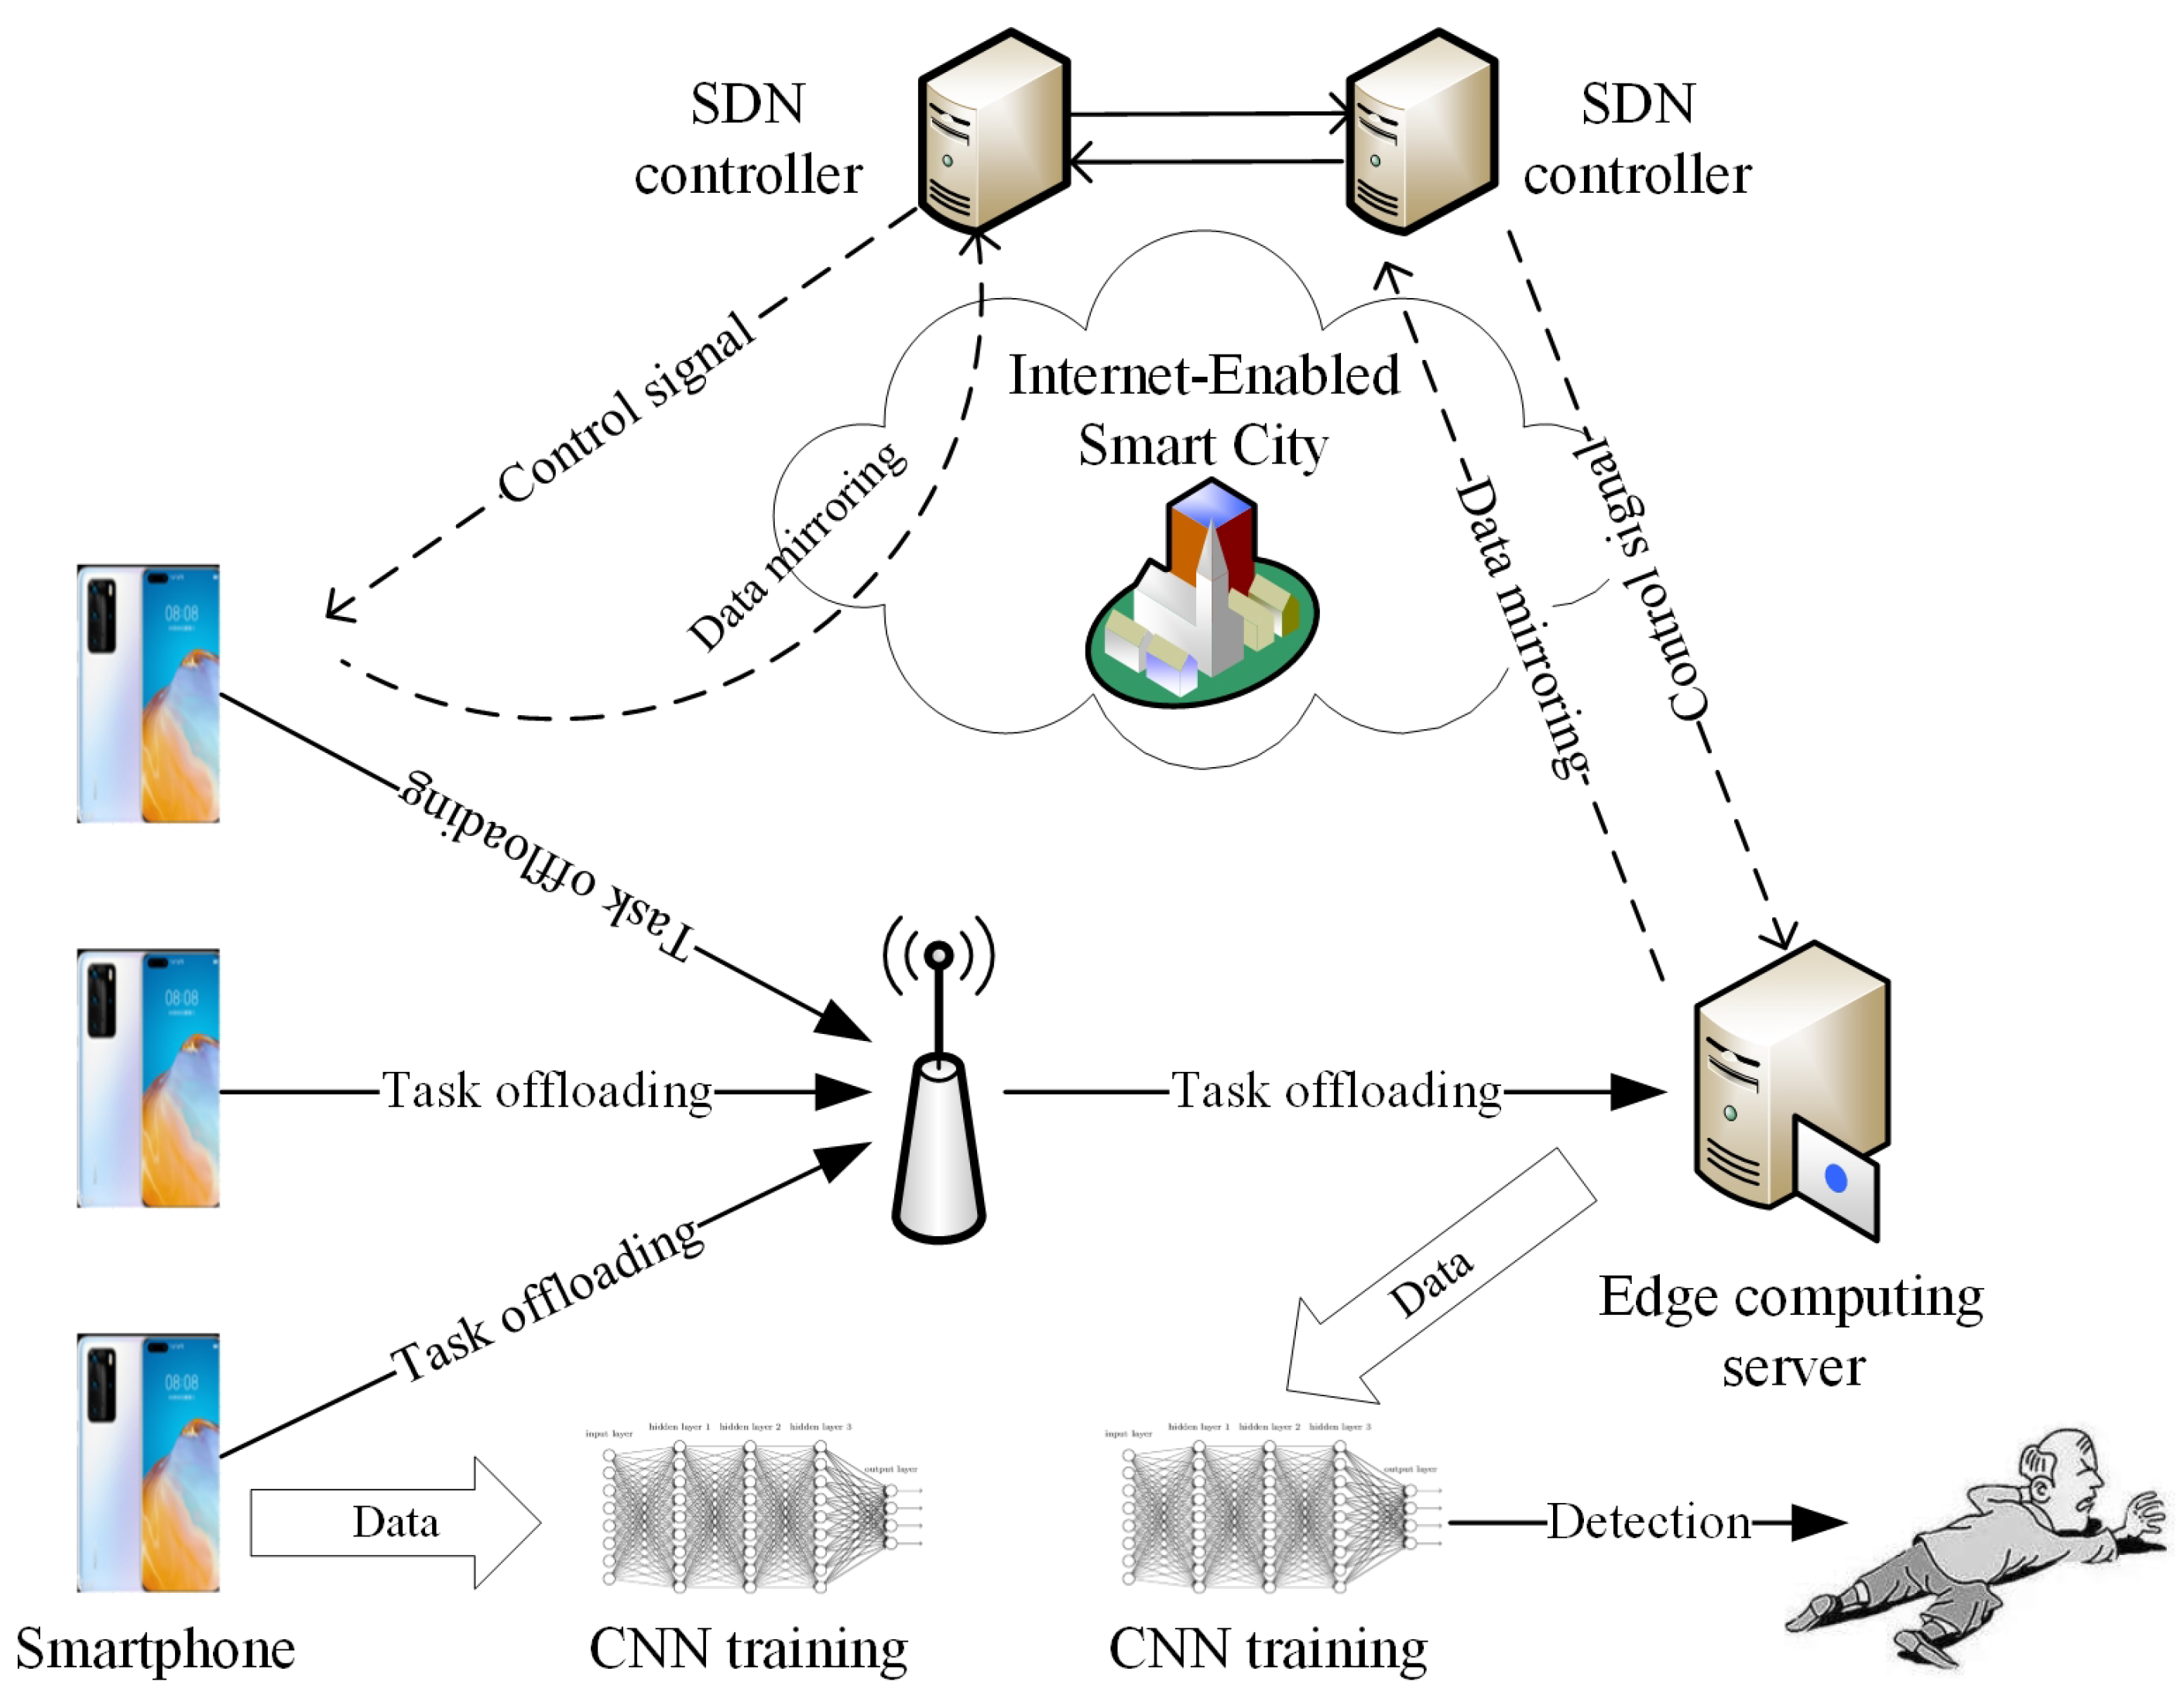
As the above mentioned, the smartphone has the limited storage resources and computation resources, which cannot support the efficient fall detection. Based on the edge computing model, the some computation tasks can be migrated into the edge server for computation. In addition, the current data collection cannot reach the real-time level, thus SDN is employed to monitor the global data status in terms of the smartphone or the edge computing server via the concentrated control ability. In summary, the edge computing and SDN are adopted to help realize the fast and efficient fall detection, which is the newest idea to the best of our knowledge. In spite of this, it always requires CNN for the data training in order to provide the guidance of fall detection. According to such statements, the system framework of EdCNN is shown in Figure 1. We can see that the proposed EdCNN includes three main external roles, i.e., a number of smartphones, an edge computing server, and two SDN controllers, where both smartphone and edge computing server are integrated with the CNN used to training the corresponding data. The whole functions and workflow of EdCNN are described as follows.
The smartphone is used to collect data from the older people with convenience and flexibility, and it is also used to make the data computing via CNN. The edge computing server is used to accommodate much data and make the data computing via CNN. The SDN controller is used to scan the global data status in the smartphone or edge computing server. Regarding the simple workflow, at first, some computation tasks are migrated into the edge computing server via the scheduling strategy (see Section 4 for details), at the same time, the remaining tasks are computed via CNN at the smartphone. Then, the migrated tasks are computed via CNN at the edge computing server. During the performing process, one SDN controller is responsible for monitoring the data status of smartphone and the other one is responsible for scanning the data status of edge computing service, which provide the support for the scheduling strategy through the Internet-enabled smart city. Meanwhile, the SDN controller sends the controller signal to adjust the migration amount of data after both smartphone and edge computing server submit the mirroring data to the SDN controller. At last, the trained data are obtained to conduct the fall detection.
It is obvious that two techniques issues should be addressed in this paper, i.e., how to make the edge computing scheduling (how many tasks are migrated into the edge computing server) and how to train the data (which is used to implement CNN-based data training). Regarding the virtual data submission to the SDN controller, it can be realized by the OpenFlow switch [42,43] that has the inherent minoring and indirection functions. Therefore, we will introduce edge computing scheduling strategy and CNN-based data training in the following sections.

4. Edge Computing Scheduling

Although the introduction of edge server relieves the computation pressure and storage pressure of smartphone, i.e., decreasing energy consumption, it causes the transmission delay from the smartphone to the edge computing server. It is observed that there is a trade-off problem between running delay and energy consumption. In this section, we first give the scheduling model based on edge computing; then, we present an intelligent method to address the trade-off issue.

4.1. Scheduling Modeling

With respect to running delay and energy consumption generated by the introduction of edge computing, they are modeled in this section. In particular, the total cost includes three parts, i.e., local running, tasks transmission, and results returning. Among them, the first part means the necessary cost and the last two parts mean the transmission cost.

4.1.1. Running Delay Quantification

Suppose that there are m smartphones, denoted by s p 1 , s p 2 , , s p m . For the arbitrary s p i (here 1 i m ), it includes n computation tasks, denoted by t a s k i 1 , t a s k i 2 , , t a s k i n . For the arbitrary t a s k i j (here 1 j n ), its size is denoted by s i j . In fact, the computation time of task at the smartphone depends on the task size and the handling capacity of CPU. Let p t i j denote the computation time of t a s k i j at s p i , and we have
p t i j = s i j c i ( 1 u c p u )
where c i is the handling capacity of s p i and u c p u is the CPU utilization rate of the smartphone. In this paper, we assume that all smartphones have the same CPU utilization rate. Furthermore, let u t i j and d t i j denote the upstream transmission time and the downstream transmission time, respectively, and we have
u t i j = i s i j b a w i , d t i j = o s i j b a w i
where i s i j is the data size in case of inputting t a s k i j to be transmitted via the upstream link; o s i j is the data size in case of returning the corresponding computation results via the downstream link; b a w i is the network bandwidth between s p i and edge computing server; here, we assume that upstream link and downstream link have the same network bandwidth.
Let t i j denote the total running delay of t a s k i j , and it is defined as follows:
t i j = p t i j + u t i j + d t i j
On this basis, the total running delay with respect to m smartphones and n tasks is defined as follows:
T = i = 1 m j = 1 n t i j
Mathematically, the single objective regarding the total running delay optimization is expressed as follows:
M i n i m i z e T

4.1.2. Energy Consumption Quantification

Consider the energy consumption generated from the smartphone, and it mainly depends on the power consumption. For the smartphone, the energy consumption modules usually include CPU and memory. Let d e i j denote the consumed energy when t a s k i j is performed at s p i , and we have
d e i j = p t i j u c p u λ c p u + p t i j u m e m λ m e m = p t i j ( u c p u λ c p u + u m e m λ m e m )
Among them, u m e m is the memory utilization rate of smartphone; λ c p u and λ m e m are the power consumption coefficients of CPU and memory, respectively. Similarly, we assume that all smartphones have the same memory utilization rate, the same CPU power consumption coefficient, and the same memory power consumption coefficient.
Consider the energy consumption generated from the task transmission, and it is usually positive correlation with the transmitted traffic [44,45]. Let t e i j denote the corresponding energy consumption when t a s k i j is transmitted to the edge computing server and the computation results are returned to s p i , and we have
t e i j = i s i j u t i j λ l i n k + o s i j d t i j λ l i n k
where λ l i n k is the energy consumption coefficient in case of data transmission.
Let e i j denote the total energy consumption of t a s k i j , and it is defined as follows:
e i j = t e i j + d e i j
On this basis, the total energy consumption with respect to m smartphones and n tasks is defined as follows:
E = i = 1 m j = 1 n e i j
Similarly, the single objective regarding the total energy consumption optimization is expressed as follows:
M i n i m i z e E
With the combination of running delay and energy consumption, the purpose of this paper is to minimize both T and E. However, T and E are not the order of magnitude; therefore, they need do standardization operation (such as max-min method [46]). Let T and E be the standardized results of T and E, respectively, and the total cost is defined as follows:
C o s t = α T + β E
where α and β are the weights of delay running and energy consumption respectively. Furthermore, the bi-objective optimization problem is expressed as follows:
M i n i m i z e C o s t

4.2. Scheduling Methodology

It is obvious that Equation (12) involves an NP-hard problem [47], which can be solved by the intelligent method. In this paper, we use the Bird Swarm Algorithm (BSA) [48,49] to optimize Equation (12), and the finally obtained location of bird population is regarded as the optimal scheduling strategy. Regarded BSA, it is a new bionic intelligence algorithm derived from the research of behaviors of bird swarm and proposed by Meng et al. [48] in 2015. For the convenience, the social behaviors of bird swarm are divided into three types, i.e., foraging behavior, vigilance behavior, and flight behavior. Let N denote the number of birds in the swarm and I m a x denote the total number of iterations to perform the swarm behaviors, and the location of the arbitrary bird b i (here 1 i N ) in the D-dimensional space at the I-th (here 1 I I m a x ) iteration is expressed as follows:
l i T = ( l i 1 T , l i 2 T , , l i D T )

4.2.1. Behavior Expression

The foraging of bird usually depends on the historical experience, and the individual’s location updating is expressed as follows:
l i j T + 1 = l i j T + ( o l i j b e s t l i j T ) ξ r a n d ( 0 , 1 ) + ( g l j l i j T ) γ r a n d ( 0 , 1 )
Among them, r a n d ( 0 , 1 ) is used to generate a random value between 0 and 1; o l i j b e s t is the best location regarding b i in the j-th dimension space; g l j is the best location regarding the whole swarm in the j-th dimension space; ξ is the cognitive accelerated coefficient; γ is the social accelerated coefficient.
During the process of flight, each bird tends to move towards the central position of swarm. In this way, it is inevitable to generate the competition relation among individuals, which hinders the continuous flight. Therefore, the bird needs to own the vigilance behavior. Under such condition, the individual’s location updating is expressed as follows:
l i j T + 1 = l i j T + A 1 ( a l j l i j T ) r a n d ( 0 , 1 ) + A 2 ( o l k j b e s t l i j T ) r a n d ( 1 , 1 )
A 1 = e x p p F i t i s u m F i t + ε N
A 2 = e x p p F i t i p F i t k | p F i t i p F i t k | + ε p F i t i s u m F i t + ε N
Among them, a l j is the average location of swarm in the j-th dimension space; p F i t i is the fitness value to which the best historical location of b i corresponds; s u m F i t is the sum of p F i t i for all birds; ε is used to avoid zero-division error; A 1 and A 2 are the generated indirect and direct influences from the natural environment, respectively, when the individual moves towards the central position of swarm. In particular, if p F i t i is larger than p F i t k , it means that b k faces more serious environment interference than b i .
The individual can be interfered by the other flying animals, thus some birds may fly to other places for the new life. Under such situation, some birds act as the producers and the remaining birds act as scroungers. For the two roles, the corresponding individual’s locations are updated as follows:
l i j T + 1 = l i j T + l i j T r a n d n ( 0 , 1 )
l i j T + 1 = l i j T + ( l k j T l i j T ) r r a n d ( 0 , 1 )
where r a n d n ( 0 , 1 ) is the Gaussian distribution where the average value is 0 and the standard deviation is 1, and r is the scrounger learning efficiency to follow the producer.

4.2.2. Solution

Although BSA shows good search ability, the global search ability is still limited, especially when handling the complex and large-scale multi-extremum optimization problems. Given this, this paper plans to improve the flight behavior of BSA. In terms of Equation (18), we improve it as follows:
l i j T + 1 = l i j T + r a n d n ( 0 , 1 )
It indicates that the location difference follows the Gaussian distribution, which is a random walk. It is obvious that such form satisfies the real flight behavior.
Based on the above statements, and the BSA-based edge computing strategy is described as follows.
Algorithm 1. The BSA-based edge computing strategy
01: Initialize BSA and all related parameters;
02: Optimize the flight behavior via Equation (20);
03: Put Equation (12) into BSA for computation;
04: For 1 I I m a x and 1 i N , do the following:
05:   If the current C o s t is larger than the previous one, then
06:    the location of b i keeps unchanged;
07:   Else
08:    The location of b i is replaced with the latest one;
09:   End If
10:  End For
11: Collect all best locations of swarm;
12: Return the corresponding C o s t as the scheduling strategy;

5. CNN-Based Data Training for Fall Detection

Before performing the CNN-based data training, the feature extraction of data is very significant because it derives the key information from the smartphone to classify the exact fall detection. In this paper, for each axis, the five features, i.e., minimum, mean, maximum, kurtosis, and skewness are extracted, and the principal component analysis is employed for this. The concrete method can be found in [50].

5.1. CNN Structure

The classical CNN structure is shown in Figure 2, which consists of input layer, convolution layer, pooling layer, fully connected layer, and output layer [51]. In addition, it also includes convolution, pooling, and full connection operations. Among them, the convolution layer is responsible for data feature extraction collected from smartphone, and it is composed of a group of convolution kernels, where the weight of convolution kernel is automatically updated by learning the objective function. The pooling layer is performed between convolution layers and its function is to reduce data dimension, which can effectively decrease the number of parameters and avoid the overfitting phenomenon. The fully connected layer is used to do the classification operation which converts the multi-dimensional vector from the convolution layer into the one-dimensional vector.
Furthermore, the intermediate actions (i.e., convolution, pooling and full connection) are regarded as nonlinear unit and batch normalization. The nonlinear unit is to do the nonlinear mapping for the results output from the convolution layer, which guarantees the the nonlinear function of the CNN approach to a large extent and improves the model’s express ability regarding features. The function of batch normalization is to transform the input data into the standard normal distribution in order to guarantee that the input value of nonlinear units remains in the interval with the relatively large gradient, which avoids the vanishing gradient problem and accelerates the convergence speed of data training.

5.2. CNN Computing

The nonlinear unit and batch normalization play the important roles during the process of CNN computing, including activation function, pooling function, classification function, and loss function.

5.2.1. Activation Function

This paper uses ReLU (Rectified Linear Unit), instead of sigmoid function and tanh function, due to the complex exponent arithmetic, as the activation function which owns the simple express but has a good effect of improving the computation efficiency due to the fact that it performs the linear computation. For the arbitrary neuron (CNN has several hidden layers and each hidden layer includes a number of neurons), denoted by n e u , let s ( n e u ) denote its activation state, and we define the activation function as follows:
s ( n e u ) = 0 , n e u 0 n e u , n e u > 0
where n e u is the stimulus value to which the neuron corresponds. Especially when n e u 0 , the neuron is not activated. In other words, when the stimulus intensity is larger than the given threshold, the neuron is activated. In this paper, the threshold is set as 0.

5.2.2. Pooling Function

We select Maxout function as the pooling function. As the fall detection needs the data with the relatively strong feature express, the Maxout function is suitable. Suppose that there are Q data features, denoted by x 1 , x 2 , , x Q , and we defined the Maxout function as follows:
f ( x ) = m a x { x i | 1 i Q }
Furthermore,
f ( x ) χ 1 Q i = 1 Q x i ,
indicates that the selected maximum is suitable and can be determined; otherwise, we reselect f ( x ) as follows:
f ( x ) : = m a x { x i | 1 i Q } f ( x )

5.2.3. Classification Function

We adopt Softmax function as the classification function (output function). For Q data features and m smarthones, we can obtain a vector V = ( V 1 , V 2 , , V m ) . For the arbitrary V i (here 1 i m ), we have
V i = w i 1 x 1 + w i 2 x 2 + + w i Q x Q
where w i j (here 1 j Q ) denotes the weight. On this basis, let y j denote the converted value of x j via the classification function, and it is defined as follows:
y j = e x p ( V j + b j )
where b j is the offset with respect to V j and y j is the exponential transformation with respect to V j and b j . Let y j ^ denote the probability to y j , and we have
y j ^ = y j j = 1 m y j
For Equation (22), we select the maximal y j ^ as the output result.

5.2.4. Loss Function

The loss function is expressed by the difference between real value and prediction value, and it is used to guarantee the training quality of CNN. In particular, the small loss function value means the high accuracy of fall detection. In this paper, we select cross entropy function as the loss function. Suppose that there are K data samples, and the loss function is defined as follows:
l o s s = 1 K k = 1 K [ y k l n y k ^ + ( 1 y k ) l n ( 1 y k ^ ) ]

6. Experiment Results

At first, we give two kinds of parameters settings, i.e., algorithm simulation parameters and CNN structure parameters. The former is shown in Table 1, and the latter is shown in Table 2.
Then, we introduce the fall detection’s dataset which includes 1000 older adults from four different scenarios (i.e., home, square, shopping mall, and street), where there are 600 males and 400 females, respectively, as shown in Table 3.
In addition, the edge computing server comes from Huawei’s 1288H V5 with Intel C622. In particular, all experiments scenarios are simulated by the Roblox software; this is because it is unrealistic to equip the smartphone for each older adult or collect the inherent fall data from their smartphones.
Furthermore, two latest and systematic research from [39,41] which integrate the most cutting-edge techniques are considered as baselines, called InfS and MeaM, respectively. Meanwhile, we test two kinds of experiments. At first, the performance of classification is verified via evaluating recall ratio, precision ratio, and F1 value; then, three metrics, i.e., accurate rate, transmission delay, and stability are used to evaluate the efficiency of strategy.

6.1. Classification Verification

The experimental results on recall ratio, precision ratio, and F1 value are shown in Table 4, where F1 value is defined as follows:
2 R e P r e R e + P r e
where R e and P r e are the recall ratio and precision ration, respectively.
We can find that EdCNN has the best recall ratio, precision ratio, and F1 value, followed by MeaM and InfS; this is because EdCNN comprehensively optimizes CNN via ReLU function, Maxout function, Softmax function, and cross entropy function. InfS only considers the boosted decision function to realize machine learning, which cannot reach the same classification effect with CNN, thus it has the worst classification result. Although both EdCNN and MeaM adopt CNN, MeaM does not make the systematic optimization while EdCNN presents the relatively optimal CNN structure (see Table 2) via the simulation experiments, thus MeaM has a worse classification effect than EdCNN.

6.2. Accurate Rate

The experimental results on accurate rate based on four different scenarios are shown in Table 5. We can find that EdCNN always all the highest accurate rate, followed by MeaM and InfS. There are two aspects of reasons. On one hand, EdCNN has the best classification effect. On the other hand, EdCNN uses BSA to optimize the trade-off between running delay and energy consumption, which guarantees that the obtained solution is relatively optimal. In addition, we can also find that it has the highest accurate rate in case of testing the home scenario; this is because such scenario has no external interference.

6.3. Transmission Delay

The experimental results on transmission delay based on four different scenarios are shown in Table 6. Similarly, we can find that EdCNN consumes the smallest transmission delay, followed by InfS and MeaM. At first, MeaM does not have the assistance via employing the networking paradigms. On the contrary, EdCNN and InfS use edge computing and cloud computing techniques, respectively, which solve the problem of limited storage resources and computation resources. As a result, MeaM spends the largest transmission delay. Then, for EdCNN and InfS, the proposed EdCNN shows two distinguished advantages. On one hand, it puts the computation tasks at the edge server, which is close to the users with smartphone, obtaining the small communication delay. On the other hand, it uses the SDN controller to collect the data from smartphone, which realizes the virtual data transmission with the relatively small delay. In summary, EdCNN takes smaller transmission delays than InfS.

6.4. Stability

In this section, we test the stability through doing the statistical testing based on Wilcoxon [52] according to 200 experiments, where the level of significance is set as 0.01. The testing results about two metrics (accurate rate and transmission delay) and three strategies (EdCNN, InfS and MeaM) are shown in Table 7, where the abnormal results mean that the relatively better strategy is the inferior position in terms of some simulation points. We can find that all corresponding p-values are smaller than the designated significance level 0.01, which indicates that the proposed EdCNN has better performance than InfS and MeaM. Furthermore, from the comprehensive evaluation perspective, the proposed EdCNN is stable and can be acceptable.

7. Conclusions

The remote monitoring of older adults and detecting dangers in the state of human health have become essential elements in smart cities. In terms of the three limitations of current fall detection strategies faced, i.e., (i) the data collection cannot reach the real-time level; (ii) the adopted detection methods cannot satisfy the enough stability, and (iii) the computation overhead of collection device is very high, this paper proposes a novel EdCNN to do fall detection, via leveraging CNN, SDN, and edge computing techniques.
Meanwhile, the global network view ability of SDN is used to collect the generated data from smartphone. In terms of edge computing scheduling on putting some computation tasks at the edge server, BSA is employed to solve the trade-off problem between running delay and energy consumption, which guarantees the relative optimal scheduling solution. In terms of CNN for data training, it is comprehensively optimized via ReLU function, Maxout function, Softmax function, and cross entropy function. In fact, these three sub-proposals guarantee to address the above-mentioned three limitations. To be specific, the SDN controller can ensure the real-time data collection; the enhanced CNN structure can make the stability; and the edge computing framework can decrease the computation overhead.
Finally, two kinds of simulation experiments are made. At first, the classification performance is verified via evaluating recall ratio, precision ratio, and F1 value, which can reach 98.26%, 97.87%, and 97.49%, respectively. Then, the whole performance is evaluated by testing accurate rate, transmission delay, and stability. In particular, the accurate rate and transmission delay can reach 99.01% and 19.261 ms, respectively, in case of a testing home scenario. The experimental results show that EdCNN outperforms two baselines.
However, as a novel method based on SDN, edge computing, and CNN, the proposed EdCNN also has some limitations. At first, we do not consider the application types, that is, the data division is not completed in the fine-grained way. Then, although CNN computing and edge computing decrease the communication delay, they introduce the computation overhead. Finally, the experiment environment is stalled at the simulation platform, irrespective of the real data collection from some persons. In the future, we plan to enhance the performance of EdCNN from two aspects. On one hand, we improve EdCNN around the above-mentioned three limitations. On the other hand, we improve BSA and reach much faster convergence. In addition, we will study the relevance of CNN in different domains and security issues like [53,54].

Author Contributions

Conceptualization, D.P. and H.L.; methodology, D.P.; software, D.Q.; validation, D.P., H.L., and Z.Z.; formal analysis, D.P.; investigation, D.P. and D.Q.; resources, Z.Z.; data curation, D.Q.; writing—original draft preparation, D.P.; writing—review and editing, D.P. and H.L.; supervision, H.L.; project administration, H.L. and Z.Z.; funding acquisition, H.L. and Z.Z. All authors have read and agreed to the published version of the manuscript.

Funding

This work is supported by the National High Technology Research and Development Program of China (863 Program) under Grant No. 2013AA01A215.

Conflicts of Interest

The authors declare no conflict of interest.

Abbreviations

The following abbreviations are used in this manuscript:
CNNConvolutional Neural Network
SDNSoftware-Defined Networking
IoTInternet of Things
BSABird Swarm Algorithm
ReLURectified Linear Unit
EdCNNThe Strategy in This Paper
InfSThe Baseline Strategy in [39]
MeaMThe Baseline Strategy in [41]

References

  1. Quijano-Sanchez, L.; Cantador, I.; Cortes-Cediel, M.E.; Gil, O. Recommender systems for for smart cities. Inf. Syst. 2020, 92, 1–22. [Google Scholar] [CrossRef]
  2. Ismagilova, E.; Hughes, L.; Dwivedi, Y.K.; Raman, K.R. Smart cities: Advances in research—An information systems perspective. Int. J. Inf. Manag. 2019, 47, 88–100. [Google Scholar] [CrossRef]
  3. Khan, S.S.; Hoey, J. Review of fall detection techniques: A data availability perspective. Med. Eng. Phys. 2017, 39, 12–22. [Google Scholar] [CrossRef] [PubMed] [Green Version]
  4. Bian, Z.; Chau, L.; Thalmann, N.M. Fall detection based on skeleton extraction. In Proceedings of the 11th ACM SIGGRAPH International Conference on Virtual-Reality Continuum and Its Applications in Industry, Hong Kong, China, 11–12 December 2012; pp. 91–94. [Google Scholar]
  5. Guttler, J.; Bittner, A.; Langosch, K.; Bock, T.; Mitsukura, Y. Development of an affordable and easy-to-install fall detection system. IEEJ Trans. Electr. Electron. Eng. 2018, 13, 664–670. [Google Scholar] [CrossRef] [Green Version]
  6. Zhao, T.; Liu, Q.; Chen, C. QoE in video transmission: A user experience-driven strategy. IEEE Commun. Surv. Tutor. 2017, 19, 285–302. [Google Scholar] [CrossRef]
  7. Cai, W.; Qiu, L.; Li, W.; Yu, J.; W, L. Practical fall detection algorithm based on adaboost. In Proceedings of the 2019 4th International Conference on Biomedical Signal and Image Processing, Chengdu, China, 13–15 August 2019; pp. 117–121. [Google Scholar]
  8. Ren, L.; Peng, Y. Research of fall detection and fall prevention technologies: A systematic review. IEEE Access 2019, 7, 77702–77722. [Google Scholar] [CrossRef]
  9. Md, M.P. The promise of smartphone fall detection solutions for falls in older adults. J. Am. Geriatr. Soc. 2015, 63, 1969–1970. [Google Scholar]
  10. Taleb, T.; Samdanis, K.; Mada, B.; Flinck, H.; Dutta, S.; Sabella, D. On multi-access edge computing: A survey of the emerging 5G network edge cloud architecture and orchestration. IEEE Commun. Surv. Tutor. 2017, 19, 1657–1681. [Google Scholar] [CrossRef] [Green Version]
  11. Wang, X.; Han, Y.; Leung, V.C.M.; Niyato, D.; Yan, X.; Chen, X. Convergence of edge computing and deep learning: A comprehensive survey. IEEE Commun. Surv. Tutor. 2020, 22, 869–904. [Google Scholar] [CrossRef] [Green Version]
  12. Porambage, P.; Okwuibe, J.; Liyanage, M.; Ylianttila, M.; Taleb, T. Survey on multi-access edge computing for Internet of things realization. IEEE Commun. Surv. Tutor. 2018, 20, 2961–2991. [Google Scholar] [CrossRef] [Green Version]
  13. Igual, R.; Medrano, C.; Plaza, I. Challenges, issues and trends in fall detection systems. BioMed. Eng. Online 2013, 12, 1–24. [Google Scholar] [CrossRef] [Green Version]
  14. Ward, G.; Holliday, N.; Fielden, S.; Williams, S. Fall detectors: A review of the literature. J. Assist. Technol. 2012, 6, 202–215. [Google Scholar] [CrossRef] [Green Version]
  15. El-Bendary, N.; Tan, Q.; Pivot, F.C.; Lam, A. Fall detection and prevention for the elderly: A review of trends and challenges. Int. J. Smart Sens. Intell. Syst. 2013, 6, 1230–1266. [Google Scholar] [CrossRef] [Green Version]
  16. Kulkarni, S.; Basu, M. A review on wearable tri-axial accelerometer based fall detectors. Int. J. Biomed. Eng. Technol. 2013, 1, 36–39. [Google Scholar]
  17. Patsadu, O.; Nukoolkit, C.; Watanapa, B. Survey of smart technologies for fall motion detection: Techniques, algorithms and tools. In Proceedings of the International Conference on Advances in Information Technology, Bangkok, Thailand, 6–7 December 2012; pp. 137–147. [Google Scholar]
  18. Chaudhuri, S.; Thompson, H.; Demiris, G. Fall detection devices and their use with older adults: A systematic review. J. Geriatr. Phys. Ther. 2014, 37, 178–196. [Google Scholar] [CrossRef] [PubMed] [Green Version]
  19. Hegde, R.; Sudarshan, B.; Kumar, S.P.; Hariprasad, S.A.; Satyanarayana, B.S. Technical advances in fall detection system: A review. Int. J. Comput. Sci. Mob. Comput. 2013, 2, 152–160. [Google Scholar]
  20. Spasova, V.; Iliev, I. A survey on automatic fall detection in the context of ambient assisted living systems. Int. J. Adv. Comput. Res. 2014, 4, 94–109. [Google Scholar]
  21. Yajai, A.; Rasmequan, S. Adaptive directional bounding box from RGB-D information for improving fall detection. J. Vis. Commun. Image Represent. 2017, 49, 257–273. [Google Scholar] [CrossRef]
  22. Fan, Y.; Levine, M.D.; Wen, G.; Qiu, S. A deep neural network for real-time detection of falling humans in naturally occurring scenes. Neurocomputing 2017, 260, 43–58. [Google Scholar] [CrossRef]
  23. Hakim, A.L.; Huq, M.S.; Shanta, S.; Ibrahim, B.S.K.K. Smartphone based data mining for fall detection: Analysis and design. Procedia Comput. Sci. 2017, 105, 46–51. [Google Scholar] [CrossRef]
  24. Casilari, E.; Santoyo-Ramon, J.A.; Cano-Garcia, J.M. UMAFall: A multisensor dataset for the research on automatic fall detection. Procedia Comput. Sci. 2017, 110, 32–39. [Google Scholar] [CrossRef]
  25. Gia, T.N.; Sarker, V.K.; Tcarenko, I.; Rahmani, A.M.; Westerlund, T.; Liljeberg, P.; Tenhunen, H. Energy efficient wearable sensor node for IoT-based fall detection systems. Microprocess. Microsyst. 2018, 56, 34–46. [Google Scholar]
  26. Adnan, S.M.; Irtaza, A.; Aziz, S.; Sumair, U.M.; Obaid, J.; Ali, M.; Muhammad, T. Fall detection through acoustic local ternary patterns. Appl. Acoust. 2018, 140, 296–300. [Google Scholar] [CrossRef]
  27. Mastorakis, G.; Ellis, T.; Makris, D. Fall detection without people: A simulation approach tackling video data scarcity. Expert Syst. Appl. 2018, 112, 125–137. [Google Scholar] [CrossRef] [Green Version]
  28. Er, P.V.; Tan, K.K. Non-intrusive fall detection monitoring for the elderly based on fuzzy logic. Measurement 2018, 124, 91–102. [Google Scholar] [CrossRef]
  29. Mazurek, P.; Wagner, J.; Morawski, R.Z. Use of kinematic and mel-cepstrum-related features for fall detection based on data from infrared depth sensors. Biomed. Signal Process. Control 2018, 40, 102–110. [Google Scholar] [CrossRef]
  30. Wu, Y.; Su, Y.; Feng, R.; Yu, N.; Zang, X. Wearable-sensor-based pre-impact fall detection system with a hierarchical classifier. Measurement 2019, 140, 283–292. [Google Scholar] [CrossRef]
  31. Kong, Y.; Huang, J.; Huang, S.; Wei, Z.; Wang, S. Learning spatiotemporal representations for human fall detection in surveillance video. J. Vis. Commun. Image Represent. 2019, 59, 215–230. [Google Scholar] [CrossRef]
  32. Geertsema, E.E.; Visser, G.H.; Viergever, M.A.; Kalitzin, S.N. Automated remote fall detection using impact features from video and audio. J. Biomech. 2019, 88, 25–32. [Google Scholar] [CrossRef]
  33. Espinosa, R.; Ponce, H.; Gutierrez, S.; Martinez-Villaseor, L.; Moya-Albor, E. A vision-based approach for fall detection using multiple cameras and convolutional neural networks: A case study using the UP-Fall detection dataset. Comput. Biol. Med. 2019, 115, 1–10. [Google Scholar] [CrossRef]
  34. Torti, E.; Fontanellaa, A.; Musci, M.; Blago, N.; Pau, D.; Leporati, F.; Piastra, M. Embedding recurrent neural networks in wearable systems for real-time fall detection. Microprocess. Microsyst. 2019, 71, 1–10. [Google Scholar] [CrossRef]
  35. Boutellaa, E.; Kerdjidj, O.; Ghanem, K. Covariance matrix based fall detection from multiple wearable sensors. J. Biomed. Inform. 2019, 94, 1–6. [Google Scholar] [CrossRef] [PubMed]
  36. Chen, L.; Li, R.; Zhang, H.; Tian, L.; Chen, N. Intelligent fall detection method based on accelerometer data from a wrist-worn smart watch. Measurement 2019, 140, 215–226. [Google Scholar] [CrossRef]
  37. Chen, Y.; Xiao, F.; Huang, H.; Sun, L. RF-IDH: An intelligent fall detection system for hemodialysis patients via COTS RFID. Future Gener. Comput. Syst. 2020, 113, 13–24. [Google Scholar] [CrossRef]
  38. Sarabia-Jacome, D.; Usach, R.; Palau, C.E.; Esteve, M. Highly-efficient fog-based deep learning AAL fall detection system. Internet Things 2020, 11, 1–19. [Google Scholar] [CrossRef]
  39. Mrozek, D.; Koczur, A.; Malysiak-Mrozek, B. Fall detection in older adults with mobile IoT devices and machine learning in the cloud and on the edge. Inf. Sci. 2020, 537, 132–147. [Google Scholar] [CrossRef]
  40. Nooruddin, S.; Islam, M.M.; Sharna, F.A. An IoT based device-type invariant fall detection system. Internet Things 2020, 9, 1–18. [Google Scholar] [CrossRef]
  41. Alarififi, A.; Alwadain, A. Killer heuristic optimized convolution neural network-based fall detection with wearable IoT sensor devices. Measurement 2021, 167, 1–10. [Google Scholar] [CrossRef]
  42. Muthanna, A.; Khakimov, A.; Gudkova, I.; Paramonov, A.; Kirichek, R. OpenFlow switch buffer configuration method. In Proceedings of the International Conference on Future Networks and Distributed Systems, Cambridge, UK, 19–20 July 2017; pp. 1–5. [Google Scholar]
  43. Naous, J.; Erickson, D.; Covington, G.A.; Appenzeller, G.; McKeown, N. Implementing an OpenFlow switch on the NetFPGA platform. In Proceedings of the 4th ACM/IEEE Symposium on Architectures for Networking and Communications Systems, San Jose, CA, USA, 18–20 November 2008; pp. 1–9. [Google Scholar]
  44. Kansal, A.; Zhao, F.; Liu, J.; Kothari, N. Virtual machine power metering and provisioning. In Proceedings of the ACM International Symposium on Computer Architecture, Saint-Malo, France, 19–23 June 2010; pp. 326–337. [Google Scholar]
  45. Wang, X.; Lv, J.; Huang, M.; Li, K.; Li, J.; Ren, K. Energy-efficient ICN routing mechanism with QoS support. Comput. Netw. 2018, 131, 38–51. [Google Scholar] [CrossRef]
  46. Wang, W.; Sun, B.; Li, H.; Sun, Q.; Wennersten, R. An improved min-max power dispatching method for integration of variable renewable energy. Appl. Energy 2020, 276, 1–13. [Google Scholar] [CrossRef]
  47. Goderbauer, S.; Comis, M.; Willamowski, F.J.L. The synthesis problem of decentralized energy systems is strongly NP-hard. Comput. Chem. Eng. 2019, 124, 343–349. [Google Scholar] [CrossRef]
  48. Meng, X.; Gao, X.; Lu, L.; Liu, Y.; Zhang, H. A new bio-inspired optimisation algorithm: Bird swarm algorithm. J. Exp. Theor. Artif. Intell. 2016, 28, 673–687. [Google Scholar] [CrossRef]
  49. Yang, H.; Chen, T.; Huang, N. An adaptive bird swarm algorithm with irregular random flight and its application. J. Comput. Sci. 2019, 35, 57–65. [Google Scholar] [CrossRef]
  50. Ethem, A. Introduction to Machine Learning; The MIT Press: London, UK, 2010; pp. 110–112. [Google Scholar]
  51. Ban, Y. Software-defined information-centric networking based exercise intensity evaluation of volleyball player: An efficient convolutional neural network method. Internet Technol. Lett. 2020, in press. [Google Scholar] [CrossRef]
  52. Lv, J.; Wang, X.; Huang, M. A smart ACO-inspired named data networking forwarding scheme with clustering analysis. Trans. Emerg. Telecommun. Technol. 2018, 29, 1–16. [Google Scholar] [CrossRef]
  53. Moscato, V.; Picariello, A.; Sperli, G. An emotional recommender system for music. IEEE Intell. Syst. 2020, in press. [Google Scholar] [CrossRef]
  54. Albanese, M.; Erbacher, R.F.; Jajodia, S.; Molinaro, C.; Persia, F.; Picariello, A.; Sperli, G.; Subrahmanian, V.S. Recognizing unexplained behavior in network traffic. In Network Science and Cybersecurity; Springer: Berlin/Heidelberg, Germany, 2013; pp. 39–62. [Google Scholar]
Figure 1. The system framework of EdCNN.
Electronics 09 01780 g001
Figure 2. The classical CNN structure.
Electronics 09 01780 g002
Table 1. The algorithm simulation parameters.
ParameterSettingMeaning
K100The number of data samples
m1000The number of smartphones
N60The number of birds
I m a x 100The maximal number of iterations
α 0.45The weight of running delay
β 0.55The weight of energy consumption
ξ 1.5The cognitive accelerated coefficient
γ 1The social accelerated coefficient
Table 2. The detailed CNN structure parameters.
Input LayerConvolution LayerPooling LayerFully Connected LayerOutput Layer
16 × 16 20 × 3 × 3 2 × 2 256 × 25 × 4 × 4 1 × 1000
Table 3. The dataset with 1000 older adults.
Scenario#Older Adults#Males#FemalsAver. AgeAver. Weight (kg)Ave. Height (cm)
Home25015010065.248.92160.31
Square25015010068.650.08162.17
Shopping mall25015010064.752.63161.38
Street25015010062.3954.92162.61
Table 4. The experimental results on classification verification.
StrategyRecall RatioPrecision RatioF1 Value
EdCNN0.98260.97490.9787
InfS0.87560.90580.8904
MeaM0.92450.93210.9283
Table 5. The experimental results on the accurate rate.
StrategyHomeSquareShopping MallStreet
EdCNN0.99010.97230.96770.9738
InfS0.88140.85230.87450.8706
MeaM0.92290.90570.91360.9082
Table 6. The experimental results on transmission delay (ms).
StrategyHomeSquareShopping MallStreet
EdCNN19.26120.10920.64119.865
InfS26.70527.91326.95528.037
MeaM49.53951.38451.62750.615
Table 7. The statistical testing based on Wilcoxon.
ComparisonAbnormal Number R + R p-Value
Accurate Rate
EdCNN-InfS919190.00163
EdCNN-MeaM14186140.00207
Transmission Delay
EdCNN-InfS10101900.00192
EdCNN-MeaM881920.00118
Publisher’s Note: MDPI stays neutral with regard to jurisdictional claims in published maps and institutional affiliations.

