1. Introduction
Environmental issues, energy independence, and the high costs of fossil fuels have motivated the use and development of renewable and sustainable energy technologies [
1,
2]. The EU aims to achieve a 20% share of renewable energy sources in final energy consumption by the end of 2020 [
1]. Grid-connected photovoltaic systems have become the best alternative for renewable energy on both a small and large scale [
3]. One of the most challenging implementations of photovoltaic systems is their integration into buildings. In 2018, according to REN21 [
4], the worldwide photovoltaic (PV) system market achieved 505 GW of total power around the world. Similarly, the deployment of PV roofs aimed at generation has increased significantly in recent years, and it is expected that backup systems will also do the same. According to the International Energy Agency, in 2018 the added capacity of PV systems used to supply electricity to the grid reached 43 GW of power [
5]. Since Law 1715 in 2014 [
6], the Colombian renewable energy market (mainly in the PV sector) has developed a strong demand for regulations that allow the sale of surplus energy to the national grid, such as Colombian Government Regulation CREG 030 in 2018 [
7]. In addition to the measures aimed at achieving the objectives of sustainable development, it has also increased the interest of universities in implementing institutional programs for sustainable campuses, in order to focus their efforts on a shared purpose between training, research, and community outreach.
The University Autónoma of Occidente has adopted the sustainable campus model, participating in the University of Indonesia’s GreenMetric World University Ranking, which assesses the environmental sustainability of higher education institutions worldwide [
8]. Currently, the University Autónoma of Occidente is the most sustainable university in the country, and the 42nd worldwide. Among the aspects that the ranking evaluates, Environment and Infrastructure, Energy and Climate Change, Waste, Water, Transport, and Education, stand out. Under the energy and climate change concept, it sets out mechanisms for the incorporation of PV systems for energy self-consumption and as a complement to the use of electricity from conventional power grids. The PV system installed on the university campus has the power of 400 kWp, distributed on the roofs of the buildings and the parking of the campus. (
Figure 1). This study analyzes the performance of the PV system and its integration within the buildings of the university campus.
Grid-connected building integrated photovoltaic systems (BIPV) projects have been developed in several countries and their efficiency has been monitored. Diverse BIPV system studies have been carried out, as well as simulations. Elbaset et al. analyzed the steady state performance of a grid-connected PV system at different solar radiations using a system proposed through MATLAB software (Simulink) [
9]. Pelle et al., showed the experimental characterization under standard test conditions of two-colored BIPV modules that focused on the oriental aesthetics, energy and technological integration of the BIPV systems, which also connected to energy grids for flexible energy construction [
10]. Marion et al. studied the next parameters: final performance of the PV system, reference yield, performance ratio, and Photovoltaics for Utility Scale Applications (PVUSA) rating, which define the overall performance of a PV system versus energy production, solar resources, and the overall effect of system losses [
11]. Sundaramoorthy et al. studied the performance of PV modules under tests designed by the IEC and test protocols modified by the PMVC, in order to provide reliability over the lifetime of the modules. [
12]. Swain et al. analyzed the performance of 5 PV module technologies (monocrystalline mc-Si, polycrystalline pc-Si, cadmium telluride CdTe, copper indium gallium selenide CIGS, and amorphous silicon a-Si) characterized in different environmental conditions for India, by MATLAB software. CIGS was shown to operate at its best efficiency at 60 °C, 60% Relative Humidity, while CdTe operates at its best efficiency at 85 °C, 85% RH [
13]. Nallapaneni et al. developed the simulated performance of a 100 kWp PV system in order to evaluate its feasibility to supply energy to an educational institute. The simulation was carried out by the PVsyst V6.52 software, using meteorological data from Meteonorm 7.1. Parameters of energy production by the PV generator, energy supplied to the grid, performance ratios, and other standardized energy outputs per kWp installed were evaluated [
14]. Pandey et al. conducted a review of Photovoltaic (PV) System including current and future developments, and potential applications in the existing scenario, where BIPV, concentrated photovoltaics (CPV) and thermal photovoltaics (PV/T) are also considered [
15].
Furthermore, a number of PV projects and the evaluation of their energy performance over the years are also reported. Pietruszko and Bialecki studied the performance of a 1 kW grid-connected PV system installed in a school in Poland, in accordance with the guidelines of IEC 61724 standard, over a period of three years [
16]. Chicco et al. researched the performance of PV systems connected to the grid through parallel inverters, the energy production, and the levels of harmonic distortion caused by integrating several inverters in a PV installation of different dimensions [
17]. Pietruszko et al. investigated the monitoring system of a 1 kW PV system made up of 20 modules, installed eight years ago in a school, integrated by a set of meteorological and electrical sensors connected to the computer-compatible Sunny Boy Plus Controller [
18]. De Lima et al. analyzed the performance of a 2.2 kWp PV system at the State University of Ceará, Brazil. Over the three-years analyzed, the performance ratio and capacity factor were 82.9% and 19.2%, respectively. These figures show how much better the performance of PV systems installed in the northeast region of Brazil were [
19]. Sharma and Goel studied the performance of 11.2 kWp PV installed at Siksha ‘O’Anusandhan University, Bhubaneswar, analyzing parameters such as PV module efficiency, array yield, final performance, inverter efficiency, and system performance ratio, which found that PV module efficiency, inverter efficiency, and system performance ratios were 13.42%, 89.83% and 0.78%, respectively [
20]. Bayer et al. [
21] showed the practical experiences from ten representative companies of the German electricity supply system, in which the conclusions displayed the importance of taking measures in the face of network expansion to ensure compliance with the permissible voltage and current limits when PVSs are installed. Al-Sabounchi et al. [
22] evaluated the performance of a pilot BIPV system, with 36 kWp power, at the 0.4 kV level of the Abu Dhabi electricity supply grid. The evaluation showed that the deposition of dust on the glazing of the PV modules caused severe degradation of the performance of the PV system. Serraino et al. suggested the optimization of different types of power plants and flexible generation systems to guarantee different levels of comfort and Index Air Quality IAQ during various periods of the day and in several areas of a building [
23].
Boonmee et al. [
24] studied the performance of a 5 kWp power BIPV System with amorphous silicon panels, installed at Rajamangala Suvarnabhumi University of Technology, Nonthaburi, Thailand. They used a monitoring system, in order to acquire data of the system performance without having to disconnect the panels.
De Azevedo et al. [
25] proposes a model to evaluate the energy performance in PV systems, and proposes six different types of BIPV system technologies. Chokmaviroj et al. [
26] showed the results of eight months of monitoring in a 500 kWp PV project, located in a province in Thailand. The evaluated parameters included the energy generated by the system, the efficiency of the PV array, the efficiency of the inverter, the final energy production of the plant, and the performance ratio. Sasitharanuwat et al. [
27] described the design and testing of a 10 kWp PV system, designed to be used as part of a microgrid within a building installation in Thailand. The energy production parameters and performance of different types of PV cell technology, including amorphous, polycrystalline, and hybrid (HIT), were analyzed. Jung Hun So et al. [
28] carried out measurements of PV system performance by collecting actual production data, combined with estimated production data by computer models. The results showed that it is highly valuable to perform site-specific evaluations and analyses of PV technology. Aristizabal and Gordillo [
29] studied a PV system in Bogotá, Colombia. Electrical and environmental data defined by international standards were obtained to evaluate the performance of PV systems. Boonmee et al. [
24] reported on the importance of the BIPV system as an important and promising application towards worldwide energy integration. They also highlight in their report the importance of monitoring the electrical and environmental parameters of installations and storing them for further processing. Results are presented for a 5 kWp PV installation implemented at a university in Thailand. Notton et al. [
30] carried out a methodology of optimal dimension for different types of PV cell technologies, inverters, orientations, and inclinations for different locations in France and Bulgaria. Wittkopf et al. [
31] showed the energy performance results of a zero energy building (ZEB) during the first 18 months of operation. The performance results were obtained following the normative guidelines of the IEC 61724 standard, which allows the evaluation of the energy results of the use of the BIPV system, based on the electrical and environmental parameters obtained with the monitoring system of the PV system in the building. Al-Sabounchi et al. [
27] evaluates the performance of a 36 kWp pilot BIPV system, measuring all energy performance parameters, including those related to weather conditions, in Abu Dhabi. One of the most critical issues in the assessment is dust deposition on the glass surface of the module, having a major impact on the energy production of the system. Drif et al. [
32] showed a BIPV system study at a University in Spain, demonstrating the performance of the system according to the climate conditions combined with the results obtained by simulation software, in order to estimate the energy production. Conclusions are presented regarding the importance of integrating PV systems into existing buildings, as part of strategies to reduce GreenHouse Gas emissions. Prieto et al. [
33] brought up the need to carry out the monitoring of PV systems in order to improve maintenance and safety conditions. However, these activities should be carried out at a much more detailed level so that it is possible to understand what actually happens in them. For this purpose, they raise the importance of wireless sensor networks as a way of collecting real-time data, in order to develop decision-making strategies to prevent failures and increase efficiency and reliability.
2. Case Study
The University has included the concept of sustainability as a distinctive factor in the capacity of higher education institutions, as part of its academic training, research, and social impact. As a result, it has managed to become an important agent of change, facing the current challenges of: climate change; proposing cleaner energy systems; water and soil conservation; waste recycling; and sustainable transportion. Therefore, it has focused its efforts on becoming the first sustainable campus in the country, which has been achieved in the last three years (2017, 2018 and 2019). Within the criteria evaluated, the generation of electrical energy and the reduction of carbon emissions has promoted the implementation of a grid-connected PV system on the roofs of the university campus. The case study is framed in the international standard IEC 61724:1998.
The primary energy resource to cover the demand in the buildings at the campus corresponds to electricity and gas. In the university campus, this demand does not only belong to the Heat Ventilation Air Conditioning HVAC system, it also covers the other operational demands of the building: lighting, computer and office equipment, laboratories, audiovisual equipment, etc.
In addition, it is important to point out that energy consumption does not only consider the cost of energy, it also includes environmental aspects relating to Carbon emissions.
The integration of a grid-connected PV system was considered as part of the strategy to reduce energy consumption from the grid and to reduce the environmental impact. The PV system supplies some of the demand to the university campus, and the modules are installed on the roof of the buildings and parking, avoiding additional infrastructure.
It also proposes a methodology for the monitoring and evaluation of the energy efficiency of grid-connected PV systems (GCPVS), in order to verify the technical feasibility of implementing this type of system in urban conditions and integrated into buildings.
The Autónoma de Occidente University is located in Cali (3°21′ N, 76°31′ W) in southwestern Colombia. It is at 1018 m altitude.
Table 1 shows the global radiation and average temperature conditions in Cali.
In Colombia, the current regulatory framework is based on Law 1715 of 2014, which opens up the integration of renewable energies into the traditional energy mix, i.e., electricity generation systems fed by renewable resources: solar energy, wind energy, biomass energy, water energy and geothermal energy. All of these can be integrated together with traditional resources (hydraulic energy and thermoelectric power), which will allow the development of renewable technologies in the country, thus expanding the supply of renewable energy systems.
On the other hand, resolution CREG 030, 2018, establishes the guidelines for regulating the electricity market, in order to integrate electricity generation systems through the use of non-conventional renewable energy sources.
The successful implementation of international standards becomes the benchmark to develop, so that a test protocol can be developed in order to help determine the energy efficiency of PV systems.
For photovoltaic energy, one of the issues concerning the PV system is the reduction of the electrical power of the PV system due to its temperature. The increase of the temperature reduces the performance of the PV panel by 0.3–0.5%, per °C above the nominal operation cell temperature (NOCT).
Below, there is a detailed overview of the university’s PV system in two stages:
2.1. PV System—Stage 1
Figure 2 shows the PV systems and the electrical setup. In this area, 188 photovoltaic modules of 240 Wp are available. These modules are connected to two inverters each with a nominal power of 20 kW. This PV system has an installed power of 45.12 kWp. The 188 modules will be divided into two sections, each with 94 modules. Every section is made up of five groups with 10 modules connected in series of four groups with 11 modules connected in series.
Figure 3 shows a picture of the PV systems and the electrical configuration. This area will have 225 PV modules distributed in two sections: one section with 110 modules of 240 Wp and another one with 115 modules of 230 Wp. These PV modules will be connected to two inverters, each with a nominal power of 24 kW. This parking has an installed power of 52.85 kWp.
Figure 4 shows the PV systems and their electrical configuration in the administration building. This area has 230 PV modules of 230 Wp, with a total installed power of 52.85 kWp. Additionally, these PV modules are connected to two inverters, each with a nominal power of 24 kWp.
2.2. PV System—Stage 2
Stage 2 covers the areas of the educational buildings and the canteen. Each building has 144 modules of 270 Wp, with two inverters of 17.5 kW at a voltage of 480 Vac. In total, the classroom buildings area have 155.52 kWp. The canteen has 342 modules, 270 Wp in total. Four inverters of 24 kW at a voltage of 480 Vac are used in this area, reaching a total of 92.8 kWp. The Stage 2 area has 248 kWp (
Figure 5 and
Figure 6).
3. Methodology for Monitoring and Energy Analysis of Grid-Connected PV Systems
To evaluate the energy efficiency of the grid-connected PV system, the methodology established in the IEC 61724 standard is applied. [
15] This standard includes several performance indicators connected to the energy production of the PV system. Below, the diagram of parameters to be measured for the grid-connected PV system is presented (
Figure 7).
Where the measured parameters are divided as
Table 2:
Using the measured parameters shown in
Table 2, the energy efficiency indicators of the PV system are determined. The most relevant parameters for determining the energy efficiency of the PV system are: the final yield of the PV system (
), the reference yield (
) and the performance ratio (
).
The final yield of the PV system corresponds to all the energy exported to the grid from the PV system (
) divided by the nominal power of the generator. This parameter provides the amount of hours that the PV system needs to operate at its nominal power to deliver the same equivalent AC energy to the grid. Another equivalent way of assessing final yield is (1):
On the other hand, the reference yield corresponds to the irradiation of the PV system in the tilt zone divided by the irradiation at standard test conditions (STC). This parameter corresponds to the number of peak hours of sunshine (2):
Finally, the dimensionless parameter performance ratio (
PR) determines the impact of the losses on all energy produced by the PV system. This means: inverter losses, temperature losses in the PV cells, connection losses, blocking diode losses in the modules, mismatch losses, losses due to shading and dirt (3):
The PV system connected to the grid of the university campus includes seven building roofs plus two parking lots of the university campus. On these roofs, 20 PV subfields are installed, which have various inclinations and orientations (see
Figure 1).
Table 3 shows the measurement parameters used to evaluate the energy efficiency of the PV system.
In view of this situation, it was decided to implement a single weather station to carry out the survey of environmental information (ambient temperature, PV module temperature, solar radiation and wind speed) and to carry out the performance evaluation of a system with an installed power of 400 kWp. The station used corresponds to the reference PVmet 200, below are the parameters and specifications of the weather station used in the project.
The sampling data from both the weather station and the energy meters correspond to an acquisition frequency of every 15 min. The technical characteristics of the installed equipment are specified in
Table 3b,c.
Table 4 shows the performance parameters for the PV system:
where:
: The horizontal radiation on the collector’s surface (kWh/m2·month);
: standard radiation (1 kWh/m2);
: energy supplied by PV System in AC;
: peak power of PV system;
: energy supplied by PV system in DC;
: PV area. The values obtained from the analysis of energy efficiency for the two stages of the project are presented in both
Table 5 and
Table 6:
4. Analysis and Results
Below are the last four months of analysis of one of the subsystems of the PV System (Carport North), in order to present and discuss the environmental data obtained, and its impact on the energy production of the PV system.
Table 7 shows data for the time period from August to November for one of the University’s PV subsystems (North Carport), used to analyze the performance of the system.
From the data acquired from the subsystem, a detailed analysis is presented for four standard days over four months (August, September, October and November) showing particular performances of irradiance and temperature.
Figure 8 shows the trend between the solar irradiance, temperature and energy production graphs on 3 August. In addition, the region where the PV system is installed shows clearly an increase in the temperature. In this season (August), there is a dry season marked by a dry tropical summer, high temperatures, and cloudless skies, whereby the radiation reaches a maximum value of over 900 W/m
2 at midday. The energy generated by this PV, on this day, is its maximum.
Figure 9 shows a sunny and quite clear day, the graph of irradiation has very high values (close to 1000 W/m
2) reaching its maximum value at 11:00 a.m. (35 kWh, 30 °C and 1000 W/m
2). On the temperature graph, it is shown that the highest temperature is reached at 2:00 p.m. (35 °C); therefore, the energy production goes down.
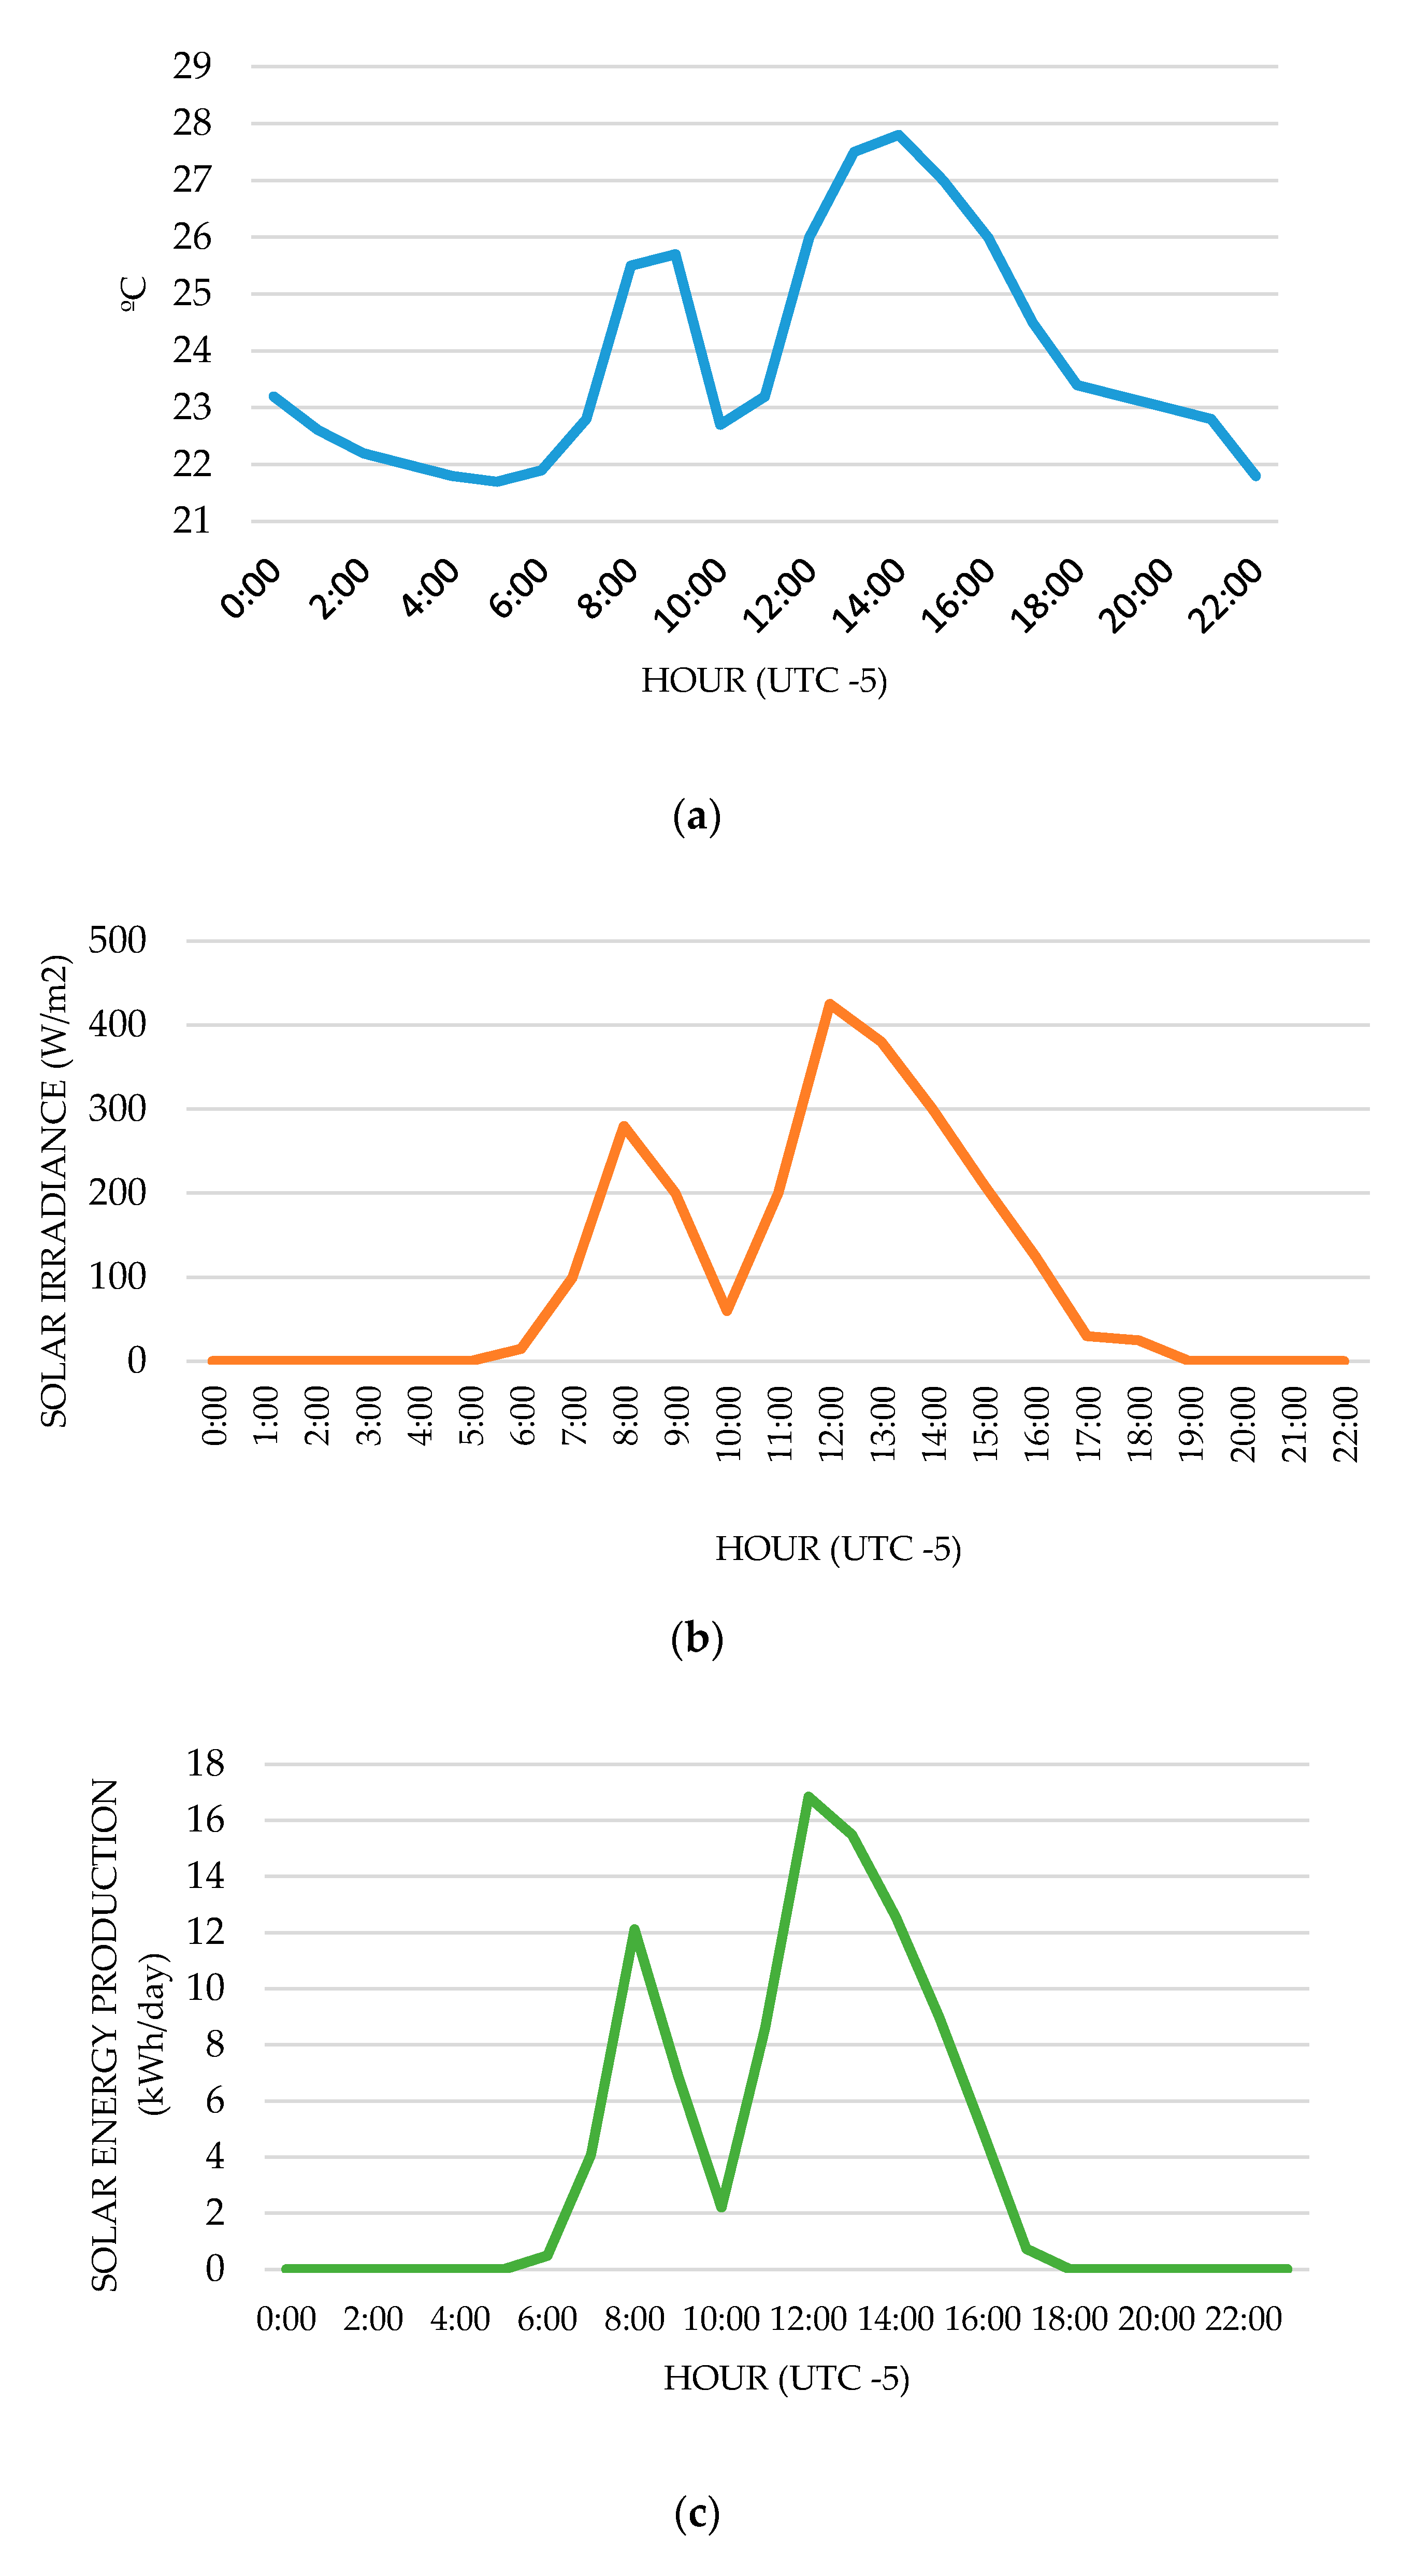
According to
Figure 10, the day was cloudy. The energy production reached a peak of 16 kWh, at 26 °C and 425 W/m
2. In addition, all three graphs show important fluctuations, suggesting the presence of rain between 9:00 a.m. to 10:00 a.m., due to a decrease in temperature during this period and a very low value of irradiation at 10:00 a.m.
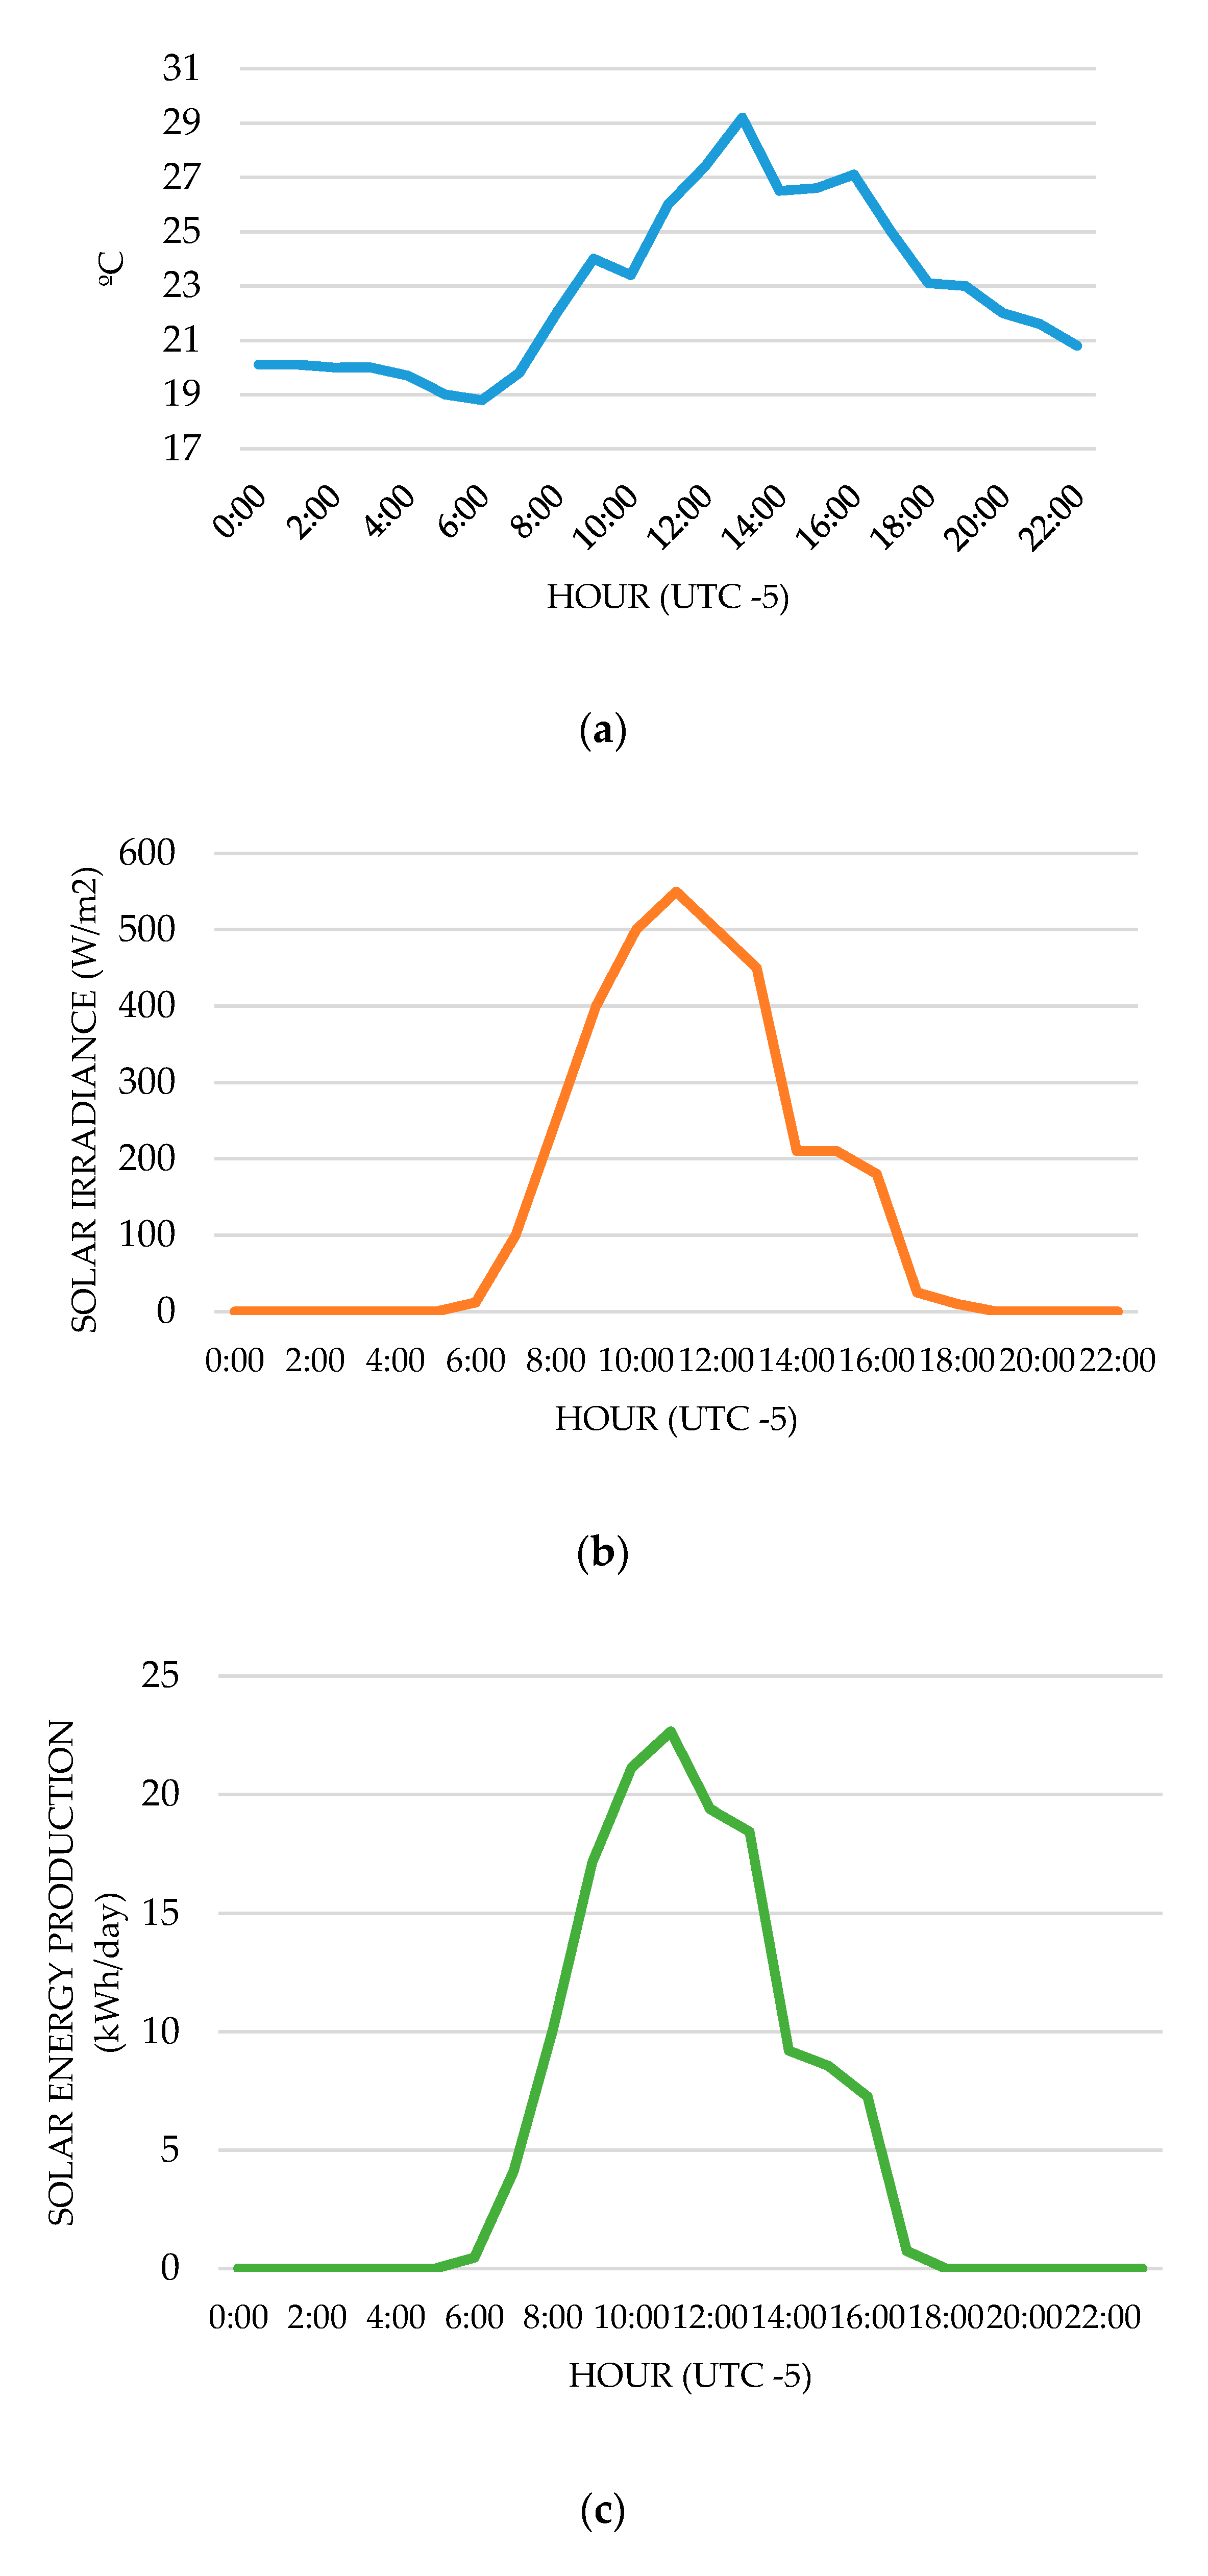
Finally, according to
Figure 11, the irradiance and electricity production on November was quite low. Furthermore, the temperature graph shows a decrease in temperature from 1:00 p.m. to 2:00 p.m., thus the day was cloudy and rainy. The maximum energy production was reached at 11:00 a.m. (23 kWh, 25 C°, and 500 W/m
2). On the other hand, the maximum temperature was reached at 12:00 p.m., 27 °C.
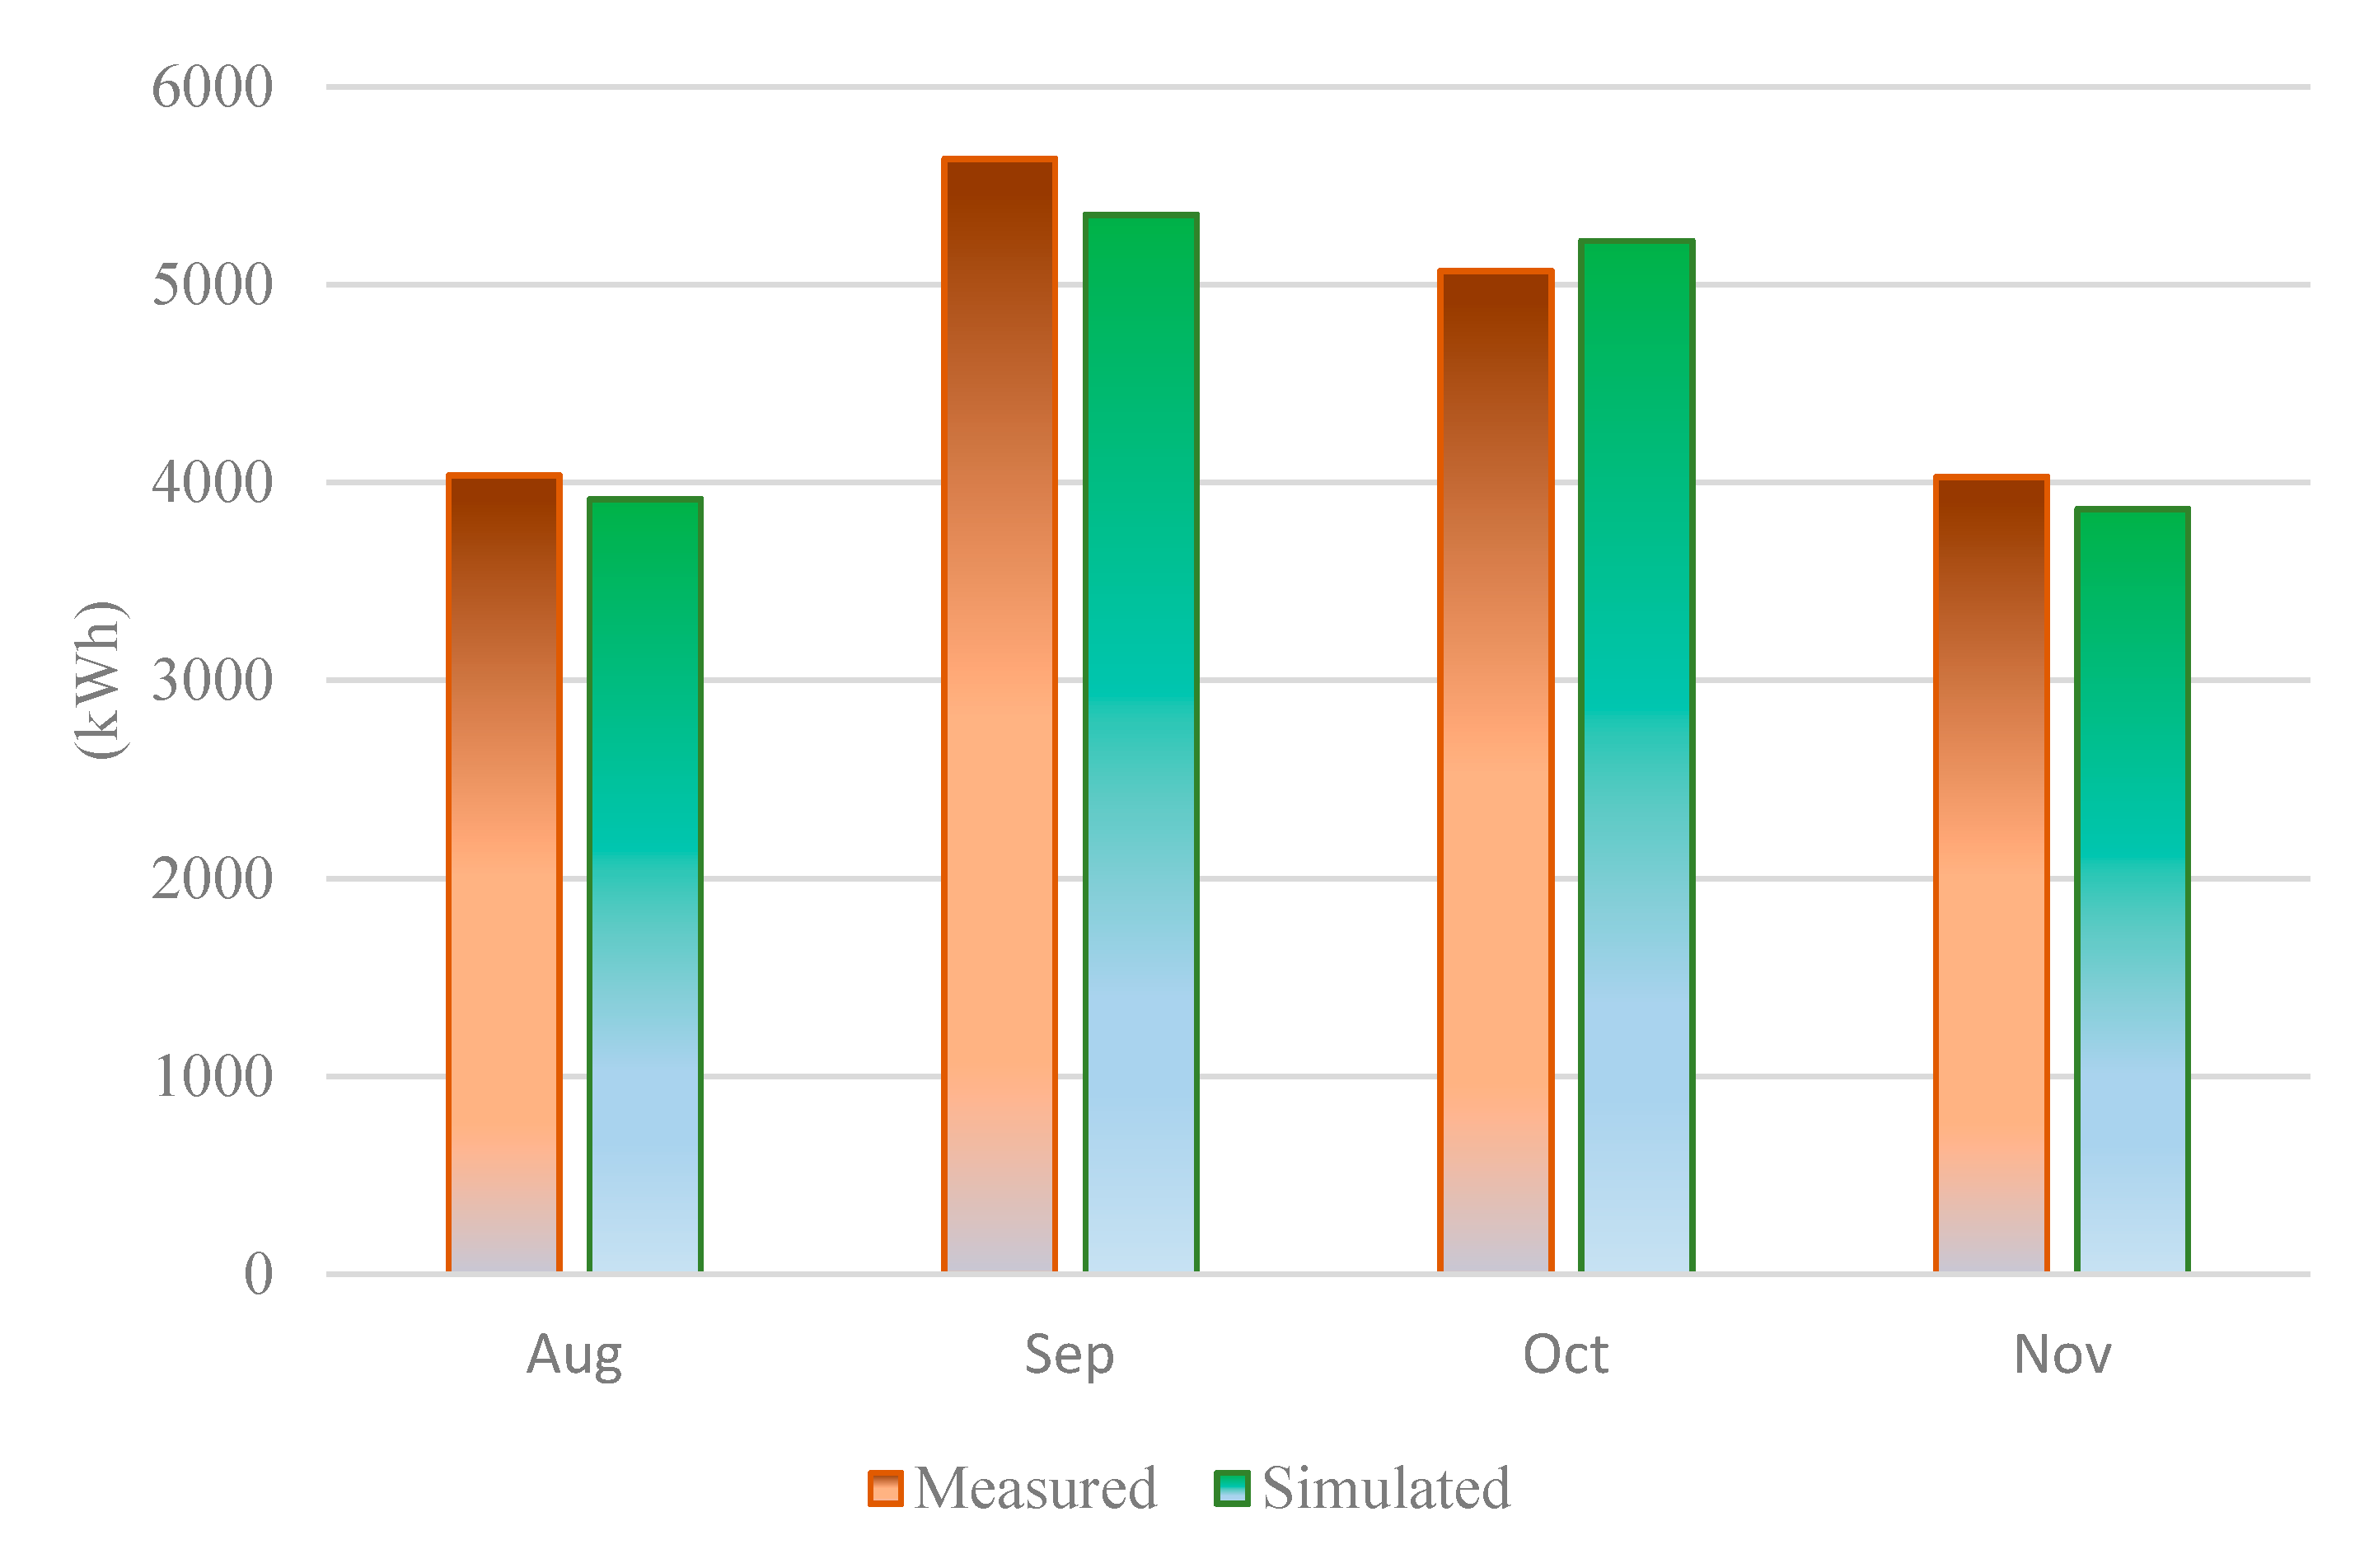
Figure 12 shows a comparative analysis between the experimental data obtained by this PV system, from August to November, and the data obtained by a simulation software PVSYST.
The simulated irradiation by the PV system, located in the parking in the North Sector, is lower than the experimental measurement in most months, excluding October, when the experimental measurement is higher. However, it was possible to calibrate the values obtained by the simulation, because they are very close to those measured by the PV system, and the calibration error did not reach more than 2.8%.
Figure 13 shows that in the months when the measured irradiation was higher than the simulation, the PV system also supplied more energy. September was the month with the highest energy production (5.6 MWh) and November was the lowest (4 MWh).
The BIPV system installed in the Autonoma de Occidente University (UAO) campus does not have batteries, therefore it is connected to the grid, allowing it to work in diurnal intervals for self-consumption and reducing dependency of utility grid.allowing it to work in intervals of self-consumption and of supporting the grid.
Figure 14 shows the electrical energy (kWh) supplied to the grid during these four months as superplus. The surplus production only happens on Sundays and holidays, when the UAO is closed and the demand is lower. The surplus of energy was higher in September, at 620 kWh, and lower in August and November, at 450 kWh (approximately).
Figure 15 shows the energy demand in the Autonoma de Occidente University (UAO) Campus, showing how the demand is higher in comparison to the energy supplied by PV systems. The energy demand, by the university, is over 200 MWh/month. On the other hand, for the best month in energy production, the PV subsystem supplied only 5.6 MWh/month.
Figure 16 shows the energy supply of the north parking sector PV subsystem to the university demand, which totaled 1.7% on average. However, doing an analysis for Sundays and holidays, the same subsystem supplies 100% of the demand and supplies surpluses to the grid.
Figure 17 shows the measured energy yield, using inputs and outputs of the PV system in the UAO campus, with an equipment yield close to 90%. This obtained efficiency indicates the optimal operation of the equipment. If the efficiency drops, it is useful to find out the individual efficiency of each component, analyzing the energy input and output data for each piece of equipment studied.
Finally,
Figure 18 shows that the performance ratio of the PV system is quite similar to the simulation. The global yield by the PV system is limited by the collection performance, the equipment installed, and losses by delivery. The yield of the photovoltaic modules studied in the subsystem is 19% and the overall yield of the entire PV system is around 16%.
The performance ratio (PR) of the PV subsystem reaches 78% during September. By means of this PR, the energy conversion efficiency of the PV system is obtained, despite the fluctuation due to the temperature of the photovoltaic module, showing the losses caused by the inefficiency of the inverter, cables, temperature, dirt, shadows, irradiance, and utility outages warnings. The studied PV subsystem works in optimal operating conditions, through continuous and frequent installation maintenance.
5. Conclusions
The analyzed case study shows the importance of achieving the target of smart campus, as a model of technological innovation, for the development of new energy technologies. This model of integration of renewable energy systems reaches the entire building sector, contributing to an improvement in energy efficiency and a reduction in carbon emissions.
The integration of grid-connected photovoltaic systems, providing the capacity to integrate zero energy buildings, allows the development of other additional technologies, such as energy storage, microgrids and renewable power supplies. Some of these are already being considered for integration into the smart campus under study. This analysis shows the importance of the integration of the photovoltaic system into the smart campus, because it allows for a reduction of reliance on the grid, improving the energy efficiency. It is also important to highlight that the implementation of this type of solution comes within the objective of the decarbonization of the economy. A dynamic monitoring of several parameters was carried out in order to analyze the energy performance at the smart campus. Using the data acquired, the energy efficiency for the PV system integrated at the smart campus was determined.
A study of the experimental results for a PV subsystem in the UAO campus was carried out during four months; the measured parameters were obtained, showing standard days of the measurement period, and finally, the energy efficiency results were obtained. During the analysis, the performance ratio of the grid-connected photovoltaic system was reported as ranging from 0.73 to 0.78. This shows the operating conditions of the integrated photovoltaic system, when the system is integrated on the roofs of buildings, in tropical areas. The high radiation, as well as the ambient temperature, contribute to the operating temperature of the PV modules. This variable has a significant effect on the reduction of efficiency. As a result, the performance of the system is not as high as in a PV system installed at ground level.
In this case, it was possible to analyze certain conditions that affect the performance of the grid-connected photovoltaic system
The building’s energy demand impacts on the value of the self-consumption energy used by the PV system.
The geographical area, where the PV system is installed, although it has a plentiful resource, also has a condition of ambient temperature that affects the performance of the PV system, making this parameter change according to which season (dry or wet) is prevailing at the time. However, both the wet and dry seasons make the maintenance conditions vary, and the amount of dirt impacts the energy production. This is evident in October, which is a dry month with a low performance, compared to the other months studied.
The geographical area is characterized by the presence of mountain ranges within an inter-Andean valley. This cloudiness influences significantly on the amount of diffuse radiation that is shown in the area, together with a higher temperature. The effects caused by the cloud cover are shown in the radiation graphs, displayed for the months of October and November. These factors contribute to the performance evolution and provide an opportunity for the evaluation of these conditions for future solar projects
The implementation of the integrated photovoltaic system, according to international standards, shows the potential offered by these types of technological solutions for the energy mix. These solutions comply with the regulations established by the Colombian Government, Regulation CREG 030, 2018, which regulates the integration of photovoltaic systems within the electricity generation mix.
Additionally, recent regulations offer the chance to obtain tax incentives for the integration of photovoltaic energy in buildings in Colombia. The results here may motivate other university campuses to get involved in the concept of the smart campus, achieving joint strategies for monitoring and evaluating the performance of these systems, installed as laboratories in a country where there are differing climatic conditions and options for installation, and where the government will in future increase its renewable energy capacity by 50 times.

 ,
, 


