Article

Employing a Laser Headlight Electrical System to Measure and Calculate Electro-Optic Conversion Efficiencies of Blue-Beam Laser Diodes

1
Undergraduate Program of Vehicle and Energy Engineering, National Taiwan Normal University, Taipei City 10610, Taiwan
2
Department of Electrical Engineering, National Taiwan University of Science and Technology, Taipei City 10607, Taiwan
*
Author to whom correspondence should be addressed.
Electronics 2020, 9(11), 1902; https://doi.org/10.3390/electronics9111902
Submission received: 21 October 2020 / Revised: 9 November 2020 / Accepted: 10 November 2020 / Published: 12 November 2020
(This article belongs to the Section Power Electronics)

Abstract

:
In this study, a laser headlight electrical system was developed and implemented to measure and compare the electro-optic characteristics of the blue-beam laser diodes (BBLDs). To observe different temperatures (from negative to positive temperatures) that cause optical output power (OOP) and electrical power variations of the BBLDs, BBLDs were placed in an ambient temperature testing chamber, and the electro-optic characteristics of the BBLDs were measured to estimate the electro-optic conversion efficiencies. The different OOPs and electro-optic conversion efficiencies at different temperatures can be obtained when OOP adjustment was performed by average current and low-frequency pulse-duty cycle modulation technologies. Moreover, this study developed a human–machine interface using the LabVIEW software; therefore, the laser headlight electrical system can be controlled and monitored by a computer with the controller area network (CAN) bus communication. Finally, the prototype of the laser headlight electrical system was achieved, and three BBLDs were driven; furthermore, the white light of the headlight can be produced by mixing blue laser beams with a yellow fluorescence ceramic wafer.

1. Introduction

Vehicle headlights are placed on a vehicle to illuminate roadways at night. General vehicle headlights are equipped with a high beam, low beam and indicator lights. Metal halide high-intensity discharge lamps may be substituted for conventional incandescent halogen lamps for high-beam selections. These gas discharge bulbs must be used with electronic ballasts to solve several problems, including alternating-current (AC) driving, negative impedance characteristic and high-voltage ignition [1,2,3]. However, light-emitting diodes (LEDs) are another headlight selection because they have many merits, including direct-current (DC) driving, dimmable, high luminance and cost-saving. Therefore, LEDs have been replaced the gas discharge bulbs for the high-beam headlights [4,5,6,7].
A laser beam has several excellent optical characteristics, such as high color purity, high directionality, high coherency. Therefore, several optoelectronic semiconductor manufacturers have been developing laser diodes of high current density for the optical output power (OOP) laser diodes. Several manufacturers, including BMW, Audi and SHARP, have invested in the development of laser headlights [4,5,6,7]. A few articles have discussed laser headlights for vehicles, with [8] being one such article. From the introduction of [8], four laser diodes can emit blue laser beams to project on the yellow fluorescence; hence the white light can be produced using this light-mixing technology. Moreover, the study reports that the wafer size of the laser diode has a high current capacity because that if the active area of a laser diode were to be 10 µm2, then the LED would require an area of 1 mm2. Furthermore, an optical lens can be used to focus the laser beam to achieve high directionality and coherency. For these reasons, the light source of the vehicle headlight can employ laser diodes, the numbers of which can be less than LED headlights, further, to provide high brightness and ensure significant illumination for roadway driving.
The power converter topology and control topology of the laser headlights have been discussed in [9,10]. In [11], a laser headlight system can receive the data message from a media navigation system, which can be manipulated by the image processor; thus, a driving module and pulse-duty-cycle modulation (PDCM) method can be employed to control the headlight brightness with the color temperature. In [12], a headlight system was designed to manipulate the projection position and brightness of the headlight following the different driving environment; therefore, the suitable illumination area of the headlight can be obtained, and the glare of the headlight can be regulated such that it cannot influence drivers from the opposite-direction vehicles. In [13], a safety apparatus was employed for manipulating a laser headlight to prevent traffic accidents caused by the out of control headlight; this apparatus can prevent damage to human eyes caused by direct laser exposure. The control technologies and power topologies of such systems are listed in Table 1, revealing that studies have yet to analyze or discuss the electrical and optical characteristics of laser headlights when operated at different temperatures.
Because the electrical and optical characteristics of the laser diodes are similar to the LEDs, the LED dimming methods can be discussed in the following. Both average current modulation and PDCM are normal approaches to regulate LED brightness. For LED dimming by using average current modulation, the average driving current of the LED was regulated [14]. For dimming LEDs by using PDCM, using a periodical PDCM signal, the turn-on/-off operation of the LED can be controlled, and the LED was driven by a maximum constant current (CC) during the LED turn-on operation [15,16,17]. Table 2 provides comparisons of technologies for analog dimming and PDCM dimming presented in [15,16,17].
This study developed and implemented a laser headlight electrical system (LHES) to drive and control the laser diodes of the blue beams. The blue laser beams can project on a yellow fluorescence ceramic wafer to transform into white light as the high-beam of the headlight. Moreover, in this study, laser diodes (PL TB405B, Osram Opto Semiconductors Inc., Regensburg, Germany) were employed as the light source of the laser headlight [18]. From the measurement data in [18], under the different average current operations, the OOP variation from the laser diode emitting was proportional to its average driving current. When a PL TB405B was driven by a constant average current, the OOP magnitudes at lower temperatures are higher than those at higher temperatures. These electro-optic characteristics can be obtained from only a primary manufacturer’s document. However, few studies have further inspected other laser diode characteristics. In particular, few articles and studies have:
measured and observed OOP variations under driving different average currents at 0 °C;
measured and observed OOP variations by using low-frequency PDCM from low to high temperatures;
estimated and observed the electro-optic conversion (EOC) efficiencies of laser diodes;
established and showed a complete measurement system for the LHES;
elaborated on measurement methods for the LHES; and
discussed these electro-optic characteristics and experimental results.
The present article was hence conducted to fill these lacks.
This paper is a research extension of [19]; however, new original contributions present in this paper. This paper organizes five sections. Section 2 is the configuration of LHES. Section 3 is the LHES measurement system and specification. Section 4 presents experimental results, electro-optic characteristic measurements and EOC efficiency calculation and an LHES prototype. Section 5 is this study’s conclusion.

2. Laser Headlight Electrical System

The function block of the LHES is depicted in Figure 1, including the electromagnetic compatibility (EMC) suppression circuit, buck converter, buck–boost converter, CAN–bus transceiver, control IC and microcontroller unit (MCU). The on-board battery can supply the power to the LHES inlet. The blue-beam laser diodes (BBLDs) can connect to the LHES outlet; the BBLDs can obtain a suitable driving power from the buck–boost converter. The vehicle computer can communicate with the LHES by the controller area network (CAN)-bus; the CAN-bus transceiver inside the LHES is an interface between the CAN protocol controller and the physical layer of the CAN-bus.
On the on-battery power-bus, the impulse voltage and common-mode noise can be suppressed by the electromagnetic compatibility (EMC) suppression circuit. Because the on-battery voltage and BBLD forward-bias are variable, the LHES must employ the buck–boost converter to convert and stabilize the driving power of the BBLD. Moreover, the buck converter of the LHES can supply a stabilized power for the electronic element, and IC works.

2.1. EOC Efficiency of Average Current Modulation

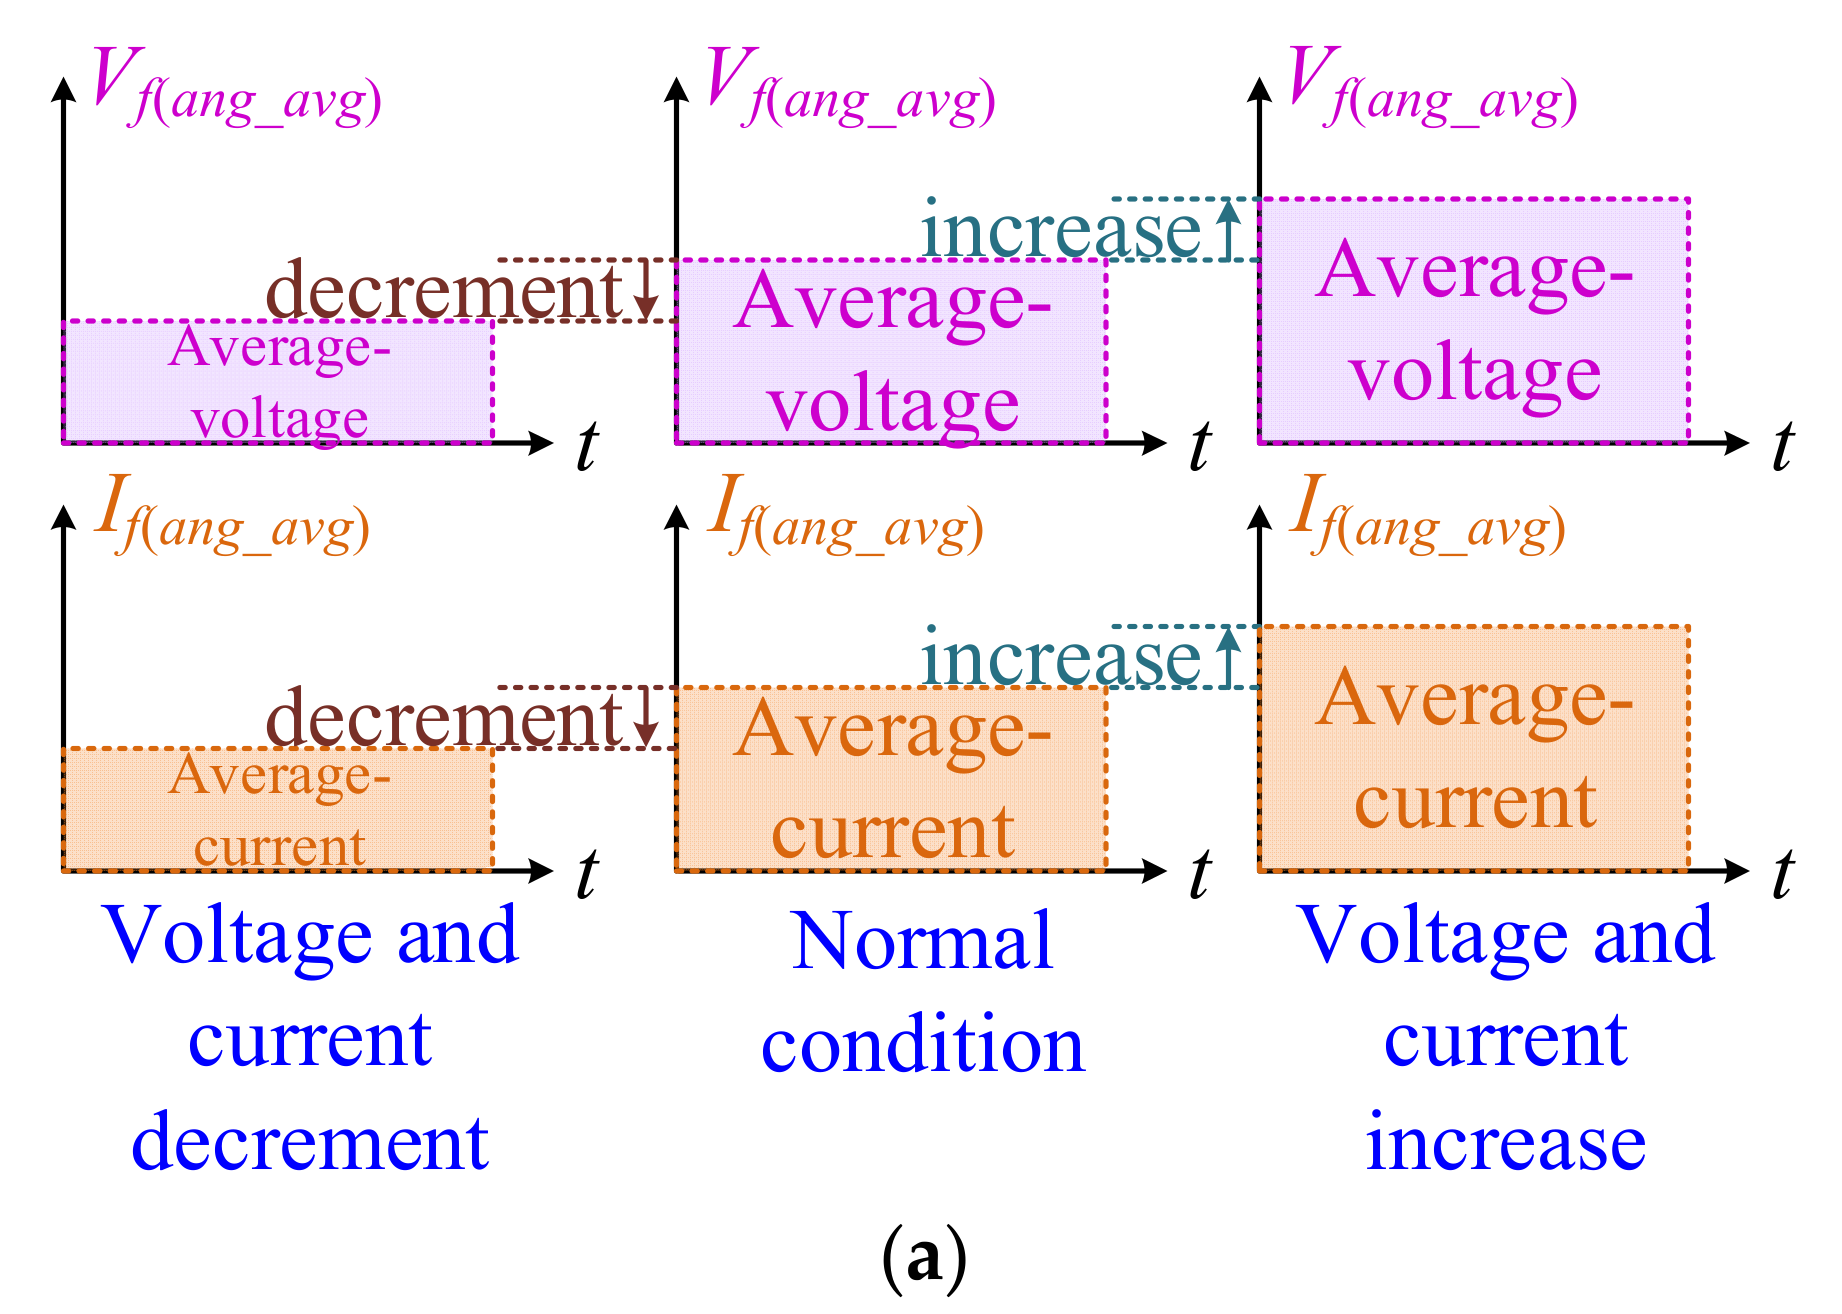
BBLDs operate under continuous CC. The variable average current of If(ang_avg) can result in the different average forward-biases of Vf(ang_avg) across the BBLD. Both If(ang_avg) and Vf(ang_avg) changes are illustrated in Figure 2a. The average electrical power of the BBLD can be calculated as follows:
P e a v g = V f a n g _ a v g I f a n g _ a v g
Moreover, EOC efficiency can be calculated as follows:
η a v g = P o p a v g / P e a v g × 100 %
The EOC efficiency ηavg and OOP Pop(avg) in Equation (2) indicate that BBLD operations entail adjusting the OOP through average current modulation.

2.2. EOC Efficiency of PDCM

From Figure 1, for implementing OOP adjustment using PDCM, the generator or other vehicle parts causing the impulse voltage and common-mode noise can be filtered by the EMC suppression circuit; therefore, the EMC suppression circuit can output a steady voltage Vin to supply the buck and buck–boost converters. Moreover, the buck converter can convert Vin into Vbk to supply the gate drive, CAN-bus transceiver and MCU as the working power; for the same purpose, a BBLD driving voltage Vld and current Ild can be obtained through the buck–boost converter conversion.
Furthermore, the CAN-bus port on the MCU (CANH and CANL) connects with the corresponding port of the CAN-bus transceiver. Therefore, by the CAN-bus communication, the LHES can be manipulated and monitored by the vehicle computer.
The LHES also possesses a CC controller, which can detect the Ild and output an error voltage ve to manipulate the buck–boost converter for achieving BBLD CC driving. In addition, a PDCM signal from the PWM port of the MCU can input to a switch driver to prevent load effect influence and promote the driving ability of the PDCM signal. Correspondingly, the turn-on time of the switch SW can be adjusted. This method can be used to manipulate the turn-on time of the BBLD under the forward-bias operation for achieving OOP adjustment.
The communication interface of the LHES incorporating the CAN-bus transceiver empowers communication with the computer (or the vehicle dominator). When LHES is commanded by the LHES, the MCU can manipulate the turn-on time of the PDCS to adjust the BBLD’s OOP.

2.3. Root Mean Square (RMS) Calculation

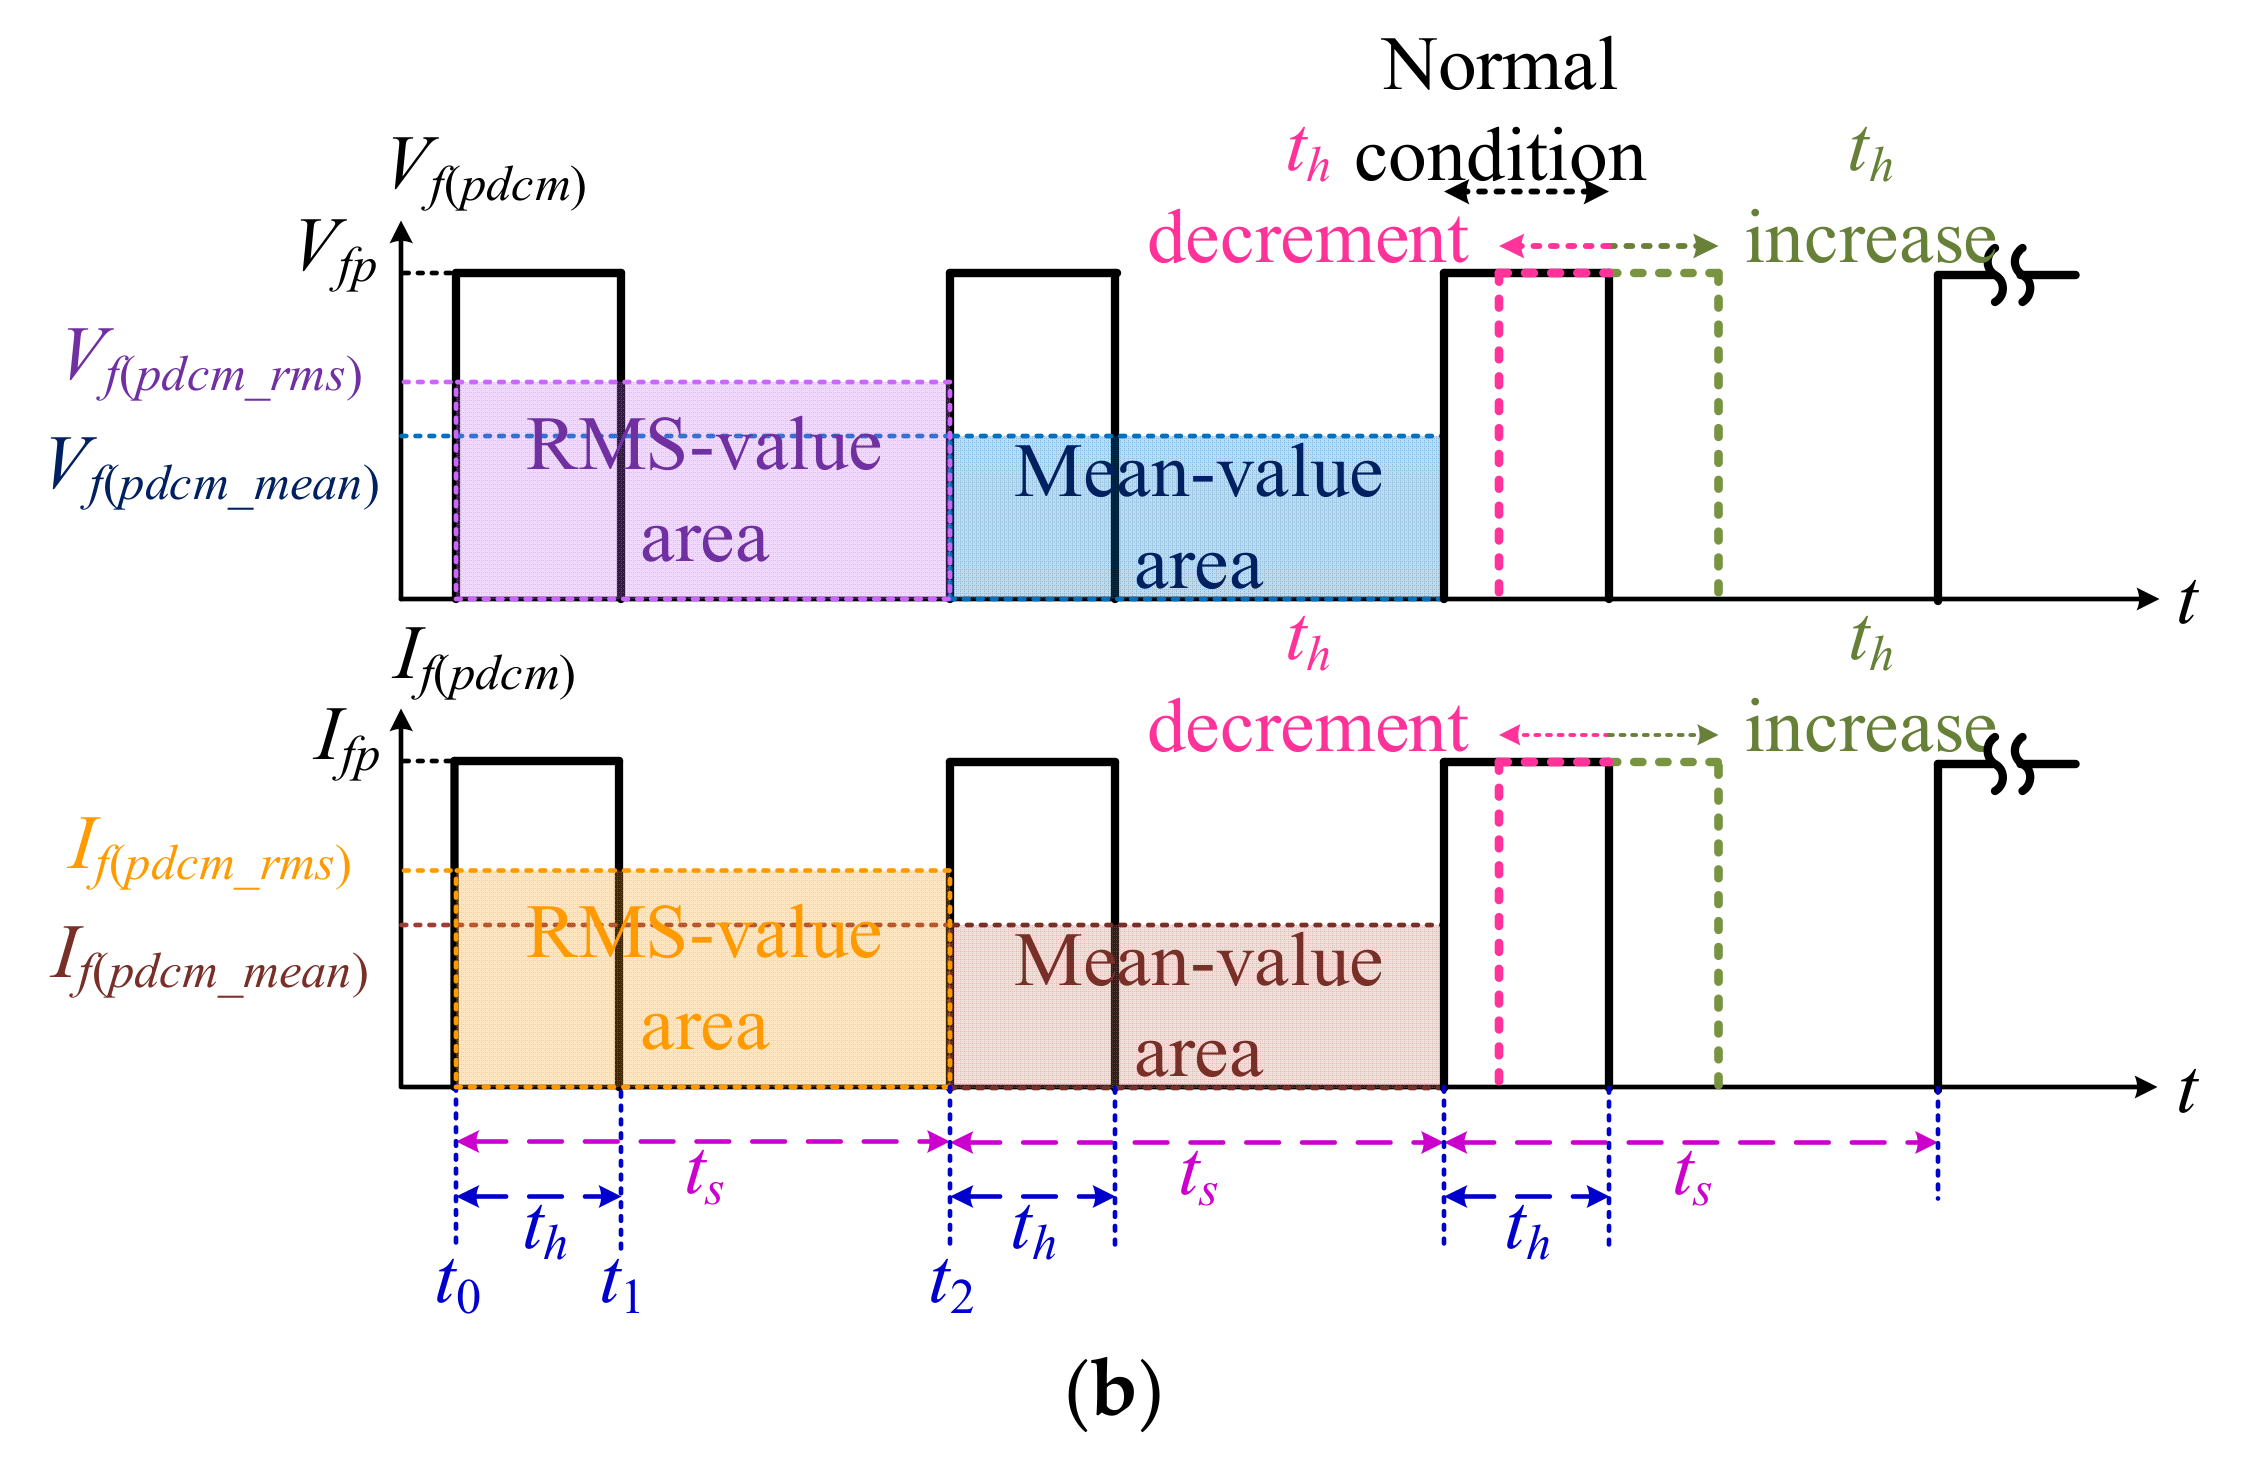
Using the PDCM method, both the RMS and mean areas are illustrated in Figure 2b, where vfp is the peak voltage across the BBLD, the ifp is the peak value of the BBLD driving current when the BBLD is operated in forward-bias. Moreover, the duty cycle ratio of PDCM can be obtained as follows:
D p d c m = t h / t s
where ts is a pulse period, and th is the turn-on time of the BBLD in forward-bias operation. The RMS expressions of the driving voltage and current for the electrical power calculation can be expressed as follows:
v f p d c m _ r m s = v f p 2 t h / t s = v f p 2 D p d c m
i f p d c m _ r m s = i f p 2 t h / t s = i f p 2 D p d c m
From Equations (4) and (5), the electrical power RMS value of the BBLD from the voltage and current RMS values can be obtained as follows:
P e p d c m _ r m s = v f p d c m _ r m s i f p d c m _ r m s
From Equation (6), the EOC efficiency under the PDCM operation can be calculated as follows:
η p d c m = P o o p p d c m / P e p d c m _ r m s × 100 %
In Equation (7), the ηpdcm and Poop(pdcm) represent the EOC efficiency and OOP, respectively.

2.4. Mean-Value Calculation

In Figure 2b, the voltage and current mean values for obtaining the mean-value-based electrical power can be expressed as follows:
v f p d c m _ m e a n = 1 / t s ( t 0 t 1 v f p d t + t 1 t 2 0 d t ) = t h / t s v f p = D p d c m v f p
i f p d c m _ m e a n = 1 / t s ( t 0 t 1 i f p d t + t 1 t 2 0 d t ) = t h / t s i f p = D p d c m i f p  
From Equations (8) and (9), the electrical power mean value of the BBLD based on the voltage and current mean values can be obtained as follows:
P e p w m _ m e a n = v f p w m _ m e a n i f p w m _ m e a n
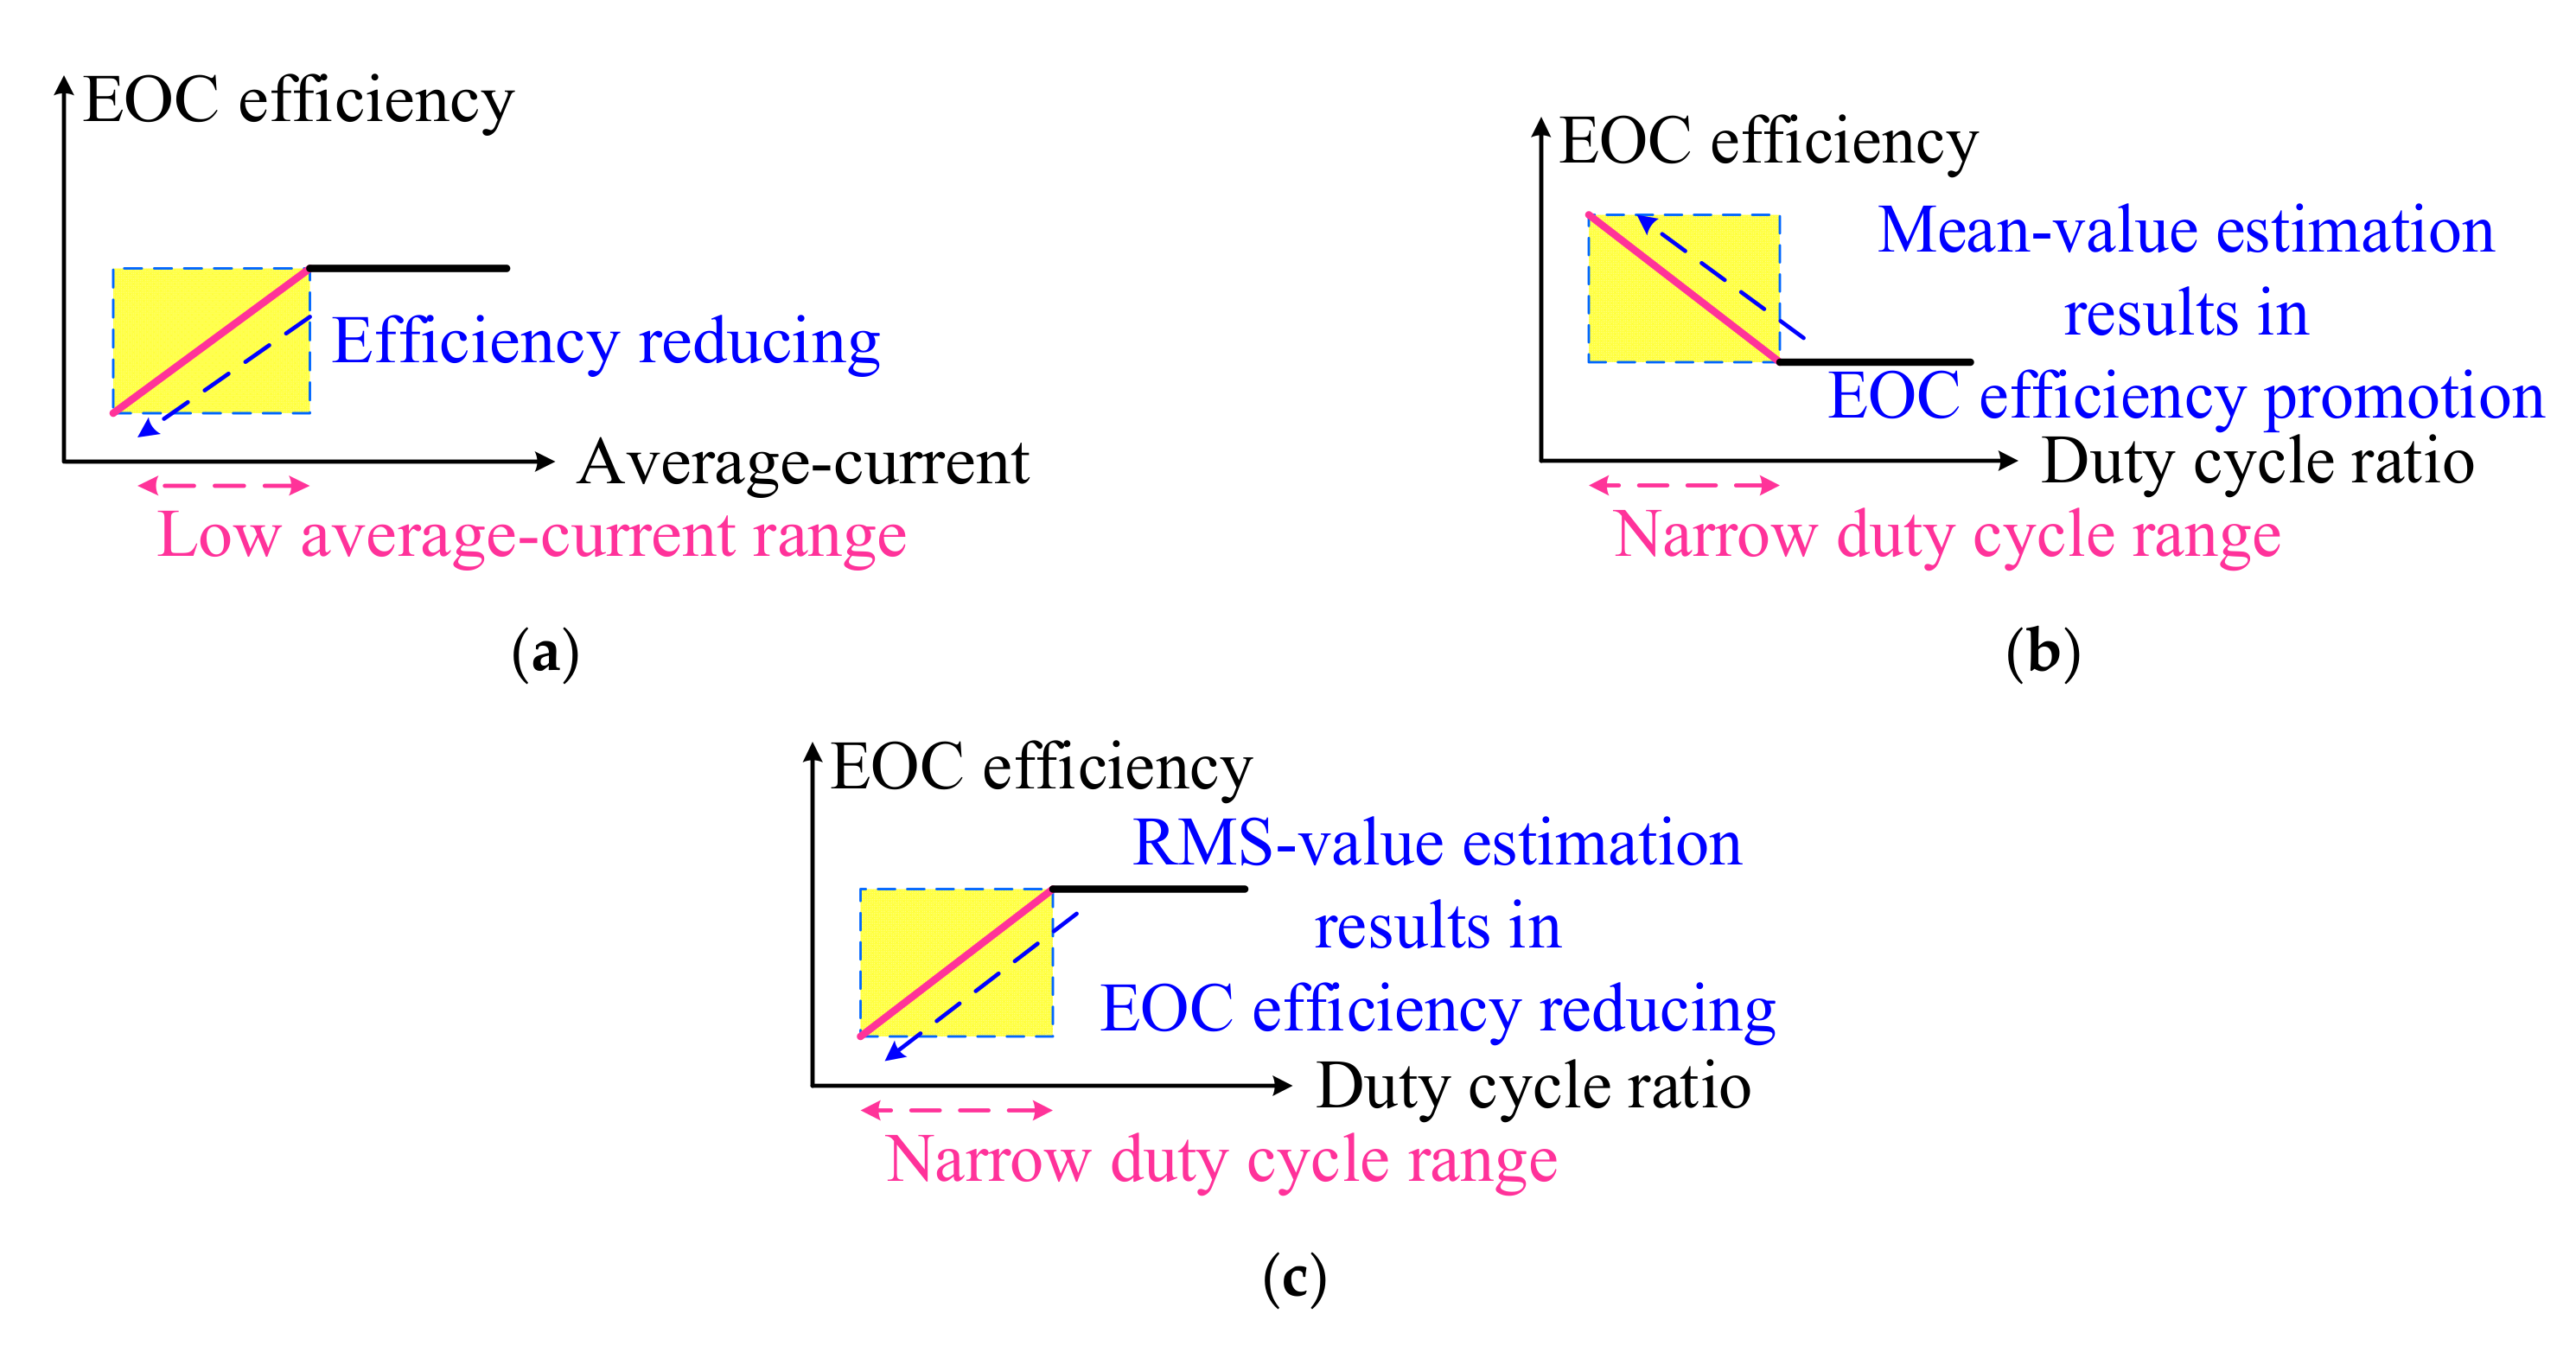
In Figure 3a, when the BBLD is driven by an average current (Figure 2a), the EOC efficiency is reduced following the reduced average current at the low average current range.
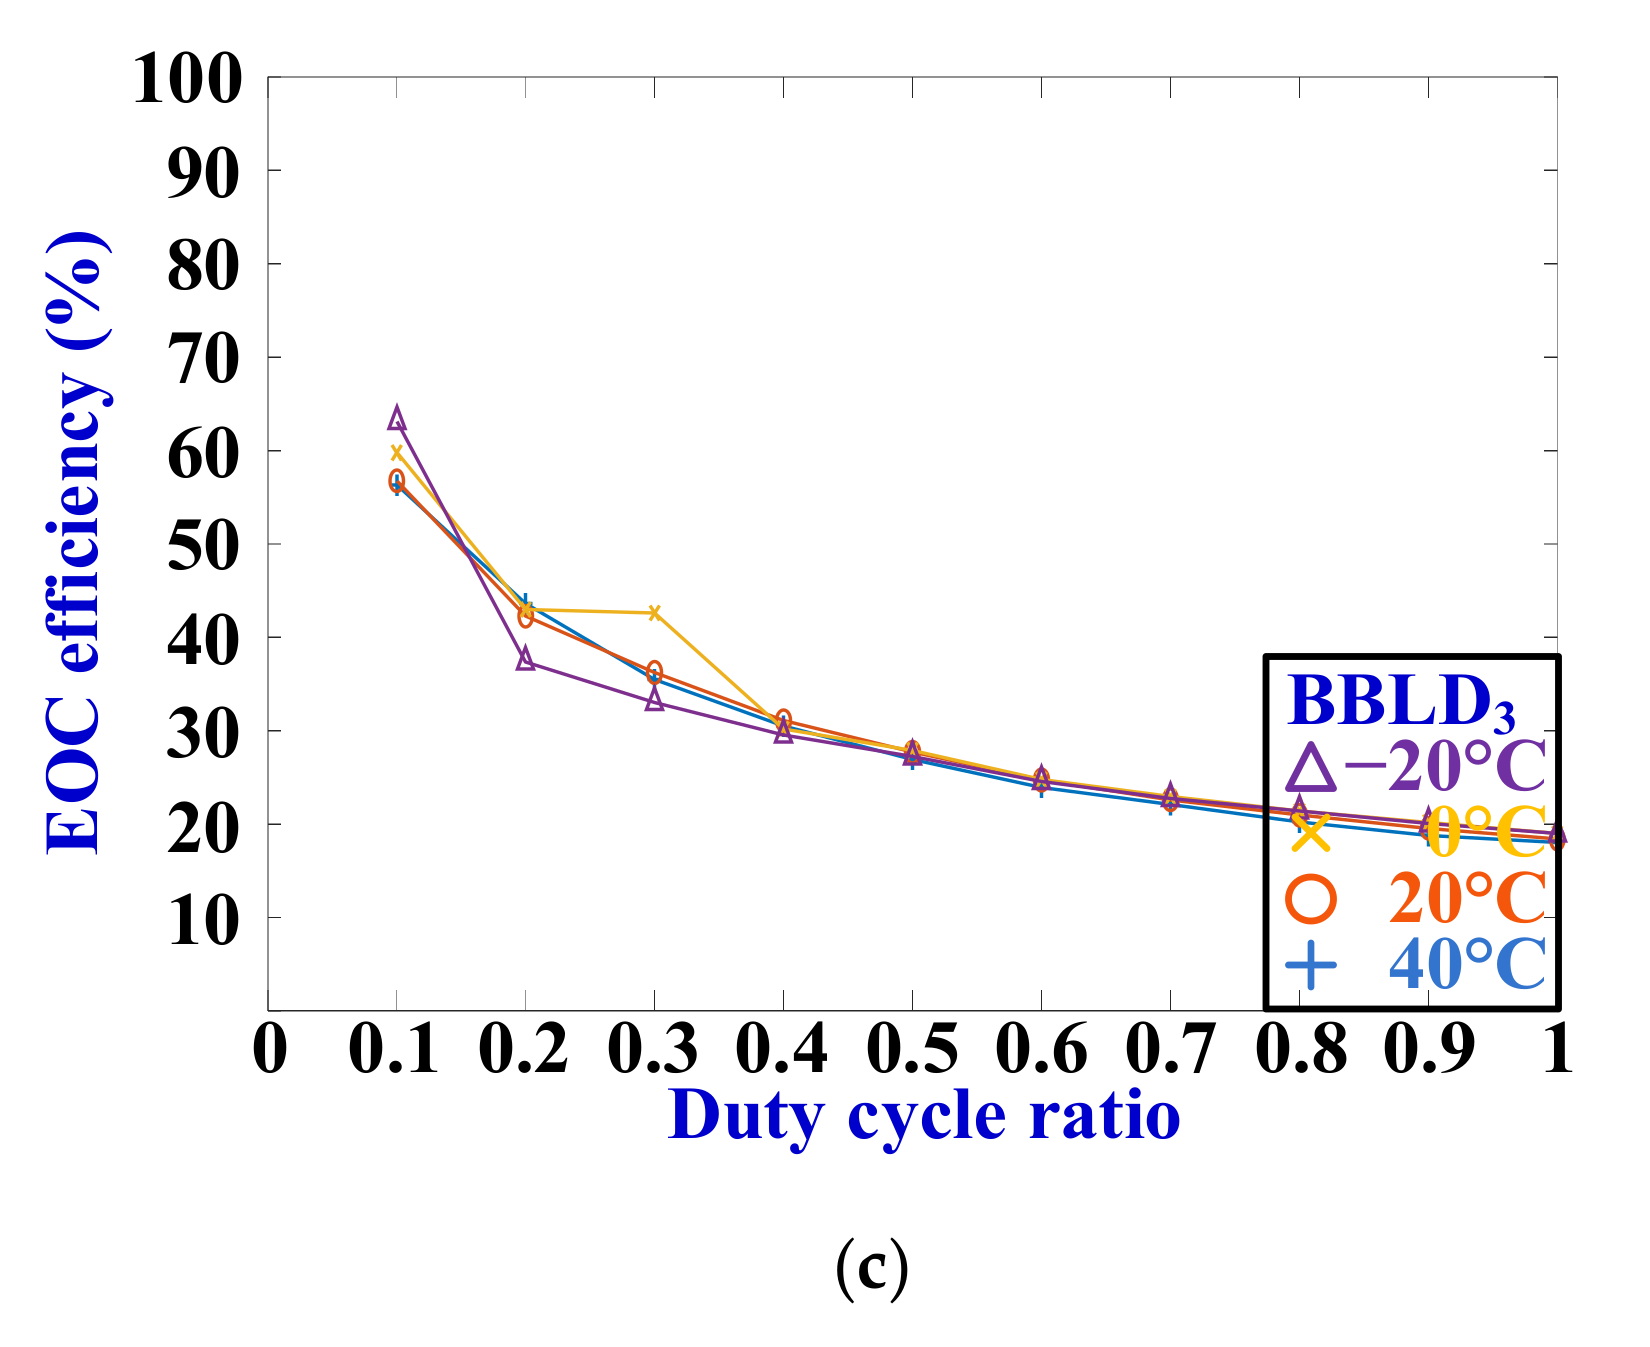
As shown in Figure 3b, when the PDCM adjustment OOP and the EOC efficiency obtained based on the electrical power RMS value are used, the PDCM in the narrow duty cycle range would result in EOC efficiency reduction; this result is similar to that presented in Figure 3a. However, when the EOC efficiency is estimated based on the electrical power mean value, the EOC efficiencies present a promotion tendency in the narrow duty cycle range, as shown in Figure 3c; this situation is contrary to Figure 3a.
Therefore, this study determines that the electrical power RMS value is a suitable parameter for estimating the EOC efficiency under the operation of PDCM adjustment OOP.
The subsequent section will present that the electrical power Pe(pdcm_mean) in Equation (10) is less than Pe(pdcm_rms) in Equation (6), and this result would influence the estimation of the EOC efficiency.

2.5. Human–Machine Interface

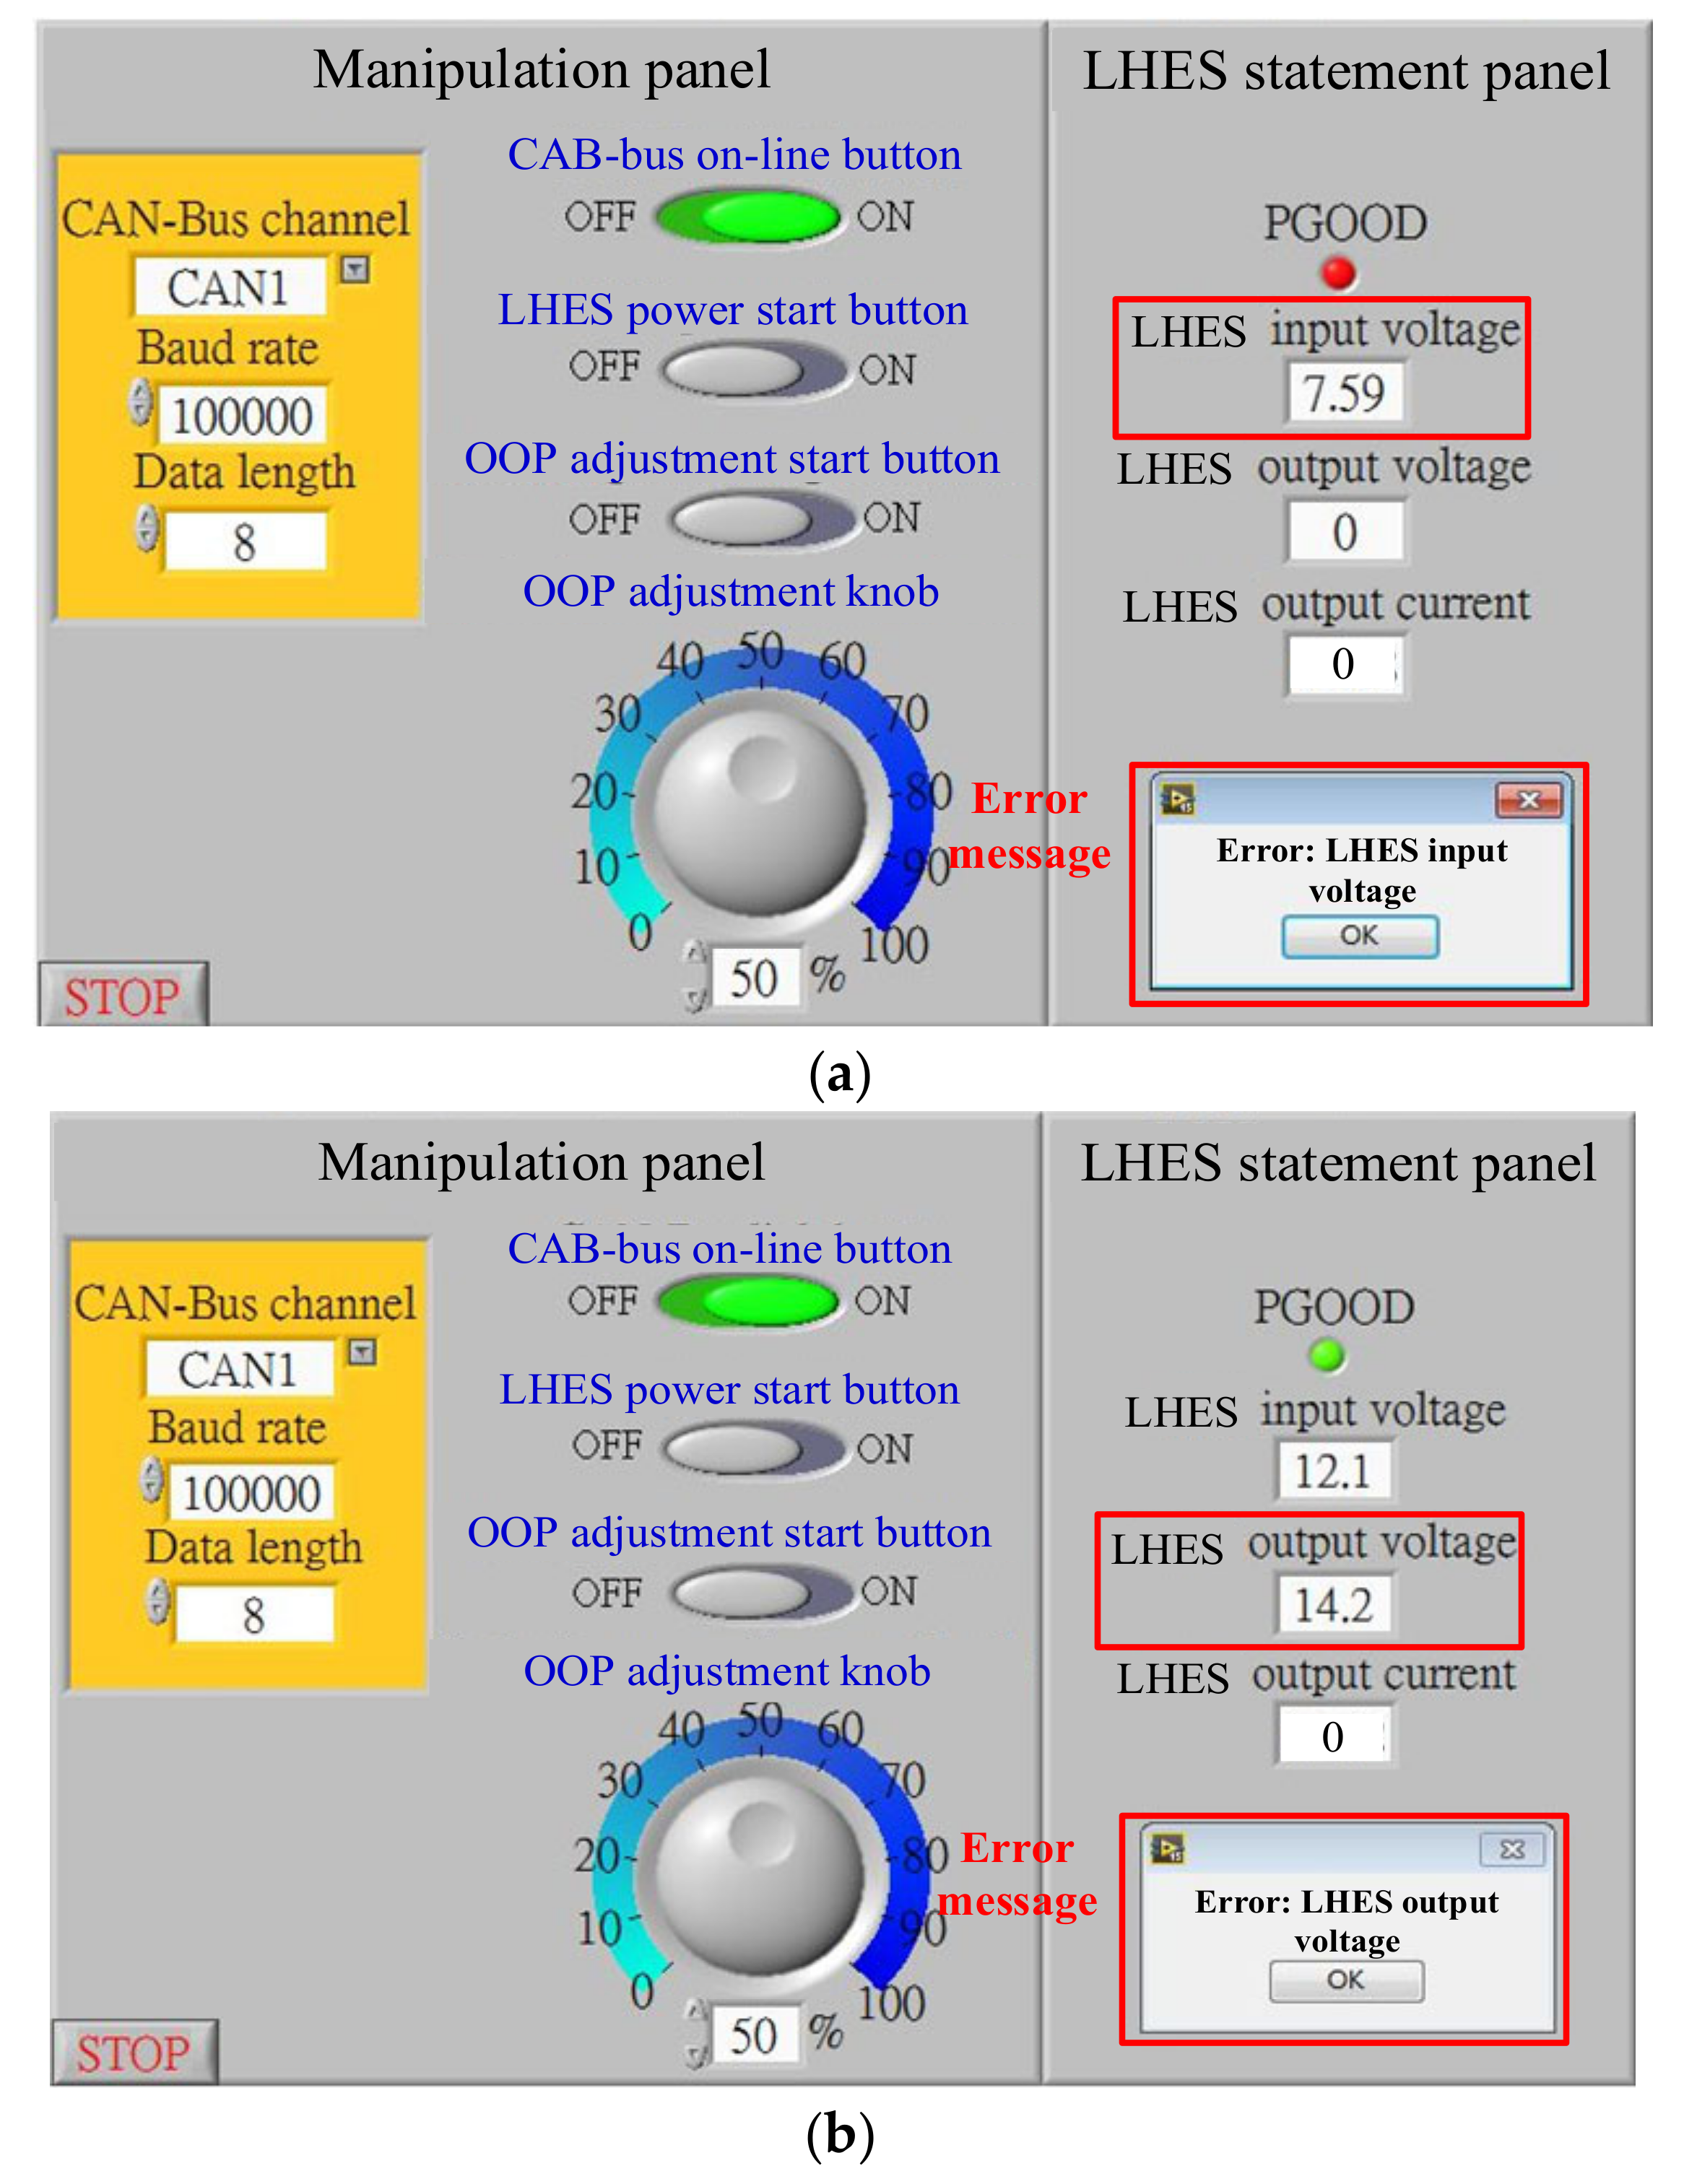
In this study, the LabVIEW was used to establish a human–machine interface of the LHES, as shown in Figure 4. The manipulation panel included the CAN-bus channel option, baud rate setting, data length setting, CAN-bus online button, LHES power start button, OOP adjustment start button and OOP adjustment knob. Moreover, the LHES statement panel included the power good (PGOOD) indication, LHES input voltage, LHES output voltage and LHES output current. Moreover, when the buck–boost converter with its controller was operated in normal, and the output voltage of the buck–boost converter can maintain a normal state under any load. The PGOOD signal from the buck–boost controller was a high/low voltage level, which can input to the general-purpose input/output (GPIO) port of the MCU. Therefore, the MCU can detect the voltage level of the PGOOD signal; the result can transmit to the computer by the CAN-bus communication; as a result, the PGOOD indication on the LHES statement panel can change the color display. In Figure 4, the red PGOOD indication represented that the buck–boost converter with its controller was abnormal operation; otherwise, the green PGOOD indication was displayed.

2.6. Software Flowchart for Human–Machine Interface of LabVIEW

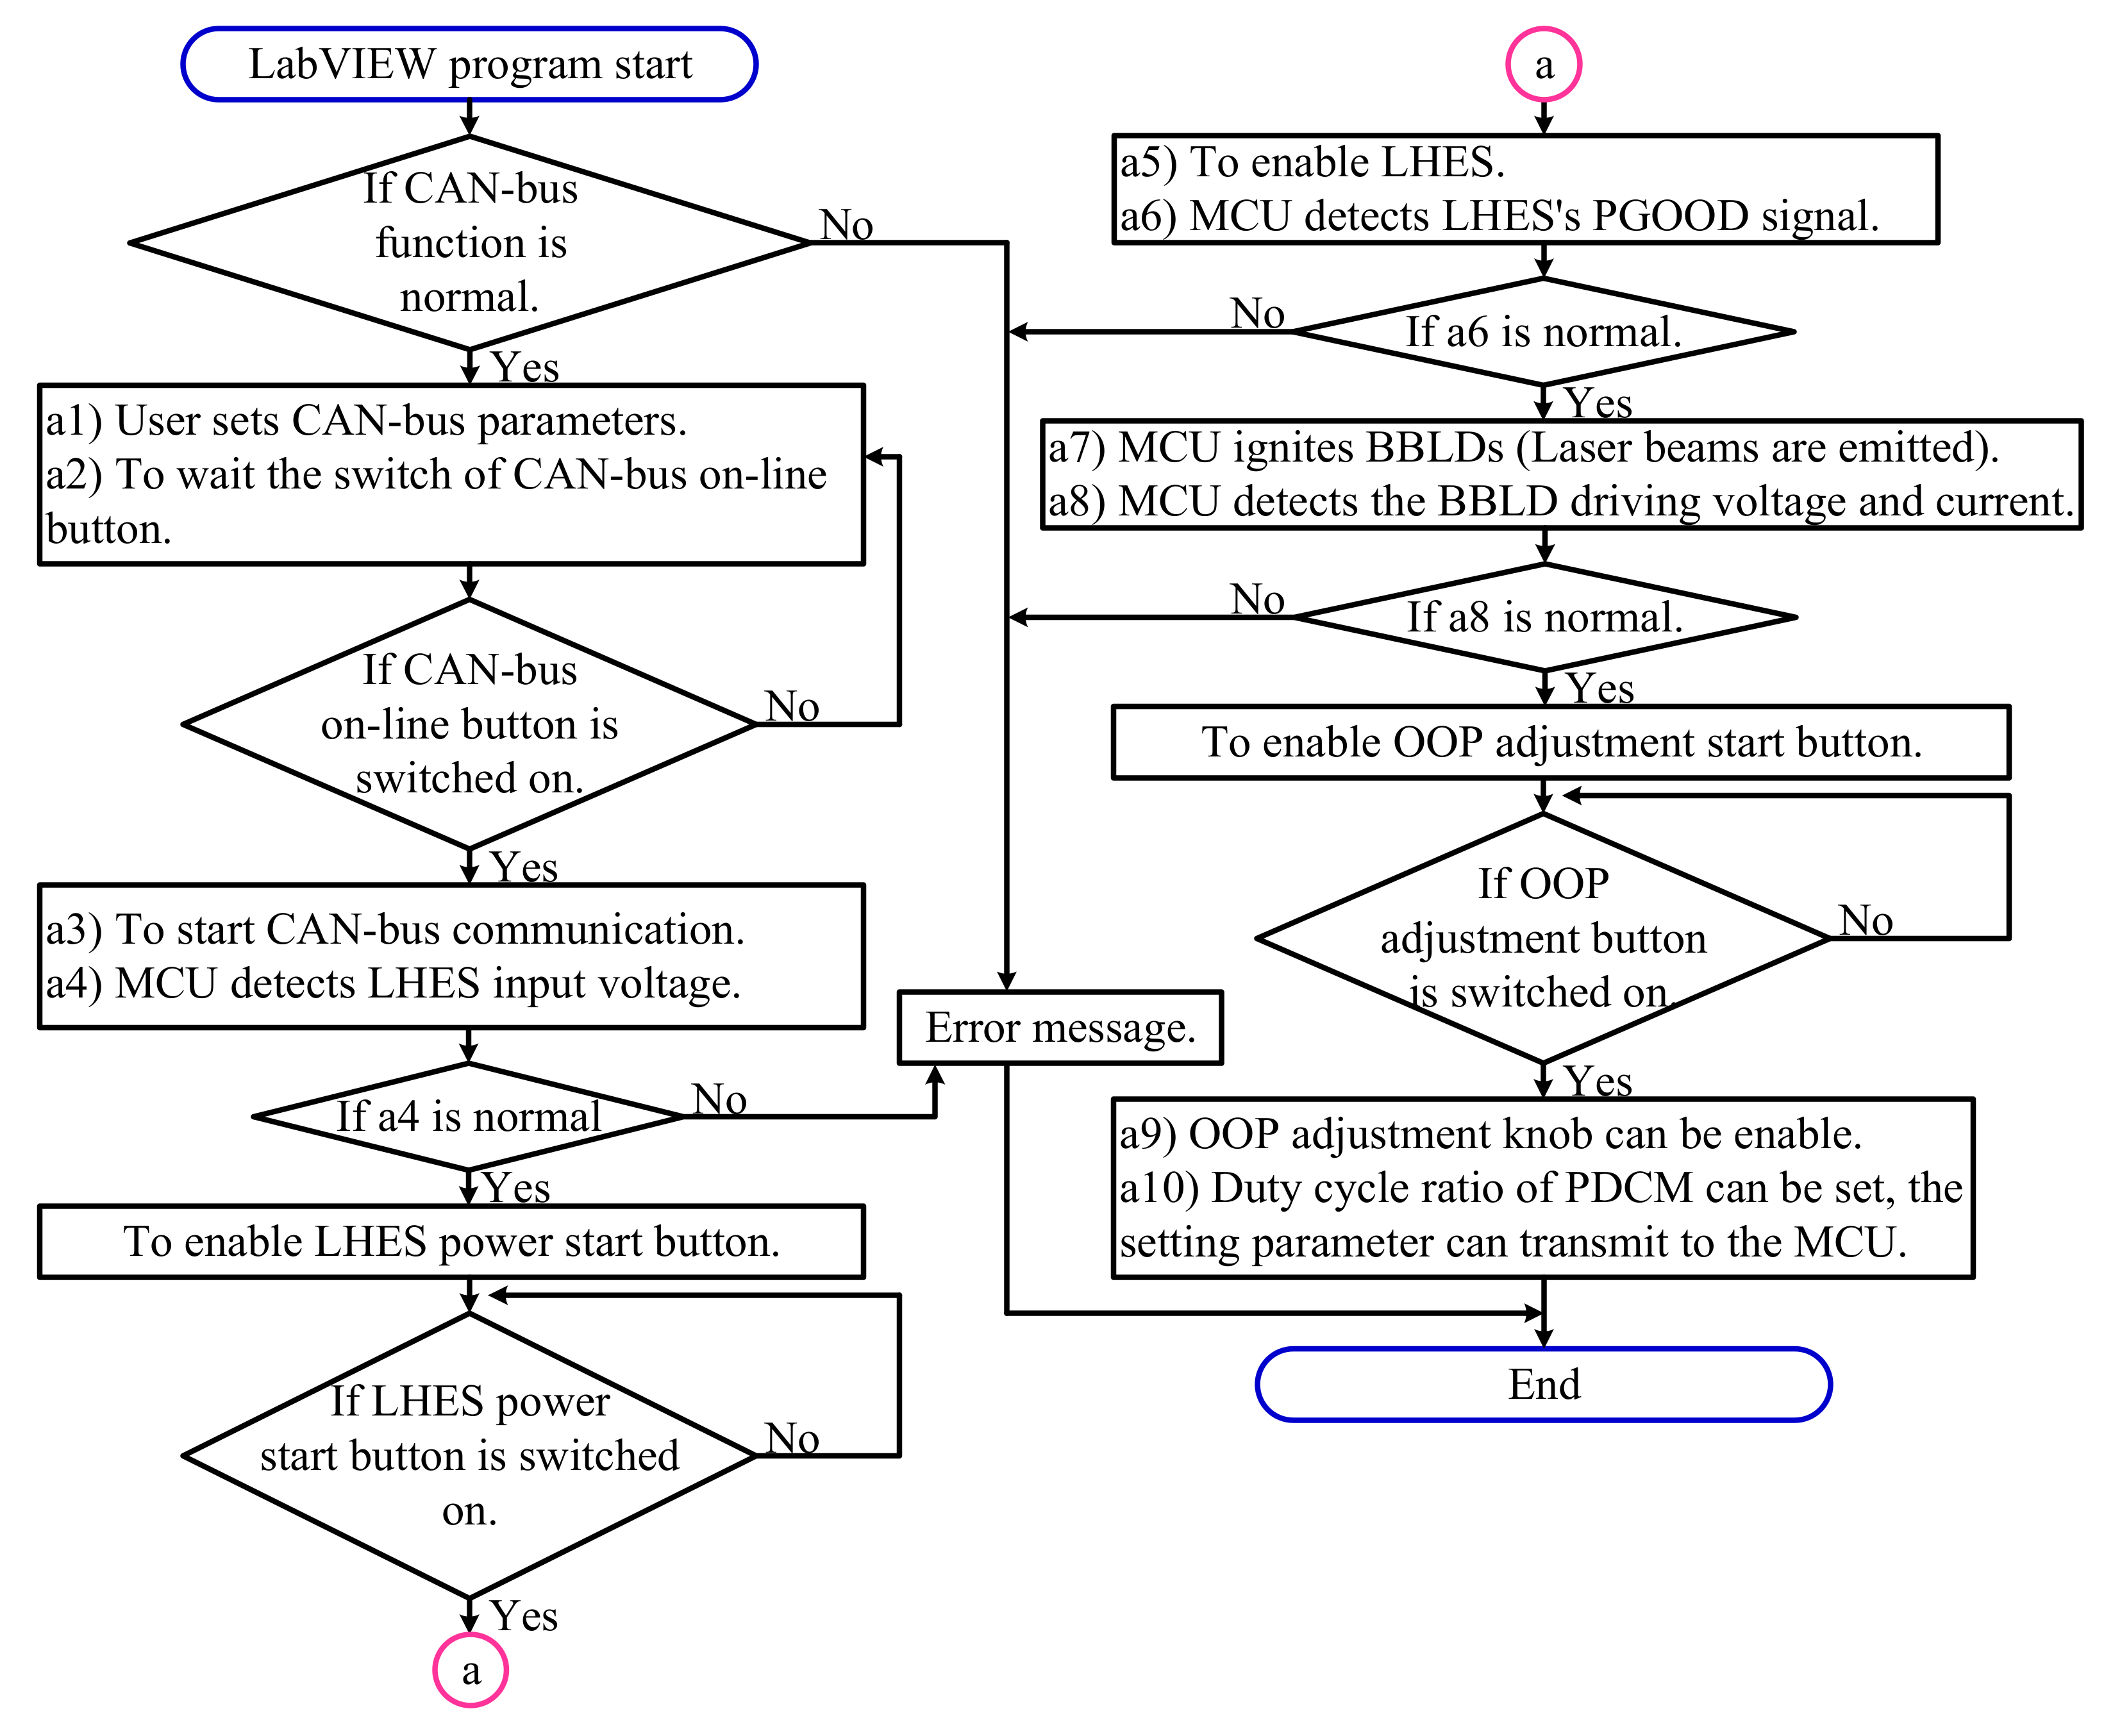
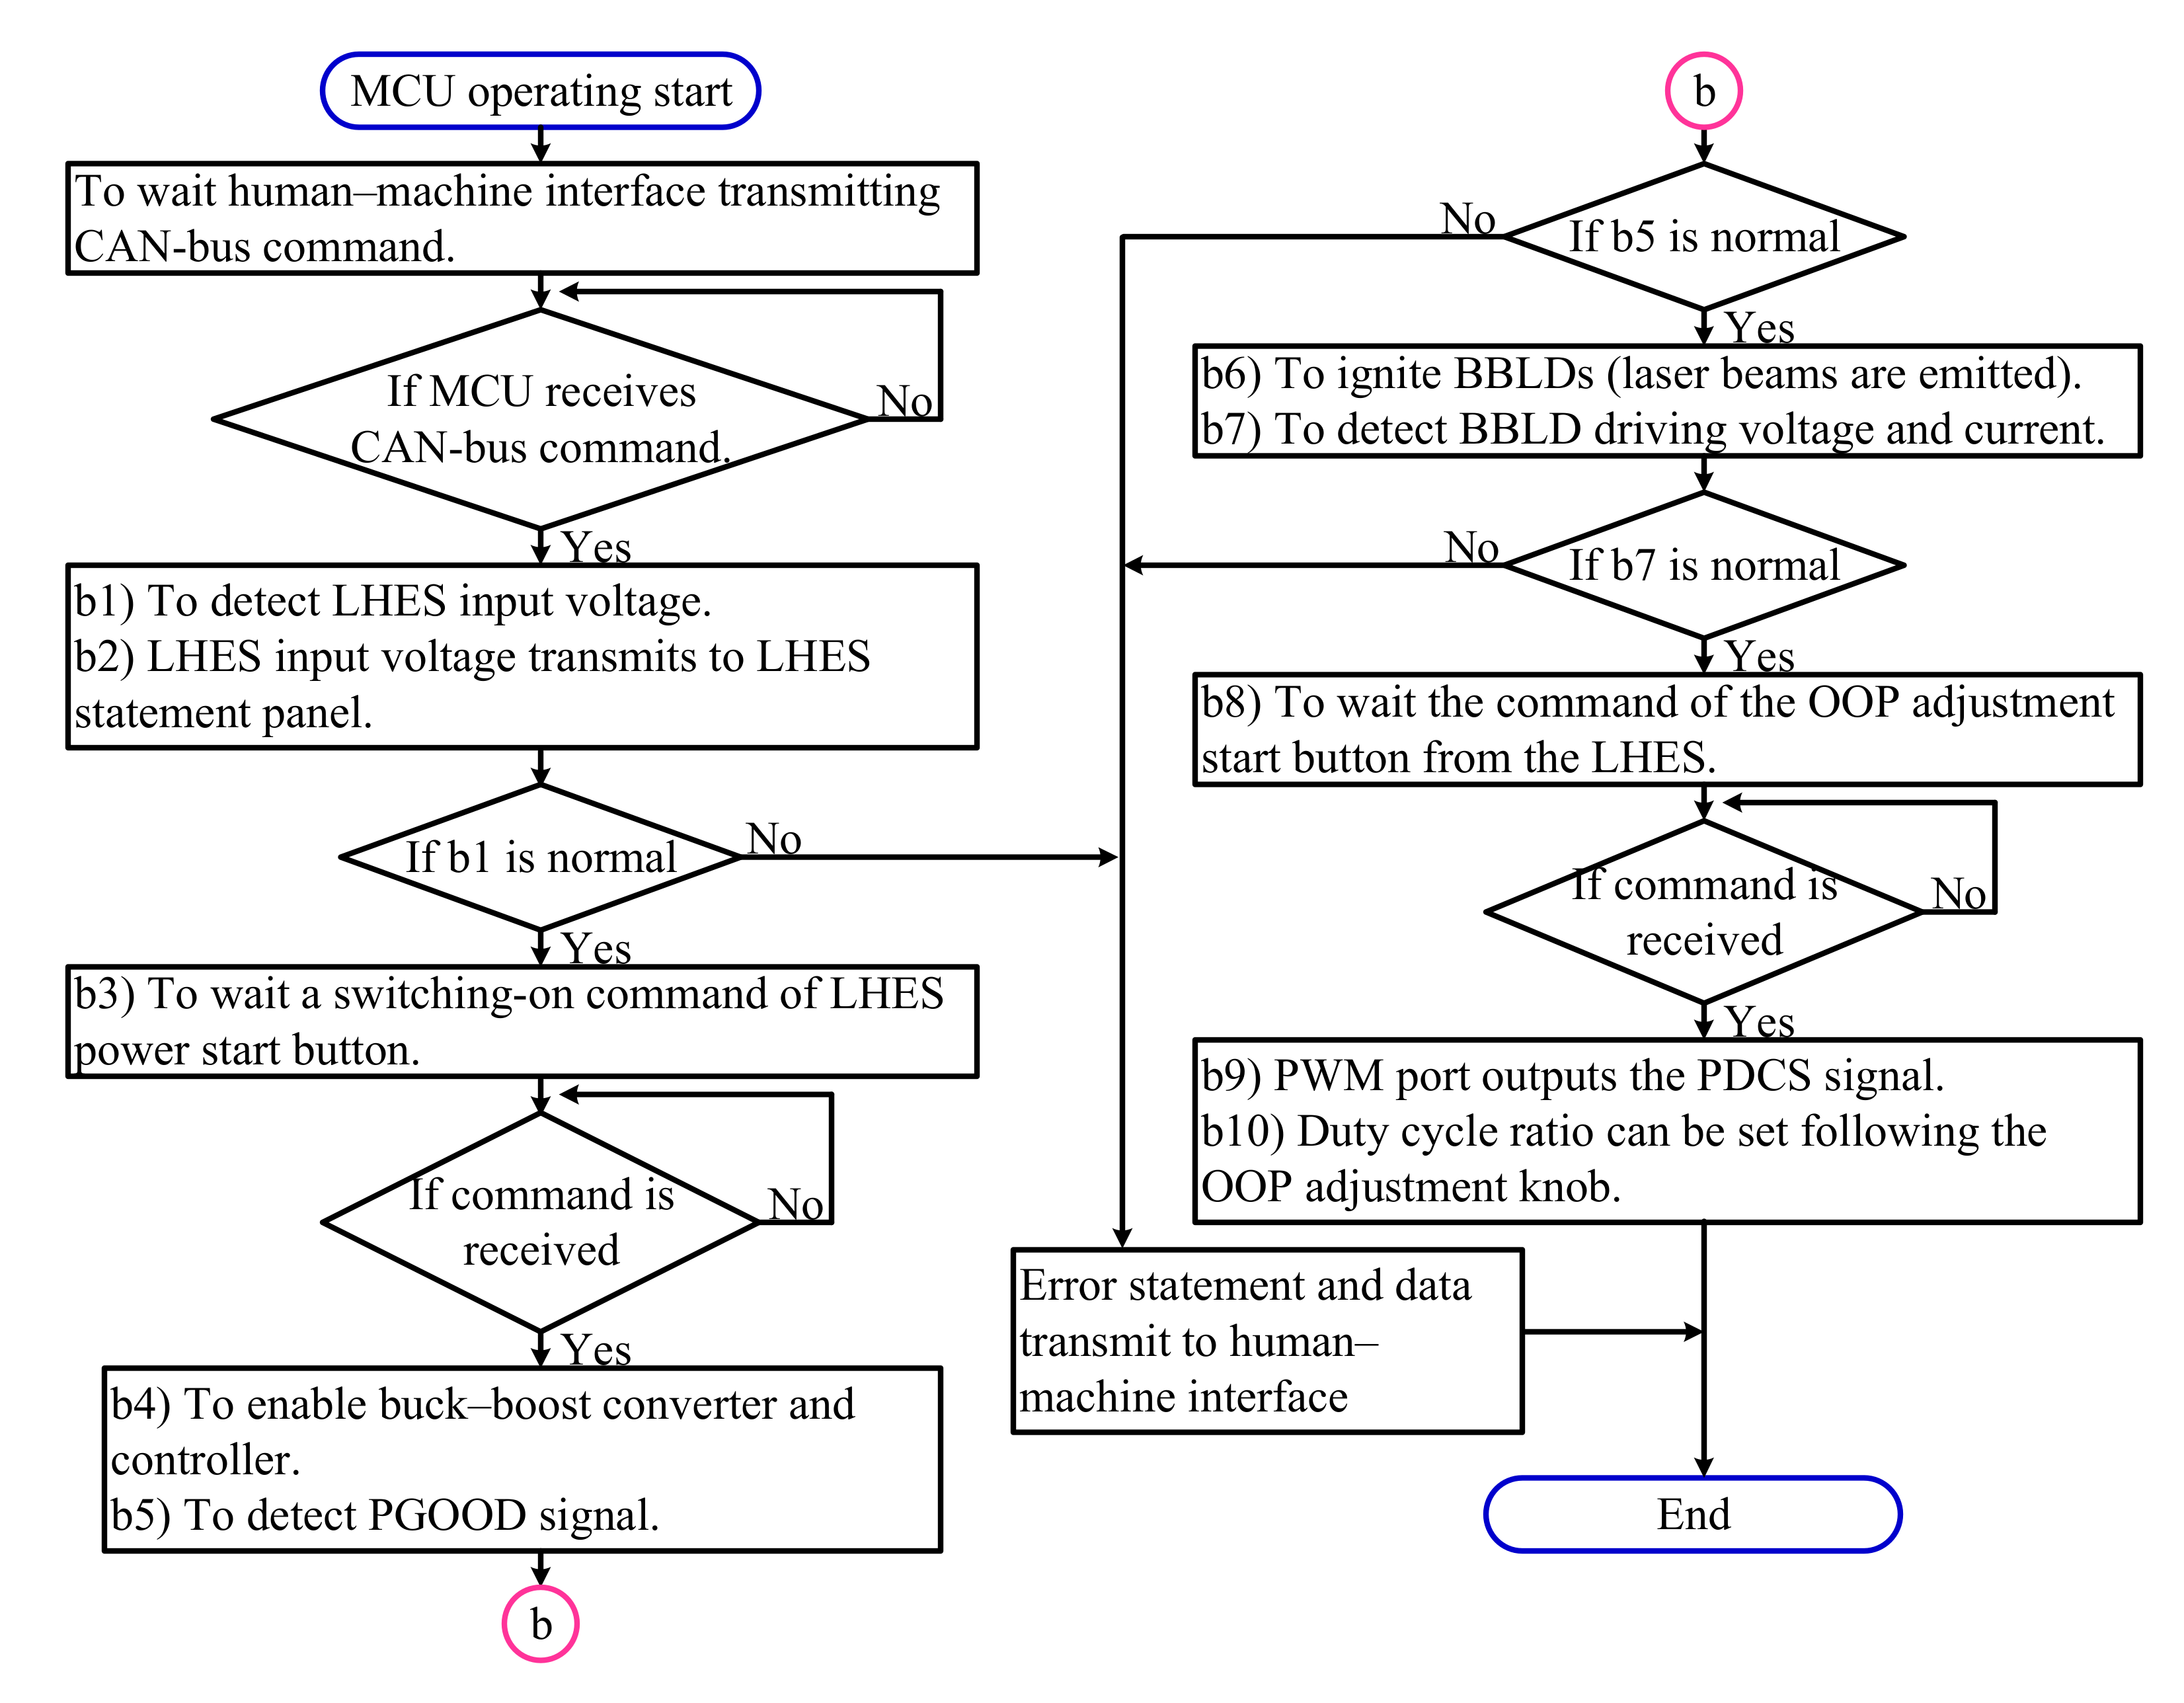
The software flowchart for the human–machine interface of LabVIEW is depicted in Figure 5. First of all, users must operate the manipulation panel to set the CAN-bus channel, baud rate and data length, and then the CAN-bus online button can be enabled for switching on/off the LHES. Second of all, when the CAN-bus online button is switched on, the computer begins communicating with the LHES by using the CAN-bus. The LabVIEW program determines whether the LHES input voltage is between 9 and 16 V. If the LHES input voltage is in the range of 9–16 V, the LHES power start button can be enabled; otherwise, an error message will be occurred to notify the user. When the LHES start power button is switched on, the LHES can be enabled by entering the normal operation to detect a PGOOD signal from the buck–boost controller. When the PGOOD signal is received, and the buck–boost converter with its controller is normal, BBLDs can be ignited, and the driving voltage and current of BBLDs can be detected by the MCU. If the driving voltage and current are normal, then the OOP adjustment start button can be enabled; otherwise, an error message can be occurred to notify the user. When the OOP adjustment start button is switched on, the OOP adjustment knob can be enabled. Finally, the duty cycle time of the PDCS (Figure 1) can be changed by adjusting the knob.

2.7. Software Flowchart of MCU

The software flowchart for the MCU firmware of the LHES is depicted in Figure 6. When the power from the on-board battery supplies to the LHES, the MCU can start its normal work, and it waits for the human–machine interface command. When the MCU receives the command by the CAN-bus, it starts to detect the LHES input voltage, which can be transmitted to the LHES statement panel for displaying the LHES input voltage; if the LHES input voltage is between the 9 to 16 V, the MCU can wait for the next operating command from the human–machine interface; otherwise, the human–machine interface displays an error message because the LHES input voltage exceeds the range of 9–16 V. When the MCU receives the switching-on command of the LHES power start button, the buck–boost controller of the LHES can be enabled; thus, the buck–boost converter with its controller can diagnose itself and output a PGOOD signal. When the buck–boost converter and controller are in normal operation, the MCU can receive the PGOOD signal from the buck–boost controller; then, the BBLD can be ignited. When the BBLD is driven by the LHES, the MCU can detect the BBLD’s driving voltage and current. When the BBLD driving voltage is between 14 and 18 V, and the BBLD driving current is between 1.08 and 1.32 A, both ranges represent that the BBLD operation is unproblematic. Therefore, the MCU can wait for the next command from the human–machine interface. When the MCU receives the switching-on command of the OOP adjustment start button, and the OOP adjustment knob is set, the MCU can adjust the duty cycle ratio of the PDCS to achieve the PDCM for OOP adjustment.

3. Measurement System and LHES Specification

The measurement system is depicted in Figure 7. The BBLD OOPs at different temperatures can be observed when the LHES used PDCM of average current modulation.
Two practical situations influenced the electro-optic characteristic of the BBLD: First, three BBLDs were connected in series and the BBLD1, BBLD2, and BBLD3 were the commercial mass productions. Although they were the same model number, their electrical characteristics were not exactly the same. Second, to measure the electro-optic characteristics of the three BBLDs, the three laser diode modules were placed inside an ambient temperature testing chamber, and the LHES was placed outside an ambient temperature testing chamber. The outside LHES must connect with the inside three BBLDs using the long conducting wires. The wire resistances of the long conducting wires resulted in voltage drops. Therefore, the different electrical characteristics of BBLDs and conducting wire resistances can influence the electro-optic characteristics of the BBLD1, BBLD2 and BBLD3.

3.1. Measurement System

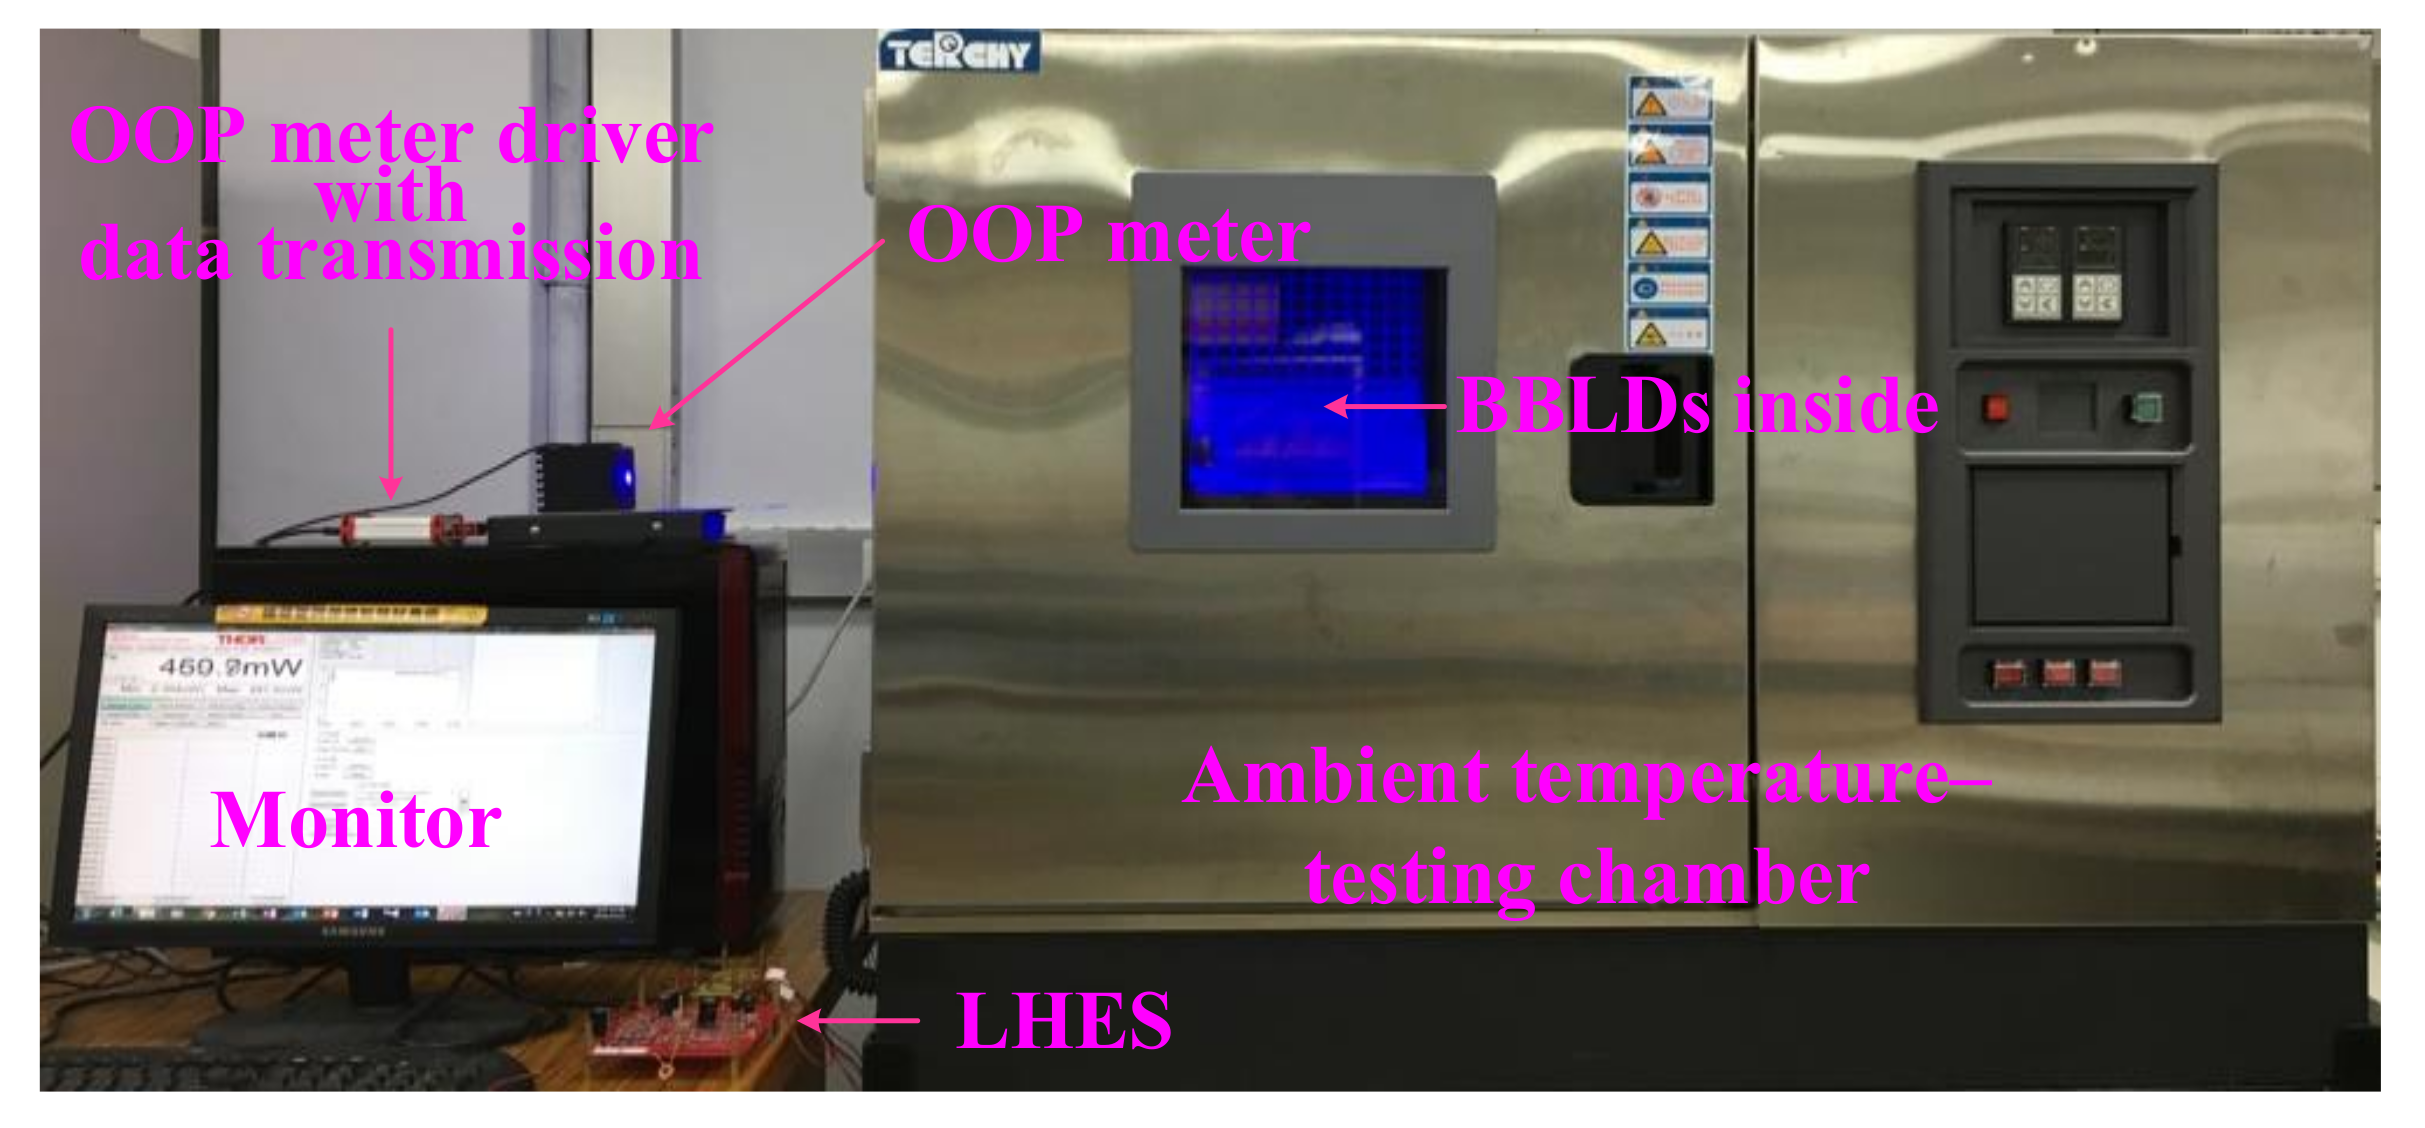
In Figure 7a, the measurement system was presented to include a lead–acid battery, an LHES, three laser diode modules (namely BBLDs, condensing lens and heat-sinks), an OOP meter, an OOP meter driver with data transmission and a computer. The three laser diode modules were placed inside an ambient temperature testing chamber. For measuring the electrical and optical characteristics of the BBLDs at different temperatures, OOPs of laser beams from BBLD emissions can be measured using the OOP meter. Moreover, the OOP meter driver can supply the driving power of the OOP meter; the OOP meter was used to detect the BBLD OOPs. The OOP measurement data were transmitted to the computer through the OOP meter driver with data transmission; the OOP data can be displayed on the computer monitor.
Furthermore, the LHES and lead–acid battery can be replaced with a DC power supply to implement the average current modulation, as shown in Figure 7b. The aforementioned measurement procedures can be continued using to measure the electrical and optical characteristics of the BBLDs at different temperatures.

3.2. LHES Specification

The LHES specifications of the buck and buck–boost converters (Figure 1) are listed in Table 3. The employed electronic elements are listed in Table 4.

4. Experimental Results

In this study, the electrical and optical variations of the three BBLDs were recorded under different temperature operations. According to the measurement system in Figure 7, three BBLDs were connected in series; the corresponding current can drive all BBLDs. Moreover, the model number of the BBLD was PL TB405B, which was mass production; however, different BBLDs would engender different electrical and optical characteristics. The average current modulation and PDCM were used. Measurement and experimental results were revealed in the following.

4.1. OOP of Average-Current Modulation

The three BBLDs were driven by varying the average current from 0.12 A to 1.2 A. BBLDs’ OOPs at different temperatures were recorded, as shown in Figure 8. From the observation in Figure 8, several phenomena are discussed in the following.
The OOPs and average currents presented a linear increase, and the OOPs were proportional to the average currents.
The three BBLDs exhibited maximum OOP at the maximum average current of 1.2 A and the lowest temperature of −20 °C.
At an equivalent average current, when the temperatures were increased, the OOPs at the highest temperature of 40 °C were lower than those at the lowest temperature of −20 °C.

4.2. EOC Efficiency of Average Current Modulation

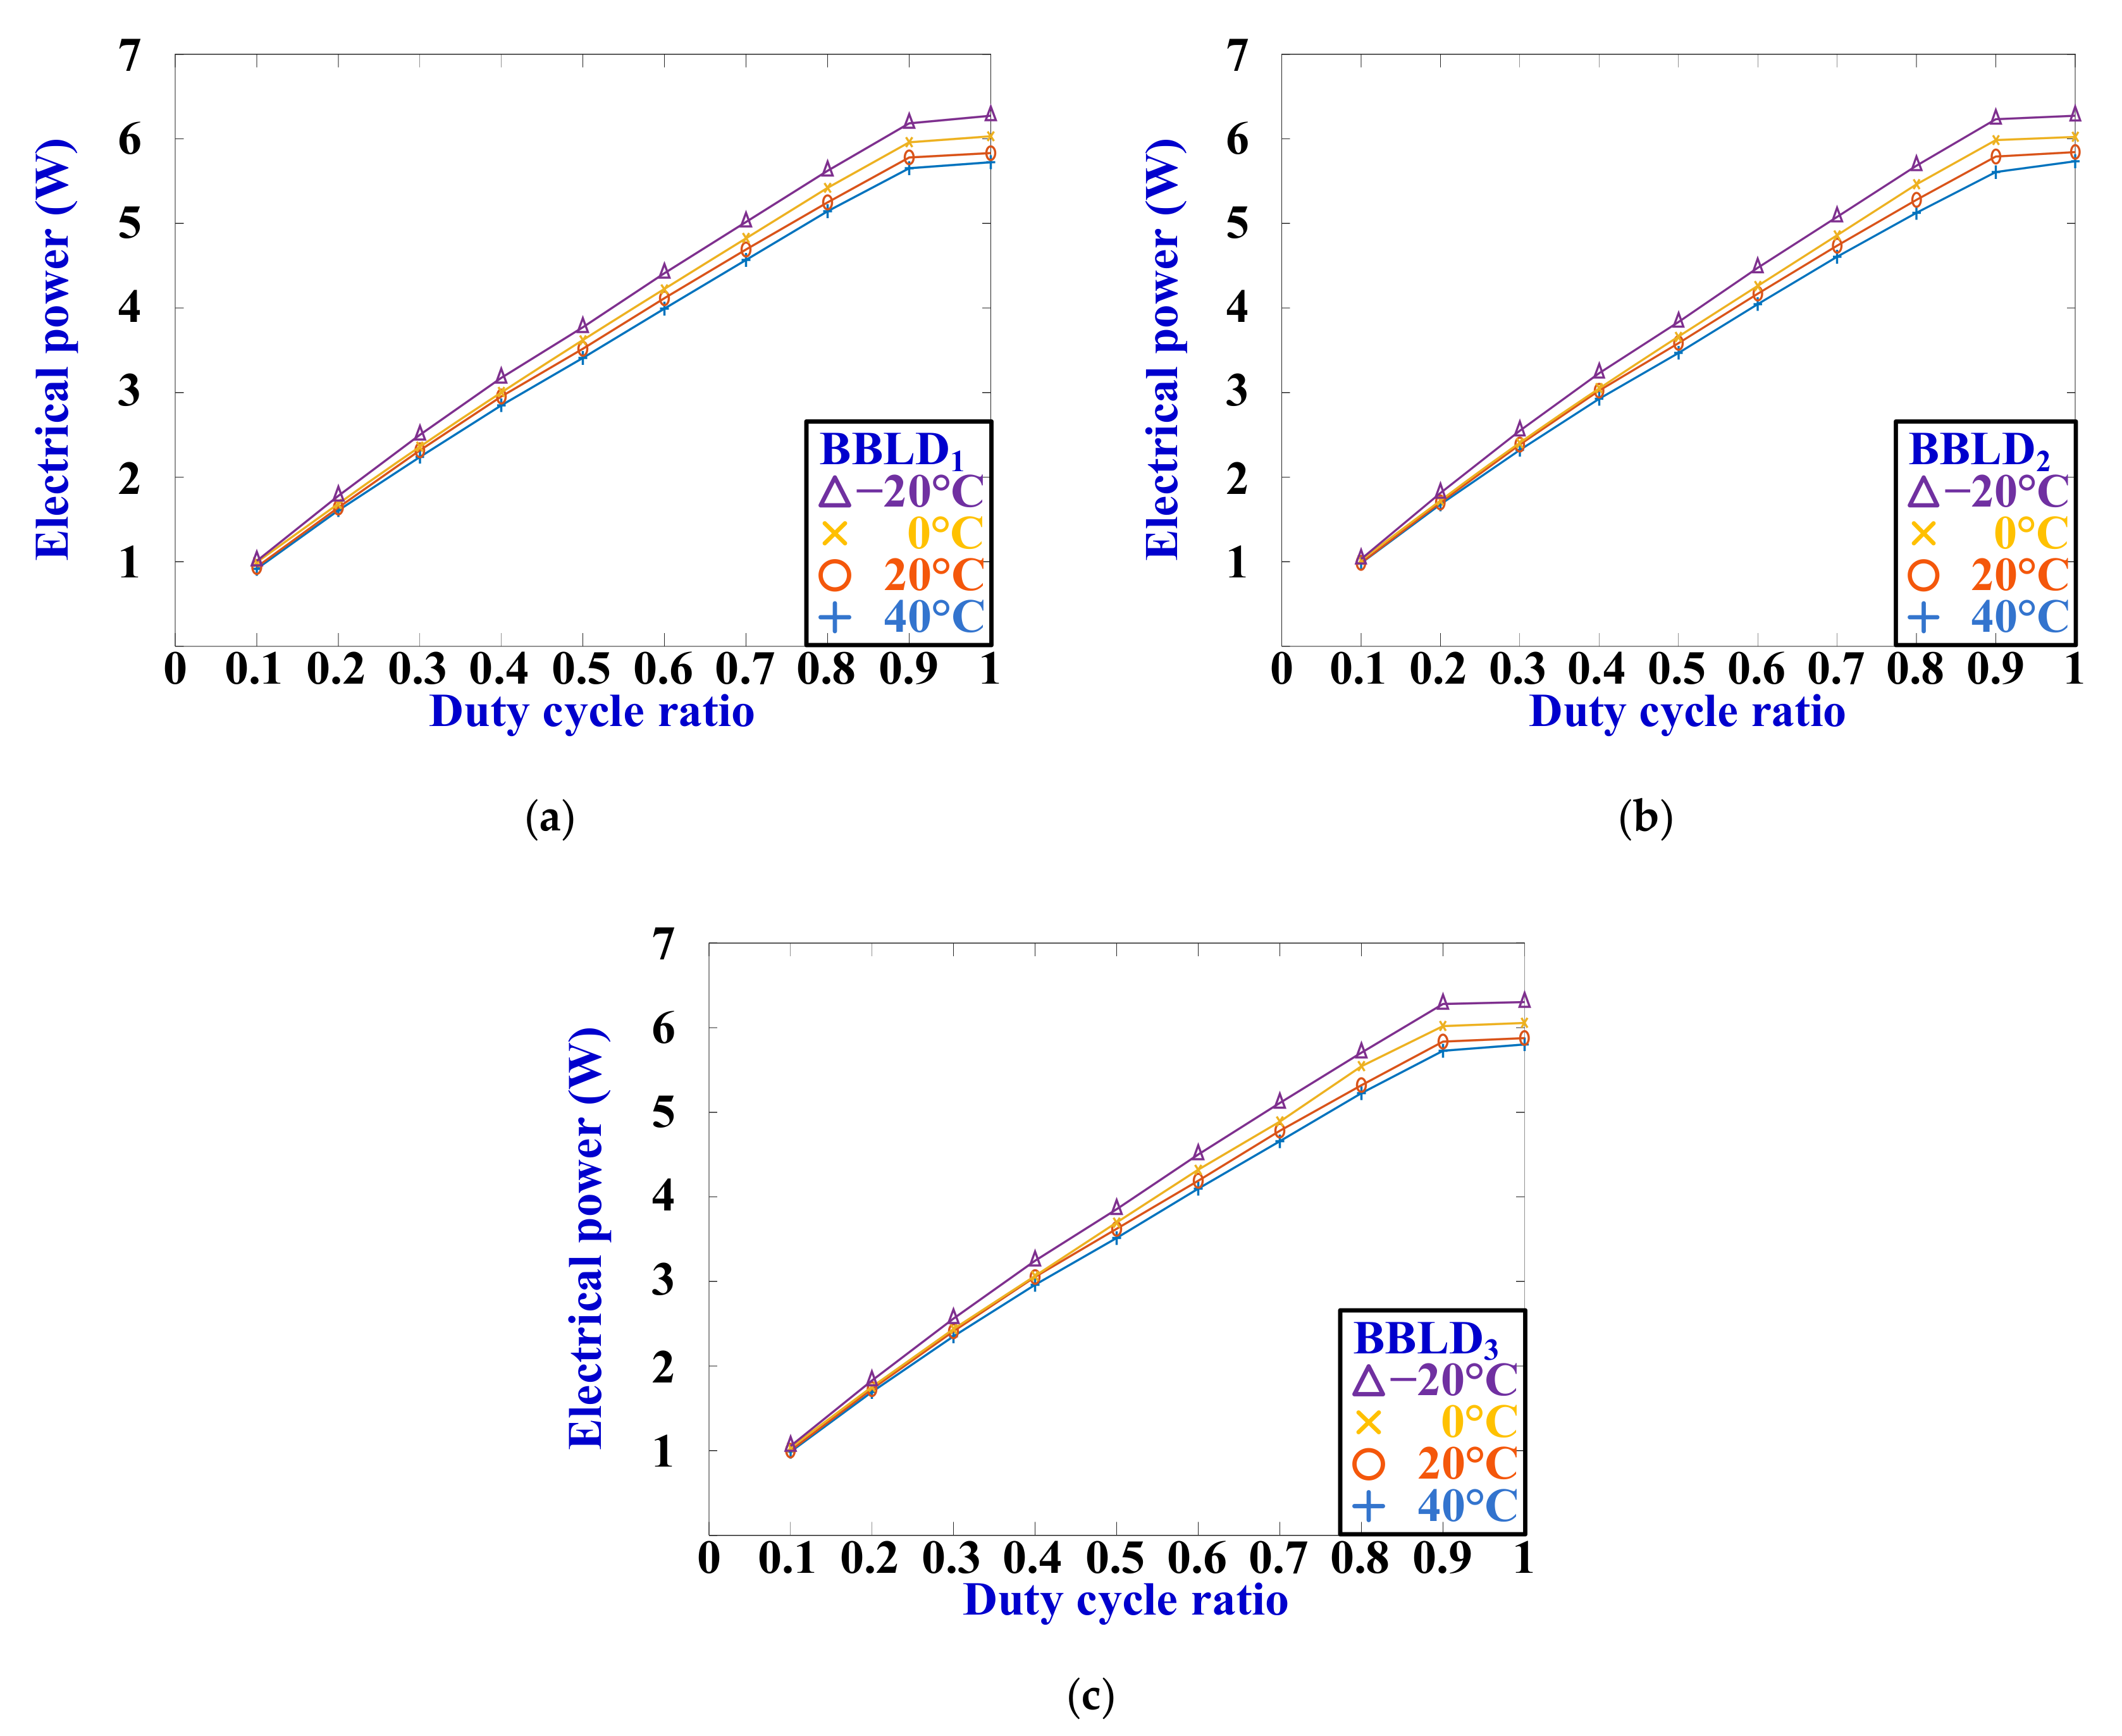
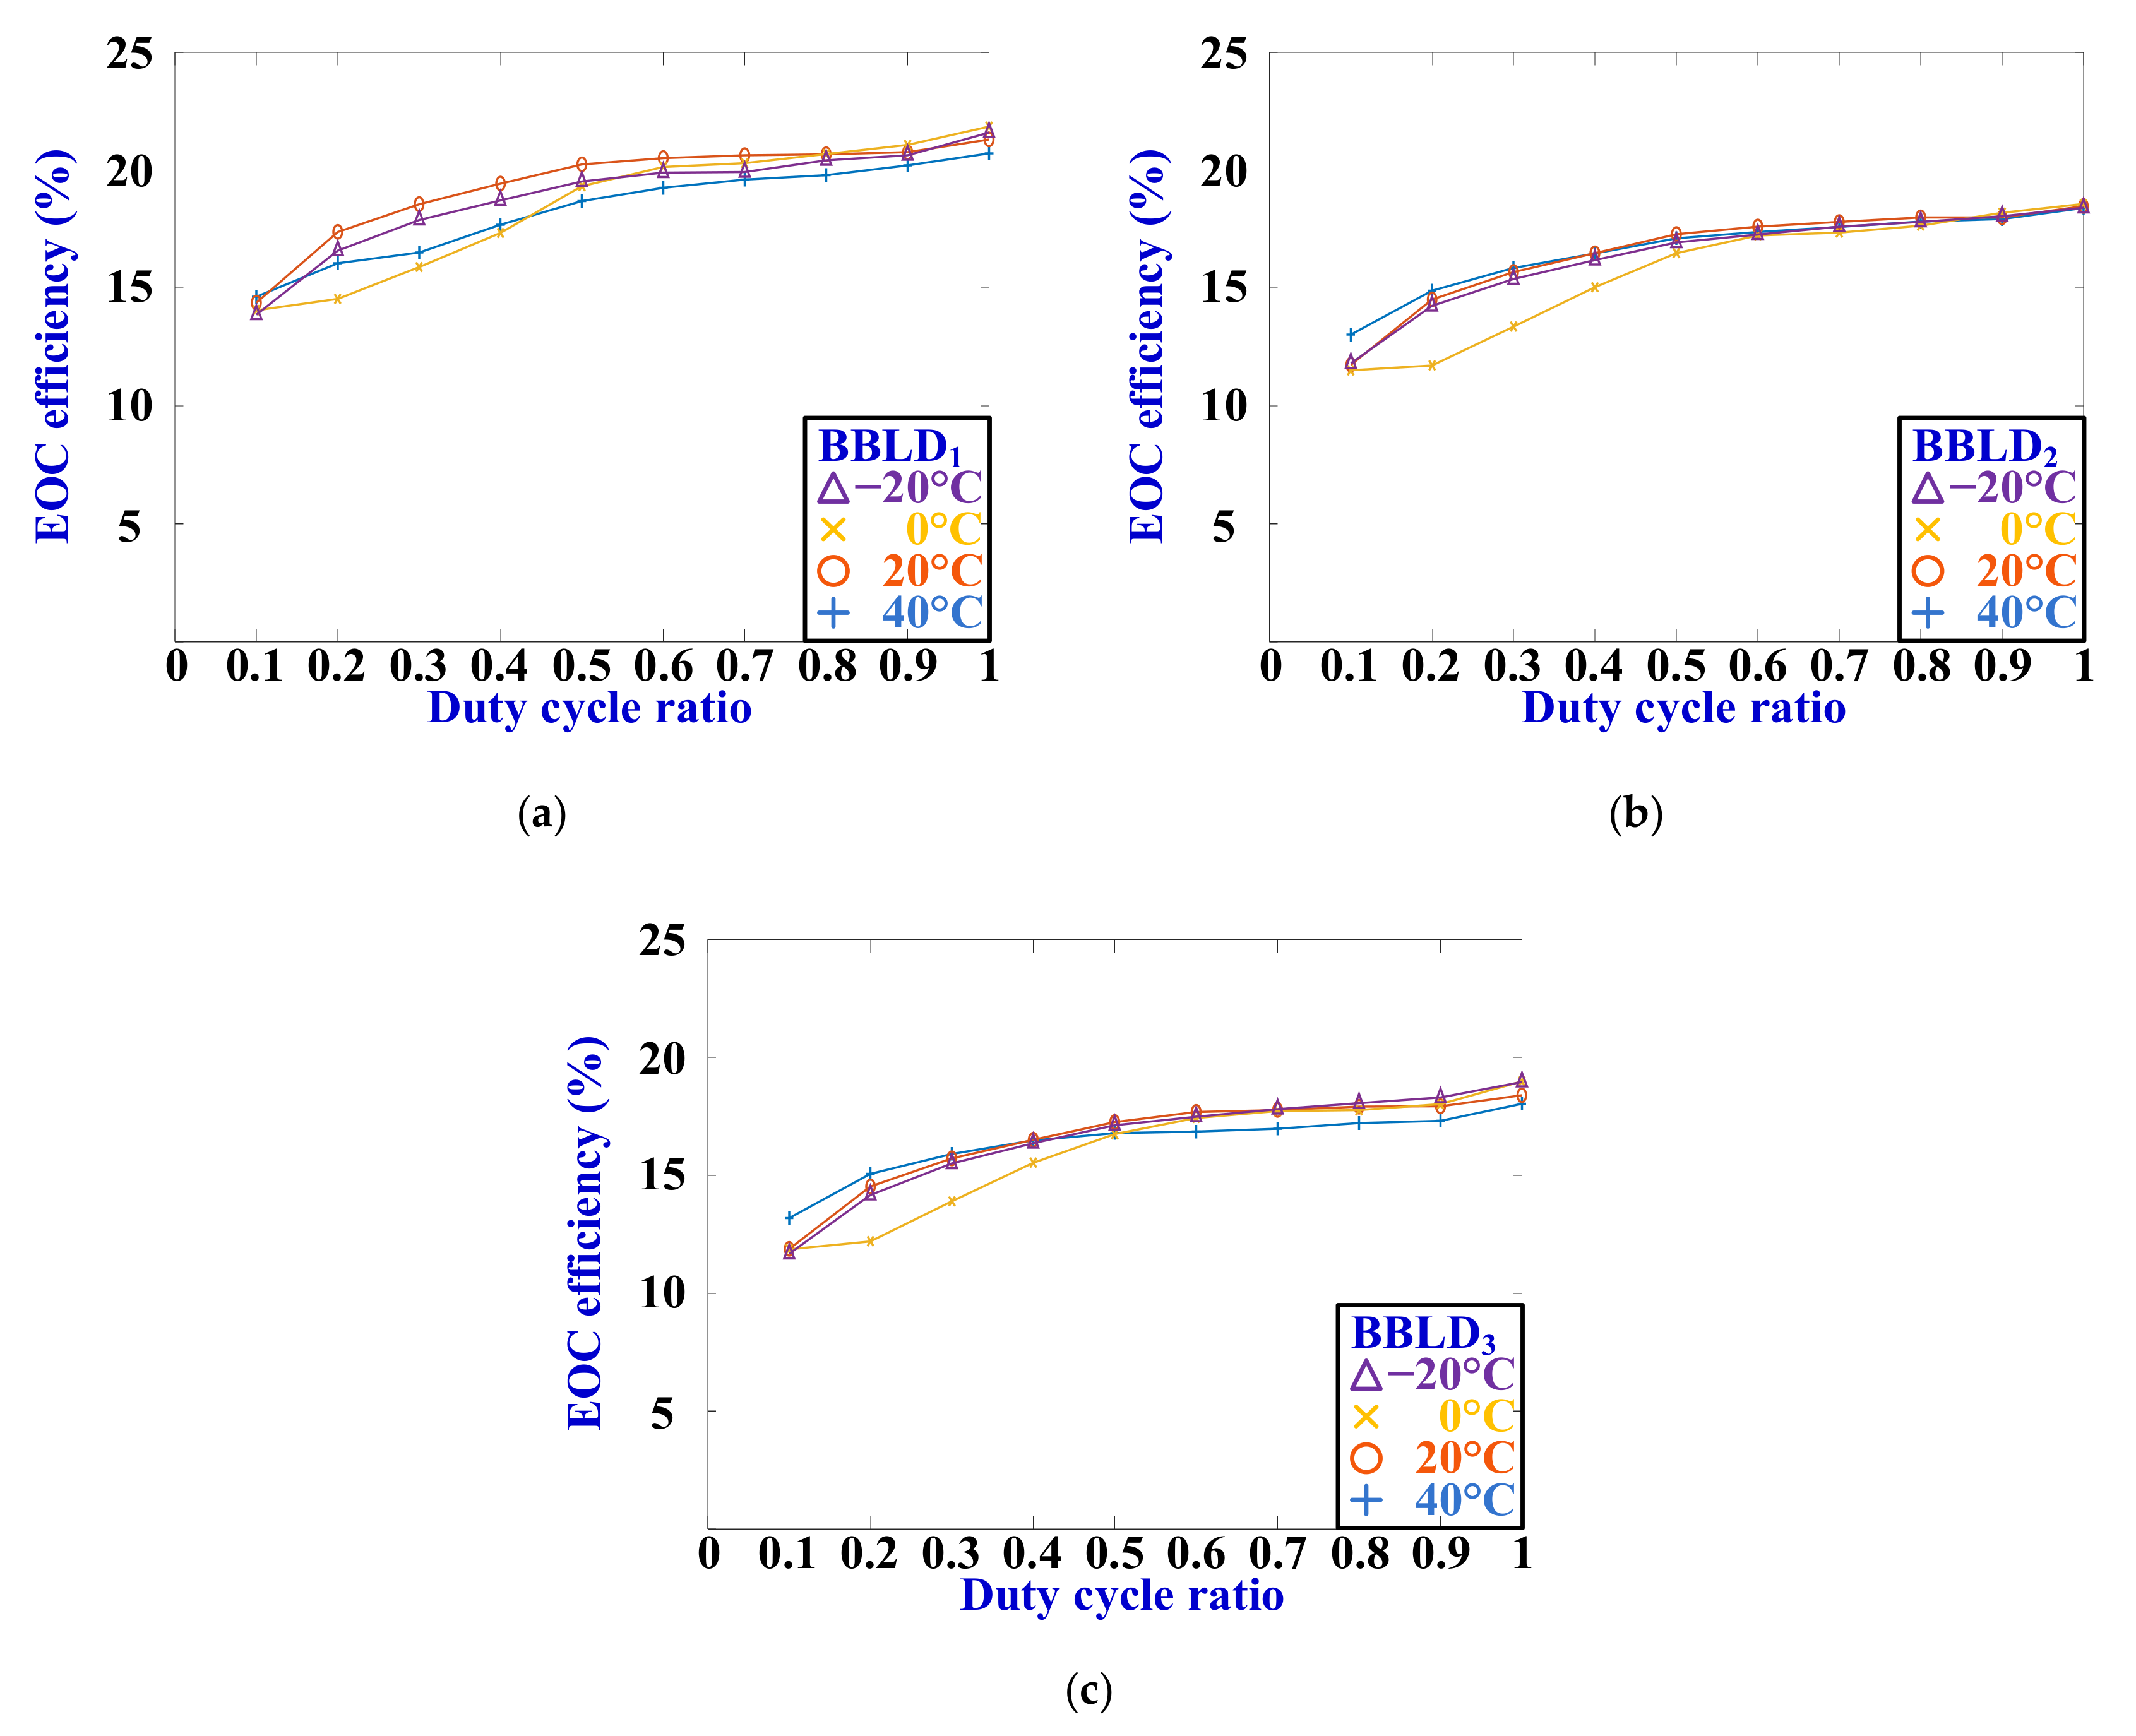
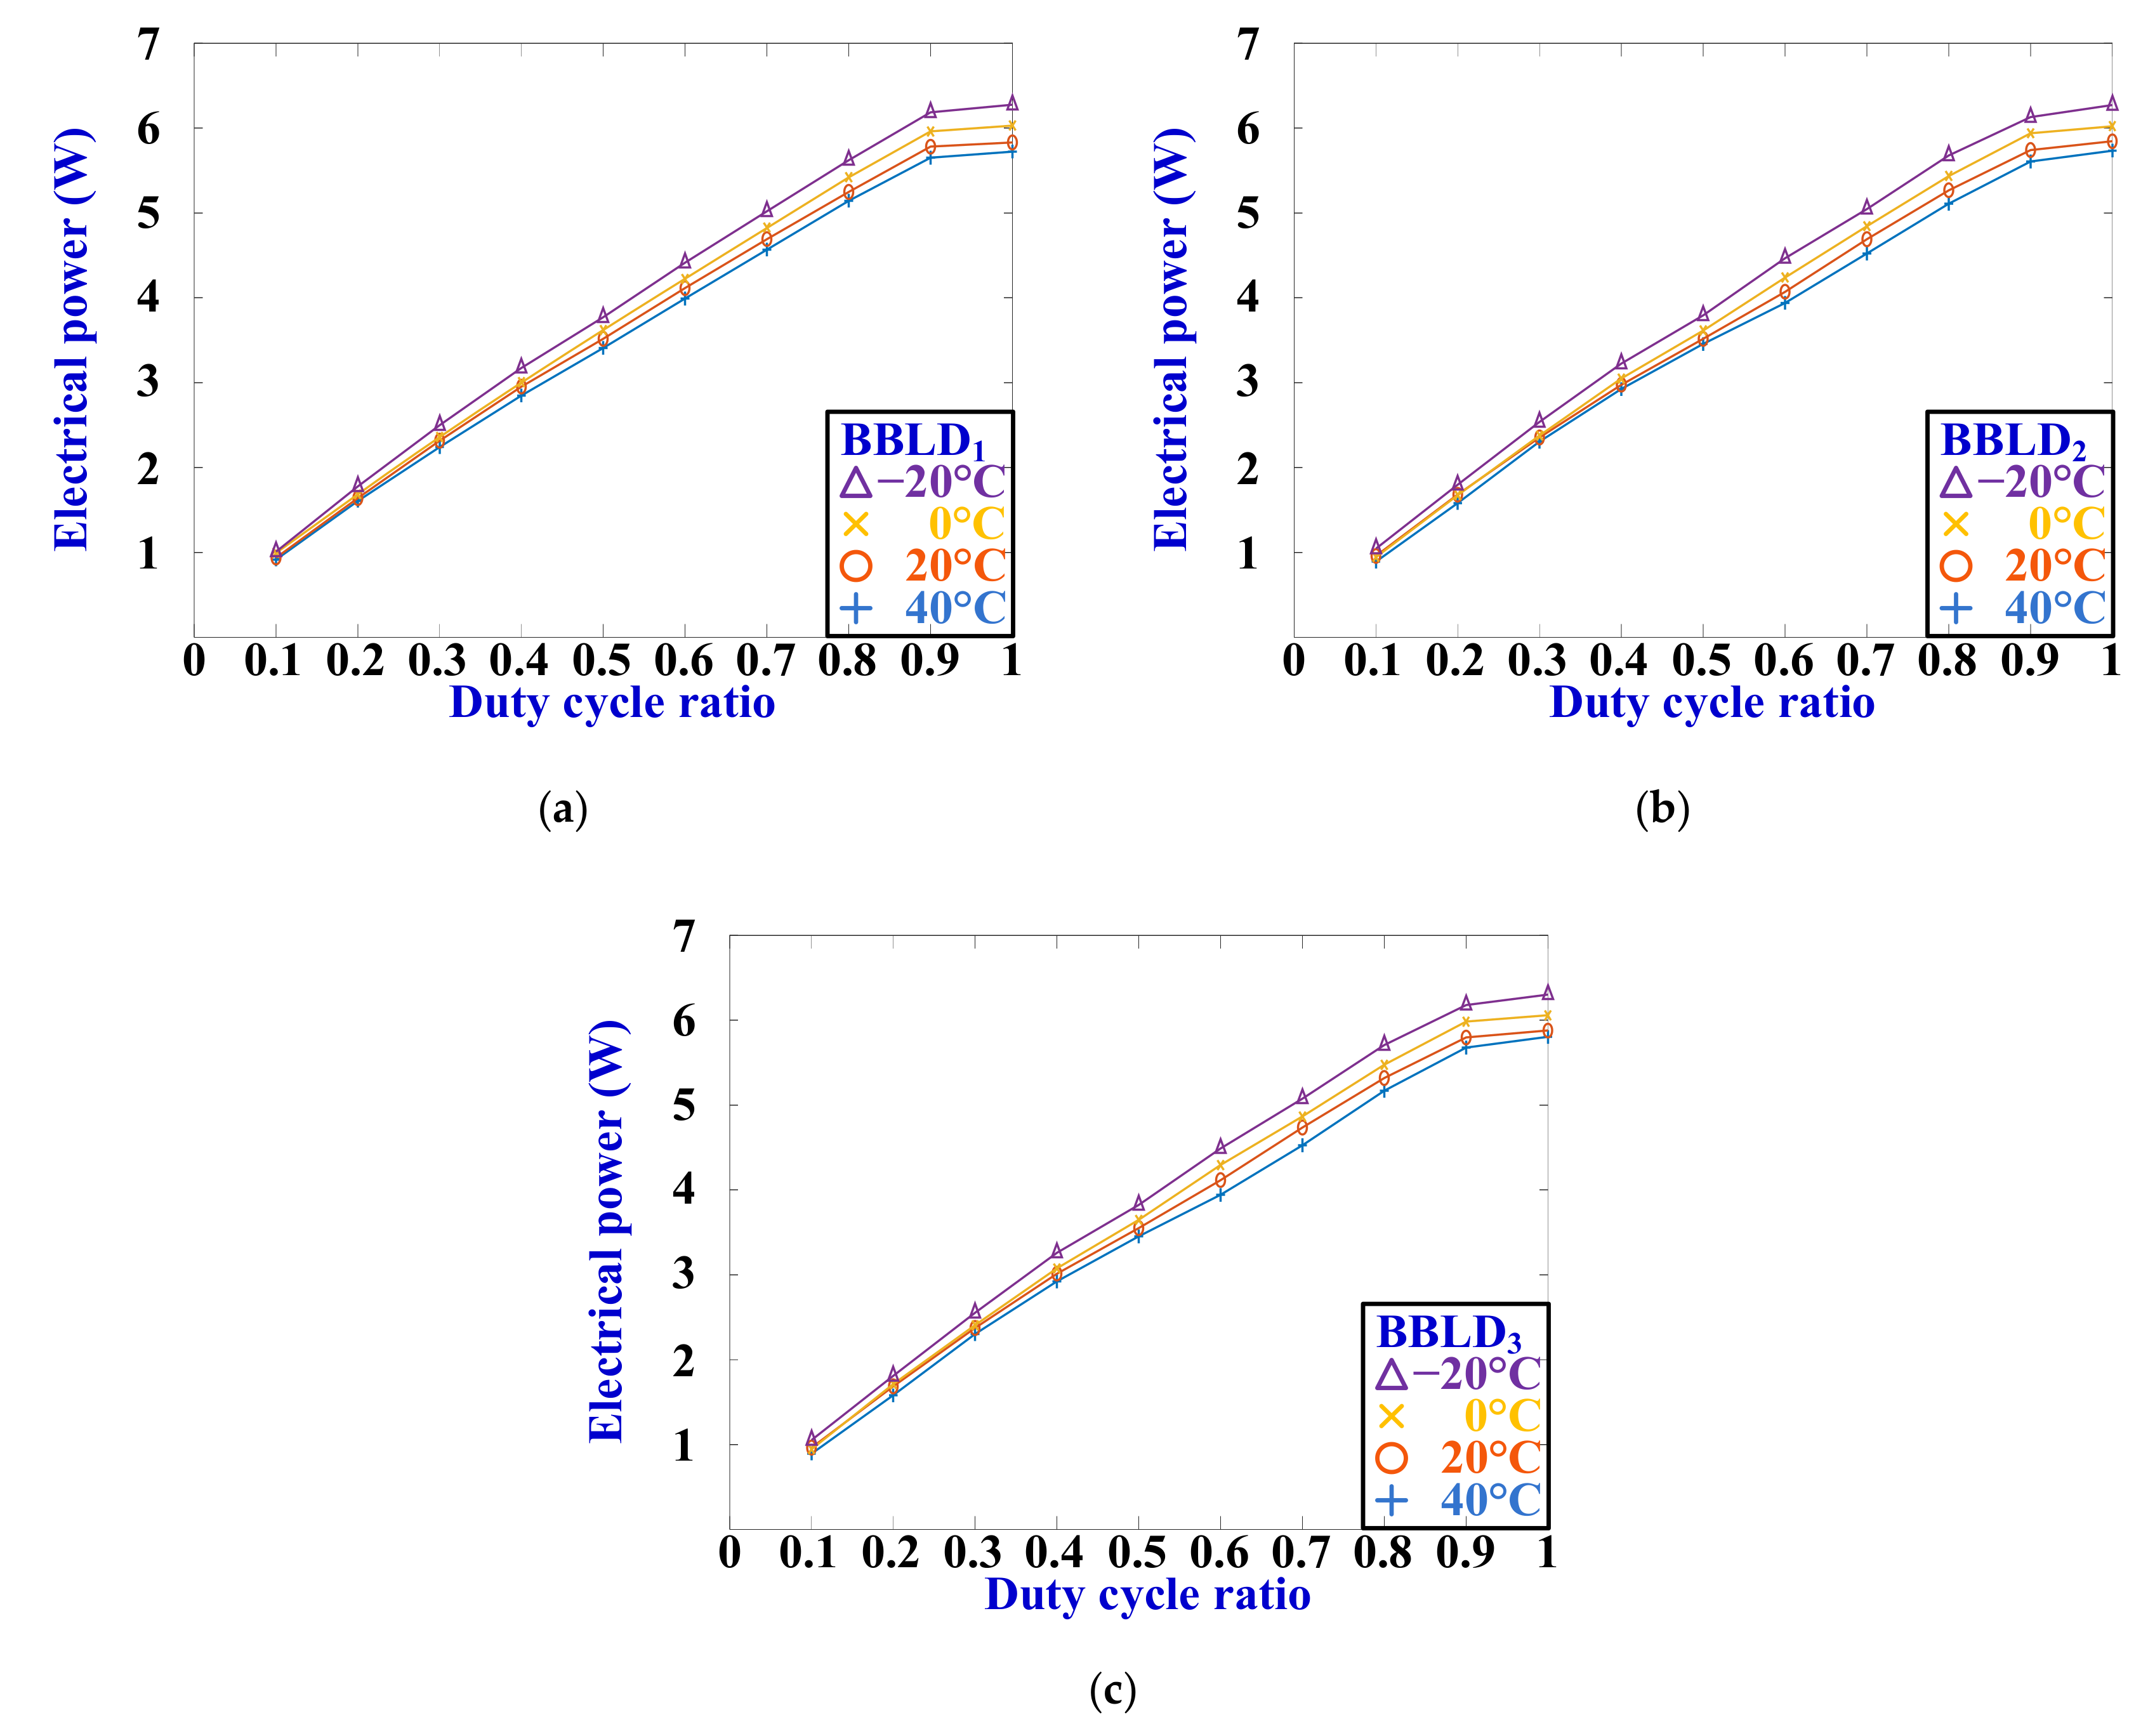
For this measurement, the three BBLDs were driven by varying the average currents from 0.12 A to 1.2 A. Electrical powers, and EOC efficiencies at different temperatures were recorded and estimated in Figure 8 and Figure 9, respectively. When the temperatures varied from low to high, the electrical powers of the BBLDs increased (Figure 9) because the forward-biases of the BBLDs increased with an increase in temperatures. Substituting the measurement data (Figure 7 and Figure 8) into Equation (2) can estimate the EOC efficiencies of the three BBLDs, as shown in Figure 10. From the observation in Figure 10, several phenomena are discussed in the following:
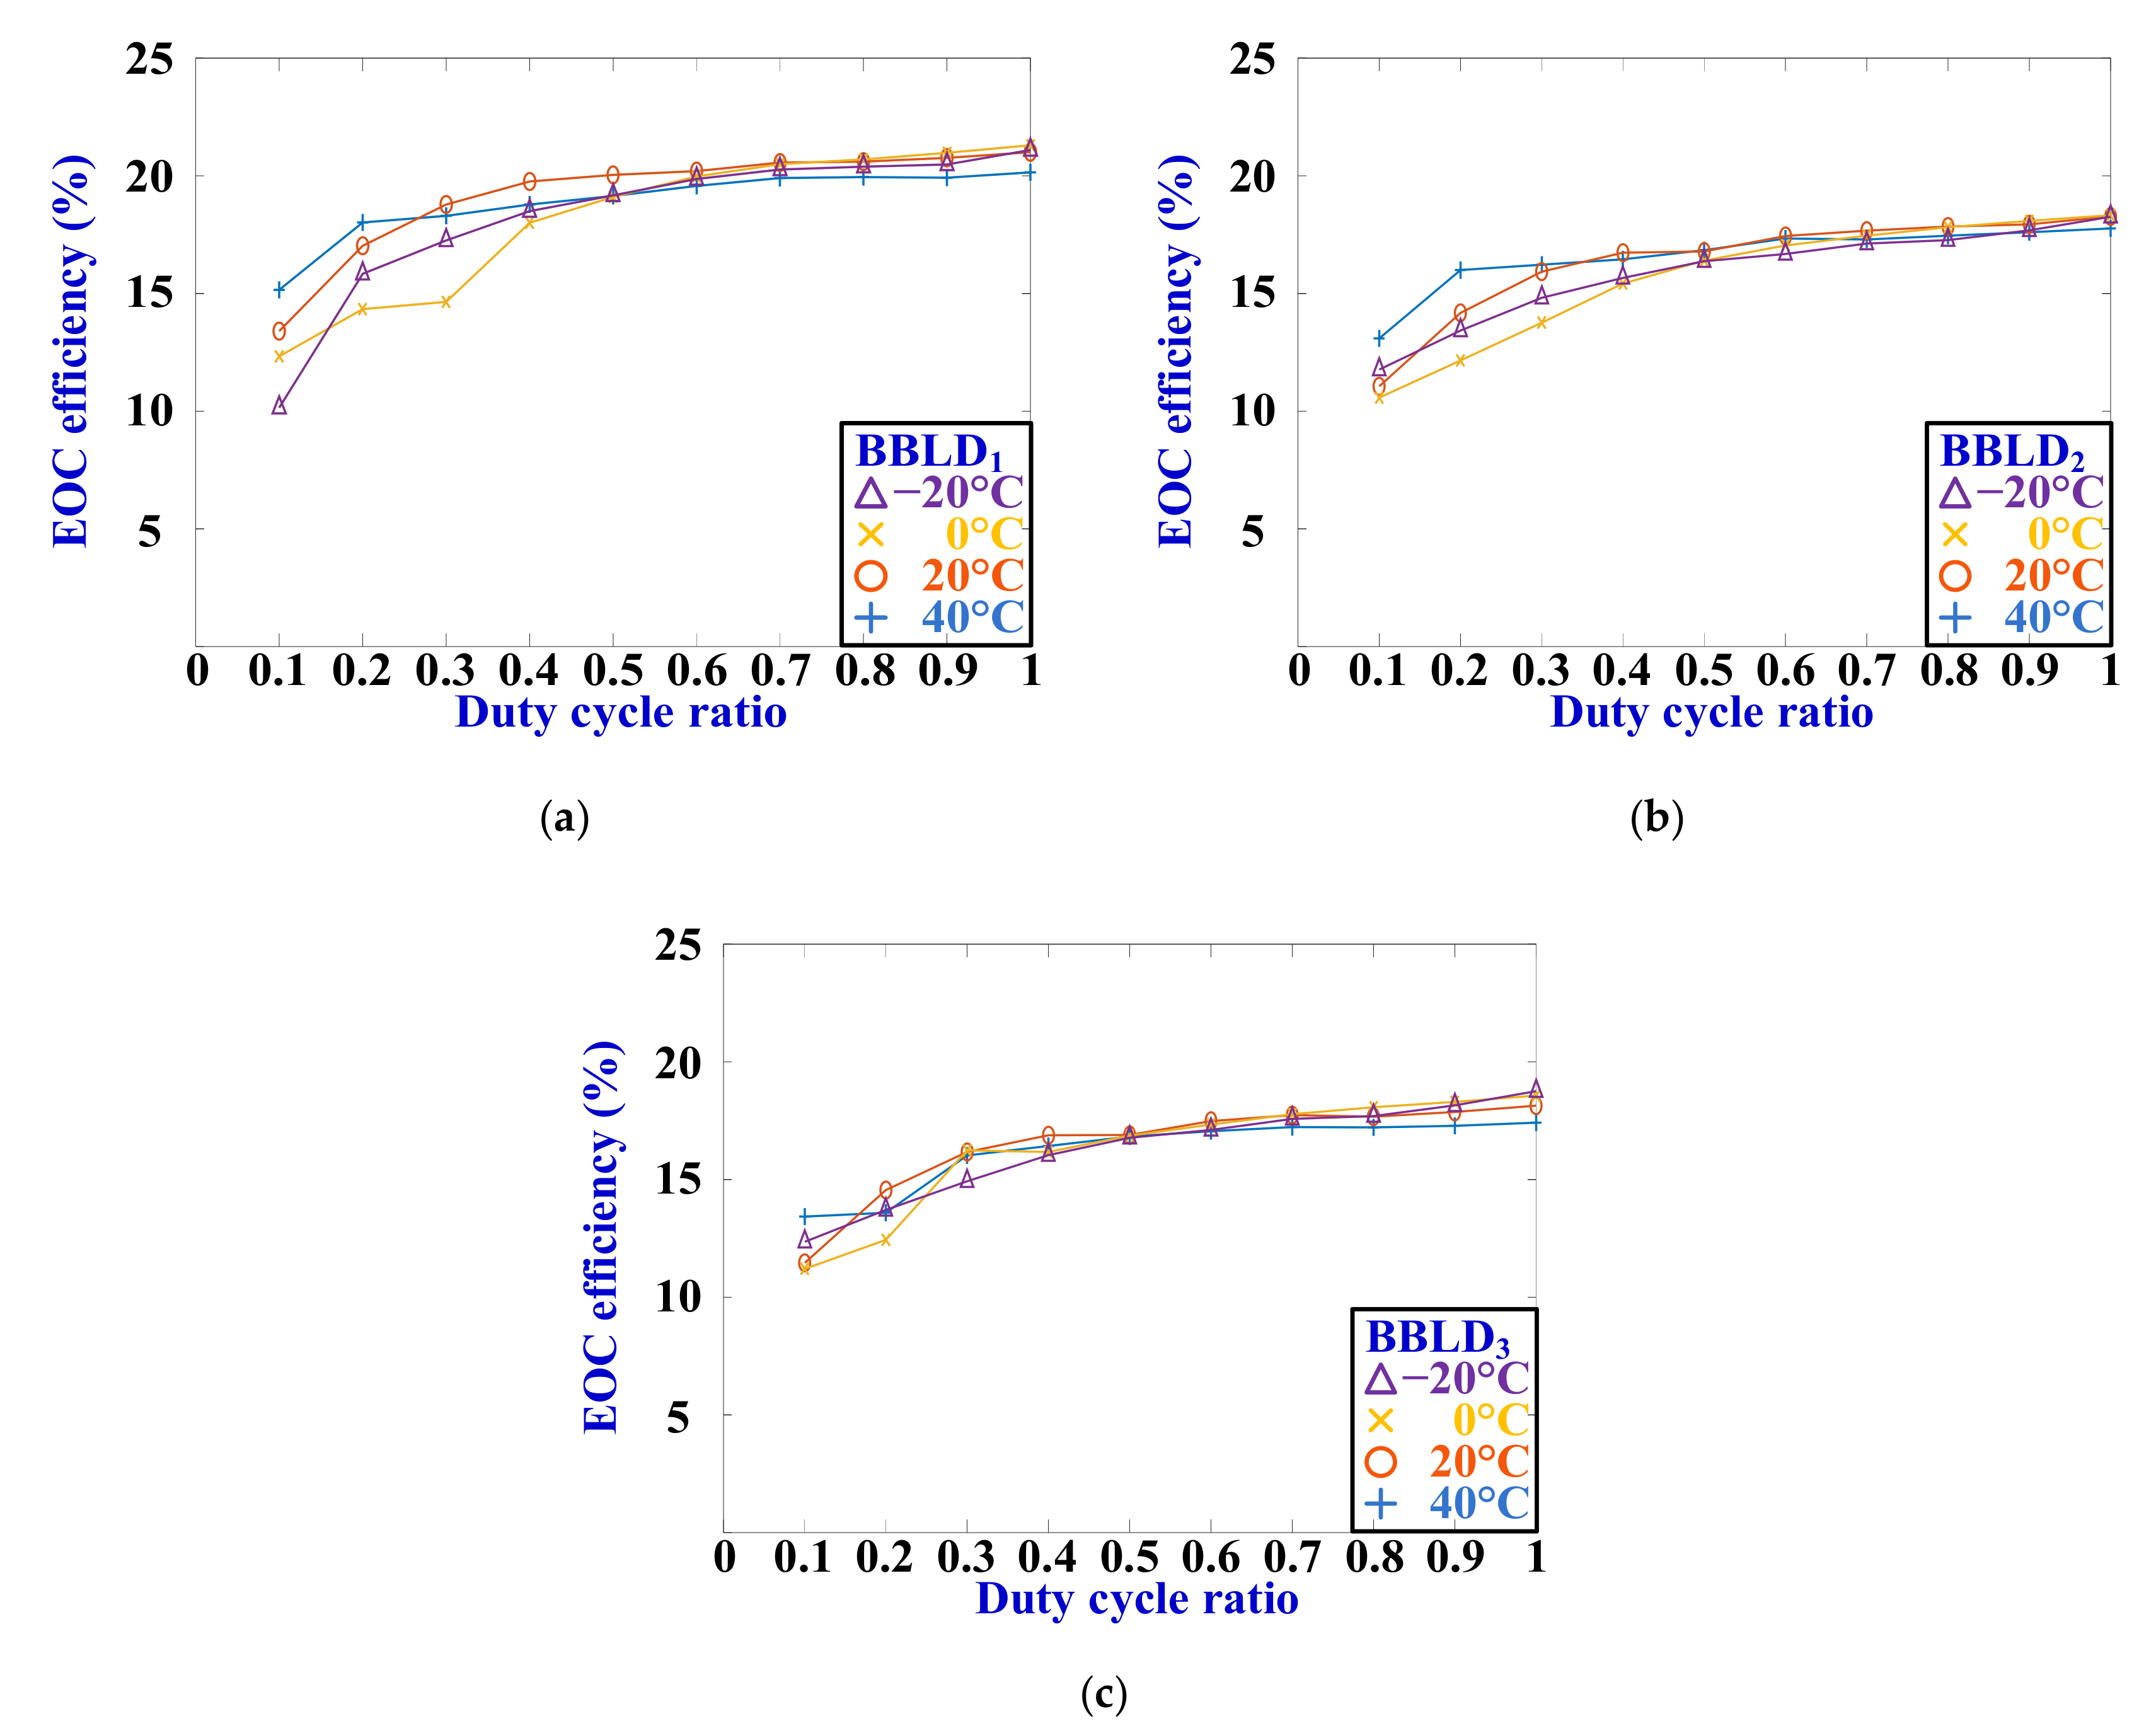
The EOC efficiencies of the three BBLDs can be retained between 17.9% and 21.1% when BBLDs’ driving average currents were higher than 0.6 A;
The EOC efficiencies were abruptly reduced when the average driving currents of the BBLDs were lower than 0.6 A;
The minimum OOP was approximately 0 at the minimum average currents of 0.12 A; this result was highly unfavorable for headlight lighting applications.

4.3. OOP of PDCM at Frequency of 400 Hz

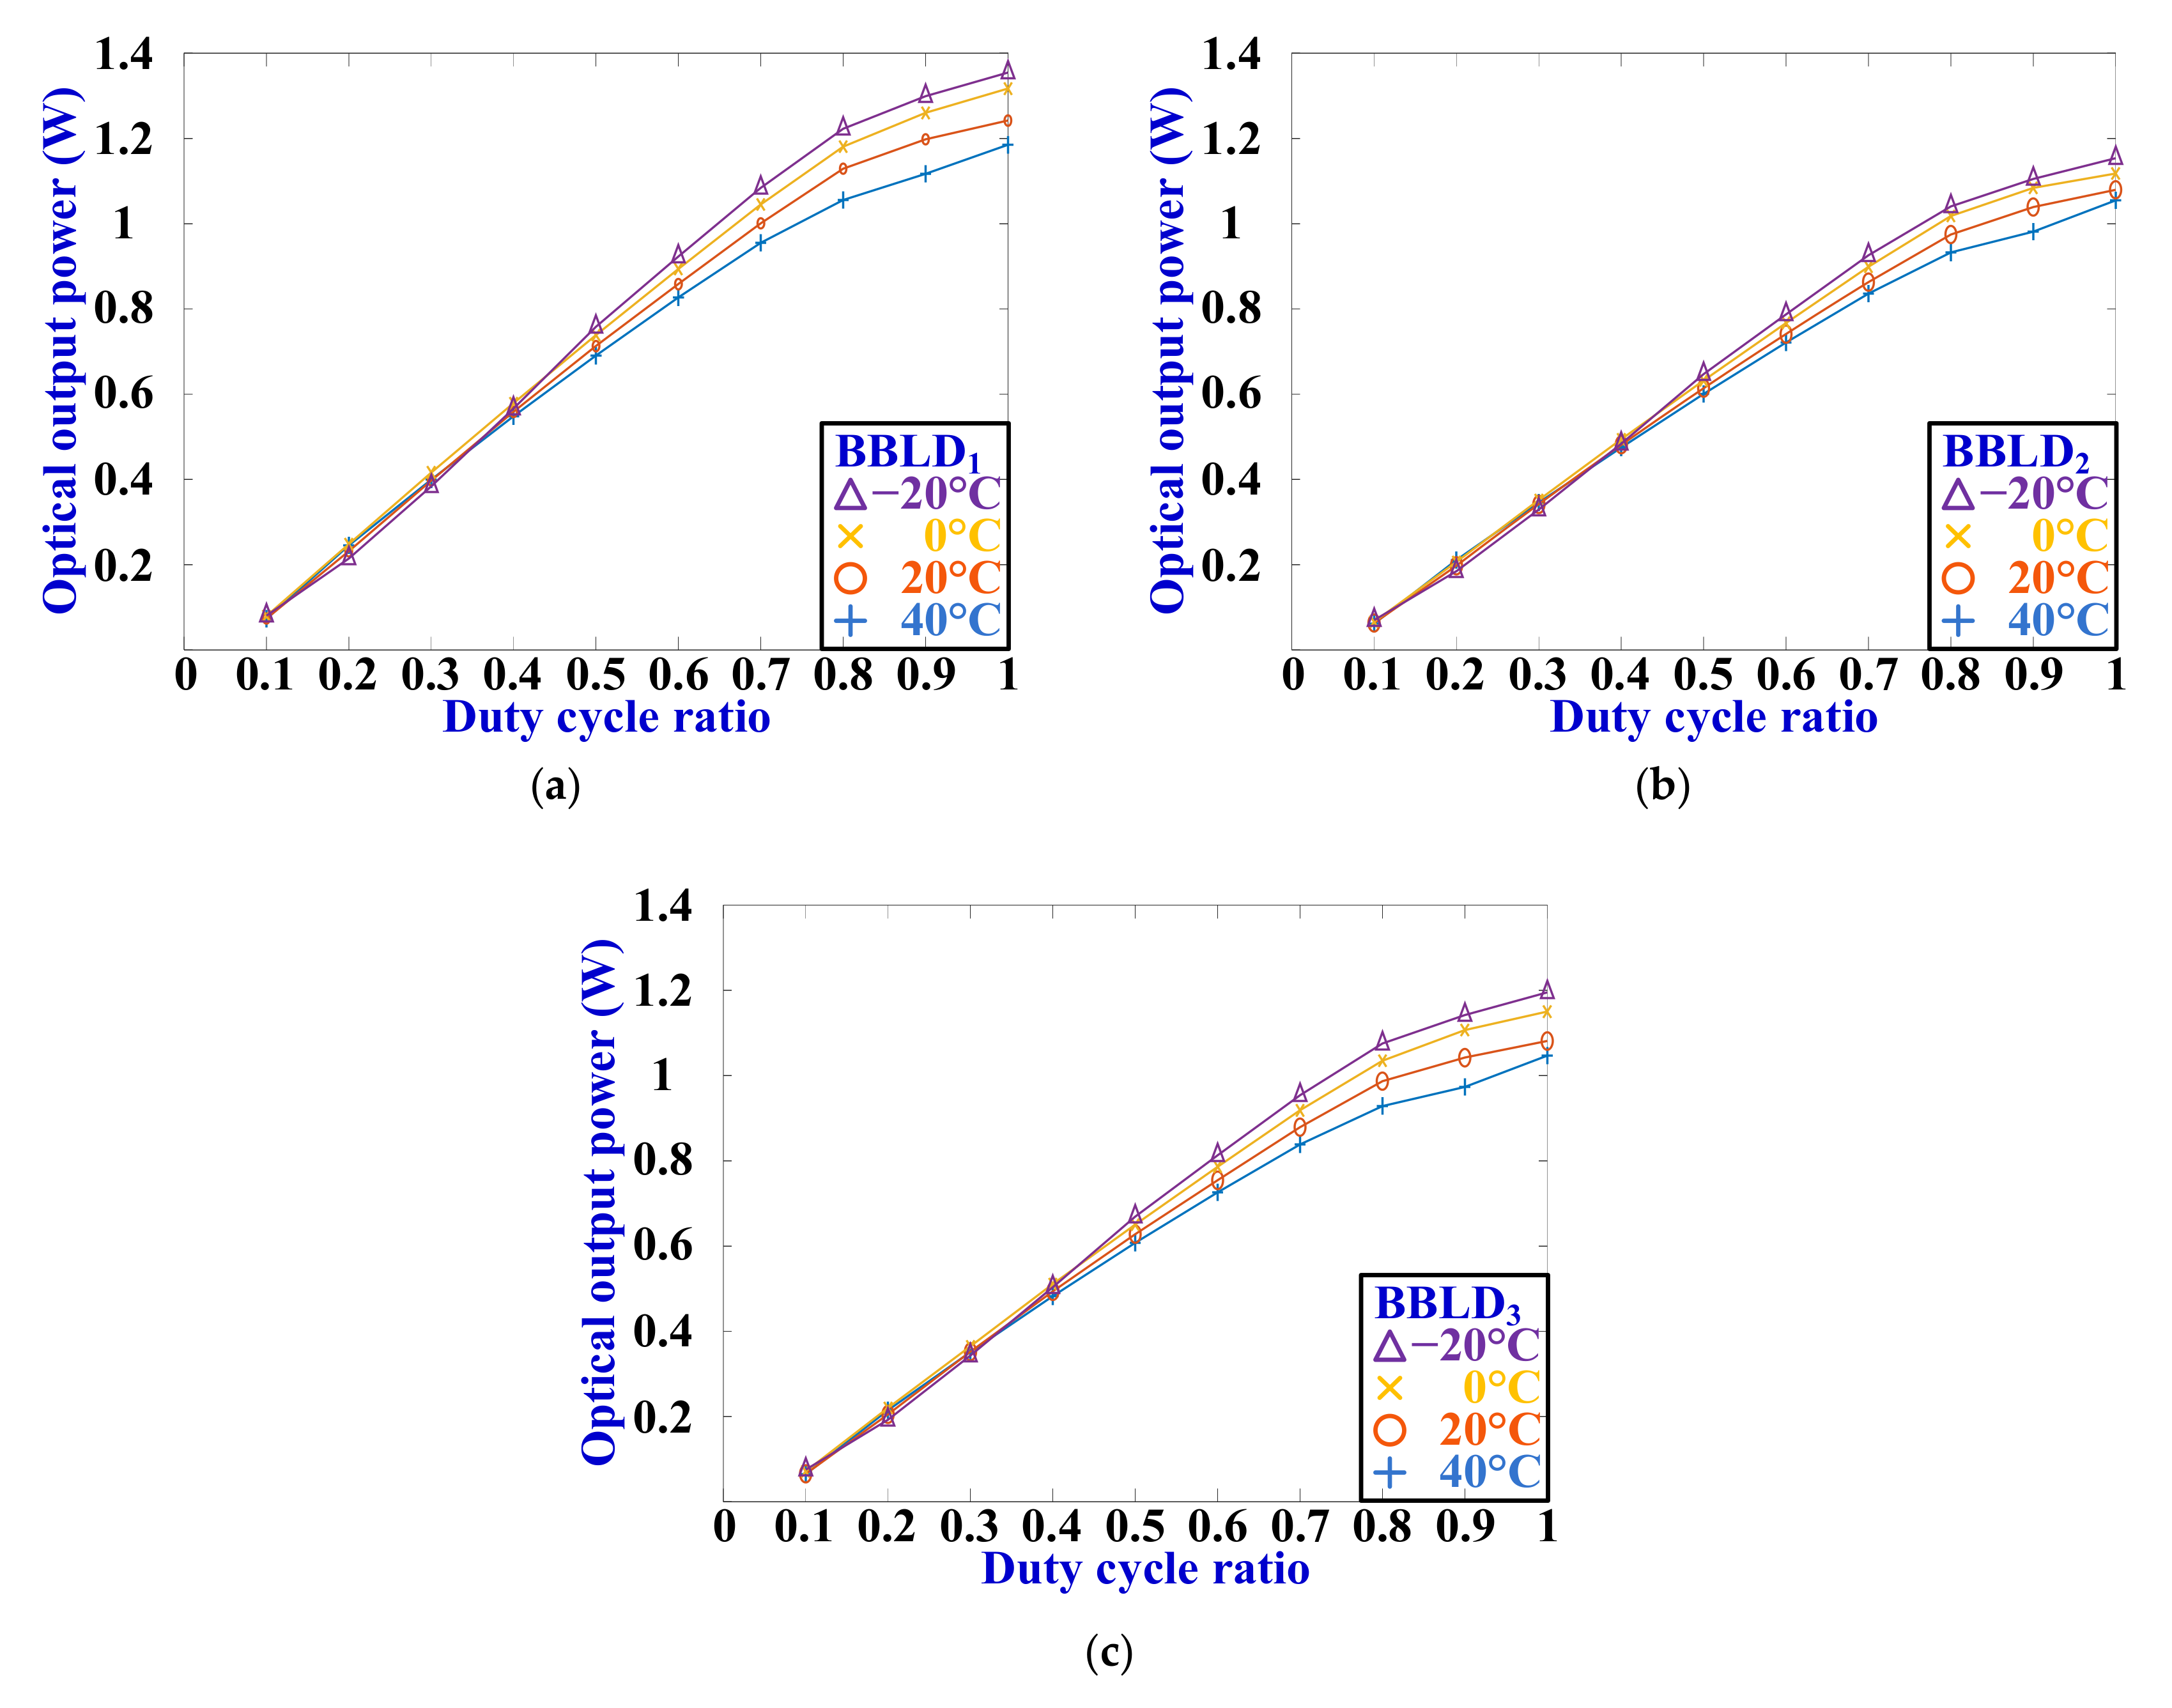
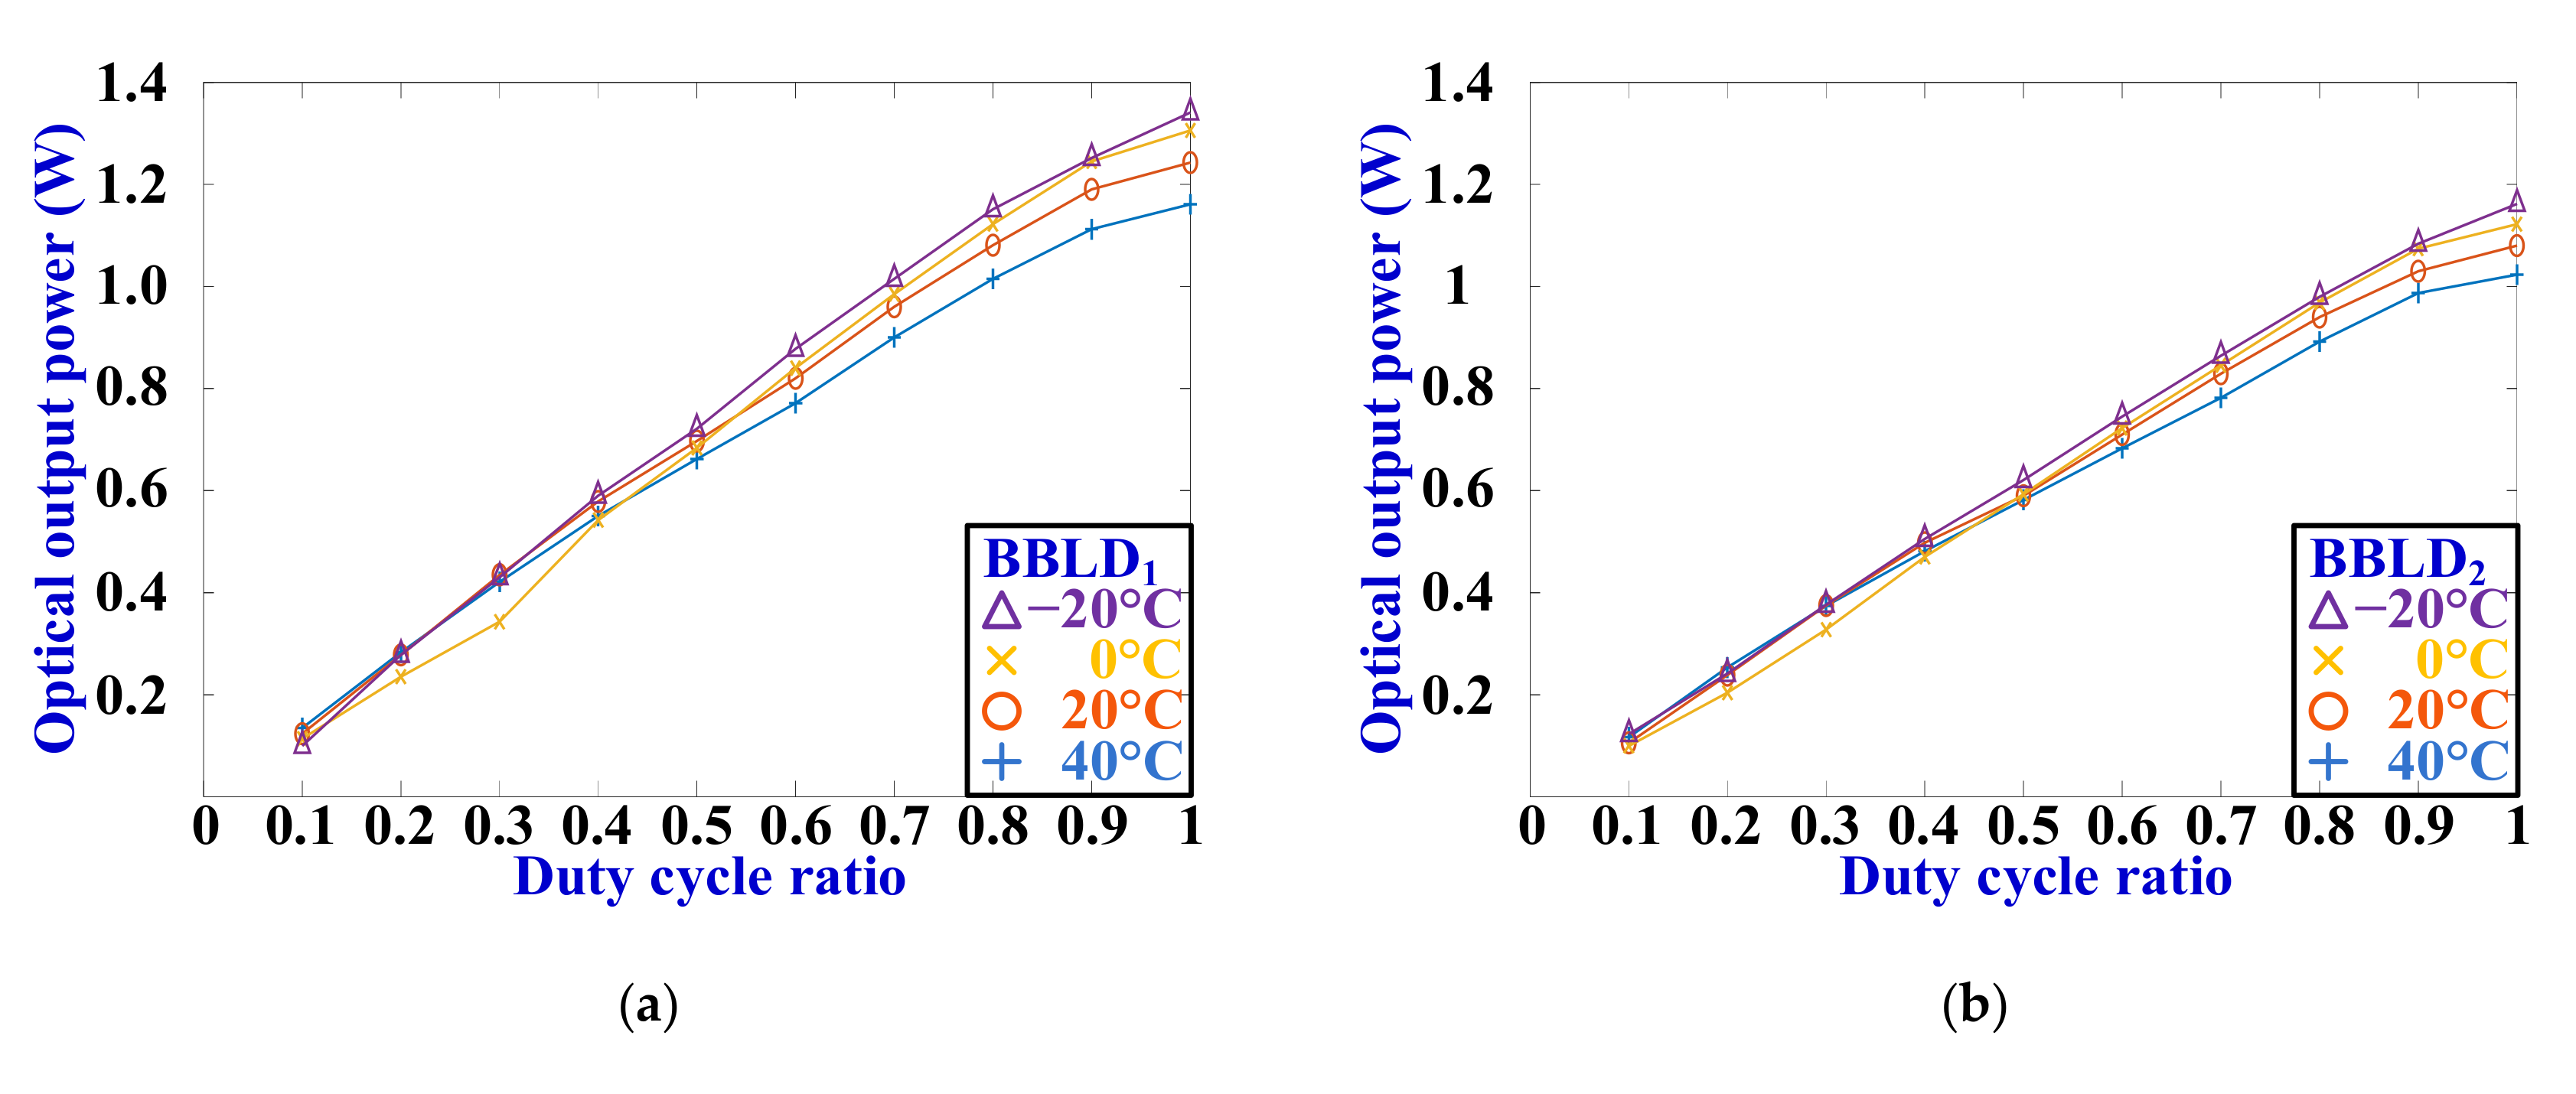
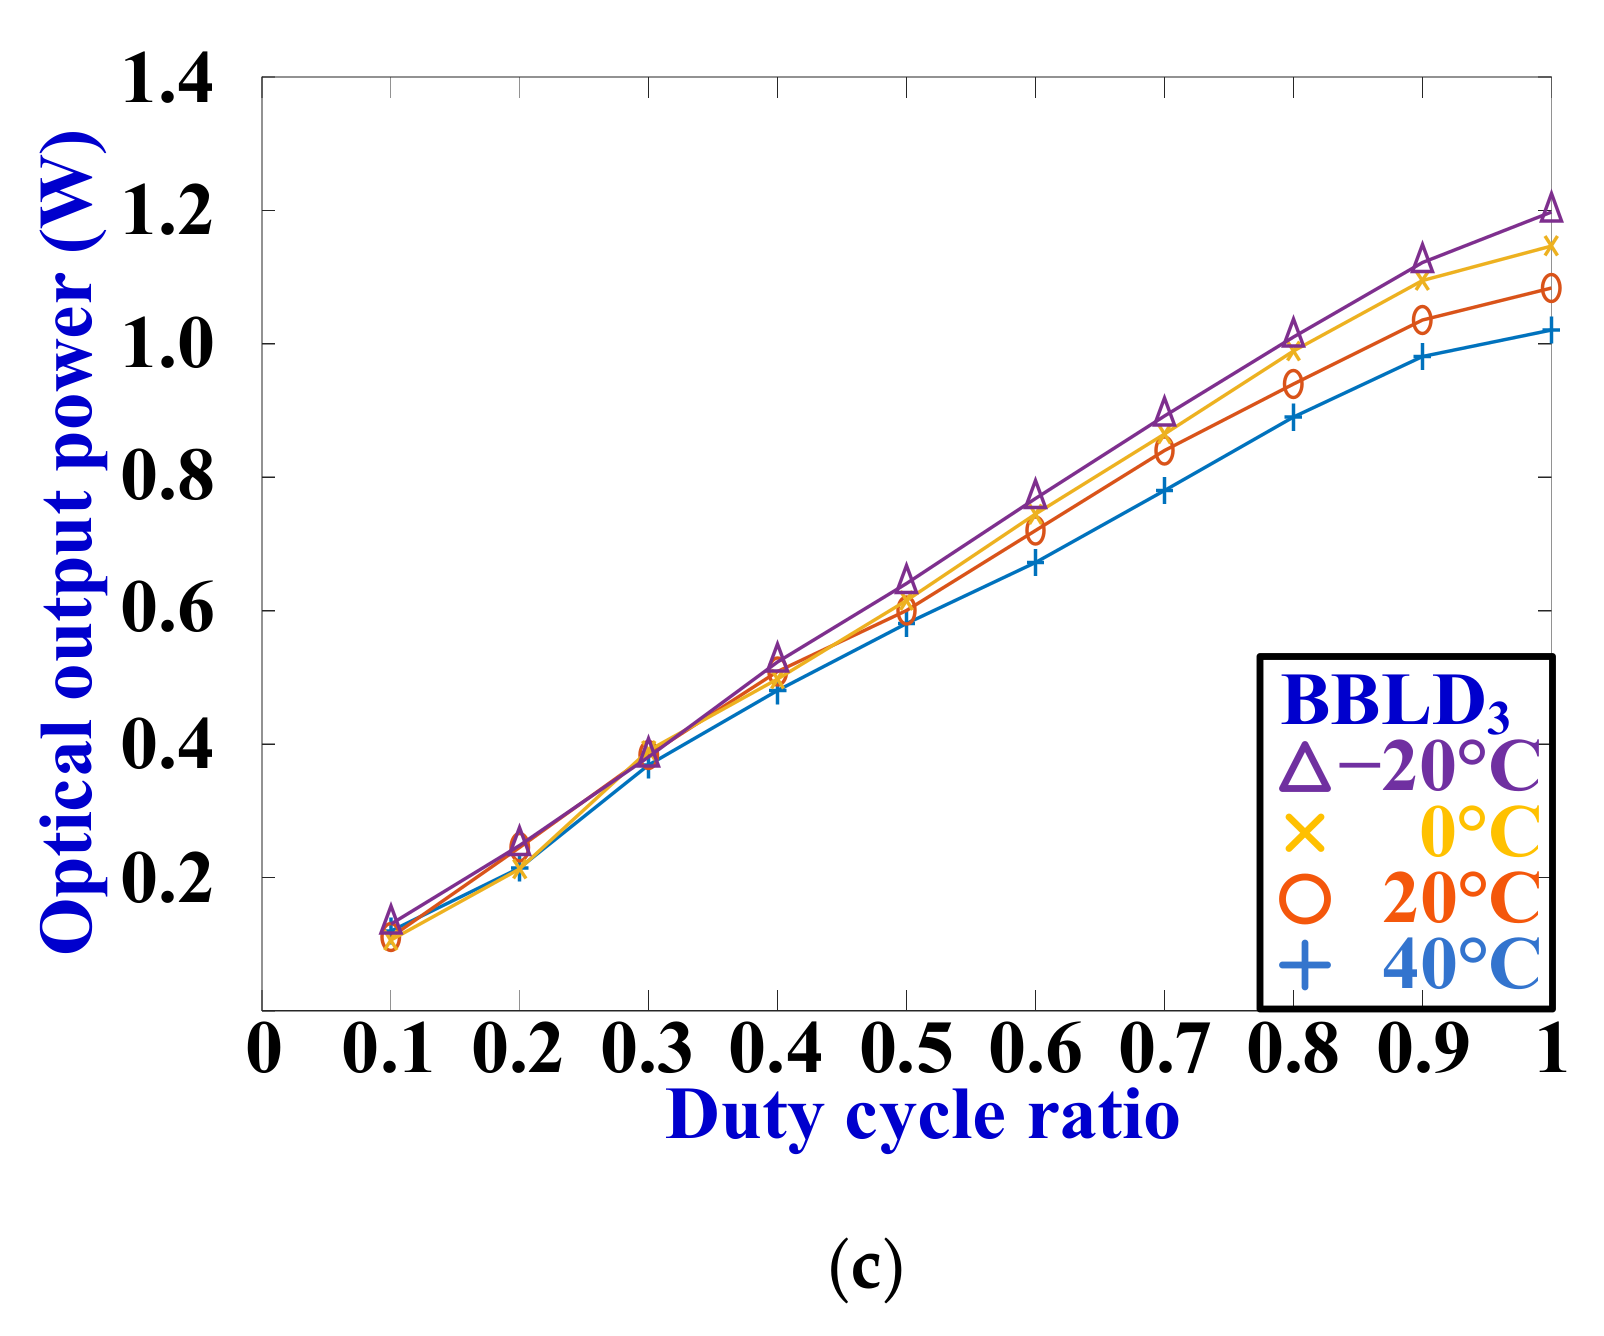
According to Figure 2b, Ifp was set in 1.2 A, ts was set in 2.5 ms (fs = 400 Hz), th can be adjusted to implement the PDCM. Their OOPs at different temperatures were recorded, as shown in Figure 11.

4.4. EOC Efficiency Estimation Using Electrical Power Mean Value

When Dpdcm was adjusted from 10% to 100% and the temperatures were changed from −20 °C to 40 °C, the forward-bias mean values of the BBLDs were increased, resulting in an increase in electrical powers, as shown in Figure 12.
Substituting the measurement results (Figure 10 and Figure 11) to [Poop(pdcm)/Pe(pdcm_mean)] × 100%, the EOC efficiencies of the three BBLDs can be obtained, as shown in Figure 13. In the electrical power estimation conducted using the electrical power mean value, the narrow duty cycle ratios (0.1 to 0.3) presented an increase in EOC efficiencies. This result differed from the average current modulation (Figure 10). Therefore, this study used RMS value estimation to calculate the EOC efficiency, as described in the subsequent section.

4.5. EOC Efficiency Estimation Using Electrical Power RMS Value

When Dpdcm was adjusted from 0.1 to 1, and the temperatures were changed from −20 °C to 40 °C, the RMS forward-biases of the BBLDs were increased, resulting in an increase in electrical powers, as shown in Figure 14.
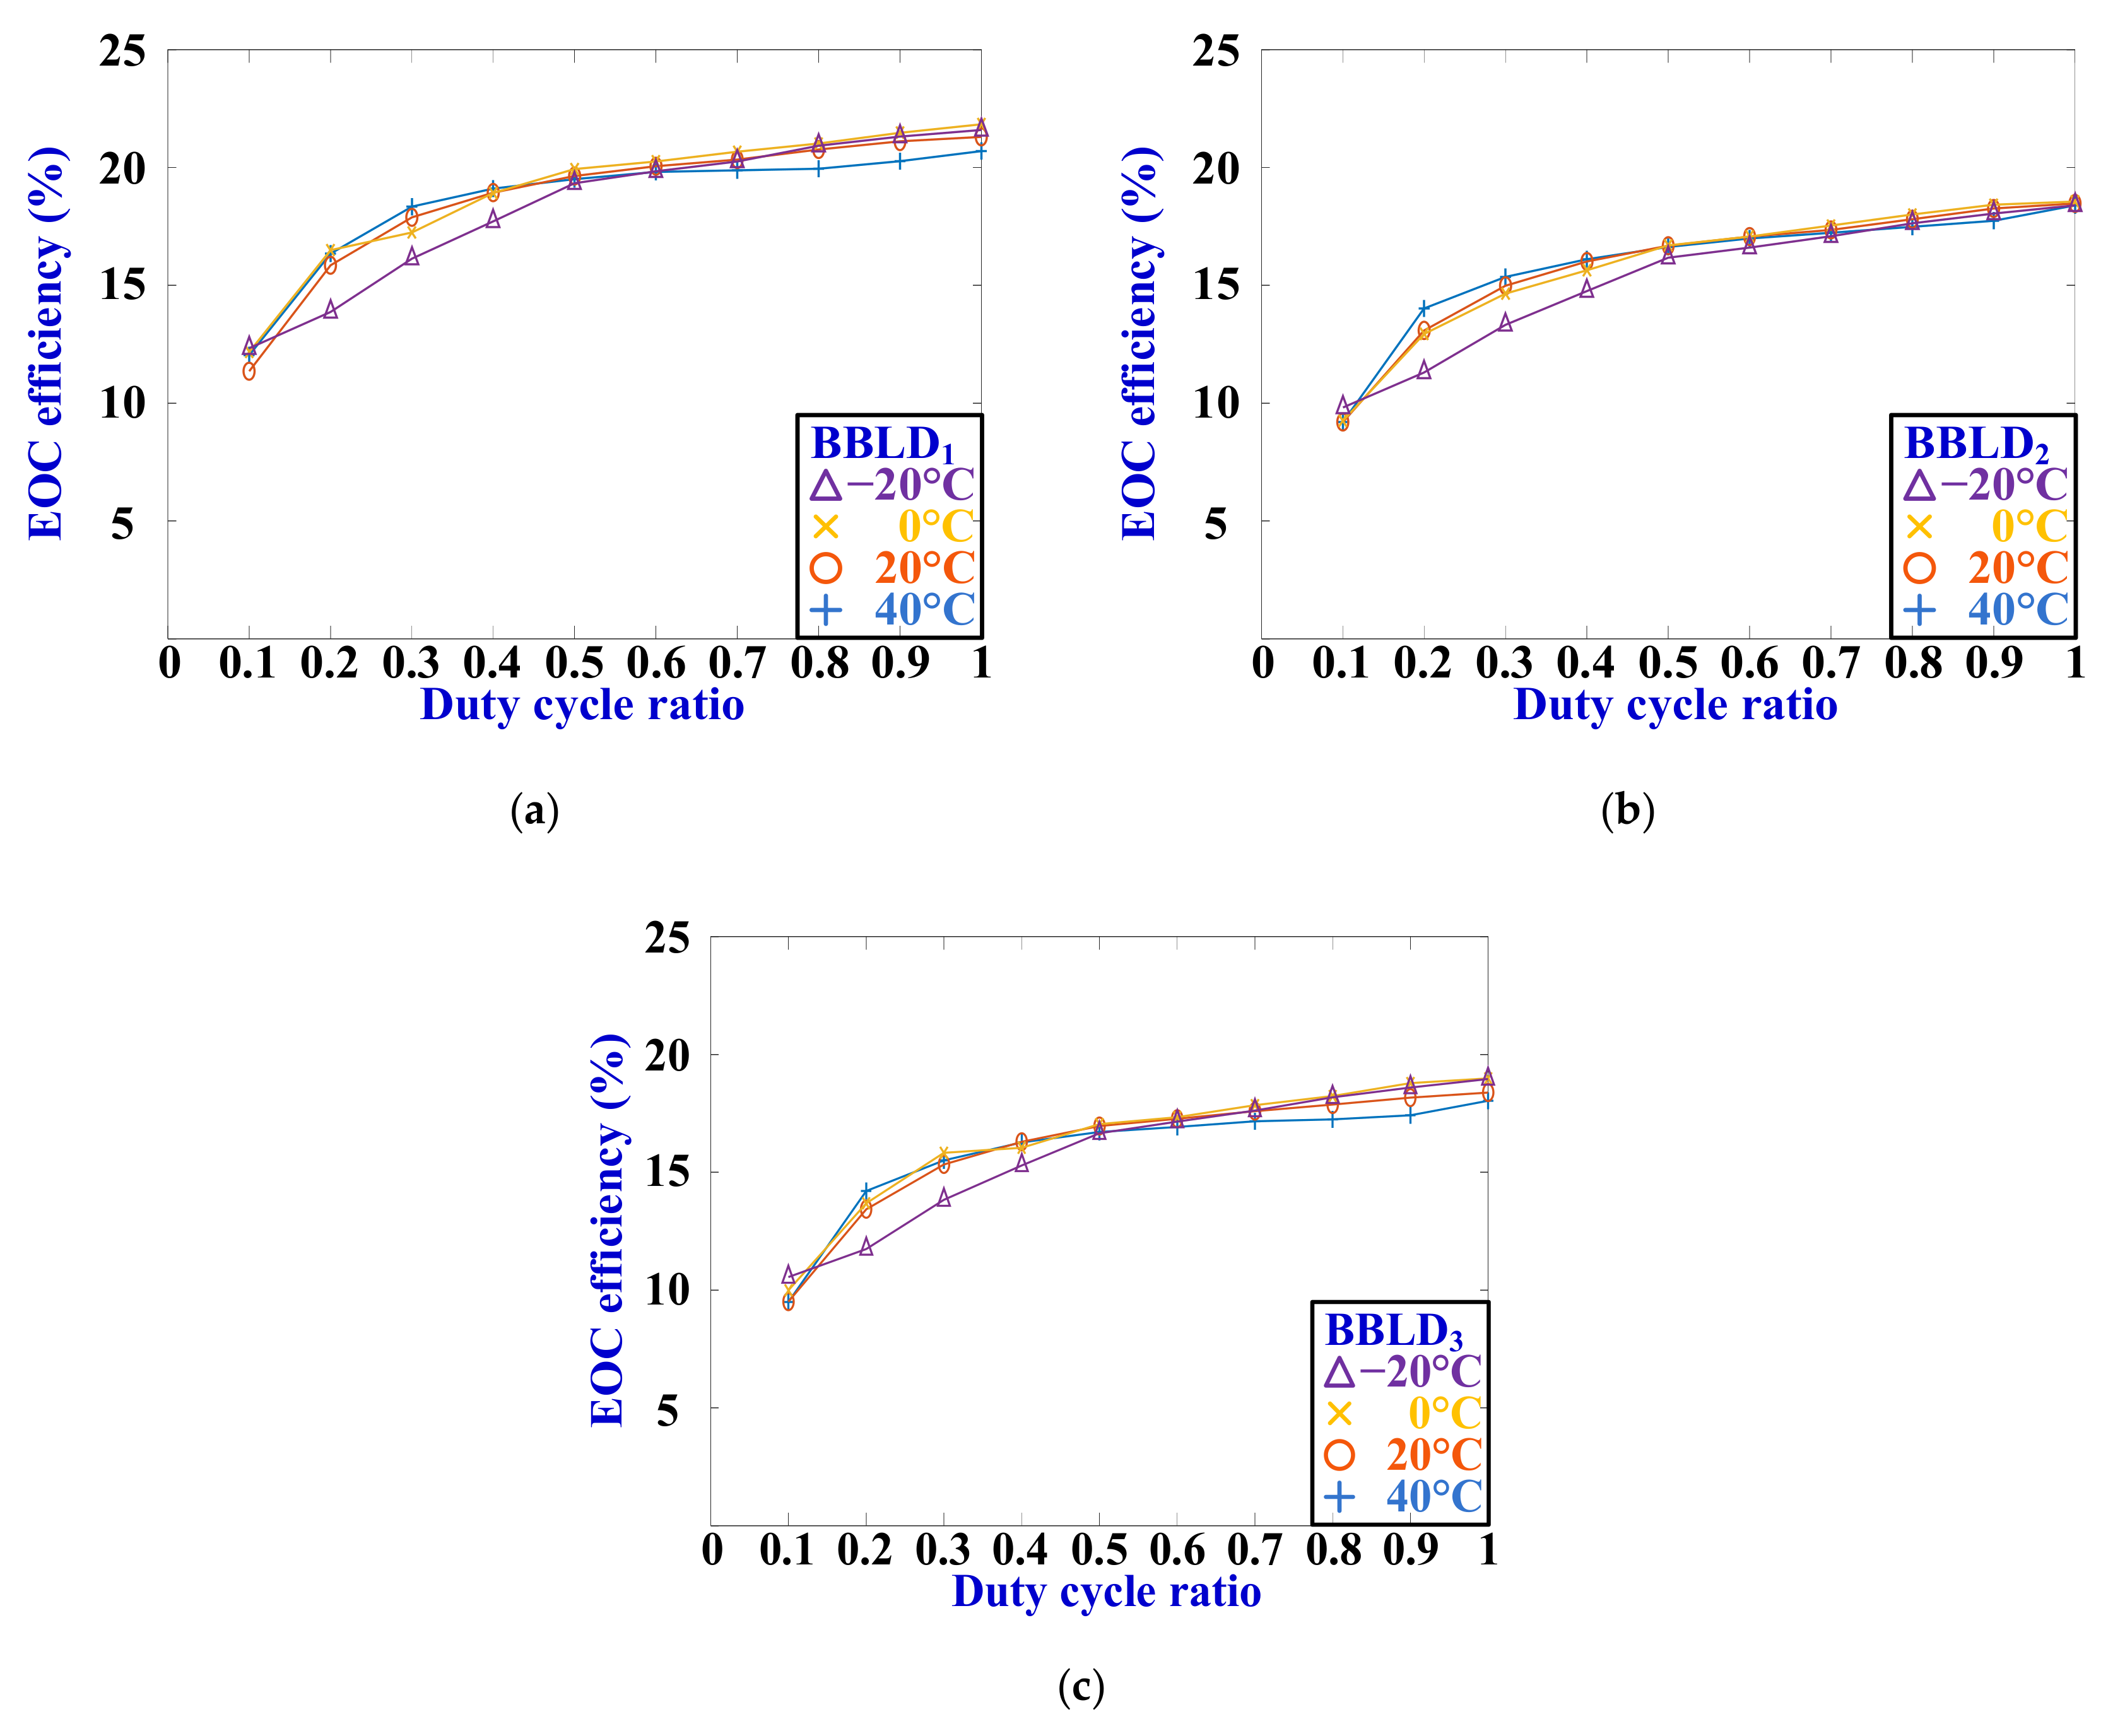
Substituting the measurement results (Figure 10 and Figure 13) into Equation (7), the EOC efficiencies of the three BBLDs can be obtained, as shown in Figure 15. In the electrical power calculation conducted using the electrical power RMS value, the EOC efficiencies presented a desirable result because their variations can be similar to the average current modulation (Figure 10).

4.6. OOP and EOC Efficiency of PDCM at Frequency of 250 Hz

According to Figure 2b, Ifp was set in 1.2 A, ts was set in 4 ms (fs = 250 Hz), th can be adjusted to fulfill the PDCM. Their OOPs at different temperatures were recorded, as shown in Figure 16.
When Dpdcm was adjusted from 10% to 100% and the temperature was changed from −20 °C to 40 °C, the forward-bias RMS value of the BBLDs was increased, resulting in an increase in electrical powers, as illustrated in Figure 17.
Substituting the measurement results (Figure 16 and Figure 17) into Equation (7), the EOC efficiencies of the three BBLDs can be obtained, as shown in Figure 18.

4.7. OOP and EOC Efficiency of PDCM at Frequency of 100 Hz

According to Figure 2b, Ifp was set in 1.2 A, ts was set in 10 ms (fs = 100 Hz), th can be adjusted to fulfill the PDCM. Their OOPs at different temperatures were recorded, as shown in Figure 19.
When Dpdcm was adjusted from 10% to 100% and the temperature was changed from −20 °C to 40 °C, the forward-bias voltage RMS values of the BBLDs were increased, resulting in an increase in electrical powers, as shown in Figure 20.
Substituting the measurement results (Figure 21 and Figure 22) into Equation (7), the EOC efficiencies of the three BBLDs can be obtained, as shown in Figure 21.
From the observation in Figure 11, Figure 16 and Figure 19, the OOP of PDCM in the different frequencies, several phenomena are discussed in the following.
According to Equation (3), when Dpdcm was adjusted between 0.5 and 0.9, the OOP presented a nonlinear variation with Dpdcm. For the identical Dpdcm range at different temperatures, the OOPs were different.
When Dpdcm was adjusted between 0.1 and 0.4, the OOP presented a linear variation with Dpdcm. For the identical Dpdcm range at 400 Hz and different temperatures, the OOPs were identical approximately.
From the observation in Figure 15, Figure 18 and Figure 21, the EOC efficiencies of PDCM in the different frequencies, several phenomena are discussed in the following.
Dpdcm was adjusted between 0.5 and 0.9; the EOC efficiencies can be greater than 0.15.
When Dpdcm was adjusted between 0.1 and 0.5, the EOC efficiency presented drastic change with the different temperatures, especially in the PDCM of 100 Hz.
When PDCMs of 100 Hz, 250 Hz and 400 Hz were employed for OOP adjustment, the EOC efficiency variation at different temperatures presented a convincing result because the EOC efficiencies of PDCM were similar to the average current modulation.
Employing the low-frequency PDCM, all efficiencies were higher than 0.1.
Moreover, according to the above measurements and discussions, the comparisons of the PDCM and average current modulation are discussed in the following.
The EOC efficiencies in the low OOPs were excellent using the PDCM.
The high-frequency PDCM can obtain a smooth EOC efficiency curve.
Using the PDCM, the EOC efficiencies can be maintained in a stable range because they were not much difference between the normal and high temperatures (20 °C and 40 °C).
Using the average current modulation, the OOPs following the average currents presented linear variation (Figure 8).

4.8. Human–Machine Interface Manipulation and Motoring

When the LHES is confronted with several abnormality conditions, the LHES statement panel can display an error message, as shown in Figure 22. As shown in Figure 22a, when the LHES power start button was switched on, the LHES detected that the input voltage was 7.59 V, which was lower than the setting range of 9–16 V. Therefore, an error message “Error: LHES input voltage” was displayed in the underside of the LHES statement panel.
As shown in Figure 22b, when the LHES power start button was switched on, the LHES detected that the output voltage was 14.2 V, which was lower than the setting range of 15–18 V. Therefore, an error message “Error: LHES output voltage” was displayed in the underside of the LHES statement panel.
As shown in Figure 22c, when the OOP adjustment start button was switched on, the LHES detected that the output current was 1.43 A, which was higher than the setting range of 1.08–1.32 A. Consequently, an error message “Error: LHES output current” was displayed on the underside of the LHES statement panel.

4.9. Waveform of PDCM

From Figure 7, an oscilloscope was used to measure the waveforms of BBLD2 driving voltage vld2 and current ild (Figure 3), as shown in Figure 23. In Figure 23, the frequency of the PDCM was 400 Hz. In Figure 23a,b, Dpdcm were set in 10% and 50%, respectively. For the frequencies of 100 Hz and 250 Hz, the same measurement method was used to estimate the BBLDs’ driving voltage and current RMS- and mean values.

4.10. LHES Prototype and Practical Measurement System

Figure 24 presents the practical measurement system, according to measurements in Figure 7, where the BBLDs were placed inside an ambient temperature testing chamber; the BBLD OOPs were measured by the OOP meter; by the OOP meter driver with data transmission, the measured OOP values can be displayed on the computer monitor.
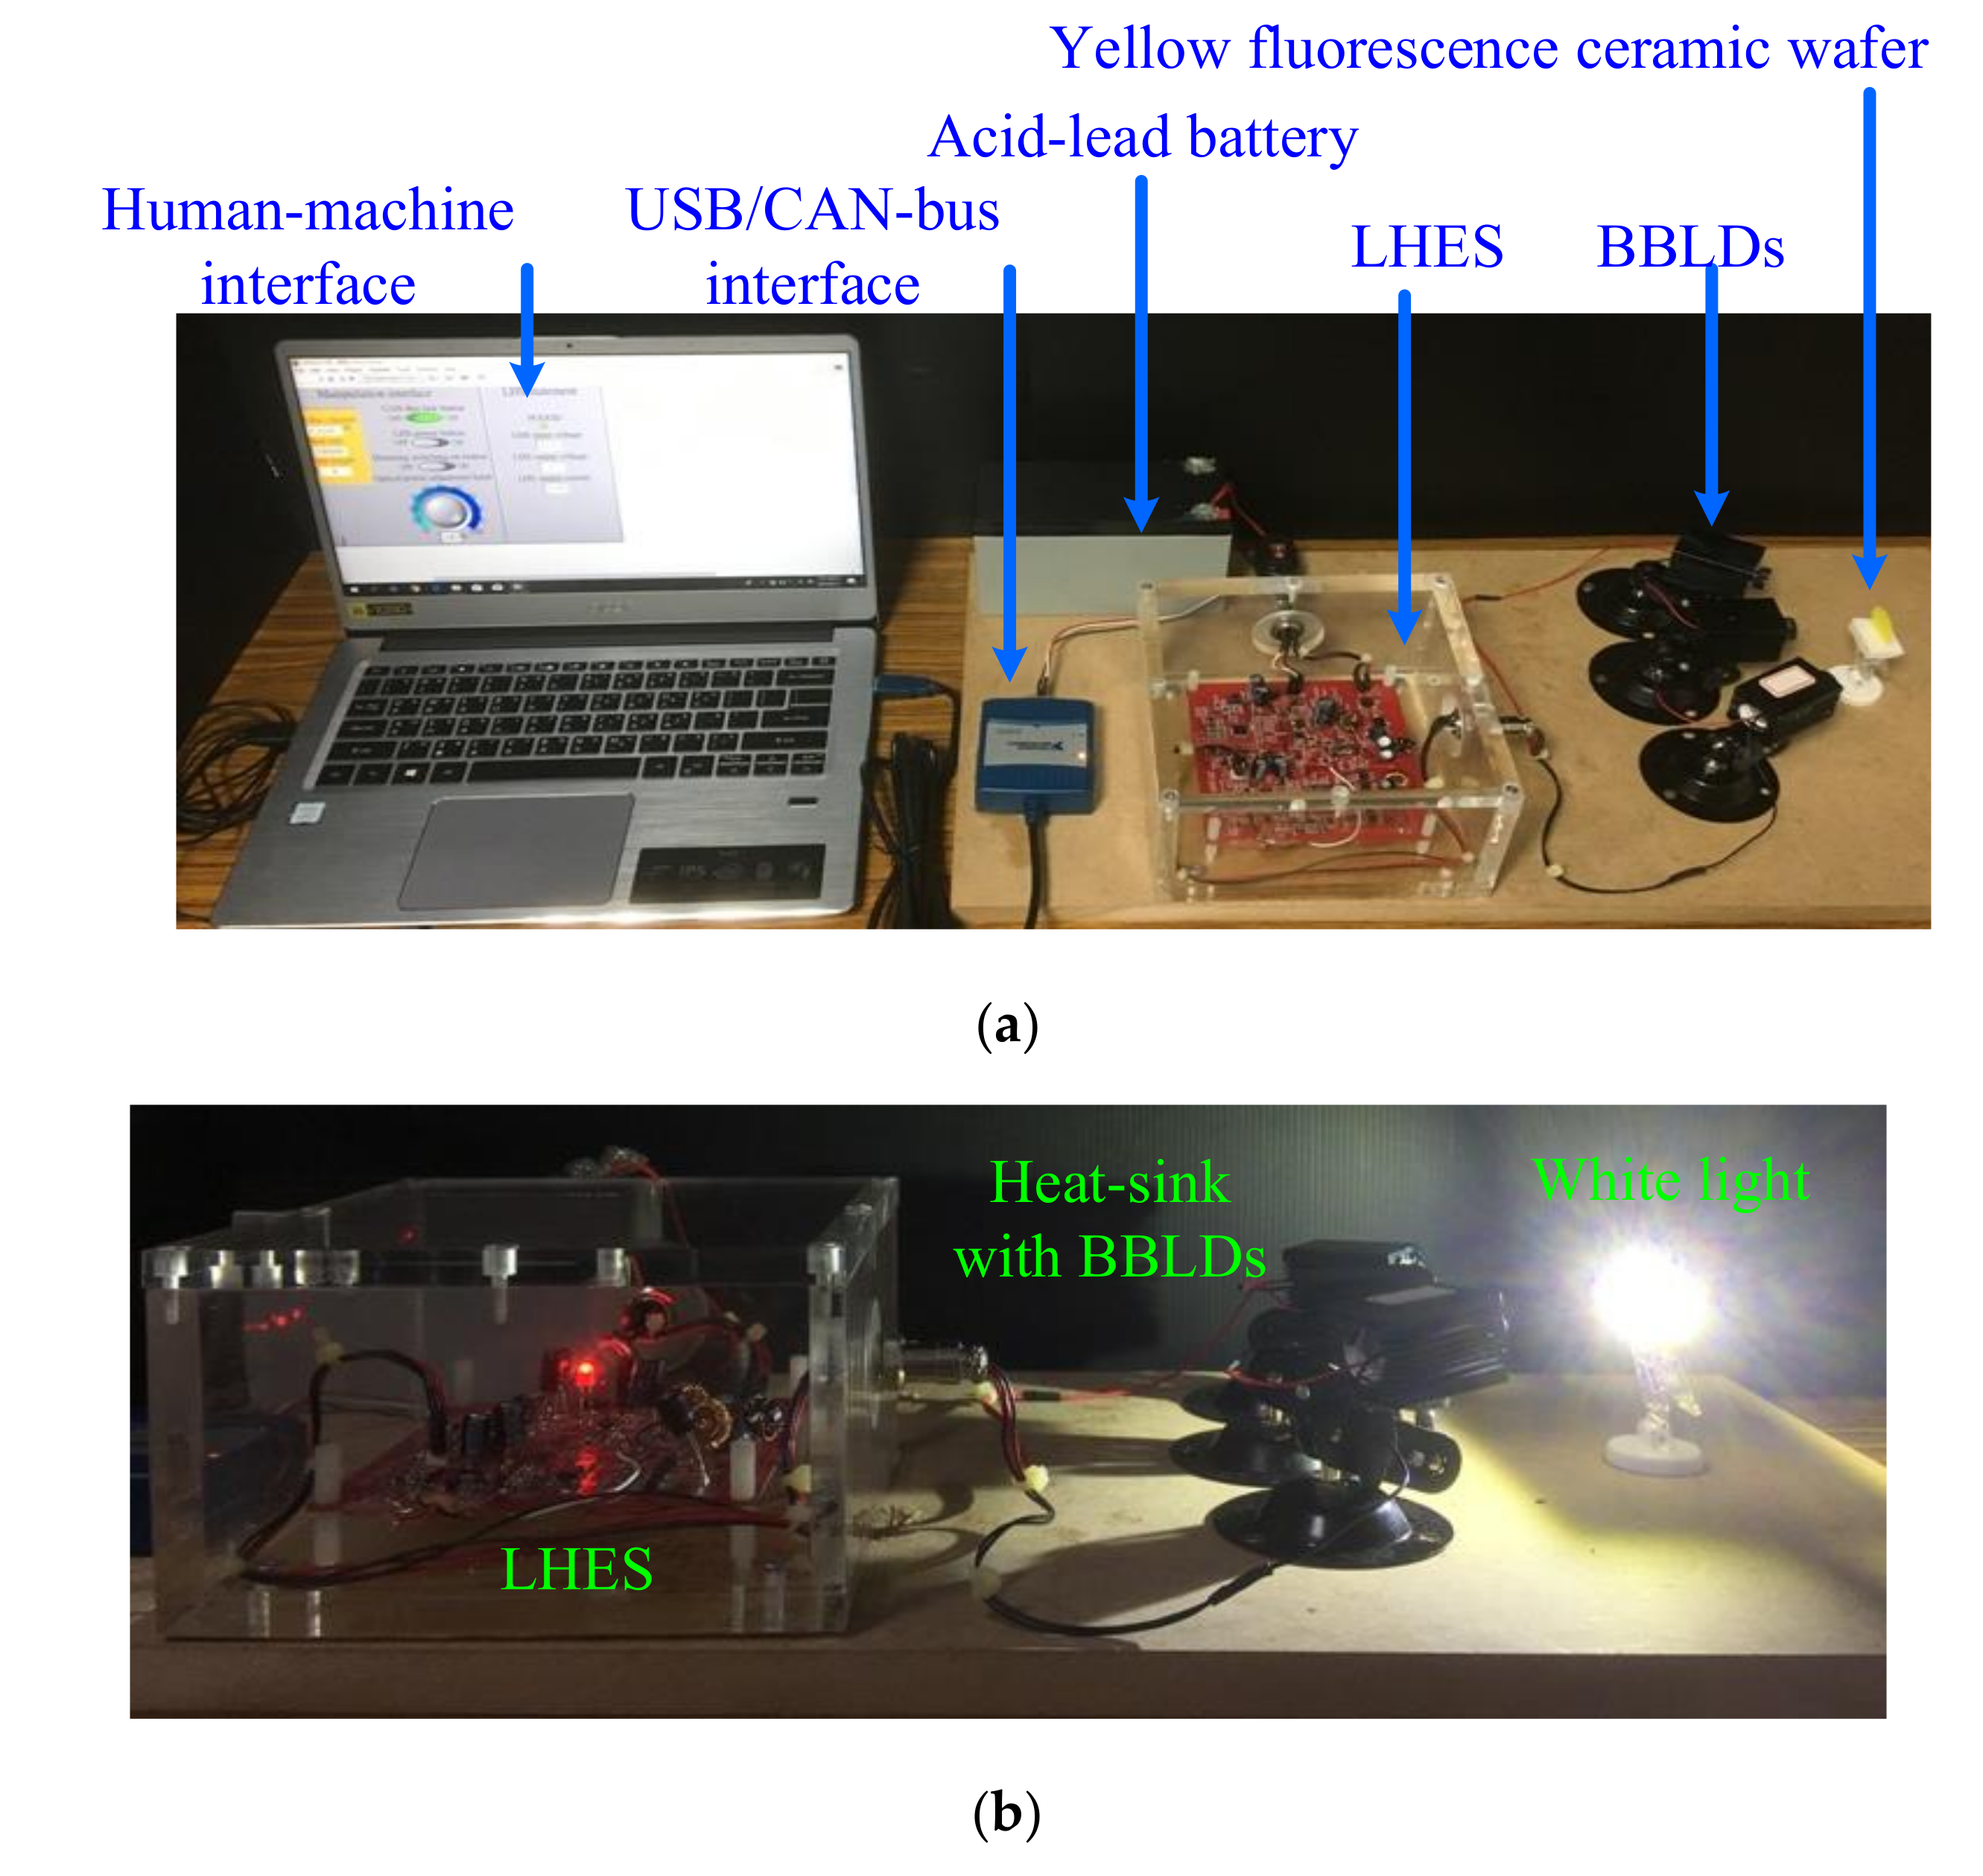
Figure 25 presents the developed LHES. As shown in Figure 25a, the LHES included the human–machine interface, USB/CAN-bus interface, acid–lead battery, LHES, BBLDs and yellow fluorescence ceramic wafer. When the LHES was operated to drive and control the three BBLDs, laser beams can project on a yellow fluorescence ceramic wafer; therefore, the blue laser beams transformed into white light, as shown in Figure 25b.

5. Conclusions

This study implemented and developed an LHES, an LHES measurement system and a LabVIEW human–machine interface. BBLDs were placed in an ambient temperature testing chamber to measure their electrical and optical characteristics. EOC efficiencies obtained for OOP adjustment through average current modulation and PDCM were compared. According to the experimental results, when the LHES applied PDCM, and the three low-frequencies were used for OOP adjustment, the EOC efficiencies at different temperatures exhibited acceptable results; all EOC efficiencies were higher than 10%. This result vanquishes the disadvantages confronted in OOP adjustment through average current modulation. However, RMS value calculation was determined to be suitable for EOC efficiency estimation when PDCM was used for OOP adjustment. Moreover, this study established the human–machine interface for LHES manipulation and monitoring. The computer can communicate with the LHES through the CAN-bus for controlling and monitoring the LHES. Finally, the LHES drove BBLDs to emit laser beams, which were projected onto a yellow fluorescence ceramic wafer to become white light.

Author Contributions

Conceptualization, K.-J.P. and C.-H.L.; Methodology, K.-J.P. and P.-H.C.; Software, K.-J.P. and P.-H.C.; Validation, K.-J.P. and P.-H.C.; Formal Analysis, K.-J.P.; Investigation, K.-J.P.; Writing—Original Draft Preparation, K.-J.P.; Writing—Review & Editing, K.-J.P. and C.-H.L.; Supervision, K.-J.P.; Project Administration, K.-J.P. All authors have read and agreed to the published version of the manuscript.

Funding

This research was funded by the Ministry of Science and Technology, Taiwan. The grant numbers: MOST 107–2221–E–131–008 and MOST 108–2221–E–003–028–MY2.

Acknowledgments

The authors acknowledge the Ministry of Science and Technology, Taiwan supplying a research fund.

Conflicts of Interest

The authors declare no conflict of interest.

References

  1. Aoike, N.; Hoshino, M.; Iwabuchi, A. Automotive HID headlamps producing compact electronic ballasts using power ICs. IEEE Trans. Ind. Appl. Mag. 2002, 8, 37–41. [Google Scholar] [CrossRef]
  2. Cheng, H.; Moo, C.; Yang, C.; Huang, C. Analysis and implementation of an HPF electronic ballast for HID lamps with LFSW voltage. IEEE Trans. Power Electron. 2012, 27, 4584–4593. [Google Scholar] [CrossRef]
  3. Chiu, H.; Lo, Y.; Yao, C.; Cheng, S. Design and implementation of a photovoltaic high-intensity-discharge street lighting system. IEEE Trans. Ind. Appl. Mag. 2011, 26, 3464–3471. [Google Scholar] [CrossRef]
  4. Abu-Ageel, N.; Aslam, D. Laser-driven visible solid-state light source for etendue-limited applications. IEEE Trans. Ind. Appl. Mag. 2014, 10, 700–703. [Google Scholar] [CrossRef]
  5. Longa, X.; Heb, J.; Zhouc, J.; Fangc, L.; Zhoub, X.; Renb, F.; Xu, T. A review on light-emitting diode based automotive headlamps. Renew. Sustain. Energy Rev. 2015, 41, 29–41. [Google Scholar] [CrossRef]
  6. Qu, X.; Wong, S.; Tse, C. Temperature measurement technique for stabilizing the light output of RGB LED lamps. IEEE Trans. Instrum. Meas. 2009, 59, 661–670. [Google Scholar]
  7. Górecki, K.; Ptak, P. New method of measurements transient thermal impedance and radial power of power LEDs. IEEE Trans. Instrum. Meas. 2020, 69, 212–220. [Google Scholar] [CrossRef]
  8. Ulrich, L. White brights with lasers. IEEE Spectr. 2013, 50, 36–56. [Google Scholar] [CrossRef]
  9. Pai, K. Depressing start-up current overshoot for a laser leadlight driver in high-temperature and forward voltage drift conditions. IEEE Trans. Ind. Electron. 2018, 165, 815–826. [Google Scholar]
  10. Pai, K.; Qin, L.; Lin, C.; Tang, S. Start-up current spike mitigation of high-power laser diode driving controller for vehicle headlamp applications. Appl. Sci. 2018, 8, 532. [Google Scholar] [CrossRef] [Green Version]
  11. Xu, J.; Shen, Q.; Zhang, Y.; Deng, L. A Laser Headlamp Control System Brightness Adjustable Color Temperature. Available online: https://patents.google.com/patent/CN207995474U/en?oq=cn+207995474+u (accessed on 12 October 2018).
  12. Stam, J.S. System for Controlling Exterior Vehicle Lights. Available online: https://patents.google.com/patent/US7653215B2/en?oq=US+7%2c653%2c215+B2 (accessed on 15 January 2010).
  13. Tiefenbacher, E. Safety Device for Headlights with Laser Light Sources and Method for Shutting Down Laser Light Sources in Case of Safety-Critical Conditions. Available online: https://patents.google.com/patent/WO2013096984A1/en?oq=WO+2013%2f096984+AI (accessed on 18 July 2013).
  14. Gacio, D.; Marcos-Alonso, J.; Garcia, J.; Campa, L.; Crespo, M.; Rico-Secades, M. PWM series dimming for slow-dynamics HPF LED drivers: The high-frequency approach. IEEE Trans. Ind. Electron. 2014, 59, 1717–1727. [Google Scholar] [CrossRef]
  15. Wang, J.; Wu, S.; Su, W.; Lin, Y. Study and implementation of the LED headlight driver with auto-start function in specific location. IET Intell. Transp. Syst. 2016, 10, 623–634. [Google Scholar] [CrossRef]
  16. Ahn, H.; Hong, S.; Kwon, O. A fast switching current regulator using slewing time reduction method for high dimming ratio of LED backlight drivers. IEEE Trans. Circuits Syst. II Express Briefs 2016, 11, 1014–1018. [Google Scholar] [CrossRef]
  17. Liu, X.; Zhou, Q.; Xu, J.; Lei, Y.; Wang, P.; Zhu, Y. High-efficiency resonant LED backlight driver with passive current balancing and dimming. IEEE Trans. Ind. Electron. 2018, 6, 5476–5486. [Google Scholar] [CrossRef]
  18. Hanna, B.; Alfons, S. Using OSRAM OS Visible InGaN Laser Diodes. Available online: https://dammedia.osram.info/media/resource/hires/osram-dam-2496571/Using%20OSRAM%20OS%20Visible%20InGaN%20Laser%20Diodes.pdf (accessed on 22 March 2018).
  19. Lin, C.; Pai, K.; Chen, P. Development and implementation of a laser headlight system for electro-optic characteristic measurement and comparison. Int. J. Circuit Theory Appl. 2020, 48, 294–307. [Google Scholar] [CrossRef]
Figure 1. The function block of the laser headlight electrical system (LHES).
Electronics 09 01902 g001
Figure 2. Different modulation methods. (a) Average-current modulation. (b) PDCM operation.
Electronics 09 01902 g002aElectronics 09 01902 g002b
Figure 3. Variances in electro-optic conversion (EOC) efficiencies using average current modulation and PDCM (a) Average-current modulation. (b) RMS value based on electrical power using PDCM. (c) Mean value based on electrical power using PDCM.
Electronics 09 01902 g003
Figure 4. Human–machine interface of LHES.
Electronics 09 01902 g004
Figure 5. Software flowchart of LabVIEW for human–machine interface.
Electronics 09 01902 g005
Figure 6. Software flowchart of LHES microcontroller unit (MCU) firmware.
Electronics 09 01902 g006
Figure 7. Measurement systems of blue-beam laser diodes (BBLD electrical and optical characteristics. (a) PDCM. (b) Average current modulation.
Electronics 09 01902 g007
Figure 8. Optical output power (OOP) (Poop(avg)) variations in average current modulation. (a) BBLD1. (b) BBLD2. (c) BBLD3.
Electronics 09 01902 g008
Figure 9. Electrical power (Pe(avg)) variations in average current modulation. (a) BBLD1. (b) BBLD2. (c) BBLD3.
Electronics 09 01902 g009
Figure 10. Electro-optic conversion (EOC) efficiency (ηavg) variations in average current modulation. (a) BBLD1. (b) BBLD2. (c) BBLD3.
Electronics 09 01902 g010aElectronics 09 01902 g010b
Figure 11. OOP (Pop(pdcm)) variations of PDCM in frequency of 400 Hz. (a) BBLD1. (b) BBLD2. (c) BBLD3.
Electronics 09 01902 g011
Figure 12. Variation of Dpdcm to electrical power (Pe(pdcm_mean)) using mean-value calculation (fs = 400 Hz). (a) BBLD1. (b) BBLD2. (c) BBLD3.
Electronics 09 01902 g012
Figure 13. EOC efficiencies using electrical power mean-value calculation (fs = 400 Hz). (a) BBLD1. (b) BBLD2. (c) BBLD3.
Electronics 09 01902 g013aElectronics 09 01902 g013b
Figure 14. Variation of Dpdcm to electrical power (Pe(pdcm_rms)) using RMS value calculation (fs = 400 Hz). (a) BBLD1. (b) BBLD2. (c) BBLD3.
Electronics 09 01902 g014
Figure 15. EOC efficiency using electrical power RMS value calculation (fs = 400 Hz). (a) BBLD1. (b) BBLD2. (c) BBLD3.
Electronics 09 01902 g015
Figure 16. OOP (Poop(pdcm)) variations of PDCM in frequency of 250 Hz. (a) BBLD1. (b) BBLD2. (c) BBLD3.
Electronics 09 01902 g016aElectronics 09 01902 g016b
Figure 17. Variation of Dpdcm to electrical power (Pe(pdcm_rms)) using RMS value calculation (fs = 250 Hz). (a) BBLD1. (b) BBLD2. (c) BBLD3.
Electronics 09 01902 g017
Figure 18. EOC efficiency using electrical power RMS value calculation (fs = 250 Hz). (a) BBLD1. (b) BBLD2. (c) BBLD3.
Electronics 09 01902 g018
Figure 19. OOP (Pop(pdcm)) variations of PDCM in frequency of 100 Hz. (a) BBLD1. (b) BBLD2. (c) BBLD3.
Electronics 09 01902 g019aElectronics 09 01902 g019b
Figure 20. Variation of Dpdcm to electrical power (Pe(pdcm_rms)) using RMS value calculation (fs = 100 Hz). (a) BBLD1. (b) BBLD2. (c) BBLD3.
Electronics 09 01902 g020
Figure 21. EOC efficiency using electrical power RMS value calculation (fs = 100 Hz). (a) BBLD1. (b) BBLD2. (c) BBLD3.
Electronics 09 01902 g021
Figure 22. Human–machine interface manipulation and motoring. (a) Input voltage, (b) output voltage and (c) output current errors.
Electronics 09 01902 g022aElectronics 09 01902 g022b
Figure 23. Waveforms of BBLD2 driving voltage vld2 and current, Dpdcm was set in (a) 10% and (b) 50%.
Electronics 09 01902 g023aElectronics 09 01902 g023b
Figure 24. Practical measurement system.
Electronics 09 01902 g024
Figure 25. The developed LHES. (a) LHES prototype. (b) Blue laser beams transformed into white light.
Electronics 09 01902 g025
Table 1. Comparisons of power converter topologies and control topologies for laser headlights.
[8][9,10][11][12][13]This Work
Power converter topologyUndescribedBuck–boost converterUndescribedUndescribedUndescribedBuck–boost converter
Dimming methodUndescribedUndescribedPDCMUndescribedUndescribedPDCM
Temperature
variation test
UndescribedAnalysis of ignition current spikeUndescribedUndescribedUndescribedComparisons of OP and efficiency
CommunicationUndescribedUndescribedCAN-busUndescribedUndescribedCAN-bus
Table 2. Dimming technology comparisons of average current modulation and pulse-duty-cycle modulation (PDCM).
[14][15][16][17]This Work
ApplicationUndescribedHeadlightLEDBacklightLEDBacklightHeadlight
Dimming
technology
PDCM and average currentPDCMPDCMPDCM and average currentPDCM
Temperature
variation test
UndescribedUndescribedUndescribedUndescribedComparisons of OOP and efficiency
Brightness or OOP
measurement
UndescribedUndescribedUndescribedUndescribedImplementation
Table 3. LHES specification.
Function ModuleDescriptionNotationSpecification
Buck converterInput voltage rangeVin9 to 16 V
Output voltageVbk5 V
Buck–boost converterInput voltage rangeVin9 to 16 V
Output voltage rangeVld14 to 18 V
Output current rangeIld1.08 to 1.32 A
Table 4. Employed electronic elements on LHES.
Electronic ElementsModel Number
Buck converter controllerLT3505IMS8E#PBF
Buck–Boost converter controllerLTC3780EG#PBF
MCUS9S12G48F1MLC
CAN-bus transceiverTJA1040T
Gate driverTPS2819DBV
CC controllerLM258ADR
SWKSH41CTF
BBLDPL TB405B
CAN-bus/USB transform interfaceNI USB-8473
Publisher’s Note: MDPI stays neutral with regard to jurisdictional claims in published maps and institutional affiliations.