Abstract
The semantic segmentation of a brain tumor is of paramount importance for its treatment and prevention. Recently, researches have proposed various neural network-based architectures to improve the performance of segmentation of brain tumor sub-regions. Brain tumor segmentation, being a challenging area of research, requires improvement in its performance. This paper proposes a 2D image segmentation method, BU-Net, to contribute to brain tumor segmentation research. Residual extended skip (RES) and wide context (WC) are used along with the customized loss function in the baseline U-Net architecture. The modifications contribute by finding more diverse features, by increasing the valid receptive field. The contextual information is extracted with the aggregating features to get better segmentation performance. The proposed BU-Net was evaluated on the high-grade glioma (HGG) datasets of the BraTS2017 Challenge—the test datasets of the BraTS 2017 and 2018 Challenge datasets. Three major labels to segmented were tumor core (TC), whole tumor (WT), and enhancing core (EC). To compare the performance quantitatively, the dice score was utilized. The proposed BU-Net outperformed the existing state-of-the-art techniques. The high performing BU-Net can have a great contribution to researchers from the field of bioinformatics and medicine.
1. Introduction
The brain tumor is caused by abnormal cell growth in the human brain. Currently, the incidence of malignant brain tumor is relatively high, which has a great impact on humans and society [1]. To diagnose this disease, a brain tumor is subdivided through high-quality image processing. The dominant malignant brain tumor is known as the histological glioma, and its sub-regions are tumor core, enhancing core, and whole tumor [2,3]. Most of the existing brain tumor segmentation studies focus on gliomas, the most common brain tumors in adults, and there are two types of glioma: high-grade glioma (HGG) and low-grade glioma (LGG). HGG tumors behave malignantly as they grow rapidly and damage brain tissues. Patients affected with HGG tumors require surgery, as they are unable to survive for more than 2 years. The active treatment of LGG tumors can extend life expectancy [4].
Brain tumors can be monitored and analyzed by main tools such as Magnetic Resonance Imaging (MRI). The MRI employs four different modalities to visualize the brain: T1-weighted, T2-weighted, post-contrast T1-weighted, and Flair. Different information from these modalities complements one another for a robust brain tumor segmentation.
Since it is difficult to divide brain tumors manually, a lot of effort is being devoted to develop a method for automatically segmenting brain tumor regions. It is crucial to separate and interpret tumors in the medical field, and a clear understanding is essential. With advances in medical image processing, finding tumor using machine learning has become more reliable and sophisticated than in the past [5]. From a judgmental point of view, it is important that medical experts can trust the algorithm’s predictions. In the field of bioinformatics [6,7,8] and medical imaging [9,10], deep learning algorithms have obtained impressive results. In recent times real-life applications of soft computing techniques in different fields have proved that deep learning can have a good impact on human lives [11,12,13,14,15,16,17,18,19].
The most common deep learning-based methods in the field of medical image segmentation are U-Net [20] and Fully Convolutional Network (FCN) [21]. Among them, U-net has proved to be the most reliable technique in terms of performance. The U-net architecture has a U-symmetrical structure where the left side performs encoder task and the right side of the architecture performs decoder task. Another specification in this architecture is that the encoder concatenates the corresponding layer of the decoder. This characteristic allows the resultant feature map to have both low-level and high-level features. Further, the model performance is improved by integrating features from different levels while preserving the location information.
The 3-dimensional (3D) segmentation based on MRI [22] and the 2-dimensional 2D segmentation based on slice [23] are the main methods for brain tumor segmentation. In the case of MRI-based 3D segmentation, there are few training data with labels [3,24,25], and it is difficult to increase the amount of data. In particular, enormous network parameters and memory issues make it hard to train 3D models.
Havaei et al. [26] proposed a specific multipath convolution neural network (CNN) to segment the brain tumor region on the 2D sliced data of the MRI image. Besides, they used two training steps (phases) to deal with unbalanced classes of input data. Shen et al. developed a boundary-aware FCN to improve the segmentation performance [27]. Later, Kamnitsas et al. [22] developed a 3D network called Deep Medic that extracts multi-scale feature maps and incorporates them locally and globally using a two-path architecture.
On the other hand, training data for 2D segmentation are 155 times more dense (each 3D-MRI datum contains 155 2D sliced data), so 2D segmentation has drawn attention recently [28]. In particular, patch-based 2D models such as Pereira [23] and FCN-based (fully convolutional networks) 2D models [21] such as U-net [20] are two representative kinds for 2D brain tumor segmentation. The patch-based model classifies surrounding patches to determine which class each pixel belongs to. The pipeline of the patch-based model is generally composed of three main steps: pre-processing, classification using CNNs, and post-processing, which takes time and cannot be carried out end-to-end [28].
In 2018 Wang et al. proposed a technique to gain long-range dependency of spatial-dimension [29]. For this purpose, the weighted sum of all responses was taken to generate a spatial feature response. Further, in another study, the network learned long-range context with the help of location-sensitive NL [30]. An increase in interest for network architecture such as FCN and U-net has occurred in recent years. Among them, U-Net is the most widely used architecture due to its high performance. In the recent reputed publication, the U-Net architecture was declared as a genetic solution algorithm for research problems related to biomedical image data [31]. However, U-net was developed for segmentation work for binary classes, and the output resolution is smaller than the input resolution because it does not use convolution with padding. Therefore, U-net cannot be directly applied if we require similar output resolution as that of input. Further, the U-Net architecture gradually recovers the downsampling image, and low-level features from shallow layers are shared with the deep layers. This direct information bridge generates distortion in the information, which affects the final prediction. However, an effective information bridge between shallow and deep layers can enhance the local features, which may improve the brain tumor segmentation performance. W-Net is another architecture that resembles the U-Net architecture, which uses two-stage U-Net. However, the problem with W-Net is the high number of trainable parameters it has, which makes it difficult to train the model.
Keeping in mind the limitations in the baseline model, in this paper we propose a network named BU-Net. For brain image segmentation, BU-Net introduces two modules that are embedded in a U-Net architecture. These modules are residual extended skip (RES) and wide context (WC), which were inspired by inception net [32] and deep lab [33] respectively. The following are the contributions made by the BU-Net,
- Both new modules in BU-Net help to get the contextual information along with aggregation in the global features.
- Residual extended skip (RES) converts the low-level features to middle-level features.
- It is useful when scale-invariant features are used, which is important in the case of brain tumor segmentation, as the cancer regions vary from case to case.
- The RES module increases the valid receptive field, which remains a problem in previous techniques, as in those techniques the theoretical receptive field is always dominant.
- Two combined loss functions are used to tackle the problem associated with a huge difference in the percentage of pixels occupied by each class.
BU-Net has exhibited promising results when compared with existing state-of-the-art brain tumor segmentation techniques.
2. Datasets
In this section, we discuss the publicly available benchmark databases used in this study.
The proposed BU-Net model was evaluated on two benchmark datasets. These datasets are BraTS 2017 and BraTS 2018. The BraTS 2017 dataset consists of images collected from 285 glioma patients, out of which 210 were HGG cases and the remainder belong to LGG cases. Further, the validation dataset of BraTS 2017 carries images of 46 patients with unknown grade. The ground truths of the training data were labeled by the experts, and the labels of validation dataset are not made publicly available; therefore, the results can only be generated from the online web-server of BraTS. The dataset is labeled as four main classes which are:
- Enhancing tumor.
- Necrosis and non-enhancing tumor.
- Edema.
- Healthy tissue.
Figure 1 shows the two sample cases from the dataset. The BraTS 2018 dataset contains similar training images as that of BraTS 2017. The labeling procedure and classes remain the same. The only difference being made in BraTS 2018 is of the validation dataset. A new validation dataset is made available which carried images collected from 66 patients from unknown grade.
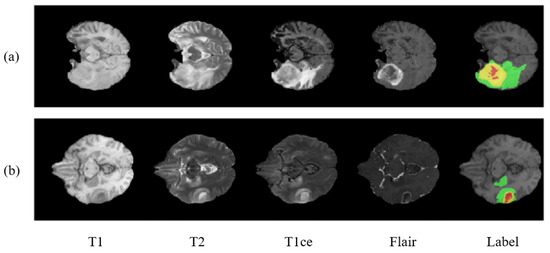
Figure 1.
Showing two cases (a,b) of a brain tumor with multimodal and labeled plots. From left to right are T1, T2, T1ce (T1c), flair, and the ground truth (labels). In ground truth images there are 3 colors used to represent three different tumor classes. Red represents necrosis and non-enhancing; green represents edema; and yellow represents an enhancing tumor.
3. Methodology
In this section, we first discuss image preprocessing, which is necessary for an input image. Then, proposed BU-Net is discussed along with the two modules RES and WC, which are included to get better performance.
3.1. Image Preprocessing
One of the weaknesses of deep learning models is that they are robust to noise; therefore, data processing is an important task to be carried out before the image is given to the network. For this purpose, N4ITK algorithm [34], a bias correction technique, is used on all images to make them homogeneous. In the literature many different algorithms are used for the pre-processing of the input images; however, the majority of the literature suggests that the N41TK algorithm for brain image pre-processing is the most reliable [35,36]. The N41TK algorithm is capable of correcting the bias field of MRI data. Moreover, the intensities at top 1% and bottom 1% are discarded, as done in [26]. As a final step, all the images are normalized to a zero mean with unit variance.
3.2. Proposed BU-Net
In previous baseline architecture, no contextual information is shared between the shallow and deep layers. There is a need to introduce a module which can create an information bridge between shallow and deep layers so that local and global features of the network can be enhanced. Figure 2 shows the overall architecture of the proposed BU-Net, which includes RES blocks and a WC block. The architecture takes input images of resolution and outputs the images with the same dimensions. The left part of the model act as an encoder and the right part of the model acts as a decoder. The convolution layers with padding are used in BU-Net. This allows getting the same sized image as the output as that given as input.
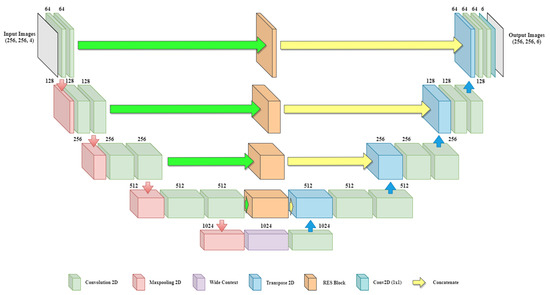
Figure 2.
Overall architecture of the proposed BU-Net including RES blocks and wide context block.
The encoder and decoder of the network are divided into blocks. On the encoder side every block consists of two convolution layers along with a single max-pooling layer and a dropout layer. Every block of the decoder side starts with the Conv2DTranspose layer applied on the output of the previous block. The output of Conv2DTranspose layer is concatenated with the output generated from the associated RES block. Dropout is applied to the concatenated output followed by two convolution layers. The last block of the decoder includes another convolution layer with six filters of size . The encoder side performs the contraction process on the image, and the decoder side performs the expansion process. Further, for the transition from the encoder to the decoder, the architecture uses a wide context block. All the convolution layers of BU-Net are followed by batch normalization and ReLU activation function, except for the last convolution layer, which uses a sigmoid activation function. The numerical representations of ReLU and sigmoid activation function are as follows:
The BU-Net is implemented on Keras framework [37]. To set the dropout ratio, we applied hyper-parameter tuning—a range of dropout ratios were tested to get the most optimal dropout ratio; 0.3 proved to be the most optimal dropout ratio for the network. Adam optimizer was used along with the customized loss function. The learning rate was set to 0.01 with a momentum of 0.9. The batch size was 16, and early stopping based on validation loss with patience level of 10 was utilized for the maximum number of training iterations.
The RES block, wide context block, and customized loss function are discussed in upcoming subsections.
3.2.1. Residual Extended Skip (RES)
Figure 3 shows the architecture of the residual extended skip (RES) block. The input to the architecture is given to 5 parallel connections. In the first four of them, two convolutions layers are applied. In each connection with convolution layers, we have used filter size for first convolution layer and filter size for second convolution layer. We used two cascaded convolution layers rather than using a single convolution layer with the filter size of . Using two convolution layers generates a lesser number of parameters which benefits the overall architecture. Moreover, during experiments, the observation was made that the impact of cascaded convolution layers with the lower number of parameters is similar to that of a single layer of convolution having a higher number of parameters. The last connection is a skip connection where the input is as it is forwarded. All the outputs from five connections are summed up to get a single output. Three convolution layers one after another are applied on the summed output. The three convolution layers have filter sizes of , , and .
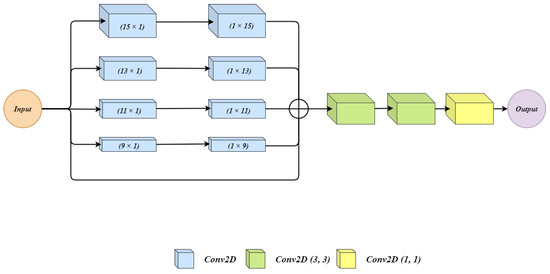
Figure 3.
The architecture for Residual Extended Skip (RES) block.
The RES block generates the middle-level features from the low-level features, which helps to control the information degradation. The cancer regions have high size variations for which residual extended skip performs contextual aggregation on multiple scales, which makes it scale-invariant. The RES increases the valid receptive field, and this allows the BU-Net to have better segmentation.
3.2.2. Wide Context (WC)
Figure 4 shows the architecture of the wide context (WC) block. The input to WC is given to two parallel connections. Both the connections have 2 convolution layers. In the first connection, the two convolution layers use and respectively. The second connection first uses the filter size, and then the next convolution layer has filter size . This change in combination in both the connections makes up a good feature set which can contribute towards the performance. The observation was made that a change in combination changes the extracted features, and both the combinations can contribute towards the final result. The outputs from both connections are summed up and treated as an output of WC.
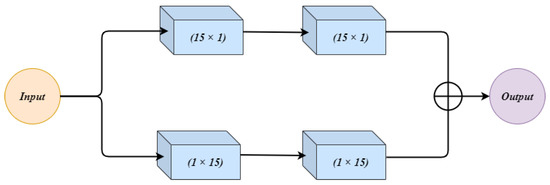
Figure 4.
The architecture for the Wide Context (WC) block.
The wide context (WC), similarly to RES, extracts the contextual information which is important for sub-classification between different sub-classes of cancer. Further, it performs the feature aggregation at the transition level, which leads to a better reconstruction of the segmented regions.
3.2.3. Customized Loss Function
One of the challenges with brain tumor segmentation is related to the imbalance class data. For reference, Table 1 shows the distribution of the classes for BraTS training data. The total area covered by healthy tissues in brain tumor MRI is 98.46%. The edema region covers 1.02% and the enhancing tumor region covers 0.29% of brain tumor MRI image. The lowest volume is covered by the non-enhancing tumor, which is only 0.23%. The large difference has a severe effect on the segmentation performance.

Table 1.
Distribution of area to classes in MRI brain tumor image.
To address the discussed problem, BU-Net utilizes a combined loss function that sums weight cross-entropy (WCE) and Dice loss coefficient (DLC). The respective mathematical expressions for the loss functions are as follows:
where N represents the total number of labels, is the assigned weight to the label “j”. Further, denotes the predicted binary pixel value of segmented image and denotes ground truth binary pixel value of the segmented image. Thus, the total loss function will be:
The loss function is composed of two objective functions: one objective function is used to get maximum overlap between the ground truth and predicted segmented regions regardless of the class, which is performed by Dice loss coefficient (DLC); and the second objective function is responsible for classifying the tissue cells concerning their class, which is performed by weight cross-entropy (WCE).
4. Results and Discussion
We have carried out quantitative and qualitative analysis. For quantitative analysis, the performance evaluation in terms of numbers is discussed. For qualitative analysis, the visual quality of the results is discussed.
For evaluating the performance of BU-Net, we have used the Dice score as the figure of merit. Dice score is used by the previous state-of-the-art techniques, so it will allow us to have a better quantitative comparative analysis between existing state-of-the-art and proposed BU-Net architectures. The Dice score gives similarity between sets P & Q which can be mathematically expressed as
where and represents the cardinalities of sets P & Q respectively.
Firstly the proposed model was evaluated on BraTS 2017 HGG dataset which has 210 cases. Out of these cases, 80% were used for training purposes and the other 20% were used for testing purposes. The training and testing cases are defined by the BraTS challenge. Table 2 shows the achieved results by BU-Net compared with existing techniques. All the architectures have used similar cost functions, optimizers and all other co-factors. BU-Net obtained gains of 7%, 6.6% and 8.5% when compared with its baseline U-Net for segmentation of whole, core, and enhancing tumor segmentation respectively. In terms of Dice score, the proposed model has further outperformed four existing state-of-the-art techniques which hold the best performance of segmentation for HGG data.
Table 2.
Comparison of results with the BraTS 2017 HGG data.
For further evaluation of BU-Net, results were obtained for the whole dataset of BraTS 2017. In this experiment, there were 228 MRI scans used for training purposesm and the remaining 57 MRI scans were used for testing. Table 3 illustrates the attained results using BU-Net and its comparison with the best existing techniques. In case of enhancing tumor and core tumor the best results from the literature are received by ResU-Net. In its comparison our proposed model has shown a performance increase of 0.3% and 0.5% for enhancing tumor and core tumor respectively. Bets results reported in the literature for the whole tumor are by NovelNet. Even in this case, the proposed BU-Net have shown an improvement of 1.6%. The difference between the performance of state-of-the-art techniques and BU-Net exhibits the fact that proposed model can effectively identify the small tumor regions.
Table 3.
Comparison of results with the whole BraTS 2017 dataset (57 MRI scans).
The third experiment is carried out on the BraTS 2018 dataset. In this dataset, there are 285 training samples and 66 testing samples. Table 4 illustrates the comparison of the results of BU-Net and other state-of-the-art techniques on BraTS 2018 validation dataset. The BU-Net architecture has achieved the dice score of 0.901, 0.837, 0.788 for whole, core and enhancing tumor respectively. The proposed model has exhibited better performance when compared with either the baseline architecture which is U-Net or the other existing state-of-the-art techniques. The better performance by the BU-Net shows that it has high intersection over union, which means the model can identify majority of the area for every tumor type.
Table 4.
Comparison of results with the BraTS 2018 validation dataset. (66 MRI scans).
In the research problem associated with segmentation, the qualitative analysis is as important as quantitative analysis. For this reason, we have carried out qualitative analysis. Figure 5 illustrates the visual comparison between the ground truth and the predicted segmented region using BU-Net and U-Net for four different cases. As can be seen that the predicted regions by BU-Net show high likeness with the ground truth. Further, the visual quality comparison can be made between the performance of U-Net and BU-Net. The U-Net prediction holds many unwanted regions segmented as edema which is the false prediction of edema region. BU-Net has shown high resemblance with the ground truth. While identifying the necrosis region, the U-Net architecture seems to be unable to identify the whole region. Whereas BU-Net has covered most of the area of necrosis region. The high resemblance between ground truth and proposed architecture, speaks about the high quality of BU-Net architecture.
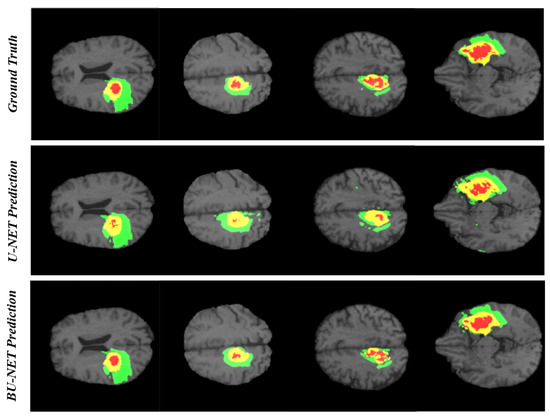
Figure 5.
The qualitative analysis of BU-Net and U-Net. There are 3 colors used to represent three different tumor classes. Red represents necrosis and non-enhancing; green represents edema; and yellow represents an enhancing tumor.
5. Conclusions
Brain tumor segmentation is a difficult task due to the complexity of MRI brain images, and it aims to predict tumors by segmenting them through artificial intelligence models. We propose BU-Net to segment and classify the brain tumor regions. For the definite segmentation of brain tumors, we have proposed a novel model with modifications in encoder–decoder architecture. We have introduced two new blocks, namely, residual extended skip (RES) and wide context (WC), into the existing U-Net architecture. Special attention is given to the contextual features of the MRI scans which have proved to be beneficial for the segmentation of tumor regions. An increase in the valid receptive field is achieved using RES block, which improves the overall performance. The proposed BU-Net architecture was evaluated on BraTS 2017 and 2018 datasets. BU-Net has exhibited good improvement when compared with baseline U-Net architecture and other existing efficient segmentation models. The proposed model is a brain lesion segmentation prediction framework, and as a related study, it contributes towards the precise segmentation of brain lesions regions. The 2D U-Net has the limitation of information loss when compared with 3D U-Net. BU-Net loses local details and context information between different slices. In the future, the authors intend to explore 3D-based networks to improve the performance of segmentation.
Author Contributions
Conceptualization, M.U.R., S.C., J.H.K., and K.T.C.; methodology, M.U.R. and S.C.; software, M.U.R. and S.C.; validation, M.U.R., S.C., J.H.K., and K.T.C.; investigation, M.U.R., S.C., J.H.K., and K.T.C.; writing—original draft preparation: M.U.R. and S.C.; writing—review and editing, M.U.R., S.C., J.H.K., and K.T.C.; supervision, J.H.K. and K.T.C. All authors have read and agreed to the published version of the manuscript.
Funding
This work was supported by the National Research Foundation of Korea(NRF) grant funded by the Korea government(MSIT) (No. 2020R1A2C2005612) and the Brain Research Program of the National Research Foundation (NRF) funded by the Korean government (MSIT) (No. NRF-2017M3C7A1044816).
Conflicts of Interest
The authors declare no conflict of interest. The funders had no role in the design of the study; in the collection, analyses or interpretation of data; in the writing of the manuscript, or in the decision to publish the results.
References
- Işın, A.; Direkoğlu, C.; Şah, M. Review of MRI-based brain tumor image segmentation using deep learning methods. Procedia Comput. Sci. 2016, 102, 317–324. [Google Scholar] [CrossRef]
- Bakas, S.; Akbari, H.; Sotiras, A.; Bilello, M.; Rozycki, M.; Kirby, J.S.; Freymann, J.B.; Farahani, K.; Davatzikos, C. Advancing the cancer genome atlas glioma MRI collections with expert segmentation labels and radiomic features. Sci. Data 2017, 4, 170117. [Google Scholar] [CrossRef] [PubMed]
- Bakas, S.; Reyes, M.; Jakab, A.; Bauer, S.; Rempfler, M.; Crimi, A.; Shinohara, R.T.; Berger, C.; Ha, S.M.; Rozycki, M.; et al. Identifying the best machine learning algorithms for brain tumor segmentation, progression assessment, and overall survival prediction in the BRATS challenge. arXiv 2018, arXiv:1811.02629. [Google Scholar]
- Saut, O.; Lagaert, J.B.; Colin, T.; Fathallah-Shaykh, H.M. A multilayer grow-or-go model for GBM: Effects of invasive cells and anti-angiogenesis on growth. Bull. Math. Biol. 2014, 76, 2306–2333. [Google Scholar] [CrossRef]
- Goceri, E.; Goceri, N. Deep learning in medical image analysis: Recent advances and future trends. In Proceedings of the International Conferences on Computer Graphics, Visualization, Computer Vision and Image Processing 2017 and Big Data Analytics, Data Mining and Computational Intelligence 2017—Part of the Multi Conference on Computer Science and Information Systems 2017, Lisbon, Portugal, 21–23 November 2017. [Google Scholar]
- Rehman, M.U.; Chong, K.T. DNA6mA-MINT: DNA-6mA modification identification neural tool. Genes 2020, 11, 898. [Google Scholar] [CrossRef]
- Abbas, Z.; Tayara, H.; Chong, K.T. SpineNet-6mA: A Novel Deep Learning Tool for Predicting DNA N6-Methyladenine Sites in Genomes. IEEE Access 2020, 8, 201450–201457. [Google Scholar] [CrossRef]
- Alam, W.; Ali, S.D.; Tayara, H.; to Chong, K. A CNN-Based RNA N6-Methyladenosine Site Predictor for Multiple Species Using Heterogeneous Features Representation. IEEE Access 2020, 8, 138203–138209. [Google Scholar] [CrossRef]
- Ur Rehman, M.; Khan, S.H.; Rizvi, S.D.; Abbas, Z.; Zafar, A. Classification of skin lesion by interference of segmentation and convolotion neural network. In Proceedings of the 2018 2nd International Conference on Engineering Innovation (ICEI), Bangkok, Thailand, 5–6 July 2018; pp. 81–85. [Google Scholar]
- Khan, S.H.; Abbas, Z.; Rizvi, S.D.; Rizvi, S.M.D. Classification of Diabetic Retinopathy Images Based on Customised CNN Architecture. In Proceedings of the 2019 Amity International Conference on Artificial Intelligence (AICAI), Dubai, UAE, 4–6 February 2019; pp. 244–248. [Google Scholar]
- Banan, A.; Nasiri, A.; Taheri-Garavand, A. Deep learning-based appearance features extraction for automated carp species identification. Aquac. Eng. 2020, 89, 102053. [Google Scholar] [CrossRef]
- Fan, Y.; Xu, K.; Wu, H.; Zheng, Y.; Tao, B. Spatiotemporal Modeling for Nonlinear Distributed Thermal Processes Based on KL Decomposition, MLP and LSTM Network. IEEE Access 2020, 8, 25111–25121. [Google Scholar] [CrossRef]
- Shamshirband, S.; Rabczuk, T.; Chau, K.W. A survey of deep learning techniques: Application in wind and solar energy resources. IEEE Access 2019, 7, 164650–164666. [Google Scholar] [CrossRef]
- Faizollahzadeh Ardabili, S.; Najafi, B.; Shamshirband, S.; Minaei Bidgoli, B.; Deo, R.C.; Chau, K.W. Computational intelligence approach for modeling hydrogen production: A review. Eng. Appl. Comput. Fluid Mech. 2018, 12, 438–458. [Google Scholar] [CrossRef]
- Taormina, R.; Chau, K.W. ANN-based interval forecasting of streamflow discharges using the LUBE method and MOFIPS. Eng. Appl. Artif. Intell. 2015, 45, 429–440. [Google Scholar] [CrossRef]
- Wu, C.; Chau, K.W. Prediction of rainfall time series using modular soft computingmethods. Eng. Appl. Artif. Intell. 2013, 26, 997–1007. [Google Scholar] [CrossRef]
- Ghani, A. Healthcare electronics—A step closer to future smart cities. ICT Express 2019, 5, 256–260. [Google Scholar] [CrossRef]
- Ghani, A.; See, C.H.; Sudhakaran, V.; Ahmad, J.; Abd-Alhameed, R. Accelerating Retinal Fundus Image Classification Using Artificial Neural Networks (ANNs) and Reconfigurable Hardware (FPGA). Electronics 2019, 8, 1522. [Google Scholar] [CrossRef]
- Ilyas, T.; Khan, A.; Umraiz, M.; Kim, H. SEEK: A Framework of Superpixel Learning with CNN Features for Unsupervised Segmentation. Electronics 2020, 9, 383. [Google Scholar] [CrossRef]
- Ronneberger, O.; Fischer, P.; Brox, T. U-net: Convolutional networks for biomedical image segmentation. In Proceedings of the International Conference on Medical Image Computing and Computer-Assisted Intervention, Munich, Germany, 5–9 October 2015; pp. 234–241. [Google Scholar]
- Long, J.; Shelhamer, E.; Darrell, T. Fully convolutional networks for semantic segmentation. In Proceedings of the IEEE Conference on Computer Vision and Pattern Recognition, Boston, MA, USA, 7–12 June 2015; pp. 3431–3440. [Google Scholar]
- Kamnitsas, K.; Ledig, C.; Newcombe, V.F.; Simpson, J.P.; Kane, A.D.; Menon, D.K.; Rueckert, D.; Glocker, B. Efficient multi-scale 3D CNN with fully connected CRF for accurate brain lesion segmentation. Med. Image Anal. 2017, 36, 61–78. [Google Scholar] [CrossRef]
- Pereira, S.; Pinto, A.; Alves, V.; Silva, C.A. Deep convolutional neural networks for the segmentation of gliomas in multi-sequence MRI. In Proceedings of the BrainLes 2015, Munich, Germany, 5 October 2015; pp. 131–143. [Google Scholar]
- Liu, L.; Zheng, G.; Bastian, J.D.; Keel, M.J.B.; Nolte, L.P.; Siebenrock, K.A.; Ecker, T.M. Periacetabular osteotomy through the pararectus approach: Technical feasibility and control of fragment mobility by a validated surgical navigation system in a cadaver experiment. Int. Orthop. 2016, 40, 1389–1396. [Google Scholar] [CrossRef]
- Lloyd, C.T.; Sorichetta, A.; Tatem, A.J. High resolution global gridded data for use in population studies. Sci. Data 2017, 4, 1–17. [Google Scholar] [CrossRef]
- Havaei, M.; Davy, A.; Warde-Farley, D.; Biard, A.; Courville, A.; Bengio, Y.; Pal, C.; Jodoin, P.M.; Larochelle, H. Brain tumor segmentation with deep neural networks. Med. Image Anal. 2017, 35, 18–31. [Google Scholar] [CrossRef]
- Shen, H.; Wang, R.; Zhang, J.; McKenna, S.J. Boundary-aware fully convolutional network for brain tumor segmentation. In Proceedings of the International Conference on Medical Image Computing and Computer-Assisted Intervention, Quebec City, QC, Canada, 10–14 September 2017; pp. 433–441. [Google Scholar]
- Meng, Z.; Fan, Z.; Zhao, Z.; Su, F. ENS-Unet: End-to-end noise suppression U-Net for brain tumor segmentation. In Proceedings of the 2018 40th Annual International Conference of the IEEE Engineering in Medicine and Biology Society (EMBC), Honolulu, HI, USA, 18–21 July 2018; pp. 5886–5889. [Google Scholar]
- Wang, X.; Girshick, R.; Gupta, A.; He, K. Non-local neural networks. In Proceedings of the IEEE Conference on Computer Vision and Pattern Recognition, Salt Lake City, UT, USA, 18–23 June 2018; pp. 7794–7803. [Google Scholar]
- Zhao, H.; Zhang, Y.; Liu, S.; Shi, J.; Change Loy, C.; Lin, D.; Jia, J. Psanet: Point-wise spatial attention network for scene parsing. In Proceedings of the European Conference on Computer Vision (ECCV), Munich, Germany, 8–14 September 2018; pp. 267–283. [Google Scholar]
- Xia, X.; Kulis, B. W-net: A deep model for fully unsupervised image segmentation. arXiv 2017, arXiv:1711.08506. [Google Scholar]
- Szegedy, C.; Ioffe, S.; Vanhoucke, V.; Alemi, A. Inception-v4, inception-resnet and the impact of residual connections on learning. arXiv 2016, arXiv:1602.07261. [Google Scholar]
- Chen, L.C.; Papandreou, G.; Kokkinos, I.; Murphy, K.; Yuille, A.L. Deeplab: Semantic image segmentation with deep convolutional nets, atrous convolution, and fully connected crfs. IEEE Trans. Pattern Anal. Mach. Intell. 2017, 40, 834–848. [Google Scholar] [CrossRef] [PubMed]
- Tustison, N.J.; Avants, B.B.; Cook, P.A.; Zheng, Y.; Egan, A.; Yushkevich, P.A.; Gee, J.C. N4ITK: Improved N3 bias correction. IEEE Trans. Med. Imaging 2010, 29, 1310–1320. [Google Scholar] [CrossRef] [PubMed]
- Zhao, X.; Wu, Y.; Song, G.; Li, Z.; Zhang, Y.; Fan, Y. A deep learning model integrating FCNNs and CRFs for brain tumor segmentation. Med. Image Anal. 2018, 43, 98–111. [Google Scholar] [CrossRef]
- Devunooru, S.; Alsadoon, A.; Chandana, P.; Beg, A. Deep learning neural networks for medical image segmentation of brain tumours for diagnosis: A recent review and taxonomy. J. Ambient Intell. Human. Comput. 2020. [Google Scholar] [CrossRef]
- Chollet, F. Keras: Deep Learning Library for Theano and Tensorflow. 2015, Volume 7, p. T1. Available online: Https://keras.Io (accessed on 22 July 2020).
- Pereira, S.; Pinto, A.; Alves, V.; Silva, C.A. Brain tumor segmentation using convolutional neural networks in MRI images. IEEE Trans. Med. Imaging 2016, 35, 1240–1251. [Google Scholar] [CrossRef]
- Dong, H.; Yang, G.; Liu, F.; Mo, Y.; Guo, Y. Automatic brain tumor detection and segmentation using U-Net based fully convolutional networks. In Proceedings of the Annual Conference on Medical Image Understanding and Analysis, Southampton, UK, 9–11 July 2017; pp. 506–517. [Google Scholar]
- Chen, L.; Wu, Y.; DSouza, A.M.; Abidin, A.Z.; Wismüller, A.; Xu, C. MRI tumor segmentation with densely connected 3D CNN. In Proceedings of the Medical Imaging 2018: Image Processing, Houston, TX, USA, 10–15 February 2018; Volume 10574. [Google Scholar]
- Kermi, A.; Mahmoudi, I.; Khadir, M.T. Deep convolutional neural networks using U-Net for automatic brain tumor segmentation in multimodal MRI volumes. In Proceedings of the International MICCAI Brainlesion Workshop, Granada, Spain, 16 September 2018; pp. 37–48. [Google Scholar]
- Badrinarayanan, V.; Kendall, A.; Cipolla, R. Segnet: A deep convolutional encoder-decoder architecture for image segmentation. IEEE Trans. Pattern Anal. Mach. Intell. 2017, 39, 2481–2495. [Google Scholar] [CrossRef]
- Li, H.; Li, A.; Wang, M. A novel end-to-end brain tumor segmentation method using improved fully convolutional networks. Comput. Biol. Med. 2019, 108, 150–160. [Google Scholar] [CrossRef]
- Çiçek, Ö.; Abdulkadir, A.; Lienkamp, S.S.; Brox, T.; Ronneberger, O. 3D U-Net: Learning dense volumetric segmentation from sparse annotation. In Proceedings of the International Conference on Medical Image Computing and Computer-Assisted Intervention, Athens, Greece, 17–21 October 2016; pp. 424–432. [Google Scholar]
- Albiol, A.; Albiol, A.; Albiol, F. Extending 2D deep learning architectures to 3D image segmentation problems. In Proceedings of the International MICCAI Brainlesion Workshop, Granada, Spain, 16 September 2018; pp. 73–82. [Google Scholar]
- Wang, G.; Li, W.; Ourselin, S.; Vercauteren, T. Automatic brain tumor segmentation using convolutional neural networks with test-time augmentation. In Proceedings of the International MICCAI Brainlesion Workshop, Granada, Spain, 16 September 2018; pp. 61–72. [Google Scholar]
- Chen, W.; Liu, B.; Peng, S.; Sun, J.; Qiao, X. S3D-UNet: Separable 3D U-Net for brain tumor segmentation. In Proceedings of the International MICCAI Brainlesion Workshop, Granada, Spain, 16 September 2018; pp. 358–368. [Google Scholar]
- Hu, K.; Gan, Q.; Zhang, Y.; Deng, S.; Xiao, F.; Huang, W.; Cao, C.; Gao, X. Brain tumor segmentation using multi-cascaded convolutional neural networks and conditional random field. IEEE Access 2019, 7, 92615–92629. [Google Scholar] [CrossRef]


Publisher’s Note: MDPI stays neutral with regard to jurisdictional claims in published maps and institutional affiliations. |
© 2020 by the authors. Licensee MDPI, Basel, Switzerland. This article is an open access article distributed under the terms and conditions of the Creative Commons Attribution (CC BY) license (http://creativecommons.org/licenses/by/4.0/).