1. Introduction
Acceleration sensors are usually based on inertial measurement principles. The proof mass inside the acceleration measurement sensor is connected to the measuring instrument shell through the spring component, and the shell is closely connected to the measured object [
1,
2]. Acceleration measurement is realized by detecting the relative motion of proof mass and shell [
3,
4,
5]. Physical connections are susceptible to material rigidity, the thermal expansion coefficient, and mechanical friction, which are unsuitable for specific applications, such as environmental and structural monitoring, where high-resolution and responsiveness sensors often sacrifice the working range [
6,
7].
Suspension acceleration measurement devices, where the proof mass is not physically connected to the measuring device, are classified into the electrostatic suspension type, superparamagnetic suspension type, and anti-magnetic suspension type [
8,
9,
10,
11,
12]. Electrostatic suspension acceleration measurements rely on the electric field force to suspend the induced mass in the vacuum shell. The acceleration is measured by detecting the potential change caused by the displacement change of the mass. The measurement accuracy of the electrostatic suspension accelerometer is
g [
13], but the measurement dynamic range is small, the bandwidth is narrow, and the requirement of the applied voltage is high [
14]. The proof mass of the superparamagnetic accelerometer uses superparamagnetic material, and the superparamagnetic material consists of nano-scale Fe
O
. Calculating acceleration by measuring the displacement change of the proof mass [
15,
16,
17] is still under research. The diamagnetic suspension accelerometer uses pyrolytic graphite as suspension mass material, and achieves acceleration measurement through optical displacement detection and electrostatic force feedback. The measurement range can reach 0.5 g with a measurement accuracy of 1
g [
18,
19], which has the disadvantage of a small measurement range.
In this paper, electromagnetic suspension technology is adopted for acceleration measurement. The suspended mass has no mechanical friction and wear [
20,
21,
22]. Compared with the traditional acceleration measurement method, this method can change the dynamic and static characteristics of the system [
23,
24]. Electromagnetic levitation technology can change the damping by adjusting the digital circuit, which is more convenient and efficient and can effectively meet the needs of measurement, and also achieve high-precision acceleration with a large dynamic range. The suspended mass is more suitable for measuring three-dimensional acceleration signals, and the measurement accuracy is high. The electromagnetic suspension acceleration measurement system has broad application prospects in life and engineering.
2. Principle Analysis
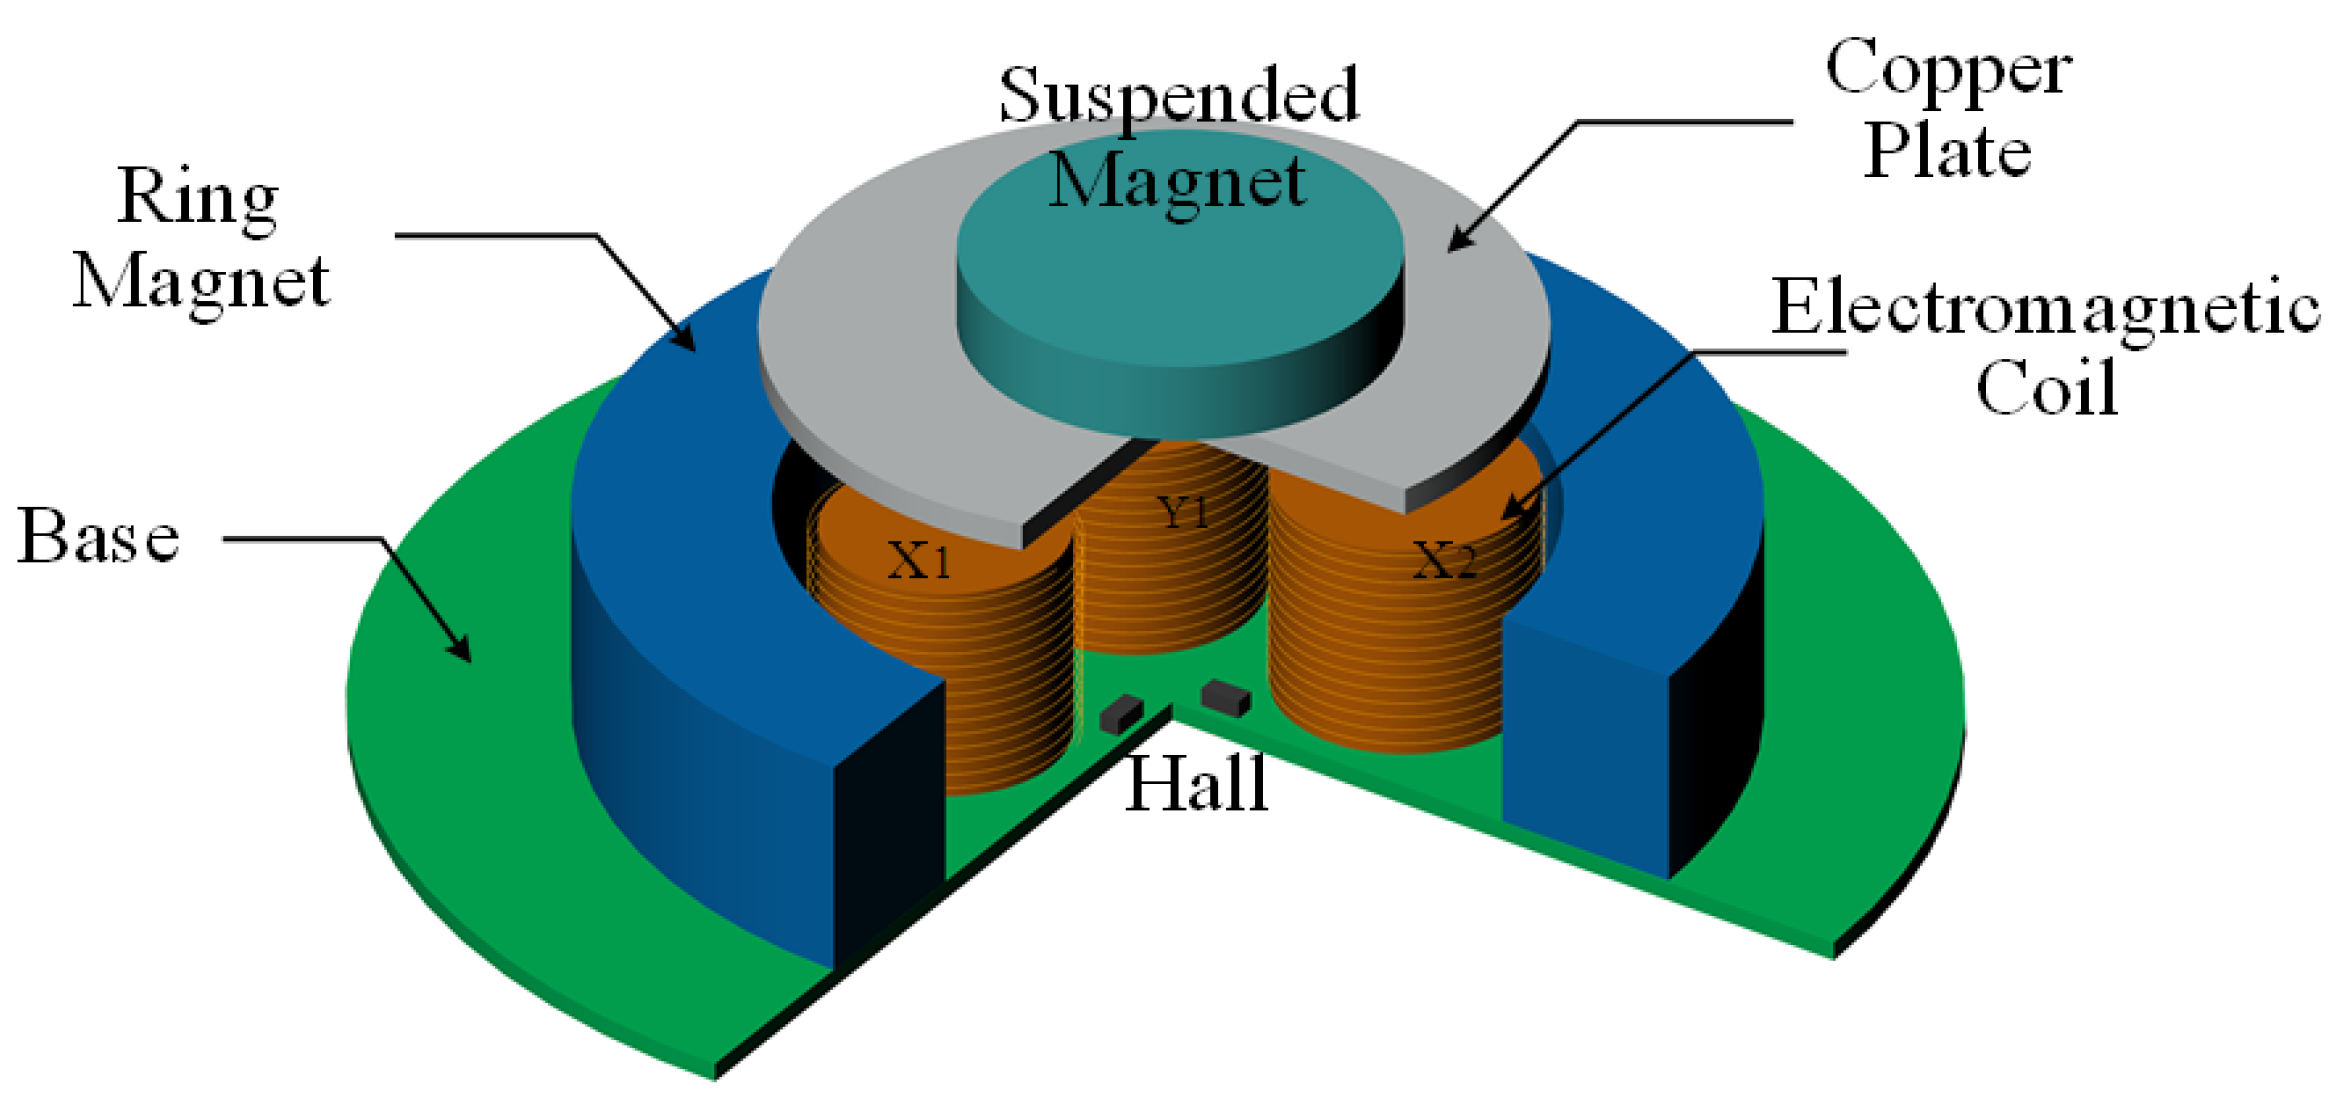
The pushdown electromagnetic suspension model is shown in
Figure 1. The system consists of a suspended magnet, electromagnetic coil, annular magnet, and base. The outer diameter of the annular permanent magnet is
mm, the inner diameter
mm, the thickness is 10 mm, and the material uses a ferrite magnet.The diameter of the suspended magnet is
mm, and the weight is
kg. The number of turns of the electromagnetic coil is 531, and the resistance is 6.8
.
The Hall sensor detects the voltage signal of the suspended magnet displacement, drives the electromagnetic coil through the driving amplifier circuit, and adjusts the position of the suspended magnet to stabilize the suspension. The annular permanent magnet provides a vertical supporting force to the suspended magnet, and the electromagnetic coil controls the horizontal movement of the suspended magnet.
The whole control flowchart of the pushdown electromagnetic suspension system is shown in
Figure 2. A linear Hall element is used to detect the voltage signal of the horizontal and vertical displacement changes of the suspended magnet. The amplified signal controls the electromagnetic coil to allow it to pass through the drive circuit. The magnetic field generated by the electromagnetic coil stabilizes the suspended magnet.
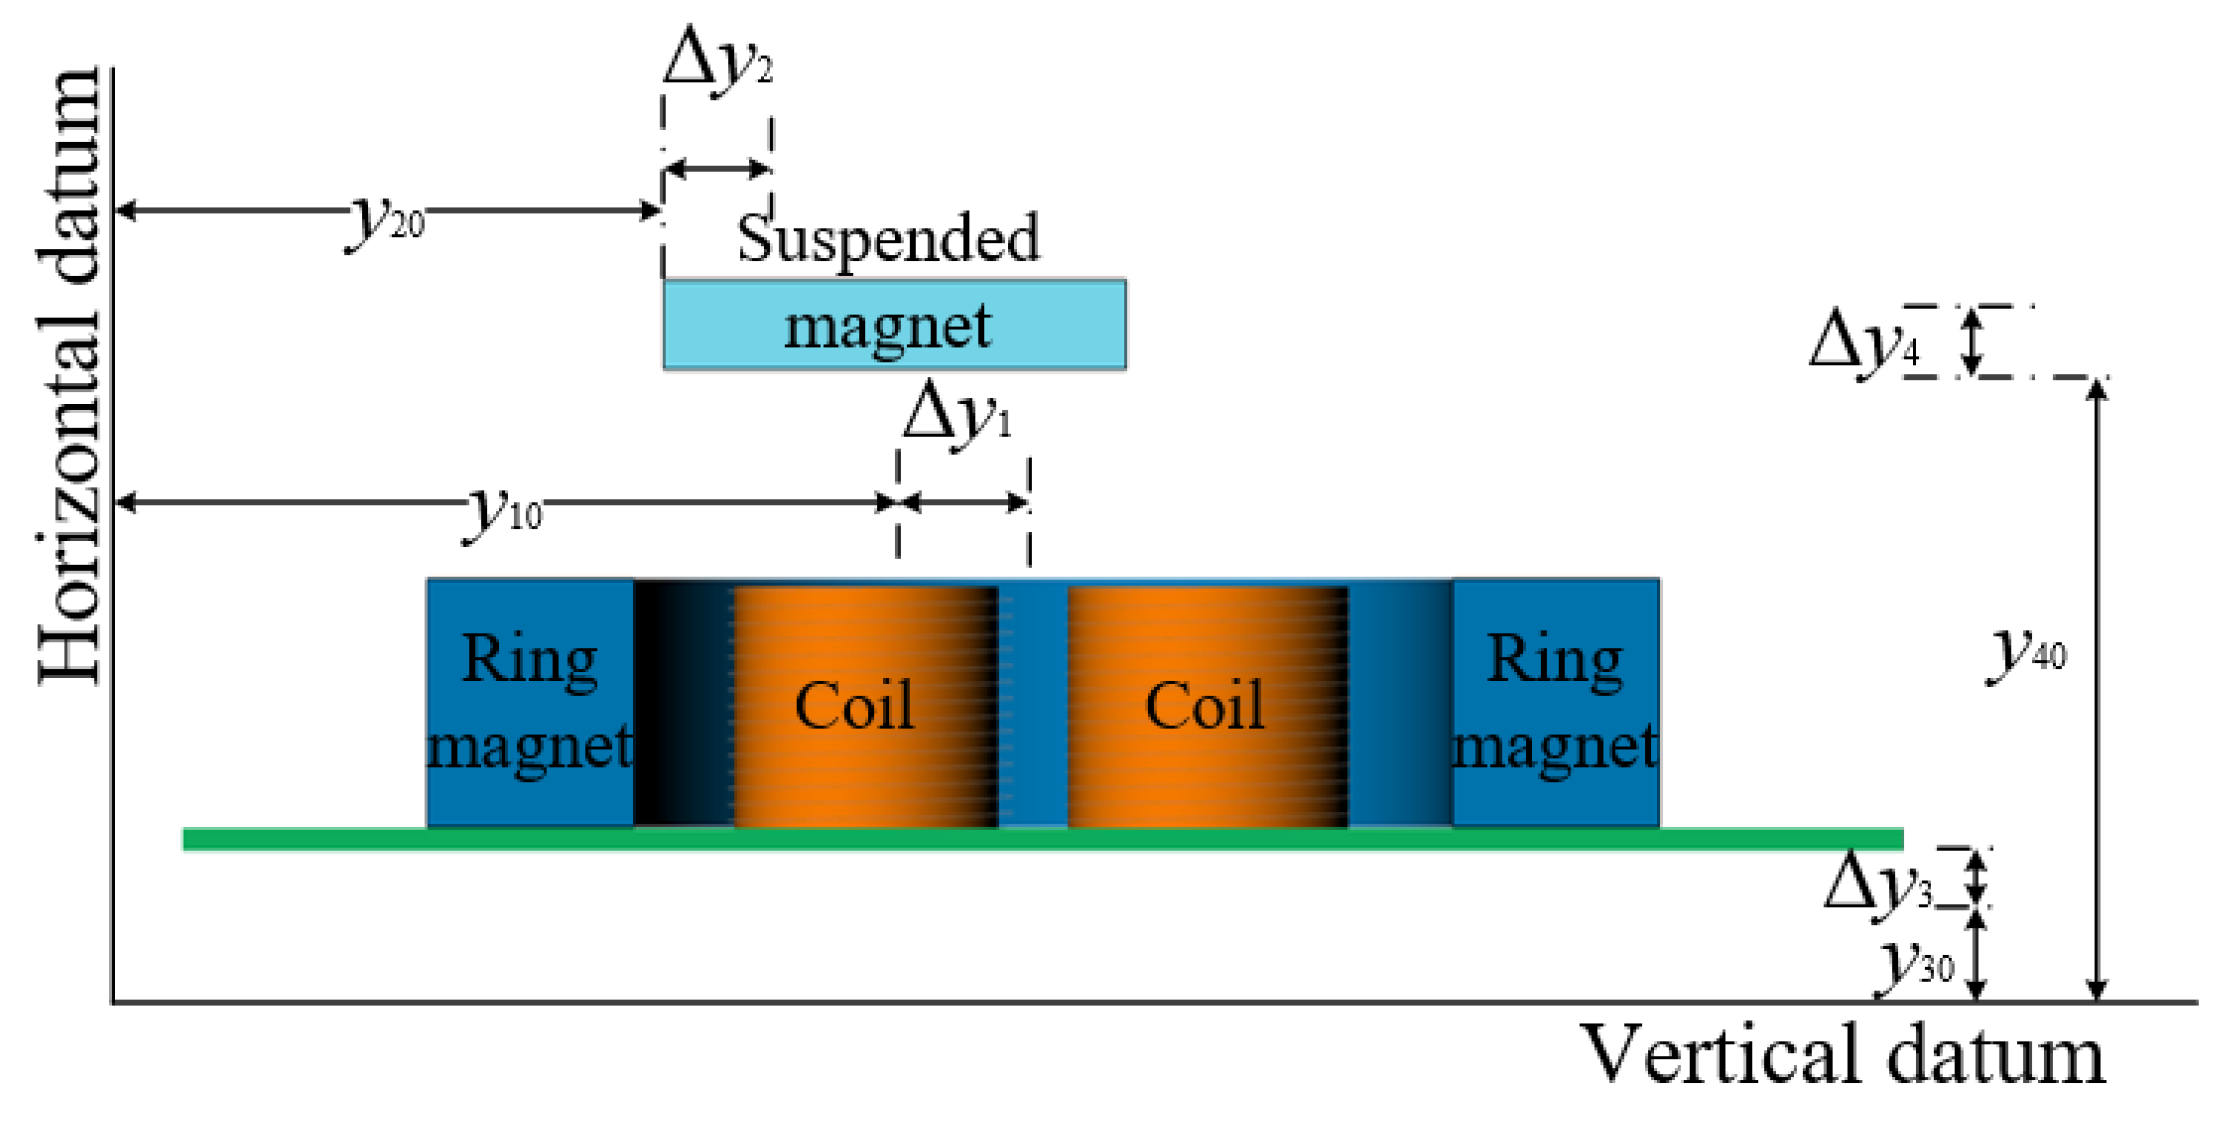
The acceleration measurement principle of the pushdown electromagnetic suspension system is shown in
Figure 3. The figure shows the profile of the measuring system. The base of the magnetic suspension measuring device is connected with the measured object. In the static state, the voltage measured by the Hall sensor is used as the standard voltage.
The base of the measurement model accelerates with the measured object. The suspended magnet remains stationary due to inertia. The magnetic induction strength around the Hall sensor increases, and the control current i(x) also increases. As the measured object acceleration a increases, the electromagnetic coil current increases. The suspended magnet is subjected to the same force F in the direction of motion, and the suspended magnet accelerates. The acceleration of the measured object can be calculated according to the displacement of the suspended magnet induced by the Hall sensor.
The vertical support force of the suspended magnet is provided by the annular permanent magnet, and the horizontal force is provided by the electromagnetic coil.
2.1. Horizontal Part of the Dynamic Equation
The horizontal direction of the pushdown system only maintains a stable balance through the electromagnetic force based on the previous analysis, and only through the electromagnetic force to maintain a stable balance, where the horizontal relative displacement of the suspended magnet is:
where
is the horizontal absolute displacement of the base,
is the relative movement displacement of the base at time
t,
is the horizontal absolute displacement of the suspended magnet,
is the relative movement displacement of the suspended magnet at time
t,
is the horizontal movement displacement of the base, and
is the horizontal movement of the suspended magnet.
According to Newton’s second law, the horizontal dynamic equation of a suspended magnet is:
where
m is the weight of the suspended mass.
(
) is the electromagnetic force on the suspended mass,
(
y) is the magnetic force on the suspended mass, and y is the relative displacement of the suspended mass. suspended magnet is the main research object.
Using the Taylor series expansion method, the electromagnetic force
was analyzed. We set the initial equilibrium position as
, and the magnitude of the electromagnetic force at this time was
. The high-order term in the equation was omitted because the amount of change in the initial equilibrium was small. The dynamic equation at the equilibrium point was obtained as follows:
where
is the control current change factor, and
is the relative displacement change factor.
The method of measuring the force by fixed displacement was used to measure the relationship between the suspension of the suspended magnet and the displacement
x, as shown in
Table 1.
According to
Table 1, the suspended magnet was approximately linearly related to the displacement force of the annular permanent magnet, and the equation was obtained by MATLAB data-fitting, as follows:
where
is the motion displacement of the suspended magnet;
is the force of the suspended magnet; and
is the magnetic coefficient.
The suspended magnet only moves in a small range at the equilibrium position, so the force could be approximated as a linear relationship. At the initial equilibrium position
, the electromagnetic coil had no electromagnetic force, and the acceleration of the suspended magnet could be obtained when there was an acceleration input. The dynamic equation is as follows:
The natural frequency of the repulsive magnetic suspension system is Hz. The natural angular frequency is rad/s. The damping rate of the system is .
2.2. Vertical Part of the Dynamic Equation
In the static state of the pushdown electromagnetic system, the vertical direction of the suspended magnet is only affected by the magnetic force of the annular permanent magnet. The vertical dynamic equations is as follows:
where
m is the weight of the suspended magnet, and
is the vertical force exerted on the suspended magnet by the permanent magnet.
The Taylor series expansion of the vertical force is performed at the initial equilibrium point
, and due to the displacement of the system being small at the initial equilibrium position, the high-order term of the Taylor expansion can be omitted as follows:
where
is the vertical displacement coefficient of the variation of the system.
The electromagnetic damping was added to the vertical direction of the pushdown system to reduce the time required for balance. As shown in
Figure 1, a copper plate was added below the suspension magnet, and the Eddy current magnetic field was produced by the change of the magnetic field, and the magnetic force was just the opposite of the moving direction. The damping formula is as follows [
25]:
where
is the damping force of the system,
J is the eddy current density,
v is the velocity of the suspended magnet,
B is the magnetic induction intensity, and
is the conductivity of the copper plate.
Substituting Formula (9) into Formula (8), the vertical dynamic equation of the suspended magnet is obtained:
The natural angular frequency of the system is rad/s, the natural frequency is Hz, and the damping ratio of the magnetic suspension system is . The horizontal and vertical movements of the pushdown electromagnetic suspension system are different, and the natural frequencies of each directional are also different. The damping in the horizontal x and y directions is the same. The damping in the z direction is small, and the 3D output needs to be matched.
3. Simulation Analysis
3.1. MATLAB Simulation
To verify the feasibility of the magnetic suspension system, Simulink simulation was carried out according to the dynamic equation. The simulation model is shown in
Figure 4.
The upper part of the simulation model was obtained according to the dynamic equation of the suspended magnet. The lower part of the simulation model is expressed as the relationship between the control system current and the displacement.
The upper half of the figure was obtained from the dynamic equation of the suspended magnet, and the lower half is expressed as the relationship between the current and the displacement of the control system—that is, the output current of the control circuit is finally expressed as the proportion and differential relationship of the displacement of the suspended magnet.
The simulation results are shown in
Figure 5. The simulation appears to be fluctuating at the beginning, and tends to be stable after three cycles. The simulation results prove the feasibility of the pushdown electromagnetic suspension system. The damping coefficient affects the fluctuation period. The Reference [
26] indicates that the damping ratio in a practical application is between 0.4–0.9. The underdamping state of the system can ensure the better dynamic response and measurement accuracy of the system.
3.2. Magnetic Field Simulation
The static magnetic field of the permanent magnet was analyzed using the electromagnetic analysis software Maxwell/3D. According to the system parameter simulation, the center of the annular permanent magnet was placed at the coordinate origin O, and the height of the suspended magnet was mm.
Through the simulation experiment, the magnetic lines of force, magnetic field strength, and magnetic induction intensity of the magnetic suspension model were drawn. The force analysis of the model was carried out, and the vertical and horizontal force relations of the model were simulated.
The magnetic field simulation diagram of the electromagnetic suspension measurement system is shown in
Figure 6. The annular magnet formed a magnetic field trap at the center position, and the magnetic trap provided vertical support for the suspended magnet, which can reduce the energy consumption in equilibrium, and the trap can provide a similar stable trend to the system, which can be kept stable only by horizontal control.
The simulation of the vertical force of the suspended magnet shows that the resultant force
F decreases with the increase of the height
h of the suspended magnet. The vertical equilibrium position of the system is obtained at
mm, which is the same as the actual suspension equilibrium position. The horizontal force of the suspended magnet includes the permanent magnet force
and the electromagnetic force
. The force in the vertical direction is only the permanent magnet force
. The equation for the relationship between force and displacement was obtained as follows:
where
is the force of the suspended magnet in the horizontal direction, and the unit is N;
x is the horizontal displacement, and the unit is mm;
is the vertical force of the suspended magnet, and the unit is N; and
is the displacement in the vertical direction, and the unit is mm.
4. Experimental Analysis
According to the simulation results, the pushdown electromagnetic suspension system was built and the multi-degree of the freedom vibration platform was used for the experiment. The test site is shown in
Figure 7. Vertical data optimization of the pushdown electromagnetic levitation system was done by measuring the acceleration of the multi-degree-of-freedom shaking table. The pushdown electromagnetic suspension measurement system was fixed on the multi-degree-of-freedom vibration table, and the measurement signal collected by the data acquisition card was transmitted to the computer for processing. The vibration table controller adjusts the vibration amplitude and frequency.
The vibrator intermittently inputs the vibration signal in the vertical direction, and the measured waveform is shown in
Figure 8.
As shown in
Figure 8, there is high-frequency vibration interference in the measurement signal of the electromagnetic suspension system. The wavelet denoise method was used to remove the interference signal. As shown in
Figure 8c, the original measurement signal after the four-level wavelet decomposition can filter out the interference signal and retain the detailed features. The waveform is basically the same as that measured by the MPU6050 accelerometer.
In regard to horizontal data optimization of the pushdown electromagnetic levitation system by measuring subway acceleration, the measurement waveform is shown in
Figure 9. The signal attenuation of the pushdown electromagnetic levitation system occurs when measuring a constant acceleration. After preliminary analysis, the capacitance in the circuit was shown to cause a reverse integration phenomenon. In order to de-integrate, we used MATLAB programming to reversely compensate the measurement signal. The waveform after de-integration is shown in
Figure 9, which is consistent with the MPU6050 accelerometer measurement waveform. In view of this phenomenon, the circuit can be further optimized to avoid the occurrence of reverse integration.
Through the experimental measurement, the horizontal acceleration measurement range of the pushdown system was ±3.3 m/s
and the vertical acceleration measurement range was ±10 m/s
. For experimental analysis, when the horizontal output voltage increment was 2.4 V, the output increment of the MPU6050 acceleration sensor was 1.14 m/s
, the vertical output voltage increment was 1.7 V, and the output increment of the MPU6050 acceleration sensor was 2.8 m/s
. The output increment ratio is the input increment ratio. The horizontal sensitivity is 21.05 V/g and the vertical sensitivity is 6.8 V/g. The accuracy of the virtual oscilloscope is 500
V, so the sensitivity factor method is used to express the sensitivity, and the horizontal and vertical sensitivities are 42,100 LSB/g and 12,140 LSB/g, respectively. The highest sensitivity of the MPU6050 is 16,384 LSB/g. The results show that the sensitivity of the electromagnetic suspension acceleration measurement system is much higher than that of the MPU6050. The noise of the sensor was also analyzed. The equivalent equation of the Brownian thermodynamic noise is [
27]:
where
is the root mean square of noise;
is the Boltzman’s Constant coefficient; T is the Calvin temperature;
is the natural frequency of the accelerometer; Q is the accelerometer quality factor; and m is the weight of the suspended magnet.
The natural frequency of the horizontal direction is 24.31 Hz, the natural frequency of the vertical direction is 7.59 Hz, and the quality factor is 1. The calculated horizontal noise is 3.7 g/, and that of vertical noise is 2.07 g/.The noise of MPU6050 is 400 g/, and the results show that the noise of the electromagnetic suspension acceleration measurement system is lower than that of MPU6050.
To study the amplitude-frequency characteristics of the pushdown system, the standard sine signal was sent out by the vibration table, and the frequency of the vibration table was adjusted to measure the output waveform of the pushdown system. According to the ratio of the amplitude of the output signal to the input signal, the amplitude-frequency characteristic curve was obtained. As shown in
Figure 10, the amplitude ratio of the horizontal amplitude-frequency characteristics of the system dropped fast above 500 Hz, and the vertical one dropped fast above 650 Hz. Avoiding the natural frequency, the horizontal bandwidth of the system was 50–500 Hz, and the vertical bandwidth was 35–650 Hz.
The technical indexes, such as measurement accuracy and natural frequency of the pushdown electromagnetic suspension acceleration measurement system were calculated, as shown in
Table 2.
According to
Table 2, the measurement sensitivity, vibration frequency range, and system noise level of the pushdown electromagnetic suspension measurement system are higher than those of the MPU6050 accelerometer. The pushdown electromagnetic suspension measurement system has obvious advantages in measuring high-frequency acceleration, but the acceleration measurement range using the magnetic suspension technology is significantly smaller than the MPU6050 accelerometer, which needs to be further optimized.
5. Analysis of Measured Data
Comparing the performance of the pushdown electromagnetic suspension measurement system and the MPU6050 accelerometer, the measuring device was fixed on the floor of the car. The x-direction of the accelerometer is the forward direction of the car, the y-direction is the lateral direction of the car, and the z-direction is the vertical direction. The measurement waveform of the MPU6050 accelerometer is consistent with the trend of the waveform measured by the pushdown electromagnetic suspension acceleration measurement system. The minimum acceleration appears in 3.38 s, and the acceleration of MPU6050 is −1.813 m/s, and electromagnetic suspension system acceleration is −1.799 m/s. The maximum acceleration appears in 3.47 s, the acceleration of MPU6050 is 2.611 m/s, and the acceleration of the electromagnetic suspension system is 2.583 m/s. The experimental results show that the acceleration measurement method is feasible.
The
z-direction measurement method is the same as the
x-direction—measuring the car starting process, acceleration process, deceleration process, and stopping the process. The measurement results are shown in
Figure 11, as well as the
x- and
y-direction pushdown electromagnetic suspension measurement systems and the MPU6050 accelerometer measurement waveform comparison diagram. We compared two random points in the figure, taking 3 s and 4 s in the
x-direction, where the acceleration of the MPU6050 was −0.5 m/s
, 0.593 m/s
, and the acceleration of the electromagnetic suspension system was −0.56 m/s
, 5.74 m/s
. Taking 3 s and 5 s in the
y-direction, the acceleration of MPU6050 was −0.325 m/s
, −0.712 m/s
, and the acceleration of the electromagnetic suspension system was −0.214 m/s
, −0.597 m/s
. According to the results, the pushdown electromagnetic suspension measurement system is more accurate in the
z-direction measurement, and the error is larger in the
x- and
y-direction measurement. It is necessary to further optimize the two directions. The measurement trends of the two devices are the same, but the electromagnetic suspension acceleration measurement system has more sampling points and can retain more details of vibration acceleration, which is suitable for measuring high-frequency acceleration.
As shown in
Figure 12, it is a composition graph of the three-dimensional acceleration signal measured by the pushdown electromagnetic suspension system. The three-dimensional graph reflects the change of acceleration over the entire five-second interval. The system moves around the center, point O. As shown in the figure, the acceleration in the
x direction changes significantly, and the changes in the
z and
y directions are small, reflecting the three-dimensional motion state of the measured object.
In summary, the pushdown electromagnetic suspension system can measure the acceleration, and it has more advantages in measuring the frequently changing acceleration. The repulsive magnetic levitation acceleration measurement system can realize three-dimensional measurement of acceleration. The system realizes frictionless measurement of three-dimensional acceleration.


