Smart Camera for Quality Inspection and Grading of Food Products


Abstract
:1. Introduction
1.1. Date Skin Quality Evaluation
1.2. Oyster Shape Quality
2. Methods
2.1. Visual Inspection Algorithm
2.2. Feature Composition
2.3. Evolutionary Learning
2.3.1. Feature Formation
2.3.2. Feature Evaluation
2.4. Feature Selection
2.5. Smart Camera
2.5.1. Hardware
2.5.2. Functions
- Allowing the user to easily configure the camera settings;
- Saving camera setting for future use;
- Capturing images from real factory conditions;
- Allowing the user to label captured images;
- Preparing labeled data for training;
- Loading trained models;
- Receiving signals from the conveyor belt;
- Allowing the user to easily calibrate the sorting outputs;
- Classifying objects as they pass under the camera;
- Controlling signals to appropriately sort objects on the conveyor belt.
2.5.3. Operation
3. Experiments, Results, and Discussions
3.1. Date Skin Quality
3.1.1. Performance
3.1.2. Visualization of Date Features
3.2. Oyster Shape Quality
3.2.1. Performance
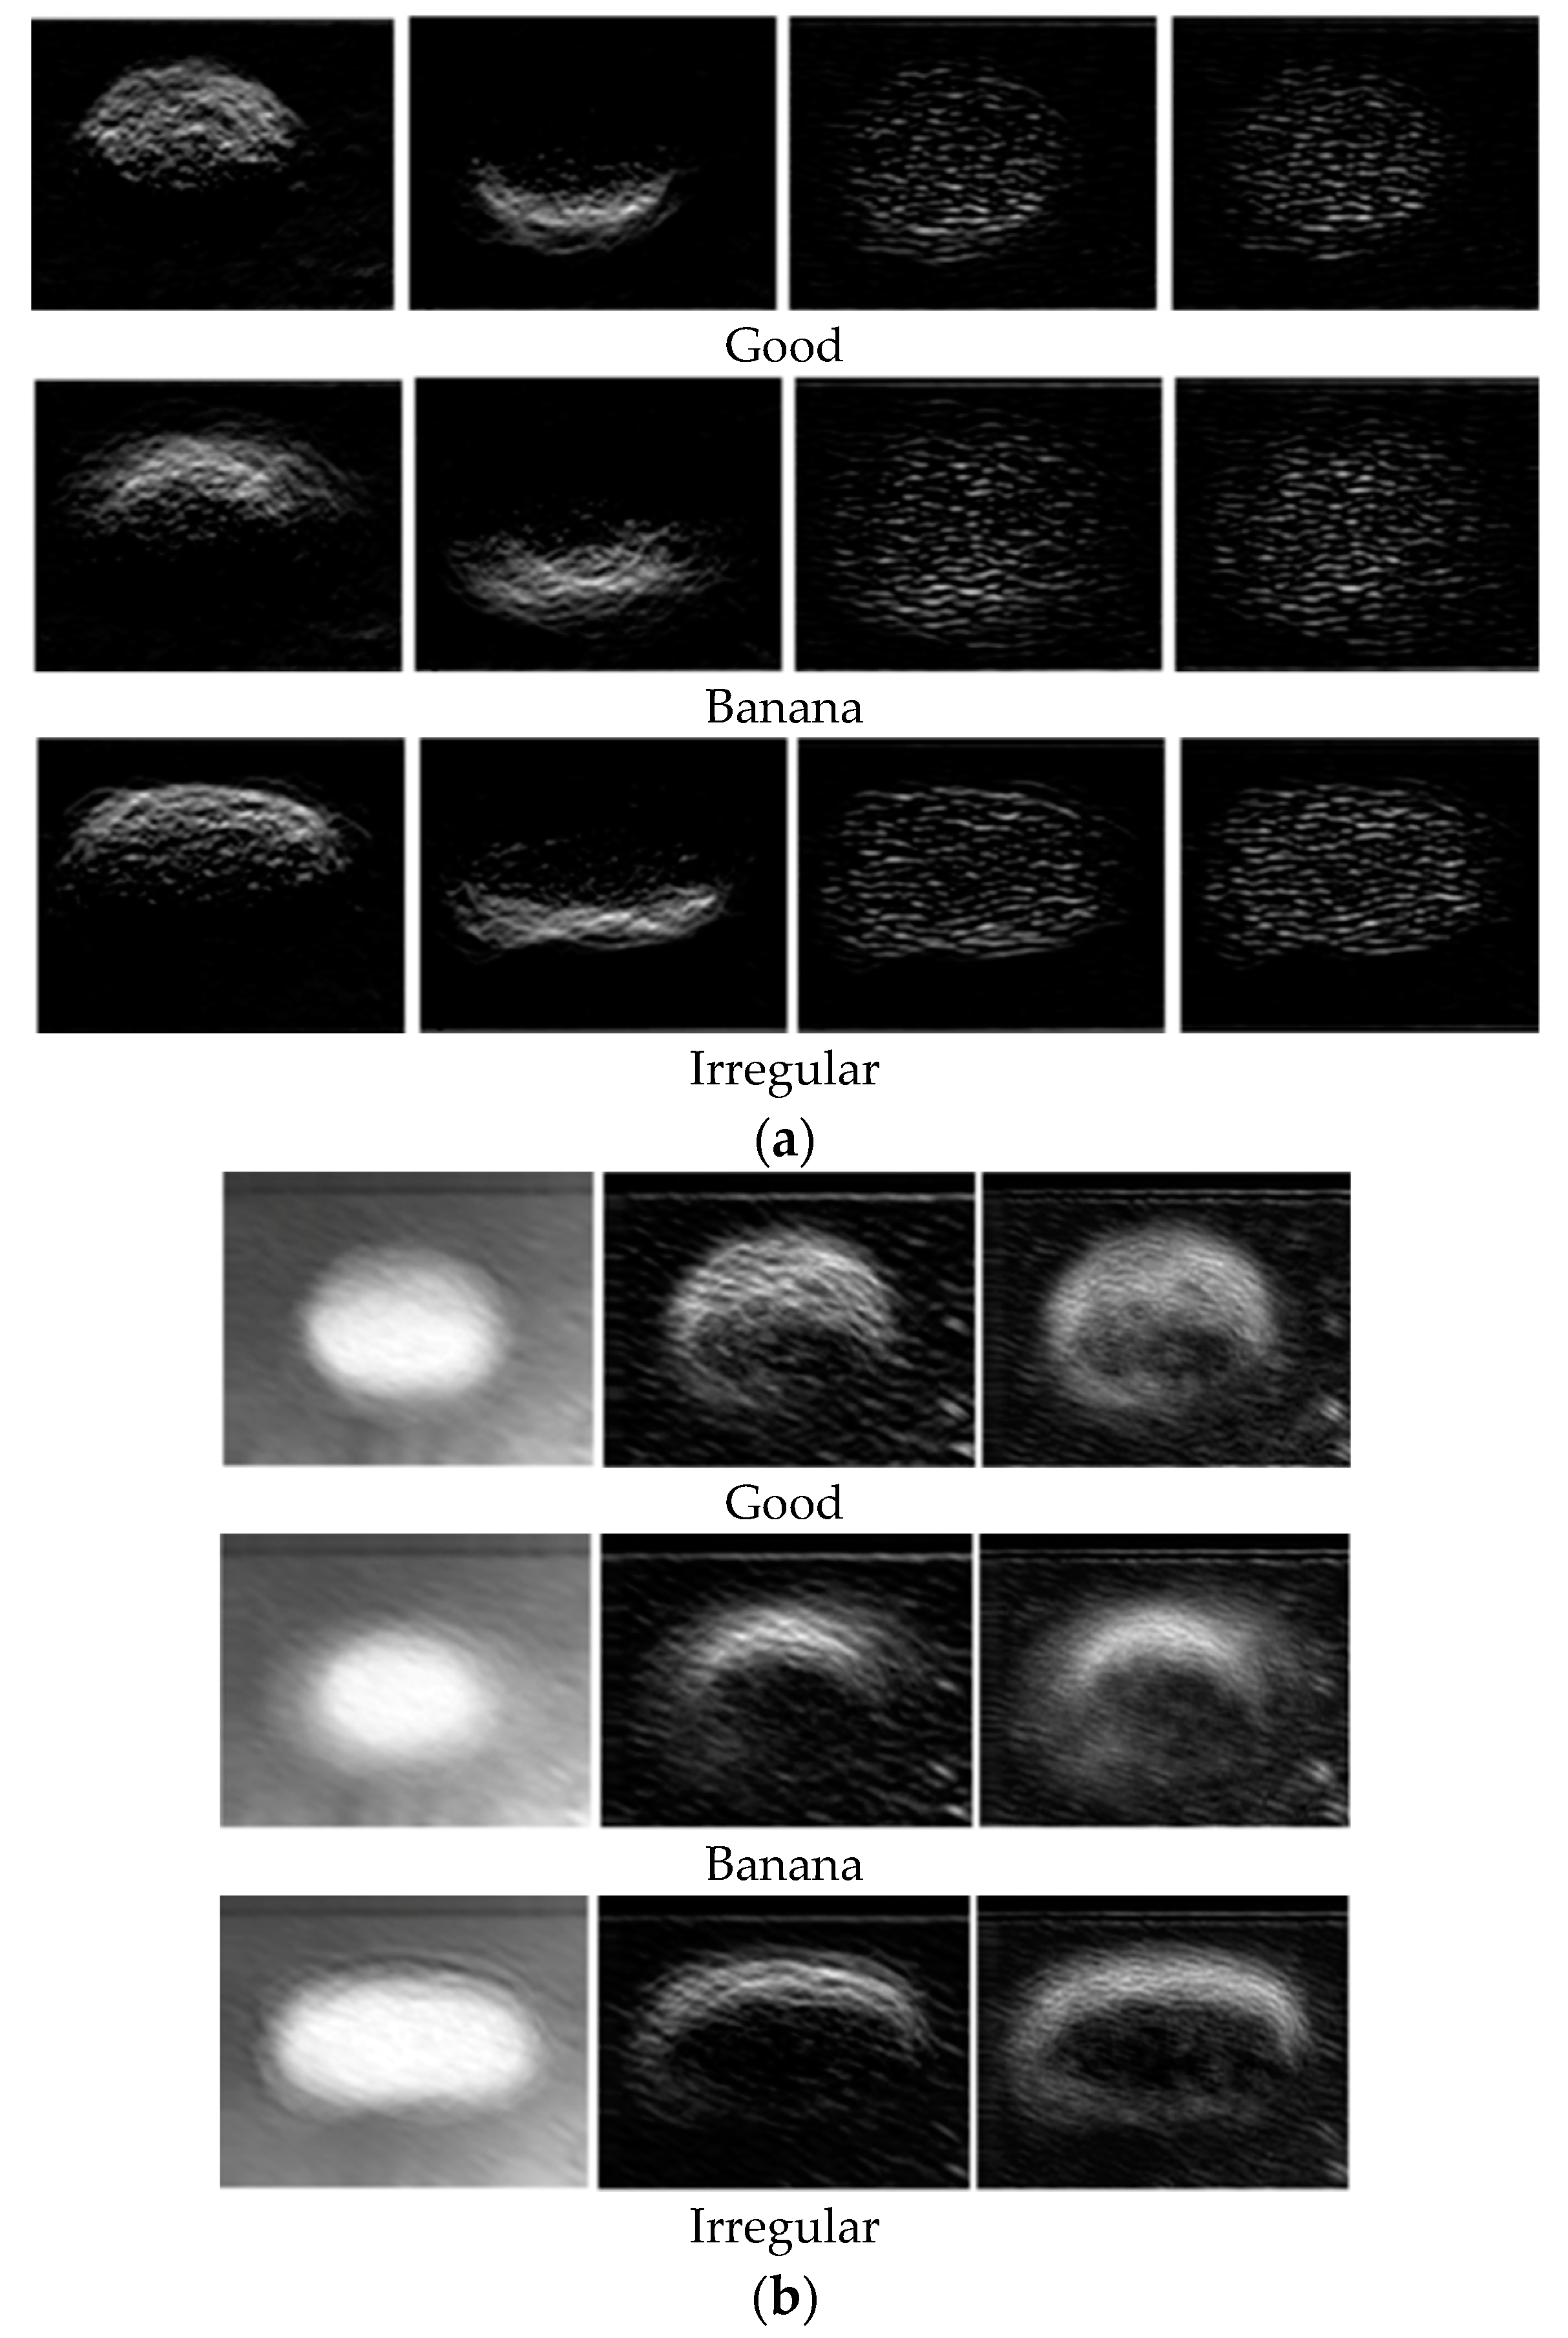
3.2.2. Visualization of Oyster Features
4. Conclusions
Supplementary Materials
Author Contributions
Funding
Conflicts of Interest
References
- Ireri, D.; Belal, E.; Okinda, C.; Makange, N.; Ji, C. A computer vision system for defect discrimination and grading in tomatoes using machine learning and image processing. Artif. Intell. Agric. 2019, 2, 28–37. [Google Scholar] [CrossRef]
- Nandi, C.S.; Tudu, B.; Koley, C. A machine vision technique for grading of harvested mangoes based on maturity and quality. IEEE Sens. J. 2016, 16, 6387–6396. [Google Scholar] [CrossRef]
- Kanade, A.; Shaligram, A. Prepackaging Sorting of Guava Fruits using Machine Vision based Fruit Sorter System based on K-Nearest Neighbor Algorithm. Int. J. Sci. Res. Comput. Sci. Eng. Inf. Technol. 2018, 3, 1972–1977. [Google Scholar]
- Prakasa, E.; Rosiyadi, D.; Ni’Mah, D.F.I.; Khoiruddin, A.A.; Lestriandoko, N.H.; Suryana, N.; Fajrina, N. Automatic region-of-interest selection for corn seed grading. In Proceedings of the 2017 International Conference on Computer, Control, Informatics and Its Applications (IC3INA), Jakarta, Indonesia, 23–26 October 2017; pp. 23–28. [Google Scholar]
- Kaur, H.; Sawhney, B.K.; Jawandha, S.K. Evaluation of plum fruit maturity by image processing techniques. J. Food Sci. Technol. 2018, 55, 3008–3015. [Google Scholar] [CrossRef]
- Kumar, R.A.; Rajpurohit, V.S.; Bidari, K.Y. Multi Class Grading and Quality Assessment of Pomegranate Fruits Based on Physical and Visual Parameters. J. Fruit Sci. 2019, 19, 372–396. [Google Scholar] [CrossRef]
- Septiarini, A.; Hamdani, H.; Hatta, H.R.; Kasim, A.A. Image-based processing for ripeness classification of oil palm fruit. In Proceedings of the 2019 5th International Conference on Science in Information Technology (ICSITech), Yogyakarta, Indonesia, 23–24 October 2019; pp. 23–26. [Google Scholar]
- Zhang, D.; Lee, D.J.; Tippetts, B.J.; Lillywhite, K.D. Date maturity and quality evaluation using color distribution analysis and back projection. J. Food Eng. 2014, 131, 161–169. [Google Scholar] [CrossRef]
- Zhang, D.; Lee, D.J.; Tippetts, B.J.; Lillywhite, K.D. Date quality evaluation using short-wave infrared imaging. J. Food Eng. 2014, 141, 74–84. [Google Scholar] [CrossRef]
- Bhargava, A.; Bansal, A. Fruits and vegetables quality evaluation using computer vision: A review. J. King Saud Univ. Comput. Inf. Sci. 2018. [Google Scholar] [CrossRef]
- Naik, S.; Patel, B. Machine vision based fruit classification and grading-a review. Int. J. Comp. Appl. 2017, 170, 22–34. [Google Scholar] [CrossRef]
- Hasan, R.; Monir, S.M.G. Fruit maturity estimation based on fuzzy classification. In Proceedings of the 2017 IEEE International Conference on Signal and Image Processing Applications (ICSIPA), Kuching, Malaysia, 12–14 September 2017; pp. 27–32. [Google Scholar]
- Kumar, R.A.; Rajpurohit, V.S.; Nargund, V.B. A neural network assisted machine vision system for sorting pomegranate fruits. In Proceedings of the 2017 Second International Conference on Electrical, Computer and Communication Technologies (ICECCT), Coimbatore, India, 22–24 February 2017; pp. 1–9. [Google Scholar]
- Lal, S.; Behera, S.K.; Sethy, P.K.; Rath, A.K. Identification and counting of mature apple fruit based on BP feed forward neural network. In Proceedings of the 2017 Third International Conference on Sensing, Signal Processing and Security (ICSSS), Chennai, India, 4–5 May 2017; pp. 361–368. [Google Scholar]
- Choi, H.S.; Cho, J.B.; Kim, S.G.; Choi, H.S. A real-time smart fruit quality grading system classifying by external appearance and internal flavor factors. In Proceedings of the 2018 IEEE International Conference on Industrial Technology (ICIT), Lyon, France, 20–22 February 2018; pp. 2081–2086. [Google Scholar]
- Hambali, H.A.; Abdullah, S.L.S.; Jamil, N.; Harun, H. Fruit Classification using Neural Network Model. J. Telecommun. Electronic Comput. Eng. 2017, 9, 43–46. [Google Scholar]
- Nagata, F.; Tokuno, K.; Tamano, H.; Nakamura, H.; Tamura, M.; Kato, K.; Otsuka, A.; Ikeda, T.; Watanabe, K.; Habib, M.K. Basic application of deep convolutional neural network to visual inspection. In Proceedings of the International Conference on Industrial Application Engineering (ICIAE2018), Okinawa, Japan, 27–31 March 2018; pp. 4–8. [Google Scholar]
- Nishi, T.; Kurogi, S.; Matsuo, K. Grading fruits and vegetables using RGB-D images and convolutional neural network. In Proceedings of the 2017 IEEE Symposium Series on Computational Intelligence (SSCI), Honolulu, HI, USA, 27 November–1 December 2017; pp. 1–6. [Google Scholar]
- Suganya, V.; Thilagavathi, P. A fruit quality inspection system using faster region convolutional neural network. Int. Res. J. Eng. Technol. 2019, 6, 6717–6720. [Google Scholar]
- Sun, Y.; Zhu, L.; Wang, G.; Zhao, F. Multi-input convolutional neural network for flower grading. J. Electr. Comput. Eng. 2017, 2017, 1–8. [Google Scholar] [CrossRef] [Green Version]
- Guo, Z.; Zhang, M.; Lee, D.J. Efficient evolutionary learning algorithm for real-time embedded vision applications. Electronics 2019, 8, 1367. [Google Scholar] [CrossRef] [Green Version]
- Zhang, M. Evolutionary Learning of Boosted Features for Visual Inspection Automation. Ph.D. Thesis, Brigham Young University, Provo, UT, USA, 12 February 2018. [Google Scholar]
- Wright, G.C. The commercial date industry in the United States and Mexico. HortScience 2016, 51, 1333–1338. [Google Scholar] [CrossRef] [Green Version]
- Ohali, Y.A. Computer vision based date fruit grading system: Design and implementation. J. King Saud. Univ. Comp. Inf. Sci. 2011, 23, 29–36. [Google Scholar] [CrossRef] [Green Version]
- Alavi, N. Quality determination of Mozafati dates using Mamdani fuzzy inference system. J. Saudi. Soc. Agric. Sci. 2013, 12, 137–142. [Google Scholar] [CrossRef] [Green Version]
- Hakami, A.; Arif, M. Automatic Inspection of the External Quality of the Date Fruit. Procedia Comput. Sci. 2019, 163, 70–77. [Google Scholar] [CrossRef]
- Nasiri, A.; Taheri-Garavand, A.; Zhang, Y.D. Image-based deep learning automated sorting of date fruit. Postharvest Biol. Technol. 2019, 153, 133–141. [Google Scholar] [CrossRef]
- Hossain, M.S.; Muhammad, G.; Amin, S.U. Improving consumer satisfaction in smart cities using edge computing and caching: A case study of date fruits classification. Future Gener. Comput. Syst. 2018, 88, 333–341. [Google Scholar] [CrossRef]
- Altaheri, H.; Alsulaiman, M.; Muhammad, G. Date fruit classification for robotic harvesting in a natural environment using deep learning. IEEE Access 2019, 7, 117115–117133. [Google Scholar] [CrossRef]
- Abdellahhalimi, A.R.; Abdenabi, B.; ElBarbri, N. Sorting dates fruit bunches based on their maturity using camera sensor system. J. Theor. Appl. Inf. Technol. 2013, 56, 325–337. [Google Scholar]
- Muhammad, G. Date fruits classification using texture descriptors and shape-size features. Eng. Appl. Artif. Intell. 2015, 37, 361–367. [Google Scholar] [CrossRef]
- Haidar, A.; Dong, H.; Mavridis, N. Image-based date fruit classification. In Proceedings of the IV International Congress on Ultra Modern Telecommunications and Control Systems, St. Petersburg, Russia, 3–5 October 2012; pp. 357–363. [Google Scholar]
- Alzu’Bi, R.; Anushya, A.; Hamed, E.; Al Sha’Ar, E.A.; Vincy, B.S.A. Dates fruits classification using SVM. AIP Conf. Proc. 2018, 1952, 020078. [Google Scholar]
- Aiadi, O.; Kherfi, M.L.; Khaldi, B. Automatic Date Fruit Recognition Using Outlier Detection Techniques and Gaussian Mixture Models. Electron. Lett. Comput. Vis. Image Anal. 2019, 18, 51–75. [Google Scholar]
- U.S. Food and Drug Administration, Center for Food Safety and Applied Nutrition. 2020 Interstate Certified Shellfish Shippers List. Available online: https://www.fda.gov/food/federalstate-food-programs/interstate-certified-shellfish-shippers-list (accessed on 6 March 2020).
- Hutt, M. Virginia Marine Products Board, Newport News, Virginia. Personal communication, 29 September 2004. [Google Scholar]
- Brake, J.; Evans, F.; Langdon, C. Is beauty in the eye of the beholder? Development of a simple method to describe desirable shell shape for the Pacific oyster industry. J. Shellfish Res. 2003, 22, 767–771. [Google Scholar]
- Damar, S.; Yagiz, Y.; Balaban, M.O.; Ural, S.; Oliveira, A.; Crapo, A.C. Prediction of oyster volume and weight using machine vision. J. Aquat. Food Prod. Technol. 2008, 15, 3–15. [Google Scholar] [CrossRef]
- Lee, D.J.; Eifert, J.D.; Zhan, P.C.; Westover, B.P. Fast surface approximation for volume and surface area measurements using distance transform. Optical Eng. 2003, 42, 2947–2955. [Google Scholar]
- Lee, D.J.; Xu, X.; Lane, R.M.; Zhan, P.C. Shape analysis for an automatic oyster grading system. In Proceedings of the SPIE Optics East, Two and Three-Dimensional Vision Systems for Inspection, Control, and Metrology II 2003, Philadelphia, PA, USA, 25–28 October 2004; pp. 27–36. [Google Scholar]
- Xiong, G.; Lee, D.J.; Moon, K.R.; Lane, R.M. Shape similarity measure using turn angle cross-correlation for oyster quality evaluation. J. Food Eng. 2010, 100, 178–186. [Google Scholar] [CrossRef]
- Lillywhite, K.D.; Tippetts, B.J.; Lee, D.J. Self-tuned Evolution-COnstructed features for general object recognition. Pattern Recognit. 2012, 45, 241–251. [Google Scholar] [CrossRef]
- Lillywhite, K.D.; Tippetts, B.J.; Lee, D.J.; Archibald, J.K. A feature construction method for general object recognition. Pattern Recognit. 2013, 46, 3300–3314. [Google Scholar] [CrossRef]
- Fernández-Delgado, M.; Cernadas, E.; Barro, S.; Amorim, D.; Amorim Fernández-Delgado, D. Do we need hundreds of classifiers to solve real world classification problems? J. Mach. Learn. Res. 2014, 15, 3133–3181. [Google Scholar]
- Li, T.; Ni, B.; Wu, X.; Gao, Q.; Li, Q.; Sun, D. On random hyper-class random forest for visual classification. Neurocomputing 2016, 172, 281–289. [Google Scholar] [CrossRef]
- Mishina, Y.; Murata, R.; Yamauchi, Y.; Yamashita, T.; Fujiyoshi, H. Boosted random forest. IEICE Trans. Inf. Syst. 2015, 98, 1630–1636. [Google Scholar] [CrossRef] [Green Version]
- Freund, Y.; Schapire, R.E. A decision-theoretic generalization of on-line learning and an application to boosting. J. Comput. Syst. Sci. 1997, 55, 119–139. [Google Scholar] [CrossRef] [Green Version]
- Hastie, T.; Rosset, S.; Zhu, J.; Zou, H. Multi-class AdaBoost. Stat. Interface 2009, 2, 349–360. [Google Scholar]


| Grade | Descriptions |
|---|---|
| Jumbo | 2.0” or longer with less than 10% skin delamination |
| Large | 1.5–2.0” with less than 10% skin delamination |
| Extra fancy | 1.5” or longer with 10%–25% skin delamination |
| Fancy | 1.5” or longer with 25%–40% skin delamination |
| Mini | 1.0–1.5” with no more than 25% skin delamination |
| Confection | 1.0” or longer with more than 40% skin delamination |
| True Labels | Large | Extra Fancy | Fancy | Confection | |
| Large | 70 | 2 | 2 | 0 | |
| Extra Fancy | 2 | 76 | 1 | 0 | |
| Fancy | 0 | 3 | 56 | 1 | |
| Confection | 0 | 0 | 1 | 26 | |
| Predicted Labels | |||||
| True Labels | Good | Banana | Irregular | |
| Good | 36 | 0 | 1 | |
| Banana | 0 | 12 | 0 | |
| Irregular | 0 | 0 | 25 | |
| Predicted Labels | ||||
© 2020 by the authors. Licensee MDPI, Basel, Switzerland. This article is an open access article distributed under the terms and conditions of the Creative Commons Attribution (CC BY) license (http://creativecommons.org/licenses/by/4.0/).
Share and Cite
Guo, Z.; Zhang, M.; Lee, D.-J.; Simons, T. Smart Camera for Quality Inspection and Grading of Food Products. Electronics 2020, 9, 505. https://doi.org/10.3390/electronics9030505
Guo Z, Zhang M, Lee D-J, Simons T. Smart Camera for Quality Inspection and Grading of Food Products. Electronics. 2020; 9(3):505. https://doi.org/10.3390/electronics9030505
Chicago/Turabian StyleGuo, Zhonghua, Meng Zhang, Dah-Jye Lee, and Taylor Simons. 2020. "Smart Camera for Quality Inspection and Grading of Food Products" Electronics 9, no. 3: 505. https://doi.org/10.3390/electronics9030505
APA StyleGuo, Z., Zhang, M., Lee, D.-J., & Simons, T. (2020). Smart Camera for Quality Inspection and Grading of Food Products. Electronics, 9(3), 505. https://doi.org/10.3390/electronics9030505