Article

OLIMP: A Heterogeneous Multimodal Dataset for Advanced Environment Perception

by
Amira Mimouna
1,2,
Ihsen Alouani
1,
Anouar Ben Khalifa
2,
Yassin El Hillali
1,
Abdelmalik Taleb-Ahmed
1,*,
Atika Menhaj
1,
Abdeldjalil Ouahabi
3,4 and
Najoua Essoukri Ben Amara
2
1
IEMN DOAE, UMR CNRS 8520, Polytechnic University Hauts-de-France, 59300 Valenciennes France
2
LATIS- Laboratory of Advanced Technology and Intelligent Systems, Ecole Nationale d’Ingénieurs de Sousse, Université de Sousse, 4023 Sousse, Tunisie
3
Department of Computer Science, LIMPAF, University of Bouira, 10000 Bouira, Algeria
4
Polytech Tours, Imaging and Brain, INSERM U930, University of Tours, 37200 Tours, France
*
Author to whom correspondence should be addressed.
Electronics 2020, 9(4), 560; https://doi.org/10.3390/electronics9040560
Submission received: 21 February 2020 / Revised: 14 March 2020 / Accepted: 25 March 2020 / Published: 27 March 2020
(This article belongs to the Special Issue Face Recognition and Its Applications)

Abstract

:
A reliable environment perception is a crucial task for autonomous driving, especially in dense traffic areas. Recent improvements and breakthroughs in scene understanding for intelligent transportation systems are mainly based on deep learning and the fusion of different modalities. In this context, we introduce OLIMP: A heterOgeneous Multimodal Dataset for Advanced EnvIronMent Perception. This is the first public, multimodal and synchronized dataset that includes UWB radar data, acoustic data, narrow-band radar data and images. OLIMP comprises 407 scenes and 47,354 synchronized frames, presenting four categories: pedestrian, cyclist, car and tram. The dataset includes various challenges related to dense urban traffic such as cluttered environment and different weather conditions. To demonstrate the usefulness of the introduced dataset, we propose a fusion framework that combines the four modalities for multi object detection. The obtained results are promising and spur for future research.

1. Introduction

In the last few decades, the evolution of autonomous cars has been driving disruptive innovations with life-changing impacts. In fact, it not only changes the way we drive, but its deployment will also have a direct social impact in terms of mobility, security, safety, environment, etc. The car is able to perceive, interpret and make decisions thanks to the employment of several sensors [1,2,3]. Thus, the development of such systems requires an accurate representation of the vehicle’s environment and surroundings [4,5].
Driving in dense urban traffic is a challenging task. It includes complex road conditions and various traffic-agents as cars, pedestrians, motorcyclists, trains, etc. Moreover, these agents have diverse types and behaviors, which further increases the environment perception complexity. To provide a safe autonomous driving service, the system should be able to detect the different road agents and predict their future paths in order to have a complete environment perception [6] and make the right navigation decision [7,8,9]. Therefore, obstacle detection is considered as a crucial task for autonomous driving in complex urban traffic. To achieve this, diverse machine-learning-based algorithms have been developed [10]. Due to its impressive effectiveness in representing hierarchical features, deep learning is one of the most widely used tools in this domain.
In fact, training such algorithms requires absolutely huge datasets. In this context, there exist various multimodal datasets dedicated to intelligent transportation systems (ITS) such as Kitti et al. [11], Cityscapes [12], Kaist Multi-Spectral dataset [13], nuScene [14], etc. These datasets gained a particular attention over mono-modal datasets, as an individual sensor is insufficient to provide a complete perception of the environment. Furthermore, the most exploited sensors in this field such as camera, lidar, radar, etc., offer complementary data and their collaborationn can guarantee a better scene understanding [15].
The camera is the most widely used sensor for obstacle detection. It provides detailed information about the vehicle’s surroundings such as edges, colors, etc. Lidar is more accurate in terms of depth information. With regard to radar, it is robust to weather and lighting conditions. The latter cited sensors are the most exploited in the field of autonomous vehicle, and based on the literature, the combination of the captured data from each sensor separately can improve performances [16].
Over the last decade, various autonomous driving datasets have been published in order to enhance reasarch for environment perception. Most of these datasets are multimodal, combining different heterogeneous modalities.
While some of the existing datasets use narrow-band radar, the UWB radar carries richer information. The UWB radar provides a signal that results from the reflection of a transmitted UWB pulse on the object. The deformation of the initial wave represents the signature of the object. This signature contains information about the distance, the material and the shape of the object.
Moreover, different objects have distinguishable acoustic signatures that may help recognize each of them. In spite of the usefulness of the acoustic data, we notice that none of the state of the art ITS benchmarks uses acoustic modality.
The main contributions of this paper are:
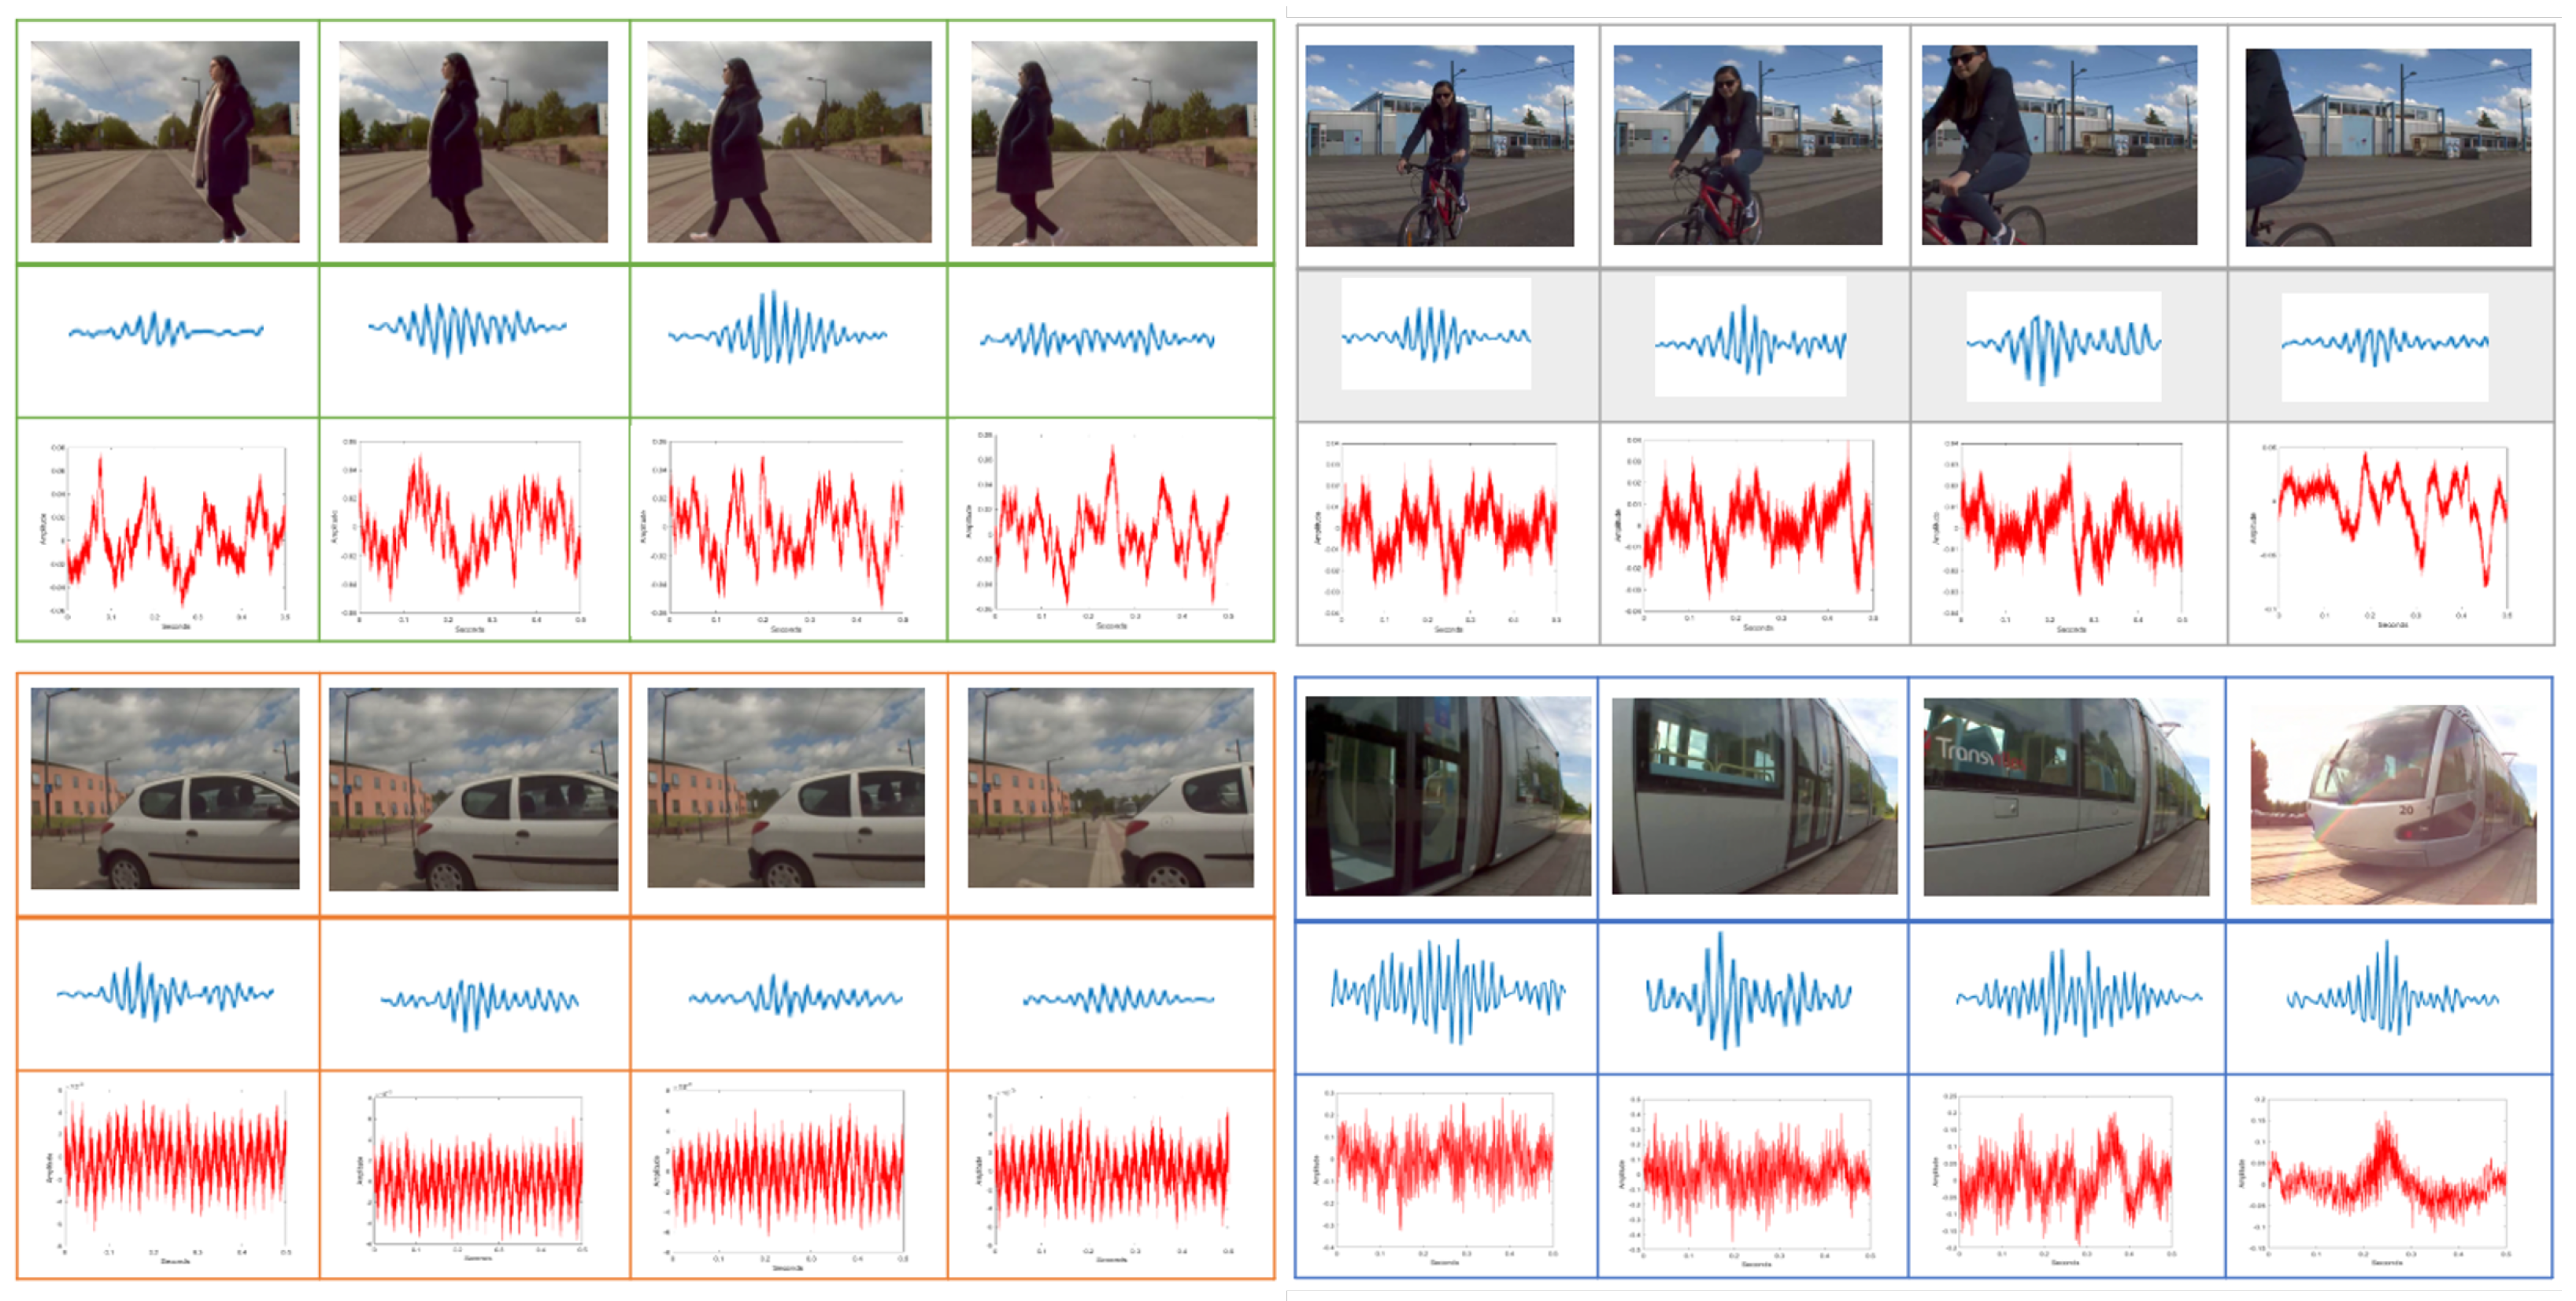
  • We introduce OLIMP (https://sites.google.com/view/ihsen-alouani), A HeterOgeneous MuLtimodal Dataset for Advanced EnvIronMent Perception a new heterogeneous dataset collected using a camera, a UWB radar, a narrowband radar and a microphone.
  • We present an exhaustive overview of the available public environment perception databases.
  • We propose a new fusion framework that combines data acquired from the different sensors used in our dataset to achieve better performances for obstcle detection task. This fusion framework highlights the potential improvement that could be acquired by the community using our dataset.
The paper is organized as follows: In Section 2 we review existing multimodal environment perception datasets. In Section 3, we focus on detailing some related works especially on data fusion methods. We introduce and detail our proposed dataset in Section 4. In Section 5, we present the fusion framework and show experimental results to generate baselines for our new dataset. Section 6 provides a discussion. Finally, we conclude the paper in Section 7.

2. Existing Public Multimodal Environment Perception Databases

Public multimodal datasets are important for autonomous driving’s advancement. In the last decade, several datasets have been released for this purpose. Kitti et al. [11] and Cityscapes [12] datasets are considered the first benchmarks that have addressed real-world challenges. Until a few years ago, datasets that contain only sparsely annotated data were sufficient to treat several problems. But nowadays, with the evolution of deep learning techniques, the exploitation of such datasets is insufficient [17]. In fact, the training of deep models requires datasets with a huge number of labeled data though collecting such amount of data is not an obvious task. Hence, this requirement has led to the development of several new sophisticated autonomous driving datasets [18]. In this section, we review various existing public monomodal and multimodal environment perception databases by detailing and observing the characteristics of each one. Table 1 shows an overview of the reviewed datasets.
Kitti is a vision benchmark dataset that was released in 2012 and comprises stereo camera, Velodyne lidar and inertial sensors [11]. Within the introduction of this database, various vision tasks were launched as pedestrian detection, road detection, optical and stereo flow, etc. Kitti was recorded in six different emplacement with cluttered scenes and it provides over 200k boxes that was manually labeled. Nevertheless, only 3D objects that exist in frontal view are annotated and it covers only daytime conditions. Moreover, the preeminent limitation of Kitti database is the small amount of data that is not suitable for deep learning algorithms.
In the meantime, the University of Cambridge has introduced a new driving dataset named CamVid [19]. It was the first that contains videos with semantic segmentation labels related to 32 classes. However, the size of this dataset is small; it contains only four scenes.
In 2016 Cityscapes dataset was published [12]. It covers urban traffic scenarios in 50 cities, in only spring and summer, including 30 categories. Cityscapes consists of a pixel-level and instance-level segmentation labeling. Indeed, it contains mainly images and few videos with 5000 images which have fine-annotation over 20,000 images along coarse annotations.
In [20], BDD100k was recorded in 2016 in four different regions of the US. It is considered as the largest driving video dataset, and offers diversity in terms of data and driving conditions. BDD100 comprises 100k videos containing almost 1000 hours recorded under different weather conditions. Indeed, only one image is selected from each video sequence for labelling likewise Cityscapes dataset. Ten thousand images are labeled in pixel level and bounding box labels are provided for 100k images.
Kaist Multi-Spectral dataset [13] is a multimodal database that was repeatedly collected in urban, residential and campus environments. Several sensors were fixed on the vehicle, namely: stereo camera, thermal camera, GNSS, 3D lidar and inertial sensors. Moreover, it covers a diverse time slots (day, night, morning, sunset, etc.) and the annotation is provided in 2D. But compared to the newest released datasets, the size of the Kaist dataset is limited.
Subsequently, another popular dataset is released named ApolloScape [21]. Compared with Kitti and Cityscape, it contains an extensive amount of data and has many properties. In fact, it includes stereo driving sequences that reach over one hundred hours of recording under diverse day times and about 144k images. It covers also 2D and 3D pixel-level segmentation, instance segmentation, lane marking and depth. Further, in the intention to label such a database, the authors developed several tools customized mainly for the annotation process. However, data acquired from lidar is used to provide only static depth maps.
The H3D [22] was introduced in 2019. It considers over 160 complex and congested scenes. Three cameras, a lidar, a GPS and inertial sensors were used to collect this dataset. The main challenge addressed in this dataset is 3D multi-object detection and tracking. In fact, it consists of 1.1M 3D boxes annotated data, which includes over 27 k frames. Eight classes were considered in this dataset: car, pedestrian, cyclist, truck, misc, animals, motorcyclist and bus. It is true that the dataset comprises rich scenes and annotation with a particular size. Nevertheless, the data was registered only during daytime conditions.
The dataset introduced in [23] and entitled BLVD does not focus on static obstacle detection only, but also on dynamic object detection. Indeed, this dataset proposes a platform that involves 4D tracking (3D+temporal), 5D interactive recognition events and 5D intention prediction. It includes 3 classes: vehicle, pedestrian and rider. The data was recorded in daytime and night time conditions. It provides 120k frames with a 5D semantic annotation and beyond 249 3D annotation.
The nuScene (nuTonomy scenes) [14] is the first dataset that involves the three preeminent sensors exploited to ensure an autonomous driving which are a lidar, 5 radars and 6 cameras. This database consists of 1000 scenes where the duration of each scene is 20 s. The annotation provided is a 3D bounding boxes specified for 23 classes. The data were gathered under several lighting and weather conditions: daytime, night time and rain [14]. This dataset is rich in terms of utilized sensors, size, acquisition conditions diversity, and amount of data with 1.4M frames. Yet, the main issue of this dataset is the number samples imbalance between the different classes.
Other than the autonomous driving databases previously mentioned, additional dataset are released for the same purpose, such as the Oxford Robotcar [24], Udacity [25] and DBNet Dataset [26]. These datasets are mainly dedicated to enhance the scenes understanding and environment perception. We provide in Table 2 a categorization of the most important autonomous driving datasets according to particular tasks.
We notice that since 2016, the number of published datasets has increased because of its importance for the development of self-driving cars. In fact, the majority of the collected data is specialized in urban driving, and was recorded in different locations: Europe, the United States, Asian cities, etc. In terms of sensing modalities, all the examined datasets contain RGB images acquired from one or more cameras or video in HEVC (high efficiency video coding) standard or in other recent coding [27]. For narrow-band radar data, it is only presented in nuScenes dataset [14] and the newly released Oxford Radar RobotCar Dataset [28]. These benchmarks contain a limited number of radar samples, despite of this sensor provides rich information and helps in the environment perception and taking the right decisions. For that reason, nowadays, it becomes essential to exploit radar sensor in developing autonomous driving datasets.
Depending on the principal aim of the published dataset, objects are labeled into various categories. Comparing the object classes existing in each dataset, we notice that the number of examples attributed to each class is imbalanced. For example, we compare the samples related to two classes: car and pedestrian for nuScenes, Kitti and Kaist Multispectral databases. We can observe that there are much more car samples than pedestrian labels, as shown in Figure 1.
One of the important criteria to have a complete dataset is different lighting and weather conditions in order to cover various scenarios [29]. Nonetheless, Kitti dataset is broadly used in this field of research, the variety of its recording environmental conditions is reduced: it is gathered only under daytime and sunlit days, similar to CamVid, CityScapes and H3D datasets. In order to enrich light recording conditions [13,14,20,21,23] collected data considering both daytime and night time all day long. Concerning the diversity of weather conditions, only BDD100k and nuScenes covers rain and snow situations. Actually, seasonal changes are not well covered as the majority of the databases were recorded in short periods. From Table 2, we notice that most of the reviewed datasets were dedicated to multi-object detection as it is an inevitable process in ITS. Likewise, several datasets were dedicated to object tracking, lane recognition, semantic recognition, SLAM and 3D vision.

3. Multi-modal Environment Perception Related Work

Complex driving situations often present various obstacles. Some works focus on 2D detection, while some others deal with 3D object detection which includes more challenges thanks to the development of complex datasets.
To address this challenge, the combination of various modalities is of a great interest. From this perspective, the majority of existing work fuse RGB images with lidar point clouds. A limitied number of benchmarks couple RGB images with thermal images. However, we highlight that there is a lack of research on combining radar data with images. Furthermore, fusion of sensing modalities can be achieved at 3 possible stages: early, intermediate or late level. Moreover, based on the literature, five fusion operations are mainly used to fuse multiple modalities based on a deep architecture [15]: (1) Addition, (2) Average mean, (3) Concatenation, (4) Ensemble: used to combine the regions of interest (ROIs) for object detection, (5) Mixture of Experts: this operation tends to model explicitly the weights of the feature maps.
In this section, we summarize various existing techniques for multi-modal environment perception, particularly focusing on multi-object detection which will be highlighted in Table 3.
  • RGB images and lidar point clouds fusion:
Many works proved that fusing images with lidar data improves the accuracy of the object detection process particularly for far range and small obstacles [30]. There are three techniques to combine lidar point clouds with camera images. First, images and lidar points are merged. Then, targets are detected using camera images and these results are subsequently provided using lidar point clouds. The third method consists of defining regions of interest using lidar data and the camera is used to detect the objects.
González et al. [31] used transformed depth maps and RGB images as inputs to detect pedestrians. The objects’ poses in multi view were taken into account, intermediate and late level fusion are implemented. For the intermediate stage, they fused features extracted from Histogram of Oriented Gradients (HOG) and Local Binary Patterns (LBP) descriptors, with a support vector machines (SVM) classifier. With regard to fusion at high level, they coupled decisions obtained from the training of a detector on each modality. In this case, the feature level fusion guaranteed better performance.
In [32], a point fusion method is proposed where lidar points are mapped onto the image plane and features are extracted from the image using a pre-trained 2D detector. Afterwards, features are concatenated via VoxelNet architecture. In [33] an architecture based on two single stage detector is proposed. The information provided by lidar data (height, distance, intensity) are transformed into images. This data is processed by a VGG16 [34] very to provide feautres. Afterwards, an SSD [35] network is adapted to generate bounding boxes of 2D cars in foggy weather based on a deep feature exchange that rely principally on features concatenation. In the work of Xu et al. [36], the raw data acquired from lidar are proceeded by PointNet architecture and images features are extracted via CNN (Convolutional Neural Network). The obtained results are then pooled in order to locate the 3D bounding boxes coordinates. Qi et al. [37] adapted a simlar approach in their work. In [38], object proposals are generated using a segmentation method applied on lidar point clouds data and RGB images. Afterwards, the candidates generated from lidar data and images train two separate CNNs to classify the proposals. The outupts decisions are combined using a basic belief assignment (BBA) to associate bounding boxes. Finally, a CNN modal is implemented to determine the final decision.
  • Visible and thermal images fusion:
While visual cameras are affected by weather and lighting conditions, thermal cameras are robust to night time and daytime circumstances since they detect the object’s heat reflected by the infrared radiation. For this reason, the combination of the provided data can ensure a detailed scene understanding as they are correlated in terms of illuminations conditions.
Hwang et al. [39] introduced an extension of the aggregated channel features (ACF) dedicated to pedestrian detection. The extended model consists of a multispectral ACF obtained from the augmentation of the thermal intensity with HOG features. In [40], visible and thermal images are fused according to two approaches to detect persons. The first is called DenseFuse and consists of encoding the two types of images using independent encoders. The encoded features are merged and then decoded back to generate a single fused image that represents be the input of a Residential network (ResNet) architecture. The second method is an intermediate level fusion technique. In fact, ResNet-152 is employed separately for infrared and visual images, thereafter the extracted features are concatenated into a single array that will serve as the input of the fully connected layer.
An early and late fusion based on CNN architecture in the intention to couple infrared and visible images are investigated in [41]. The early fusion method consists of combining the pixels captured from the two modalities. In opposition to late fusion, where two sub-networks provide feature representation for the two modalities. These representations are fused on a supplementary fully connected layer. Besides, the proposals are generated using the ACF+THOG detector. According to the obtained results, a pre-trained late fusion method evaluated on KAIST multispectral dataset guarantees better performance. In [42], an illumination-aware architecture is proposed based on Faster R-CNN [43]. Infrared and visible images are respectively the inputs of two separate sub-networks. Meanwhile, an illumination aware network is developed for estimating an illumination value from color images, thereafter an illumination weight layer is integrated in order to determine the fusion weights for the two modalities. Consequently, the final decision is achieved from weighting the final results obtained from the two sub-networks due to the estimated fusion weights.
  • Narrow-band radar data and RGB images fusion:
For obstacle detection, the radar and the camera are two complementary sensors, however only a few studies addressed this challenge. Similar to the other kinds of sensing combinations, the three types of fusion can be applied to couple these modalities.
In [44], narrow-band radar tracks generate the ROIs in the images. Following this, for the vision module, a symmetry algorithm and a contour detection technique are applied to the ROIs to identify vehicles. The goal of the work presented in [45] is to detect pedestrians. Narrow-band radar sensor provides a list of tracks and the ACF object detector is adopted to generate a list of identified pedestrians in the images. Subsequently, the fusion of the obtained descions is ensured using the Dempster Shafter method. Wang et al. [46] proposed a decision approach to fuse radar data and images. The You Only Look Once (YOLO) [47] network is employed in this work to detect vehicles from images. The radar sensor detects the centroid of the obstacles, afterwards, these detections are projected in the image plane. Finally, the results obtained from the two modalities are combined. A real-time Radar Region Proposals network (RPNP) is developed in [48]. The network consists of generating ROIs based only on radar detections. In fact, the tracks are mapped into images so that anchor boxes are proposed which are inspired by Fast R-CNN architecture. Then, these boxes are scaled according to the distance of the objects to have accurate detection. Radar data is transformed into images in [49] in order to be combined with RGB images. Actually, these data will be proceeded via ResNet network separately. Accordingly, features are concatenated after the second block of ResNet.
To fuse different modalities for understanding the vehicle surroundings, many approaches employ deep neural network architectures while others are based on hand crafted features. From the aforementioned reviewed works, we observe that the fusion performance depends mainly on the sensing modalities, the quality of data and the selected architecture. For fusion operations, feature concatenation is widely exploited method specifically in early and intermediate levels. Likewise, addition and mixture of experts are mainly employed for intermediate and high stages.

4. Proposed Dataset

The importance of multimodal perception techniques for ITS and the extent of research efforts in this direction emphasize the need for multimodal datasets that explore complementary sensors. In this section, we introduce OLIMP, a new dataset for road environment perception. To ensure a complete environment perception, our benchmark contains four complementary modalities, namely: UWB radar data, narrow-band streams, images and acoustic data. In fact, camera is affected by degraded condition such as foggy weather, while UWB radar is not influenced by either luminosity or weather conditions. The acoustic data is orthogonal to the vision field. Concerning the narrow-band radar, it provides position and velocity. This section presents the proposed dataset and details its implementation, challenges and opportunities.

4.1. Context

The main contribution of our work is to introduce such a multimodal dataset for this aim. To the best of our knowledge, OLIMP is the first benchmark that contains UWB radar data and acoustic data.
The introduced OLIMP dataset is a multimodal synchronized dataset that was collected using four heterogeneous sensors to better understand the vehicle’s environment. The data was collected in the campus of the Polytechnic University Hauts-de-France in Valenciennes, France (Valenciennes is known for its foggy weather). Data was captured during 3 months and consists of 47,354 synchronized frames.

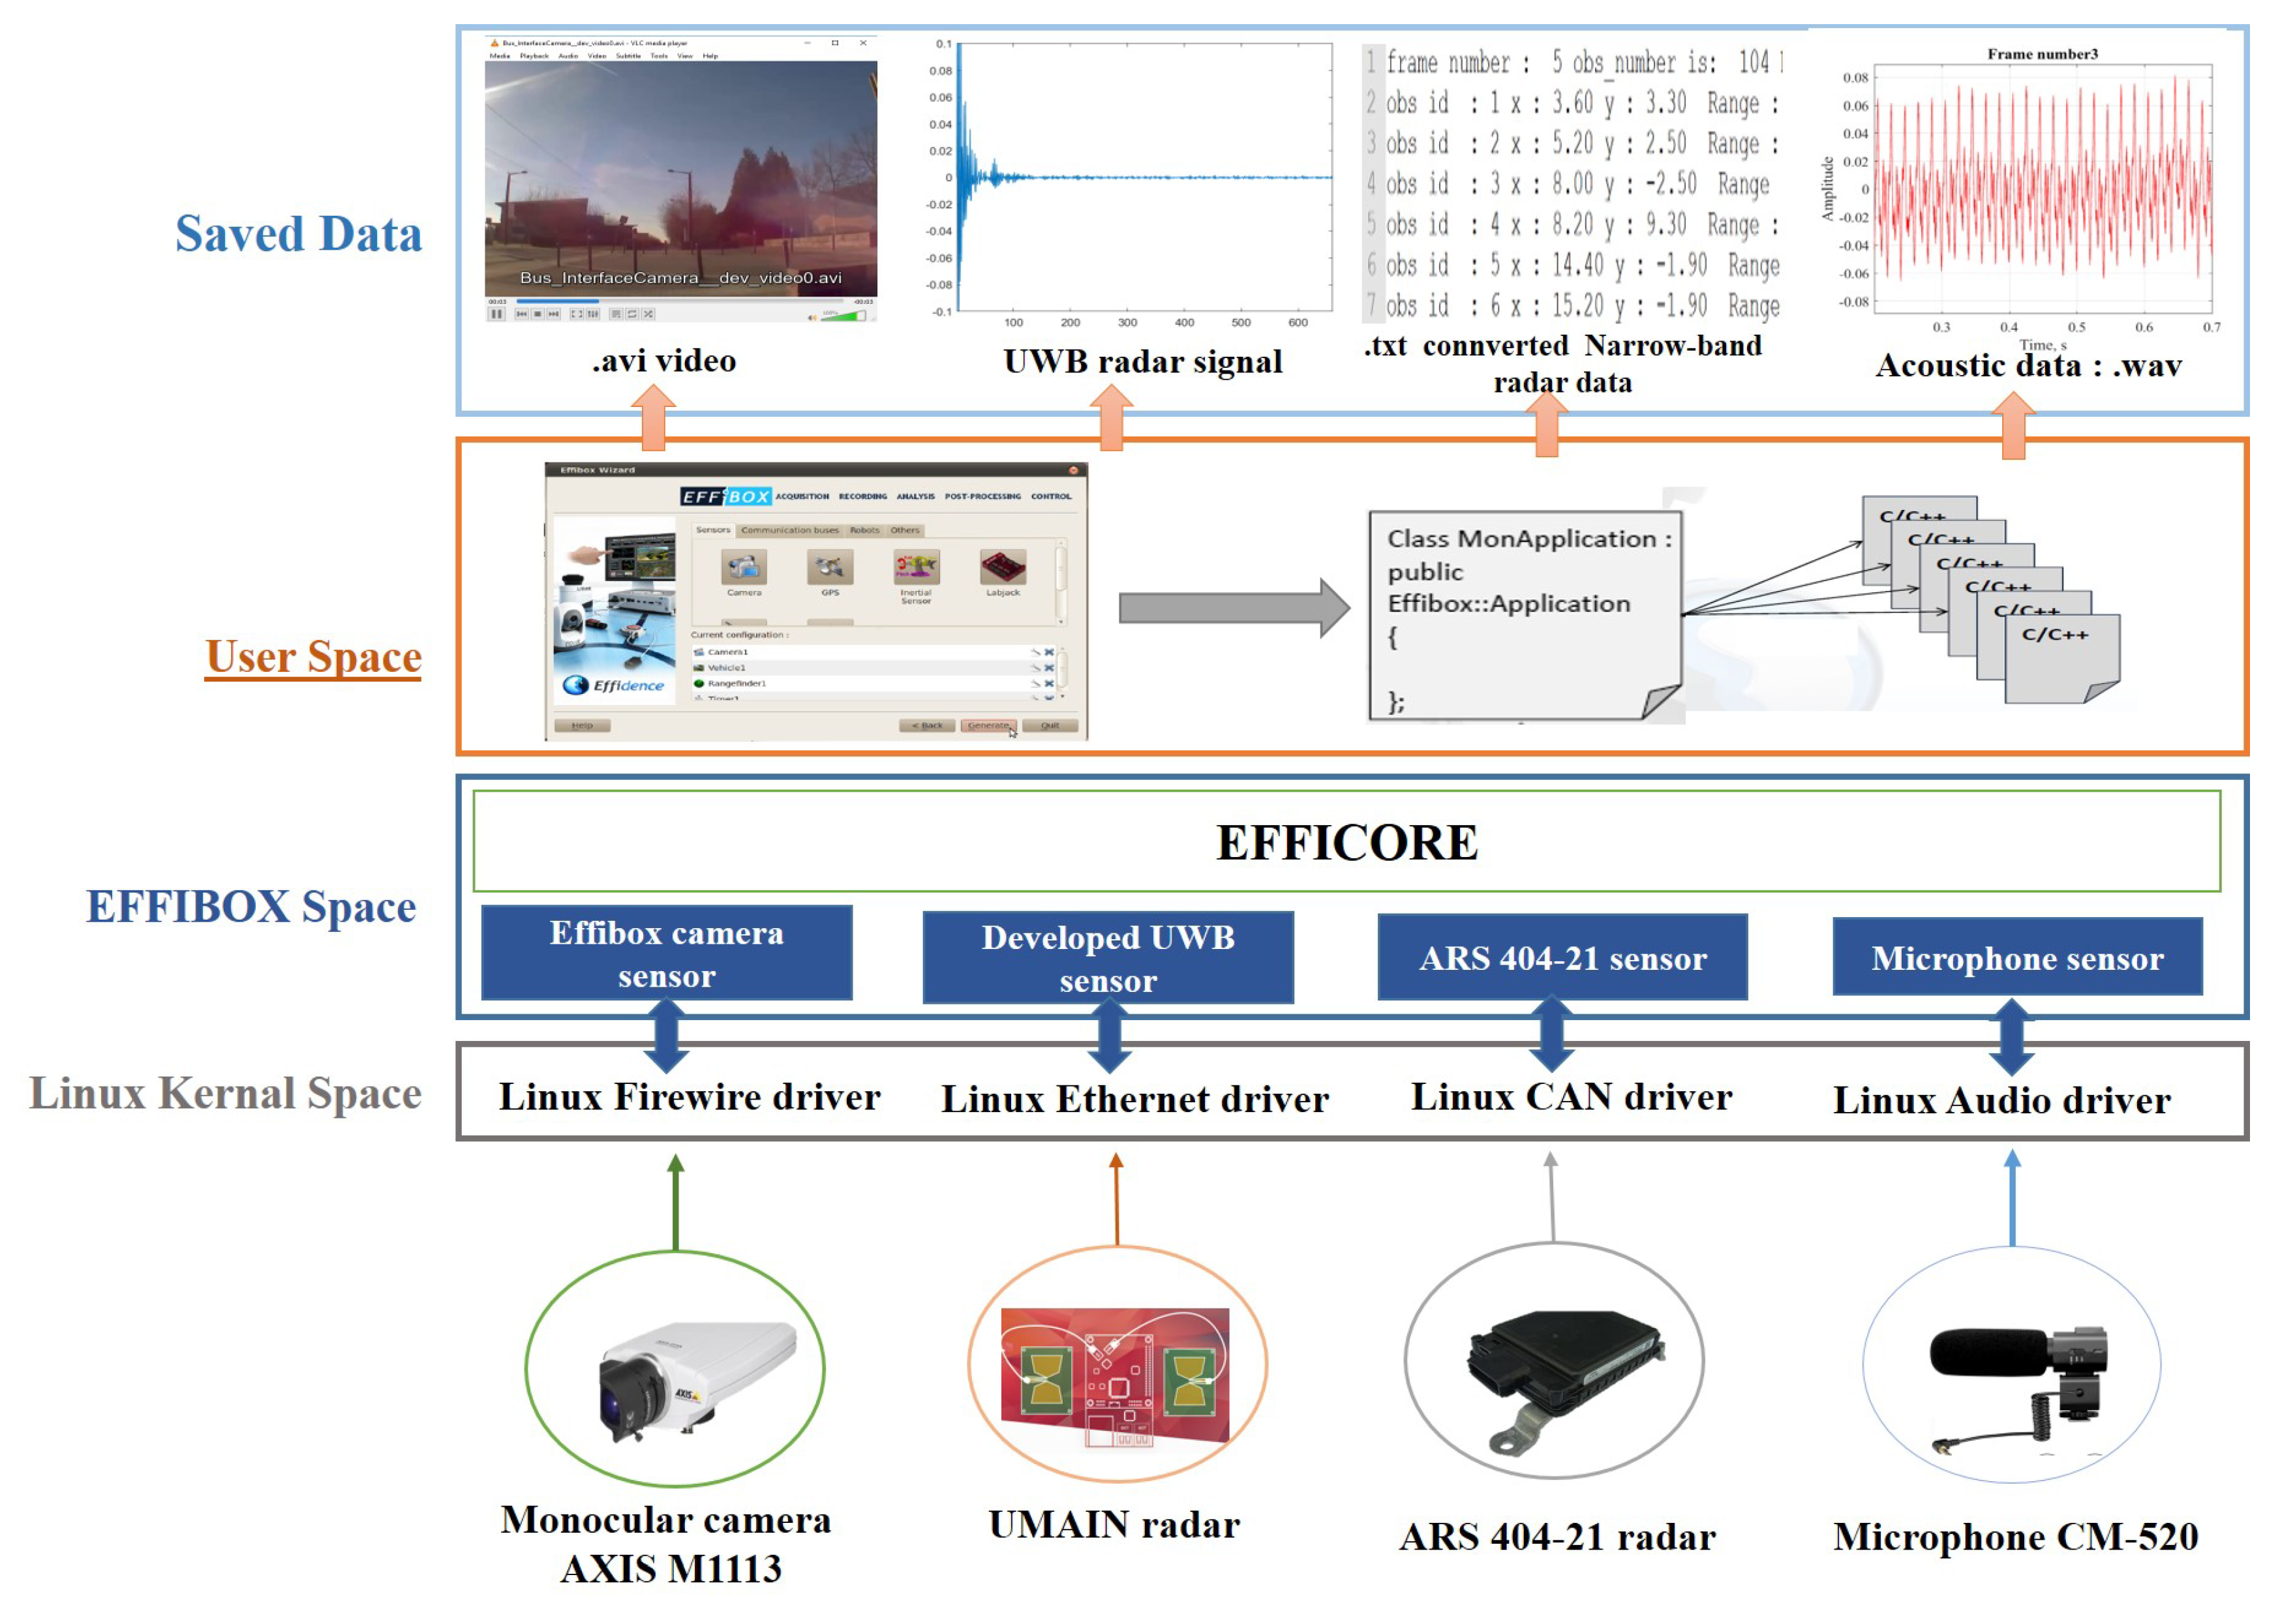
4.2. Hardware and Data Acquisition

On the one hand, we used four heterogeneous sensors: a monocular camera, an UWB radar which is a short range radar, a narrow band radar (ARS 404-21) that is a long range radar and a microphone. On the other hand, we exploited the EFFIBOX platform to acquire data from the different sensors simultaneously [52]. In Table 4, we highlight the sensors’ characteristics and technical details.
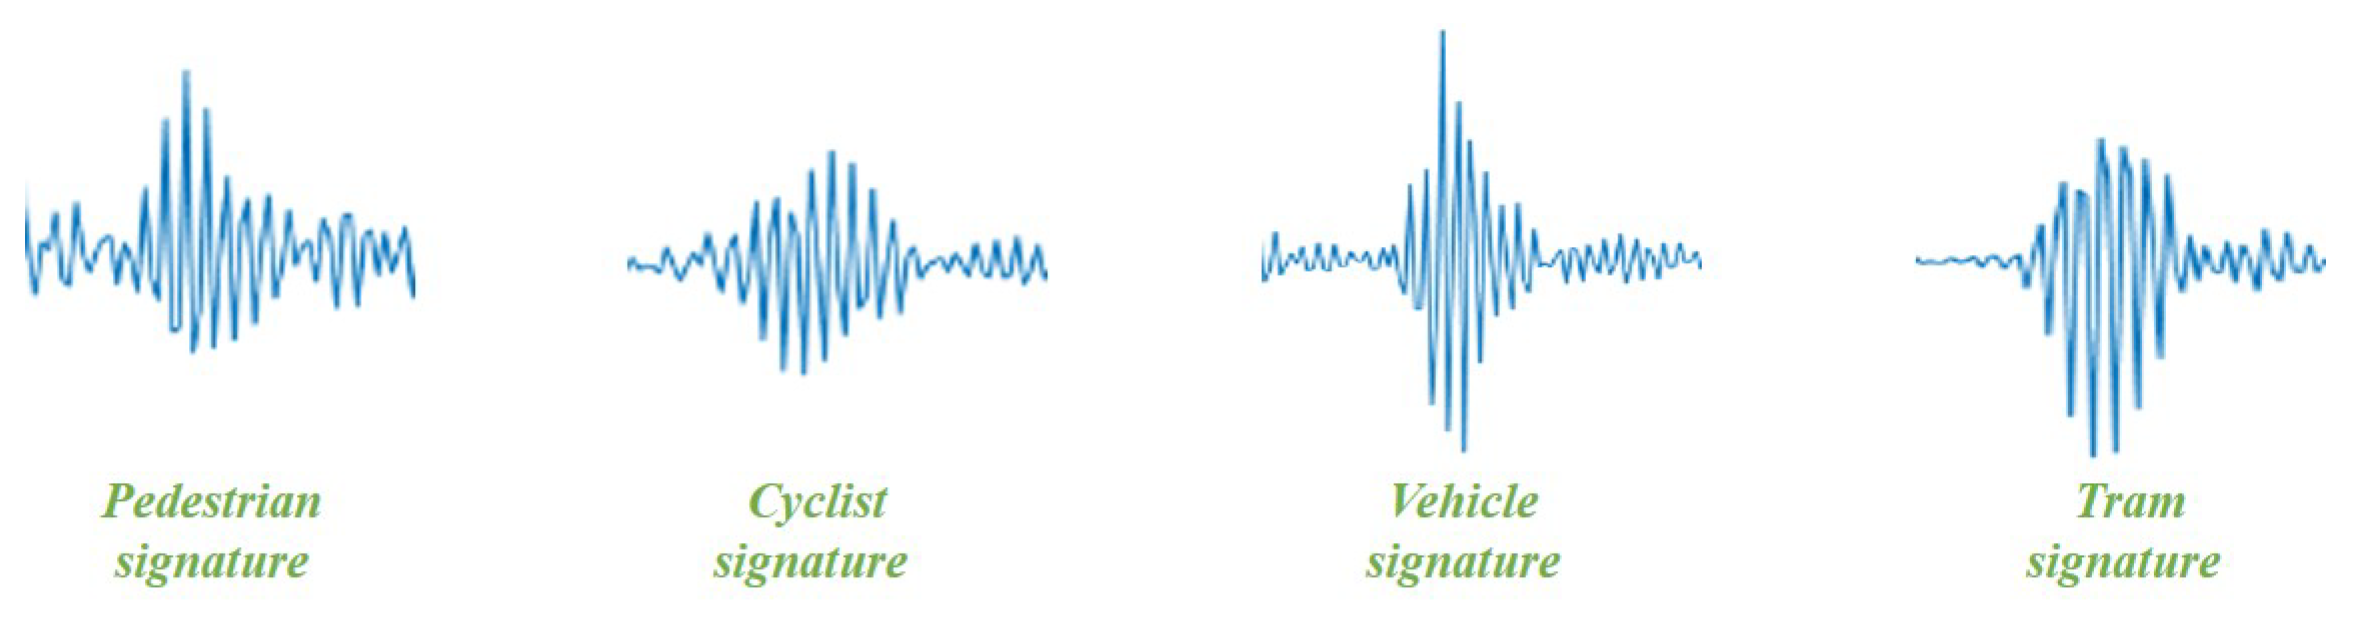
  • UMAIN radar: it is an UWB radar. The exploited kit is called HST-D3 developed by the UMAIN corporation [53]. The kit comprises a UWB short radar with a Rasperby Pi 3 for the acquisition. Following this, the received radar raw data are transmitted to the computer through the Raspberry Pi that is connected via TCP/IP protocol.
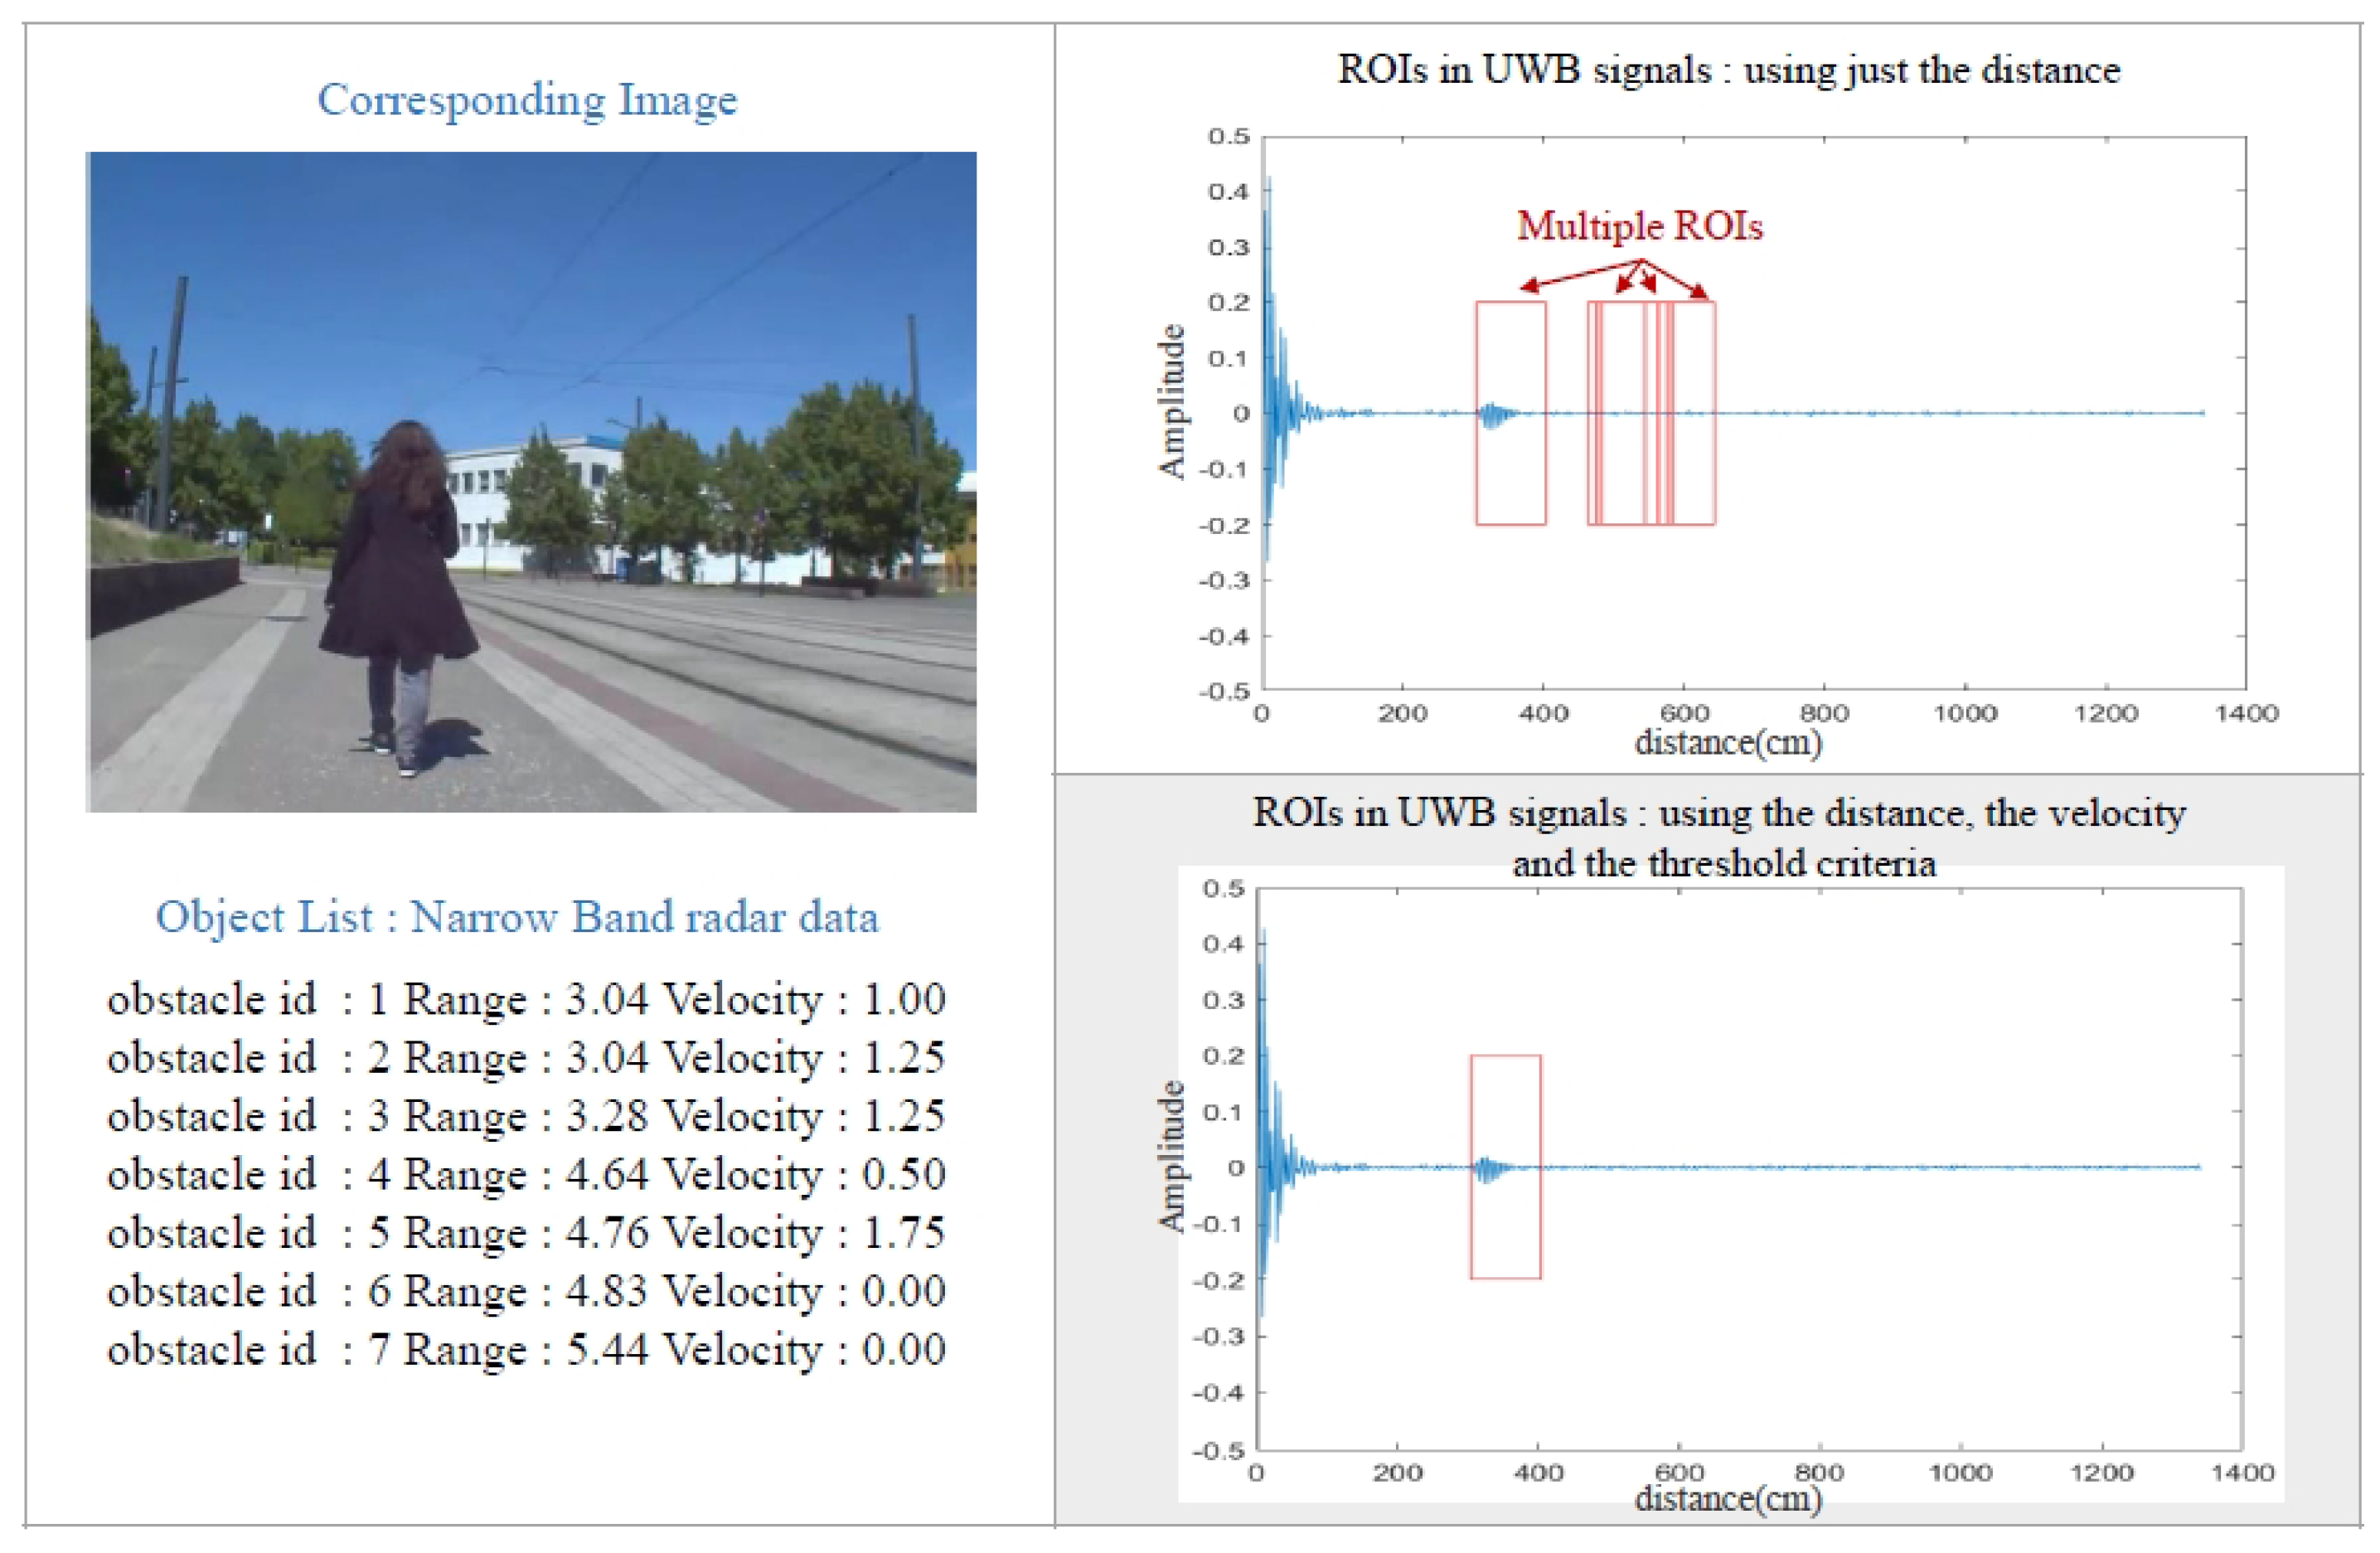
  • Narrow band radar (ARS 404-21): This Premium sensor from Continental is a long range radar that is able to detect multiple obstacles up to 250 meters. It genertaes raw data that include: distance, velocity and radar cross section RCS [54]. Data are transmitted to the EFFIBOX platform via CAN bus.
  • The EFFIBOX platform: it is a software developed in (C/C++) dedicated to the design of multi-sensor embedded applications. In addition, diverse adequate development functionalities are available such as: acquiring and saving sensor streams, processing/post-processing, visualization, etc.

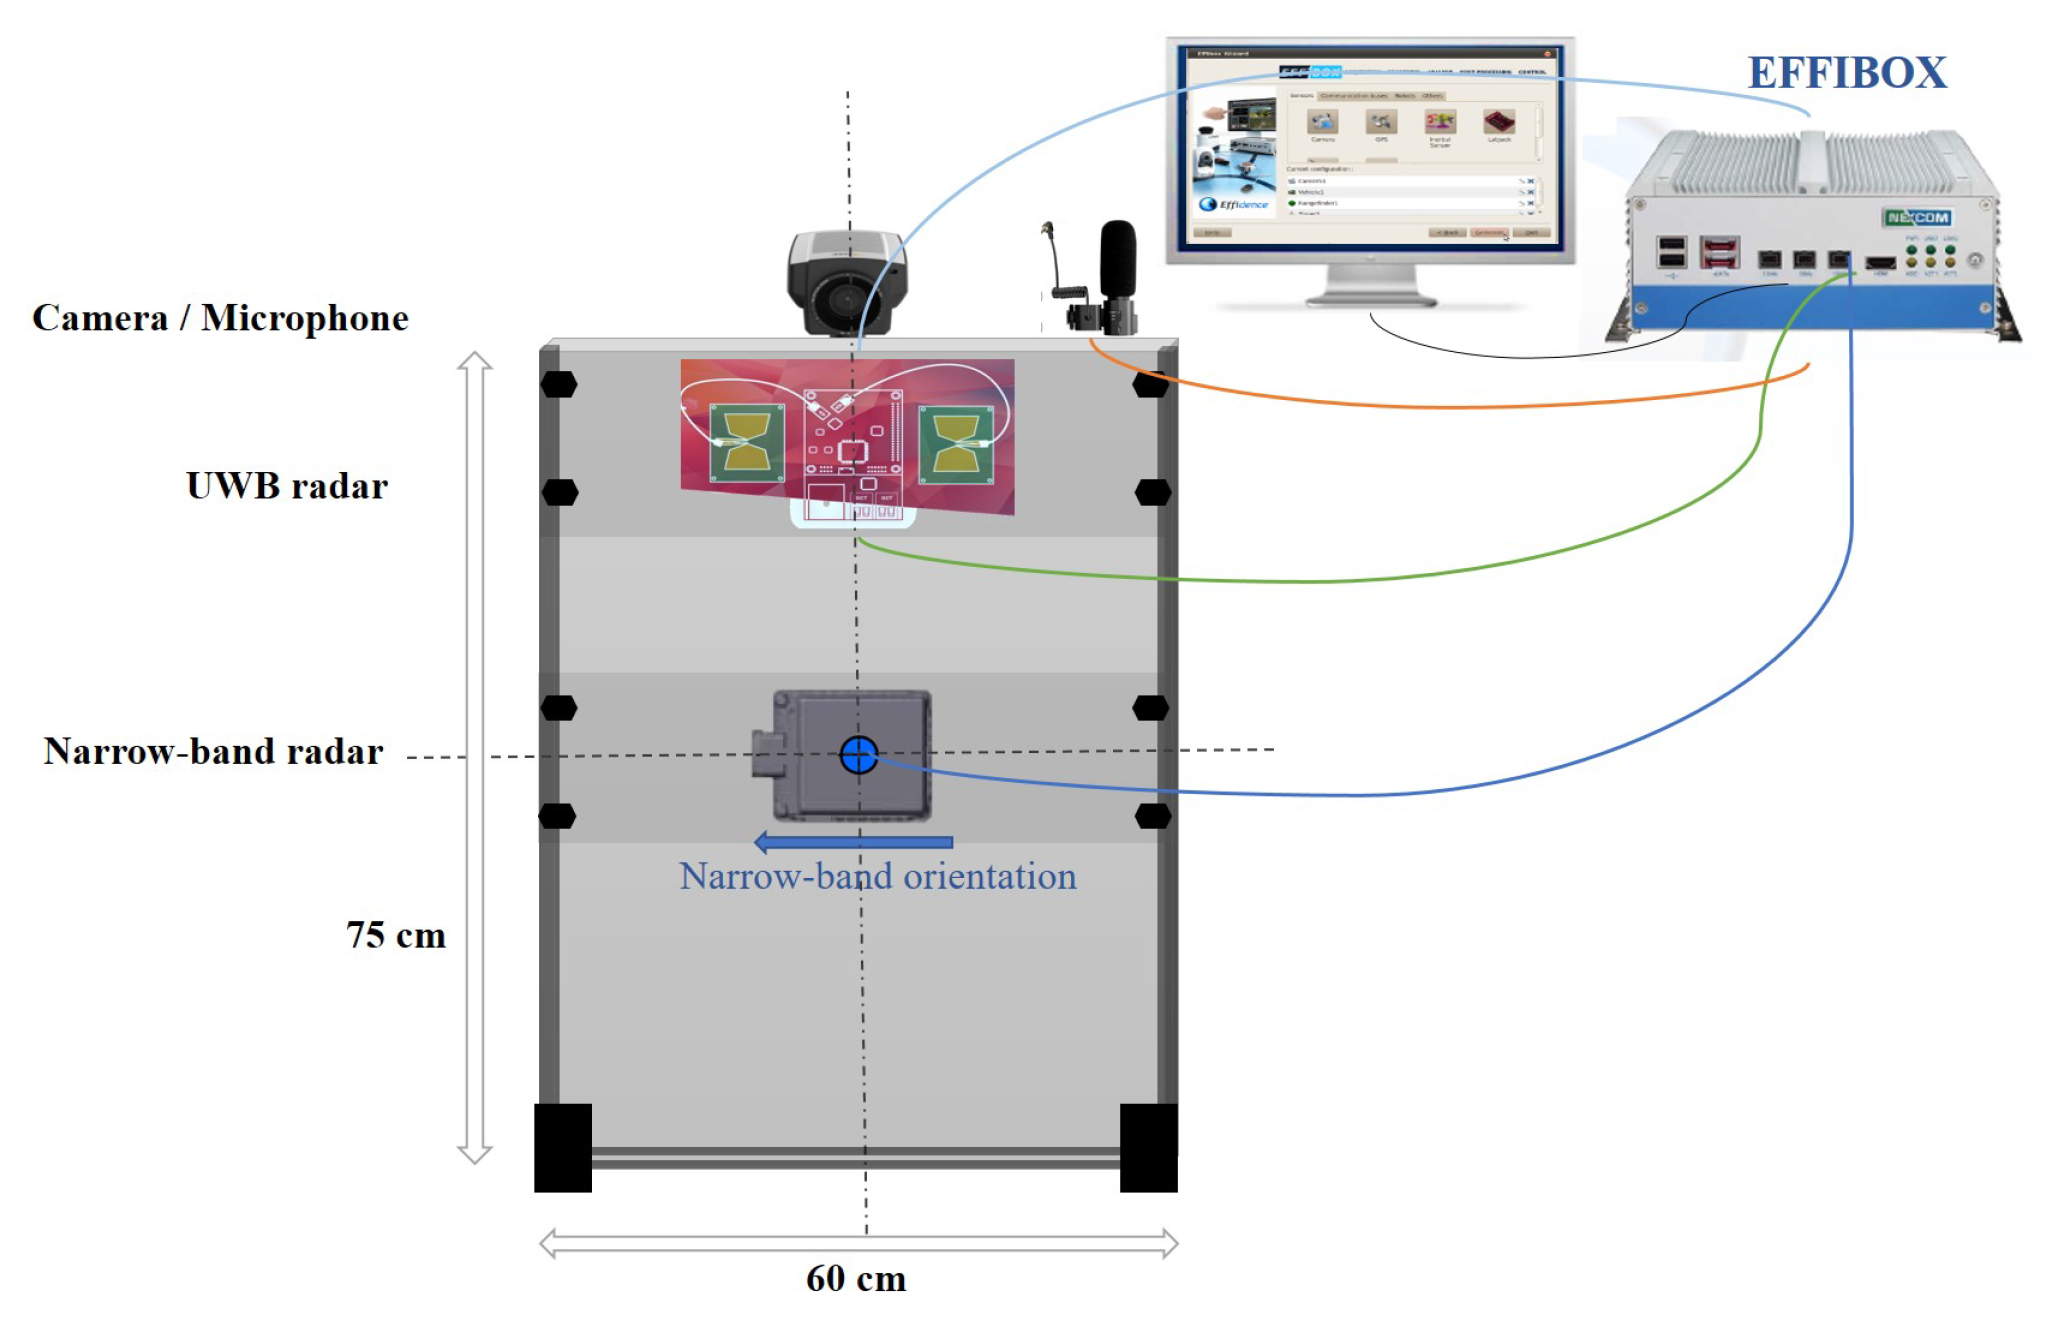
4.3. Sensors Embedding

With regard to the sensor configuration, we designed a structure where all the sensors are placed in the front view. To simplify the data fusion, the narrow-band and the UWB radars and the camera were mounted on the same vertical axis. Figure 2 shows the proposed data acquisition architecture, and Figure 3 highlights the structure setup.

4.4. Sensor Synchronisation

To develop an efficient autonomous driving dataset, sensor synchronisation is a challenging and inevitable task. We developed our method to achieve an accurate alignment between the modalities’ data streams. In the simultaneous data recording process, we register timestamps relative to each sensor separately. We first start with synchronizing the radars and the camera. Since these sensors have different frequencies and time responses, we choose the narrow-band radar as a primary sensor. This is explained by the fact that the narrow-band radar is the slowest among these sensors; it has the highest latency of a complete measure compared to the other modalities as shown in Table 4. In fact, the narrow-band radar raw data is represented in the form of a stream of discrete measures. Each one of these measures comprises a main data frame including the obstacle’s number followed by successive information about each obstacle (distance, velocity, etc.). Once a narrow-band measure is taken, we record its timestamp and look for the camera frame as well as the UWB signature that have the closest timestamp to the synchronization narrow-band timestamp.
Regarding the acoustic modality, the frame corresponds to an analog signal (sound). The challenge is to find the most suitable time window size that: (i) corresponds to the exact scene recorded at given timestamp, and (ii) is long enough to hold meaningful information about the scene. After thorough explorations, we empirically choose an optimal window size of 5 s for acoustic signal frame. This frame is recorded according to the narrow-band synchronization timestamp mentioned above.
Overall, the proposed algorithm consists of selecting the timestamp acquisition of every narrow-band measure and find the corresponding frames of the other sensors which have the closest timestamp. The frames synchronization step is illustrated in Figure 4.

4.5. Labeling Process

In addition to the background, we consider four classes: pedestrian, cyclist, vehicle and tram, since these are the most probably encountered possibilities in an urban transport environment. The vehicle class contains cars, tracks, etc. For the labeling process, we manually annotate data consecutively one image per three as this task is time consuming and the changes between two successive images are practically negligible. We avoided automatic annotation to have a high quality labeled ground truth. Thus, we used the Matlab Image Labeler toolbox whom we have the license as semi-automatic labeler tool.
Data annotation includes 2D bounding boxes that present respectively x, y, the width and the height of the object in pixels.

4.6. Scenarios Selection and Data Formats

In order to collect raw sensor data, we carefully choose diverse driving situations. The scenes duration differ and depend mainly on the situation’s complexity. While recording our dataset we consider diverse challenges that will be detailed in the following subsection. We emphasize the data variety through employing different locations (8 emplacements) that vary in terms of structures, environment, road markings, traffic signs, etc. Driving situations are carefully selected and collected under different lighting conditions, we covered also sunny, cloudy and snowy weather. For data format, the dataset provides synchronized frames of each situation, the data are stored as: RGB images, .txt files presenting UWB radar signals, .txt files of narrow band radar data stream and .wav microphone files.

4.7. Challenges of the Dataset

With the intention of developing a complete dataset, we cover realistic conditions for environment perception such as: cluttered environment, occlusions, lighting conditions, etc. To overcome the aforementioned challenges, exploiting several sensors is highly required to obtain redundant information or complementary data that may compensate the challenges presented by each sensor. Figure 5 highlights the most introduced challenges in our dataset.
The object’s types exhibit an immense variability since they vary in terms of appearance, movement and differ from the point of view of the class: pedestrian, vehicle, etc. When recording our data, we take into consideration this camera-radar challenge as we consider 4 categories of obstacles. Furthermore, our dataset was performed by several pedestrians and cyclists of different ages, looks, body sizes, etc. Moreover vehicles are varied: multiple cars, vans and trucks. We can see this differentiation through UWB radar signatures shown in Figure 6 that correspond to each of the considered categories. Moreover, the considered objects can be static or dynamic.
Distance is one of the fundamental challenges presented for autonomous driving either for camera, the two exploited radars or even the microphone. According to this, we consider two representations when capturing our dataset, depending on the range: near and far obstacles.
A further challenge is presented: the cluttered environment since generally dense urban driving involves many traffic agents with a complex background. For UWB radar, multiple reflections can influence the quality of the signal in the presence of many objects. Concerning narrow-band radar, it generates many detections when various obstacles exist, thus a selection process is required to identify the relevant ones. So, we attempt to introduce several complex scenes during recording.
Furthermore, we consider diverse lighting conditions as we record data throughout the day (morning, afternoon and sunset). We collect our dataset under sunny, foggy and snowy weather to increase the diversity and cover the possible real driving situations. In fact, the camera is highly sensitive to the last mentioned challenges whereas the radar is robust against them.
Besides, the object detection task is extremely delicate to occlusions that occur between several classes which is frequently presented in diverse cluttered scenes. OLIMP includes severe occlusions situations combining the four classes as pedestrians that are often occluded by each other or by a cyclist, a vehicle or a tram, or the opposite.
Figure 7 illustrate the inter and intra class challenges by presenting the synchronized data acquired from the camera, the UWB radar and the microphone.

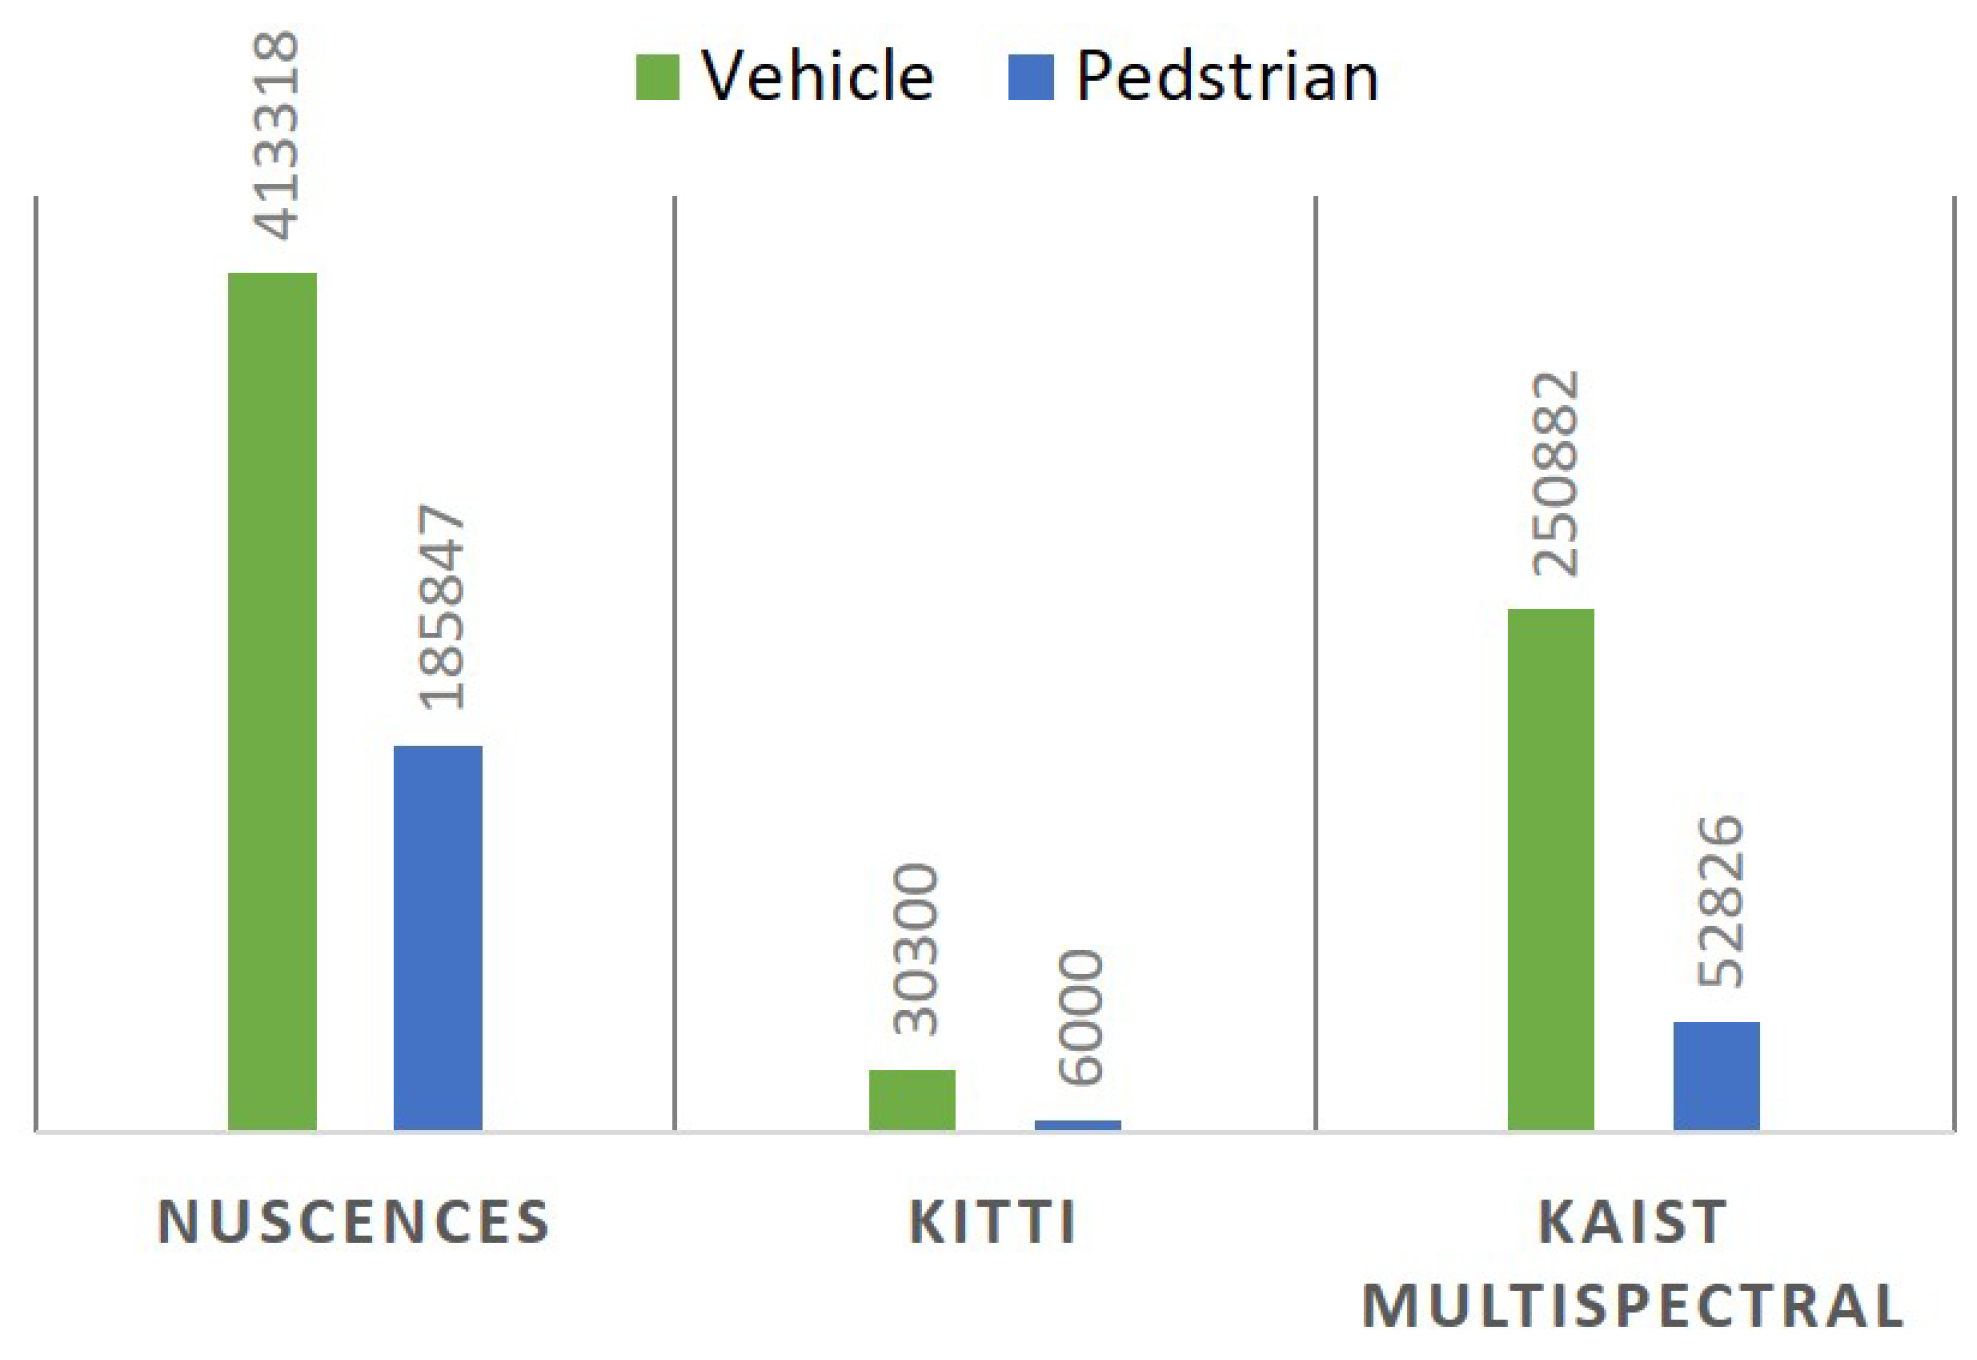
4.8. Statistics and Dataset Organisation

OLIMP is organized in 6 subsets from C0 to C5. C0 contains background only, C1 includes either one, two or a group of pedestrians. C2 comprises cyclists, C3 and C4 include respectively vehicles and trams. The final subset C5 contains the different possible combinations of the aforementioned classes introduced in OLIMP dataset considering various scenarios. In fact, we only focus on the main moving road objects that can be presented in an urban traffic scene.
The dataset consists of 407 scenes, and the number of scenarios in each subset vary as follows C0: 12 scenarios, C1: 144 scenarios, C2: 31 scenarios, C3: 51 scenarios, C4: 18 scenarios and C5: 151 scenarios.
Our dataset was performed by 93 pedestrians, 14 cyclist and using 90 vehicles and 2 trams. Precisely, the dataset presents 47,354 data for each sensor. For the evaluation protocol, 2 3 of the dataset is used for training, and 1 3 for test.

5. Fusion Framework

In our work, we focus especially on obstacle detection and recognition. Thus, in this section, we aim to evaluate each modality individually and propose, afterwards, a fusion-based system that takes advantage of each modality’s contribution.

5.1. Image-based System

The multiple obstacle detection task can be divided into two steps: the localization defines the bounding boxes and the recognition that is ensured via a probability estimation. Thus, deep learning techniques have been widely adopted in image-based object detection.
Among the known deep architectures used in the litterature, we used a pretrained MobileNet-v2 [56] model on a subset of the ImageNet dataset for detecting objects on RGB images. The MobileNetV2 is based mainly on depthwise separable convolutions and it contains two blocks. The first block is a residual block with a stride equal to 1 and the second block is a downsizing block with a stride equal to 2. Its architecture contains three convolution layers for both mentioned blocks: 1 × 1 convolution layer with RelU6, a depthwise convolution and a 1 × 1 convolution. The overall MobileNetV2 architecture contains 17 of these blocks. These blocks are followed by a regular convolution layer, an average pooling layer and a fully connected classification layer. The network consists of 54 layers deep and uses 3.5 million parameters [57]. Actually, the presiding model was chosen due to its compromise between performance and execution time.
The results relating to the training of this architecture are presented in Table 5, and the metrics that are chosen to evaluate the performance are precision (P), recall (R) and the average precision (AP).
P = True   Positive True   Positive   +   False   Positive
R = True   Positive True   Positive   +   False   Negative
A P = n R n - R n - 1 P n
As shown in Table 5, MobileNet achieves a significant results on the four categories in terms of precision. However, the image-based system provides low rates of recall for all the classes which explains that the system generates too many false negative samples.

5.2. UWB Radar-based System

To demonstrate the importance of using the UWB radar, we proposed a radar-based system to discriminate the four classes for short distances. First of all, we classified the whole signals using SVM in the intention of distinguish the classes, yet the results were not promising as the signals present rich information with a significant leakage in the beginning. For this reason, we use narrow band radar data to achieve better performance. Though, the proposed approach consists of selecting ROIs in the signals acquired from the UWB radar in order to localize radar signatures that characterise the obstacle. Afterwards, these ROIs will be classified using SVM. In fact, narrow band radar generates a list of targets with their position and velocity. Thus, we injected the distances taken from narrow band radar data to define the ROIs in UWB signals. In this state, we focus our attention to obstacles which are located less than 6 meters, while after various experiments the UWB radar is less efficient for a range that exceeds this margin. We can observe that we obtain multiple ROIs when matching the narrow band points with the signatures. Accordingly, we proposed to exploit the velocity of each obstacle with the distance to reduce ROIs and to better localise the signature. For that, two objects that are side by side and have the same velocity are considered as one target. In addition to this, we set an amplitude threshold to validate the ROIs. Figure 8 illustrates this process.
The selected ROIs are classified using an SVM classifier with an Radial basis function (RBF) kernel. The results of the UWB radar-based system are shown in Table 6.
According to our experiments and obtained results, we assume that the proposed radar-based system can better distinguish pedestrians and cyclists. Aside from the fact that the UWB radar provides a unique signature for each class, it is not able to classify tram and vehicle. Since the results in Table 6 include the overall dataset testing, the accuracy results for those two classes are remarkably low. For experiments safety, the tram and the vehicle are generally located a far from the radar, in a range greater than 6 m. Thus, reflections’ magnitude from these two classes are low compared to reflections acquired from a cyclist or a pedestrian that are usually closer to the field of view of the radar. This explains the difference of accuracy between the two latter classes and the first classes.

5.3. Acoustic-Based System

According to the state of art, the MFCC (Mel-Frequency Cepstral Coefficients) are widly used in sound processing and analysis as it provides a better representation of the sound [58]. Hence, for acoustic data, we extracted temporal features and spectral features using MFCC (Mel-Frequency Cepstral Coefficients) based on several experiments. These features are concatenated and classified using SVM with RBF kernel.
As shown in the results presented in Table 7, using acoustic data leads to better performance for the two categories tram and vehicle. This is due to the relevant sound generated by these two classes. In other words, a walking pedestrian sound is narrow compared to the tram sound that presents more information. For this reason, precision and recall rates related to the tram and the vehicle classes are higher than the two others.

5.4. Multi-Modalities Fusion System

To prove the significance of our dataset, we take advantage of the different sensors by proposing a fusion framework system. This framework is built in the lights of the results obtained from the aforementioned systems. In fact, we identify the effectiveness of each sensor individually and its ability to differentiate one class of another according to the results presented in Section 5.1, Section 5.2 and Section 5.3. The architecture of the proposed fusion framework is represented in Figure 9.
The first step of the framework consists of extracting the labels from MobileNet CNN. If the extracted label is a car or a tram, we use the acoustic-based system to verify the attributed label, and, all the labels are updated accordingly. The CNN-extracted label is neither a tram neither a car, the distance of the object will be calculated. Thus, if it is a far obstacle we will keep the same labels of the CNN model. Nonetheless, if it is a near obstacle then it will be either a pedestrian or a cyclist. In addition, we will adopt the radar-based system to confirm the attributed label, since it can particularly discriminate the aforementioned categories in a range less than 6 m. Thus, the results related to the fusion framework are illustrated in Table 8.

6. Discussion

We conducted various experiments using mono-modality and multi-modalities to validate our dataset and to open perspectives the way for future research. The fusion levels exploited in our work are the following: low, intermediate and late levels. We can recognize the low level fusion when projecting narrow band data into UWB signals to define ROIs. The intermediate fusion consists of concatenating temporal and spectral features for acoustic data. Lastly, the late level is exploited in decisions fusion to obtain the final decisions of the total framework. From analyzing the fusion results presented in Table 7, we notice that the performance has been clearly improved in terms of precision. The enhancement brought along with the acoustic system has a higher importance compared with the contribution of the radar-based system. This is mainly because of the range and power limitations of the UWB radar. Despite this fact, it provides a unique signature for each type of object with a low price compared to the new sophisticated radars. For the acoustic system, the distance between the obstacle and the sensor presents an important challenge. Moreover, obstacles like pedestrians and cyclists have low magnitude acoustic signals and could not easily detected through acoustic based systems.
The considered environments in OLIMP are challenging and present various confusing categories such as metal infrastructure, trafic signs, glass-surface buildings, etc. The obtained results for object detection are promising and show the importance of using multimodality for vehicle environment perception. To the best of our knowledge this is the first dataset that has exploited ultra UWB technology and acoustic data this shows the originality of our work. For this reason, we encourage research on proposing new fusion networks that use either two modality or more to enhance the vehicle environment perception. The proposed fusion framework is limited because of its simple and serial aspect. We believe that this shortage could be overcome using advanced parallel fusion systems. This will be investigated in future work.

7. Conclusions

In this paper we propose OLIMP, a multimodal dataset for environment perception. It includes four modalities: images, ultra wide band radar signatures, narrow band data streams and acoustic data. Further, the acquired data is synchronized and the annotation process is provided for RGB images. This dataset unprecedentedly introduces ultra wide band radar and acoustic sensor. The proposed dataset was captured in various environments and dedicated mainly to dense urban traffic situtations. To demonstrate the effectiveness of our dataset, we presented a fusion framework which takes advantage of the results obtained using each modality separately. In spite of its simplicity, the proposed framework yields promising improvement in terms of precision. These experiments highlight the relevance of the proposed modalities.

Author Contributions

Conceptualization, I.A. and A.B.K.; methodology, A.M. (Amira Mimouna), I.A. and A.B.K.; software, A.M. (Amira Mimouna), Y.E.H. and A.B.K.; validation, I.A. and A.B.K.; formal analysis, A.M. (Amira Mimouna), I.A. and A.B.K.; investigation, A.M. (Amira Mimouna), I.A. and A.B.K.; resources, Y.E.H.; data curation, A.M. (Amira Mimouna); writing–original draft preparation, A.M. (Amira Mimouna); writing–review and editing, A.M. (Amira Mimouna), I.A., A.B.K., A.O. and N.E.B.A.; visualization, A.M. (Amira Mimouna); supervision, A.T.-A., N.E.B.A. and A.M. (Atika Menhaj); project administration, N.E.B.A., A.M. (Atika Menhaj) and A.T.-A.; funding acquisition, A.M. (Atika Menhaj). All authors have read and agreed to the published version of the manuscript.

Conflicts of Interest

The authors declare no conflict of interest.

References

  1. Jegham, I.; Khalifa, A.B.; Alouani, I.; Mahjoub, M.A. MDAD: A Multimodal and Multiview in-Vehicle Driver Action Dataset. Comput. Anal. Images Patterns 2019, 518–529. [Google Scholar]
  2. Jegham, I.; Khalifa, A.B.; Alouani, I.; Mahjoub, M.A. Safe driving: Driver action recognition using SURF keypoints. In Proceedings of the International Conference on Microelectronics (ICM), Sousse, Tunisia, 16–19 December 2018; pp. 60–63. [Google Scholar]
  3. Dang, L.M.; Piran, M.; Han, D.; Min, K.; Moon, H. A survey on internet of things and cloud computing for healthcare. Electronics 2019, 8, 768. [Google Scholar] [CrossRef] [Green Version]
  4. Fridman, L.; Brown, D.E.; Glazer, M.; Angell, W.; Dodd, S.; Jenik, B.; Terwilliger, J.; Patsekin, A.; Kindelsberger, J.; Ding, L.; et al. MIT advanced vehicle technology study: Large-scale naturalistic driving study of driver behavior and interaction with automation. IEEE Access 2019, 8, 102021–102038. [Google Scholar] [CrossRef]
  5. Xue, J.R.; Fang, J.W.; Zhang, P. A survey of scene understanding by event reasoning in autonomous driving. Int. J. Autom. Comput. 2018, 15, 249–266. [Google Scholar] [CrossRef]
  6. Femmam, S.; M’Sirdi, N.; Ouahabi, A. Perception and characterization of materials using signal processing techniques. IEEE Trans. Instrum. Meas. 2001, 50, 1203–1211. [Google Scholar] [CrossRef]
  7. Khalifa, A.B.; Alouani, I.; Mahjoub, M.A.; Amara, N.E.B. Pedestrian detection using a moving camera: A novel framework for foreground detection. Cogn. Syst. Res. 2020, 60, 77–96. [Google Scholar] [CrossRef]
  8. Jegham, I.; Khalifa, A.B. Pedestrian detection in poor weather conditions using moving camera. In Proceedings of the IEEE/ACS 14th International Conference on Computer Systems and Applications (AICCSA), Hammamet, Tunisia, 30 October–3 November 2017; pp. 358–362. [Google Scholar]
  9. Chebli, K.; Khalifa, A.B. Pedestrian detection based on background compensation with block-matching algorithm. In Proceedings of the 15th International Multi-Conference on Systems, Signals & Devices (SSD), Hammamet, Tunisia, 19–22 March 2018; pp. 497–501. [Google Scholar]
  10. Sarkar, S.; Mohan, B. Review on Autonomous Vehicle Challenges. First Int. Conf. Artif. Intell. Cogn. Comput. 2019, 815, 593–603. [Google Scholar]
  11. Geiger, A.; Lenz, P.; Urtasun, R. Are we ready for autonomous driving? the kitti vision benchmark suite. In Proceedings of the IEEE Conference on Computer Vision and Pattern Recognition, Providence, RI, USA, 16–21 June 2012; pp. 3354–3361. [Google Scholar]
  12. Cordts, M.; Omran, M.; Ramos, S.; Rehfeld, T.; Enzweiler, M.; Benenson, R.; Franke, U.; Roth, S.; Schiele, B. The cityscapes dataset for semantic urban scene understanding. In Proceedings of the IEEE conference on computer vision and pattern recognition, Las Vegas, NV, USA, 27–30 June 2016; pp. 3213–3223. [Google Scholar]
  13. Choi, Y.; Kim, N.; Hwang, S.; Park, K.; Yoon, J.S.; An, K.; Kweon, I.S. KAIST multi-spectral day/night data set for autonomous and assisted driving. IEEE Trans. Intell. Transp. Syst. 2018, 19, 934–948. [Google Scholar] [CrossRef]
  14. Caesar, H.; Bankiti, V.; Lang, A.H.; Vora, S.; Liong, V.E.; Xu, Q.; Krishnan, A.; Pan, Y.; Baldan, G.; Beijbom, O. nuScenes: A multimodal dataset for autonomous driving. arXiv 2019, arXiv:1903.11027. [Google Scholar]
  15. Feng, D.; Haase-Schuetz, C.; Rosenbaum, L.; Hertlein, H.; Duffhauss, F.; Glaeser, C.; Wiesbeck, W.; Dietmayer, K. Deep multi-modal object detection and semantic segmentation for autonomous driving: Datasets, methods, and challenges. IEEE Trans. Intell. Transp. Syst. 2020, 1–20. [Google Scholar] [CrossRef] [Green Version]
  16. Ziebinski, A.; Cupek, R.; Erdogan, H.; Waechter, S. A survey of ADAS technologies for the future perspective of sensor fusion. In Proceedings of the International Conference on Computational Collective Intelligence Sithonia, Halkidiki, Greece, 28–30 September 2016; pp. 135–146. [Google Scholar]
  17. Kang, Y.; Yin, H.; Berger, C. Test Your Self-Driving Algorithm: An Overview of Publicly Available Driving Datasets and Virtual Testing Environments. IEEE Trans. Intell. Veh. 2019, 4, 2379–8858. [Google Scholar] [CrossRef]
  18. Guo, J.; Kurup, U.; Shah, M. Is It Safe to Drive? An Overview of Factors, Metrics, and Datasets for Driveability Assessment in Autonomous Driving. IEEE Trans. Intell. Transp. Syst. 2019. [Google Scholar] [CrossRef]
  19. Brostow, G.; Shotton, J.; Fauqueur, J.; Cipolla, R. Segmentation and recognition using structure from motion point clouds. In Proceedings of the European conference on computer vision, Marseille Palais, France, 12–18 October 2008; Volume 5302, pp. 44–57. [Google Scholar]
  20. Yu, F.; Xian, W.; Chen, Y.; Liu, F.; Liao, M.; Madhavan, V.; Darrell, T. Bdd100k: A diverse driving video database with scalable annotation tooling. arXiv 2018, arXiv:1805.04687. [Google Scholar]
  21. Wang, P.; Huang, X.; Cheng, X.; Zhou, D.; Geng, Q.; Yang, R. The apolloscape open dataset for autonomous driving and its application. IEEE Trans. Pattern Anal. Mach. Intell. 2019, 1. [Google Scholar] [CrossRef] [PubMed] [Green Version]
  22. Abhishek, P.; Srikanth, M.; Haiming, G.; Yi-Ting, C. The H3D Dataset for Full-Surround 3D Multi-Object Detection and Tracking in Crowded Urban Scenes. In Proceedings of the International Conference on Robotics and Automation Montreal Convention Centre, Montreal, QC, Canada, 20–24 May 2019. [Google Scholar]
  23. Xue, J.; Fang, J.; Li, T.; Zhang, B.; Zhang, P.; Ye, Z.; Dou, J. BLVD: Building A Large-scale 5D Semantics Benchmark for Autonomous Driving. In Proceedings of the International Conference on Robotics and Automation (ICRA) Montreal Convention Centre, Montreal, QC, Canada, 20–24 May 2019; pp. 6685–6691. [Google Scholar]
  24. Maddern, W.; Pascoe, G.; Linegar, C.; Newman, P. 1 year, 1000 km: The Oxford RobotCar dataset. Int. J. Robot. Res. 2017, 36, 3–15. [Google Scholar] [CrossRef]
  25. Udacity Self-Driving Car. 2019. Available online: https://github.com/udacity/self-driving-car (accessed on 25 March 2020).
  26. Chen, Y.; Wang, J.; Li, J.; Lu, C.; Luo, Z.; Xue, H.; Xue, H. Lidar-video driving dataset: Learning driving policies effectively. In Proceedings of the IEEE Conference on Computer Vision and Pattern Recognition, Salt Lake City, UT, USA, 18–22 June 2018; pp. 5870–5878. [Google Scholar]
  27. Ferroukhi, M.; Ouahabi, A.; Attari, M.; Habchi, Y.; Taleb-Ahmed, A. Medical video coding based on 2nd-generation wavelets: Performance evaluation. Electronics 2019, 8, 88. [Google Scholar] [CrossRef] [Green Version]
  28. Barnes, D.; Gadd, M.; Murcutt, P.; Newman, P.; Posner, I. The Oxford Radar RobotCar Dataset: A Radar Extension to the Oxford RobotCar Dataset. arXiv preprint 2019, arXiv:1909.01300. [Google Scholar]
  29. Jegham, I.; Khalifa, A.B.; Alouani, I.; Mahjoub, M.A. Vision-based human action recognition: An overview and real world challenges. Forensic Sci. Int. Digit. Investig. 2020, 32, 200901. [Google Scholar]
  30. Arnold, E.; Al-Jarrah, O.; Dianati, M.; Fallah, S.; Oxtoby, D.; Mouzakitis, A. A survey on 3d object detection methods for autonomous driving applications. IEEE Trans. Intell. Transp. Syst. 2019, 10, 3782–3795. [Google Scholar] [CrossRef] [Green Version]
  31. González, A.; Vázquez, D.; López, A.M.; Amores, J. On-board object detection: Multicue, multimodal, and multiview random forest of local experts. IEEE Trans. Cybern. 2016, 47, 3980–3990. [Google Scholar] [CrossRef]
  32. Sindagi, V.; Zhou, Y.; Tuzel, O. MVX-Net: Multimodal voxelnet for 3D object detection. In Proceedings of the International Conference on Robotics and Automation (ICRA) Montreal Convention Centre, Montreal, QC, Canada, 20–24 May 2019; pp. 7276–7282. [Google Scholar]
  33. Bijelic, M.; Mannan, F.; Gruber, T.; Ritter, W.; Dietmayer, K.; Heide, F. Seeing Through Fog Without Seeing Fog: Deep Sensor Fusion in the Absence of Labeled Training Data. arXiv preprint 2019, arXiv:1902.08913. [Google Scholar]
  34. Simonyan, K.; Zisserman, A. Very deep convolutional networks for large-scale image recognition. arXiv preprint 2014, arXiv:1409.1556. [Google Scholar]
  35. Liu, W.; Anguelov, D.; Erhan, D.; Szegedy, C.; Reed, S.; Fu, C.; Berg, A. Ssd: Single shot multibox detector. In Proceedings of the European conference on computer vision, Amsterdam, The Netherlands, 8–16 October 2016; pp. 21–37. [Google Scholar]
  36. Xu, D.; Anguelov, D.; Jain, A. Pointfusion: Deep sensor fusion for 3d bounding box estimation. In Proceedings of the IEEE Conference on Computer Vision and Pattern Recognition, Salt Lake City, UT, USA, 18–23 June 2018; pp. 244–253. [Google Scholar]
  37. Qi, C.; Liu, W.; Wu, C.; Su, H.; Guibas, L. Frustum pointnets for 3d object detection from rgb-d data. In Proceedings of the IEEE Conference on Computer Vision and Pattern Recognition, Salt Lake City, UT, USA, 18–23 June 2018; pp. 918–927. [Google Scholar]
  38. Oh, S.I.; Kang, H. Object detection and classification by decision-level fusion for intelligent vehicle systems. Sensors 2017, 17, 207. [Google Scholar] [CrossRef] [Green Version]
  39. Hwang, S.; Park, J.; Kim, N.; Choi, Y.; So Kweon, I. Multispectral pedestrian detection: Benchmark dataset and baseline. In Proceedings of the Proceedings of the IEEE conference on computer vision and pattern recognition, Boston, MA, USA, 7–12 June 2015; pp. 1037–1045. [Google Scholar]
  40. Khalid, B.; Khan, A.; Akram, M.U.; Batool, S. Person Detection by Fusion of Visible and Thermal Images Using Convolutional Neural Network. In Proceedings of the 2nd International Conference on Communication, Computing and Digital systems (C-CODE), Islamabad Pakistan, 6–7 March 2019; pp. 143–148. [Google Scholar]
  41. Wagner, J.; Fischer, V.; Herman, M.; Behnke, S. Multispectral Pedestrian Detection using Deep Fusion Convolutional Neural Networks. ESANN 2016. [Google Scholar]
  42. Li, C.; Song, D.; Tong, R.; Tang, M. Illumination-aware faster R-CNN for robust multispectral pedestrian detection. Pattern Recognit. 2019, 85, 161–171. [Google Scholar] [CrossRef] [Green Version]
  43. Ren, S.; He, K.; He, K.; Sun, J. Faster r-cnn: Towards real-time object detection with region proposal networks. Adv. Neural Inf. Process. Syst. 2015, 91–99. [Google Scholar] [CrossRef] [Green Version]
  44. Wang, X.; Xu, L.; Sun, H.; Xin, J.; Zheng, N. On-road vehicle detection and tracking using MMW radar and monovision fusion. IEEE Trans. Intell. Transp. Syst. 2016, 17, 2075–2084. [Google Scholar] [CrossRef]
  45. Bouain, M.; Berdjag, D.; Fakhfakh, N.; Atitallah, R.B. Multi-Sensor Fusion for Obstacle Detection and Recognition: A Belief-Based Approach. In Proceedings of the 21st International Conference on Information Fusion (FUSION), Cambridge, UK, 10–13 July 2018; pp. 1217–1224. [Google Scholar]
  46. Wang, J.G.; Chen, S.J.; Zhou, L.B.; Wan, K.W.; Yau, W.Y. Vehicle Detection and Width Estimation in Rain by Fusing Radar and Vision. In Proceedings of the 15th International Conference on Control, Automation, Robotics and Vision (ICARCV), Singapore, 18–21 November 2018; pp. 1063–1068. [Google Scholar]
  47. Redmon, J.; Divvala, S.; Divvala, S.; Farhadi, A. You only look once: Unified, real-time object detection. In Proceedings of the IEEE conference on computer vision and pattern recognition, Las Vegas, NV, USA, 16 June–1 July 2016; pp. 779–788. [Google Scholar]
  48. Nabati, R.; Qi, H. RRPN: Radar Region Proposal Network for Object Detection in Autonomous Vehicles. In Proceedings of the IEEE International Conference on Image Processing (ICIP), Taipei, Taiwan, 22–25 September 2019; pp. 3093–3097. [Google Scholar]
  49. Chadwick, S.; Maddetn, W.; Newman, P. Distant vehicle detection using radar and vision. In Proceedings of the International Conference on Robotics and Automation (ICRA) Montreal Convention Centre, Montreal, QC, Canada, 20–24 May 2019; pp. 8311–8317. [Google Scholar]
  50. Guan, D.; Cao, Y.; Yang, J.; Cao, Y.; Yang, M.Y. Fusion of multispectral data through illumination-aware deep neural networks for pedestrian detection. Information Fusion 2019, 50, 148–157. [Google Scholar] [CrossRef] [Green Version]
  51. Nobis, F.; Geisslinger, M.; Weber, M.; Betz, J.; Lienkamp, M. A Deep Learning-based Radar and Camera Sensor Fusion Architecture for Object Detection. Sens. Data Fusion: Trends, Solut. Appl. (SDF) 2019, 1–7. [Google Scholar]
  52. The Effidence Organization. 2018. Available online: https://www.effidence.com/ (accessed on 25 March 2020).
  53. Umain corporation. 2018. Available online: https://www.umain.co.kr/en/ (accessed on 25 March 2020).
  54. Continental. 2018. Available online: https://www.conti-engineering.com/en-US/Industrial-Sensors/Sensors/ (accessed on 25 March 2020).
  55. Axis. 2018. Available online: https://www.axis.com/products/axis-m1113 (accessed on 25 March 2020).
  56. Sandler, M.; Howard, A.; Zhu, M.; Zhmoginov, A.; Chen, L.C. Mobilenetv2: Inverted residuals and linear bottlenecks. In Proceedings of the IEEE conference on computer vision and pattern recognition, Salt Lake City, UT, USA, 18–23 June 2018; pp. 4510–4520. [Google Scholar]
  57. Qin, Z.; Zhang, Z.; Chen, X.; Wang, C.; Peng, Y. Fd-Mobilenet: Improved Mobilenet with a Fast Downsampling Strategy. In Proceedings of the 25th (ICIP), Beijing, China, 17–20 September 2017; pp. 1363–1367. [Google Scholar]
  58. Serizel, R.; Bisot, V.; Essid, S.; Richard, G. Acoustic features for environmental sound analysis. Comput. Anal. Sound Scenes Events 2018, 71–101. [Google Scholar]
Figure 1. A comparison of nuScences, Kitti and Kaist Multispectral datasets samples.
Electronics 09 00560 g001
Figure 2. Data acquisition architecture.
Electronics 09 00560 g002
Figure 3. Structure setup.
Electronics 09 00560 g003
Figure 4. Frames synchronisation (ST: object’s stream, n: number of obstacles in the scene).
Electronics 09 00560 g004
Figure 5. Challenges presented in our dataset: (a) weather conditions, (b) lighting variation, (c) occlusions and (d) object types.
Electronics 09 00560 g005
Figure 6. Objects’ signatures extracted from UWB signals (near obstacles).
Electronics 09 00560 g006
Figure 7. Inter- and intra-class challenges.
Electronics 09 00560 g007
Figure 8. Regions of interest (ROIs) selection using UWB and narrow band data.
Electronics 09 00560 g008
Figure 9. Proposed fusion framework architecture.
Electronics 09 00560 g009
Table 1. Overview of some autonomous driving datasets ( "-": no information is provided).
DatasetYearModalitiesSizeAnnotationVarityCategoriesRecording Cities
2D3DDaytimeNighttimeFogRainSnow
CamVid [19]2008Camera
Camera
4 sequences×-×----32 classesCambridge
Kitti [11]2012Lidar
Inertial sensors
22 sequences××× ---8 classesKarlsruhe
Cityscapes [12]2016Camera-×-×----30 classes50 cities
BDD100k [20]2017Camera
Camera(stereo)
Thermal camera
100k×-××-××10 classesFour regions in US
Kaist Multispectral [13]20183D lidar
GNSS
Inertial sensors
3 camera(stereo)
-×-××----Seoul
ApolloScape [21]20183D lidar
GNSS
-××××---35 classesFour regions in China
Inertial sensors
3 cameras
H3D [22]2019Lidar
GPS
160-××----8 classesSan Francisco
Inertial sensors
3 cameras
BLVD [23]2019Lidar
GPS
--×××---3 classesChangshu
Inertial sensors
6 cameras
nuScenes [14]2019Lidar
5 radars
camera
1000××××××-23 classesBoston
& Singapore
OLIMP2020UWB radar
Narrow-band radar
Microphone
407 sequences×-×-×-×4 classesFrance
Table 2. Categorization of some autonomous driving dataset by task.
DatasetAutonomous Driving Task
Multi-Object DetectionObject TrackingLane DetectionSemantic SegmentationSLAM3D Vision
CamVid [19]× × ×
kitti [11]××××××
Cityscapes [12]× ×
BDD100k [20]××××
Kaist Multispectral [13]××× ×
ApolloScape [21] ××
H3D [22]××
BLVD [23] ×
nuScenes [14]××
OLIMP××
Table 3. A summary of fusion approaches for obstacle detection.
RefObject ClassSensing Modalities ProcessingHand Crafted FeaturesNetwork PipelineFusion LevelUsed Dataset
Lidar and Camera fusion
[31]Pedestrian-Depth maps generated from lidar sensor
-RGB images
-HOG
-LBP
-Intermediate
late
Kitti
[32]3D car-Lidar voxel
-RGB images are processed via
2D image detector
-Early
Intermediate
kitti
[33]2D cars
(foggy weather)
-Depth, intensity and the height information
acquired from lidar and processed via VGG16
-RGB images are processed via VGG16
-Early and
intermediate
layers
Self-recorded dataset
[36]Car
Pedestrian
Cyclist
-Lidar raw data are processded by PointNet
-RGB images features are extracted via CNN
-CNNEarlyKitti
SUN-RGBD
Infrared and visible camera fusion
[40]Persons-RGB images and thermal images are encoded
for early fusion
-ResNet-152Early
Intermediate
KAIST-Multispectral
[41]Pedestrian-RGB images and thermal images are
processed via CaffeNet
-R-CNNEarly
Late
KAIST Pedestrian dataset
[50]Pedestrian-RGB images and thermal images are
processed via VGG16
-Faster R-CNNEarly
Intermediate
Late
KAIST Pedestrian dataset
Radar and camera fusion
[44]Vehicles-Tracks from radar sensor
-RGB images
-Symmetry detection
algoritm
-Active contour
detection
-IntermediateReal-workd recorded dataset
[45]Pedestrian-Radar generates a list of tracks
-RGB images
ACF object detector-LateReal-workd recorded dataset
[46]Vehicles-Detections from radar
-RGB images
-YoloLateSelf-recorded
dataset under
rainny weather
[48]Car, Person,
Motorcycle,
Truck, Bicycle
and Bus
-Tracks from rear radars
-RGB images from the rear camera
-Fast R-CNNEarlyTwo substes
from the
nuScenes
dataset
[49]2D Vehicle-Radar range proceeded by ResNet
-RGB images proceeded by ResNet
-One stage detectorIntermediateSelf recorded
dataset
[51]Car, Bus,
Motorcyle,
Truck, Trailer,
Bicyle, Human
-Radar data transformed to an image plane
-RGB images
-VGGlownuScences TMU
Self recorded
dataset
Table 4. Sensors specifications and properties. Measure latency is the time necessary to collect one complete data stream from the sensor.
SensorSepcificationMeasure Latency
AXISM1113 [55]-A monocular camera, RGB images, 25 FPS,
640x480 resolution, angle of view: 65 ° –25 ° , 50 Hz
20 ms
UMAIN radar [53]-≤ to 6 range, provides signals,
each obstacle has its own signature, 4 GHz.
22.5 ms
ARS 404-21 [54]-≤ to 250 range, provides distance; velocity and RCS, 77 GHz,
± 0.40   m accuracy for far range, ± 0.10   m accuracy for near range
72 ms
Microphone CM-520-≤ to 20 range, +10dB sensitivity, it fits well with
video cameras, 50Hz–16Khz for frequency response
Not Applicable
Table 5. MobileNet results (%).
PRAPmAP
Pedestrian845453
Cyclist77706760.5
Vehicle814847
Tram867675
Table 6. UWB radar-based system results (%).
PR
Pedestrian4636
Cyclist4552
Vehicle80
Tram00
Table 7. Acoustic-based system results (%).
PR
Pedestrian2017
Cyclist4415
Vehicle4038
Tram6164
Table 8. Fusion framework results (%).
PRAPmAP
Pedestrian865453
Cyclist816967
Vehicle82484760.5
Tram907675

