Article

Towards Software Based Optical Communication Methods for the Assistance of Docking Autonomous Underwater Vehicles

1
Faculty of Engineering and Technology, Liverpool John Moores University, Liverpool L3 3AF, UK
2
Faculty of Science, Liverpool John Moores University, Liverpool L3 3AF, UK
*
Author to whom correspondence should be addressed.
Electronics 2020, 9(4), 655; https://doi.org/10.3390/electronics9040655
Submission received: 17 March 2020 / Revised: 8 April 2020 / Accepted: 9 April 2020 / Published: 16 April 2020
(This article belongs to the Special Issue Underwater Communication and Networking Systems)

Abstract

:
The use of optical communications systems is prevalent in underwater robotics when short-range data transmission is required or preferred. This paper proposes a method of producing and testing an optical communications system for use in the assistance of optical docking for autonomous underwater vehicles (AUVs). It describes how the Simulink modelling environment was used to program and simulate a model of a transmitter, which was then implemented on a microcontroller. The transmitter model implemented on hardware was then used to produce an optical signal, which was sampled, logged and used to design a receiver model in Simulink. For signalling purposes, the experiment used a light-emitting diode (LED) with a driver circuit and photodiode based receiver. This simulated approach using real world data enabled the analysis of the system at every point during the process, allowing for a hardware in the loop style approach to be used in the receiver model design. Consequently, the Simulink Coder was used to produce the receiver model’s equivalent in C++ for later deployment. A benchmark was determined through experimentation to compare within future studies; the system was tested and found to operate effectively at distances between 1 m and 12 m in a controlled in air test environment.

1. Introduction

Autonomous underwater vehicles (AUVs) have become more prevalent over the past decades alongside the further developments in wireless communication, which are of great interest to both military and civilian spheres [1,2,3]. However, retrieval of AUVs remains a key challenge, with optical techniques being explored for some time. Many approaches utilise docking lights and computer vision techniques to enable their respective guidance processes to perform line-up and terminal docking operations [4,5,6,7,8]. Optical docking techniques rely on the dock being in view of the AUVs forward looking camera or cameras, for preliminary and terminal stages of docking. As described by Bosch et al., sequentially flashing underwater light beacons allow them to be individually identified from one another and that the light pulse durations are subject to limitations imposed by the frame rate of the camera used to observe them [9]. Through the utilisation of this technique, a means of combining sequentially flashing beacons and optical communications using an easy to modify software driven approach was developed though simulation. With respect to active docking techniques that use high power LEDs for signalling purposes, opposed to passive approaches that use markers such as QR codes, it is reasonable to assume that a photo receiver circuit could also receive a communications signal using the same transmitting electronics and medium.
This paper presents a means of using docking lights as a communications channel, with a view to complementing an AUV’s optical docking techniques. The wider context of this study relates to observations made in a study, which was authored by Palomeras et al., relating to determining landmark orientation from range-only estimates. It may be initialised by communicating the orientation of the dock and hence the orientation of visual landmarks to the AUV in the first instance; this is of particular relevance if the docking station is not fixed and is not established as a priori [10]. The system proposed divides the optical signalling duty cycle into lighting for the camera and communication states, respectively, although this paper only explores the communication aspect.

2. Literature and Related Work

2.1. Acoustic and Electromagnetic Communication

Well established means of communicating underwater, such as acoustic and electromagnetic techniques, each have a range of operating parameters and restrictions. Acoustic communications are known to operate over large distances with respect to carrier frequency, with systems utilising frequencies between 8 kHz and 16 kHz being able to operate in excess of 10 km [11]. More recently, protocols such as JANUS have also been developed to help unify underwater acoustic communications standards [12]. Typically, the carrier frequencies used are in the order of kHz, which leads to limited bandwidth and the relatively high power consumption of acoustic transducers can be a non-trivial drain on batteries [2]. Acoustic techniques are often described as having low bandwidth with a high propagation delay; they also have the potential to have a negative impact on marine life [2]. Electromagnetic communication systems have a different set of considerations associated, such as those explored by Abdou et al. who successfully demonstrated 433 MHz radio communication up to 45 cm using bow tie antennas, although this technique may be capable of greater distances [13].

2.2. Optical Communication

Visible optical ranges of the electromagnetic spectrum have become particularly popular for communication, this has been largely driven by advances in high power LEDs and highly sensitive photo receivers, which are affordable and available off the shelf [3,14,15]. Optical communication in the visible spectrum has been demonstrated to have notable advantages in terms of increased bandwidth; however, it is limited by an often complex combination of drawbacks. These are often imposed by the turbidity of the water for example; as a result, these tend to provide a limited practical range with distances ranging from 10 m to 30 m being typical [3]. The amplitude of the optical signal received imposes limitations on transmission distance and is determined by a number of impacting factors, such as absorption and scatterance, coupled with the effects of beam spreading, multi-path interference and physical obstruction [16,17]. Issues are further exacerbated by the additive effects of background noise, often from solar irradiance [2,3,18,19]. However, there is the potential to enable systems to communicate at larger distances, as described by Wen et al. where distances in excess of 500 m have been determined to be viable through simulation [20]. The most appropriate wavelengths for underwater optical communications have been explored in detail by various studies [2,3,18,19,21,22], most of which refer to the visible blue and green ranges of the optical spectrum and also indicate that the attenuation coefficients, with respect to signal wavelength, vary depending on the optical properties of the water, as described by Sticklus et al. and Mobley [16,19].
The signal amplitude received is governed by a number of factors, e.g., the inverse square rule with respect to distance, the angle of incidence and the effects of forwards and backwards scatterance; when deployed, attenuation due to turbidity of the water introduces elements of high non-linearity. These effects were described in detail by Sticklus et al. [19]. Figure 1 shows a generalised model of optical transmittance reproduced from Mobley [16]; this model formalises the power losses from the incidence power Φ i ( λ ) due to the effects of spectral absorbance Φ a ( λ ) and scatterance Φ s ( λ ) with respect to transmittance power Φ t ( λ ) . Equation (1) states the relationship between the transmittance power, which is the power received and the power absorbed and scattered during transmission, in relation to the incident power transmitted. Equations (2)–(4) give the fraction of power dissipated in each of these elements.
Equations (1)–(7) are used to describe the transmission of light through water and were obtained from Mobley [16].
Transmittance equation:
Φ i ( λ ) = Φ a ( λ ) + Φ s ( λ ) + Φ t ( λ )
Spectral absorptance:
A ( λ ) Φ a ( λ ) Φ i ( λ )
Spectral scatterance:
B ( λ ) Φ s ( λ ) Φ i ( λ )
Spectral transmittance:
T ( λ ) Φ t ( λ ) Φ i ( λ )
Spectral absorption coefficient:
a ( λ ) lim Δ r 0 A ( λ ) Δ r m 1
Spectral scattering coefficient:
b ( λ ) lim Δ r 0 B ( λ ) Δ r m 1
Spectral beam attenuation coefficient:
c ( λ ) a ( λ ) + b ( λ ) m 1
Inverse square law:
L u m i n e s s a n c e 1 D i s t a n c e 2
In the preceding in air experiments, it was anticipated that the absorption coefficient would be notably lower than when deployed in water, due to suspended particulates increasing the turbidity in water columns, and the same would be true for the effects of scattering.

3. Methodology

This study aimed to produce a communications system that is capable of being fully customised and configured as a model of a transmitter and receiver in a Simulink simulation, and then converted into C++ and compiled for hardware implementation. The transmitter model was produced first, simulated, modified appropriately, and then implemented on a microcontroller. Following implementation of the transmitter, real world data were collected using the receiver hardware. The collected data were used to produce a model that demodulated the signal and concatenated the data bits into bytes, which produced an output for inspection; the development process is described in Section 3. This approach varies from those used by Wen et al. and Baiden et al. as it passes many of the lower end signal processing and data handling features to software, which will be processed on the receiver model and eventually implemented on the receiving microcontroller [20,22]. This provides the developer with the opportunity to control the whole communications stack and analyse the received signal in the same state that the receiving microcontroller would process it. This also allows for changes in key processes, such as modulation technique without the need for hardware alteration. This first study aimed to use inexpensive components and a low transmission rate to create a working system, which could then be built upon and improved. While the transmission rate used in this study is low in comparison to other designs [20,21,22], the design strategy moving forward leans towards higher data rates in future iterations. Many contemporary approaches to data serialisation and transmission utilise a universal asynchronous receiver transmitter (UART) for serialisation and control of data rate at both the transmitter and receiver; this tends to come in the form of a RS232 serial bus on a computer. In the cases of Wen et al. and Baiden et al., the baud rate was controlled by the computer connected to the transmitter [20,22]. The proposed strategy differs by having all the process controlled by the implementation of the transmitter model designed in Simulink, coded into C++ and executed on a transmitter’s microcontroller. Using the internal real time clock to maintain timing and synchronisation, the serial bus was used to update the buffer in the model rather than control the transmission rate. This enabled the modulation and demodulation techniques to be simulated with real data prior to implementation, further allowing analysis and modification in software without the need to modify the hardware. This enables greater flexibility in future work.

3.1. Transmitter Hardware

For initial testing, off-the-shelf hardware solutions were selected. A green light source was chosen over a blue one for two reasons. Firstly, in salt water, the scattering coefficient in the green spectral range of the visible electromagnetic spectrum is lower than that of the blue [17,19]. Secondly, this study was conducted in preparation for another, which features a camera with a bayer array pixel configuration [23]. Such a configuration is more sensitive to the green spectrum, which made a green LED preferred over blue for the transmission. The LED selected was the Green Cree XLamp, due to its high luminance output at a centre wavelength of 535 nm. The transmitter is illustrated in Figure 2a. A monolithic solid state LED driver was used to produce the necessary pulses required for the communication system without the need to include additional inductance or resistive current limiting, which both could affect the rise and fall times of the luminous output. A STM32F303K8T6 microcontroller was chosen to produce the communication signal and host the transmitter model.

3.2. Receiver Hardware

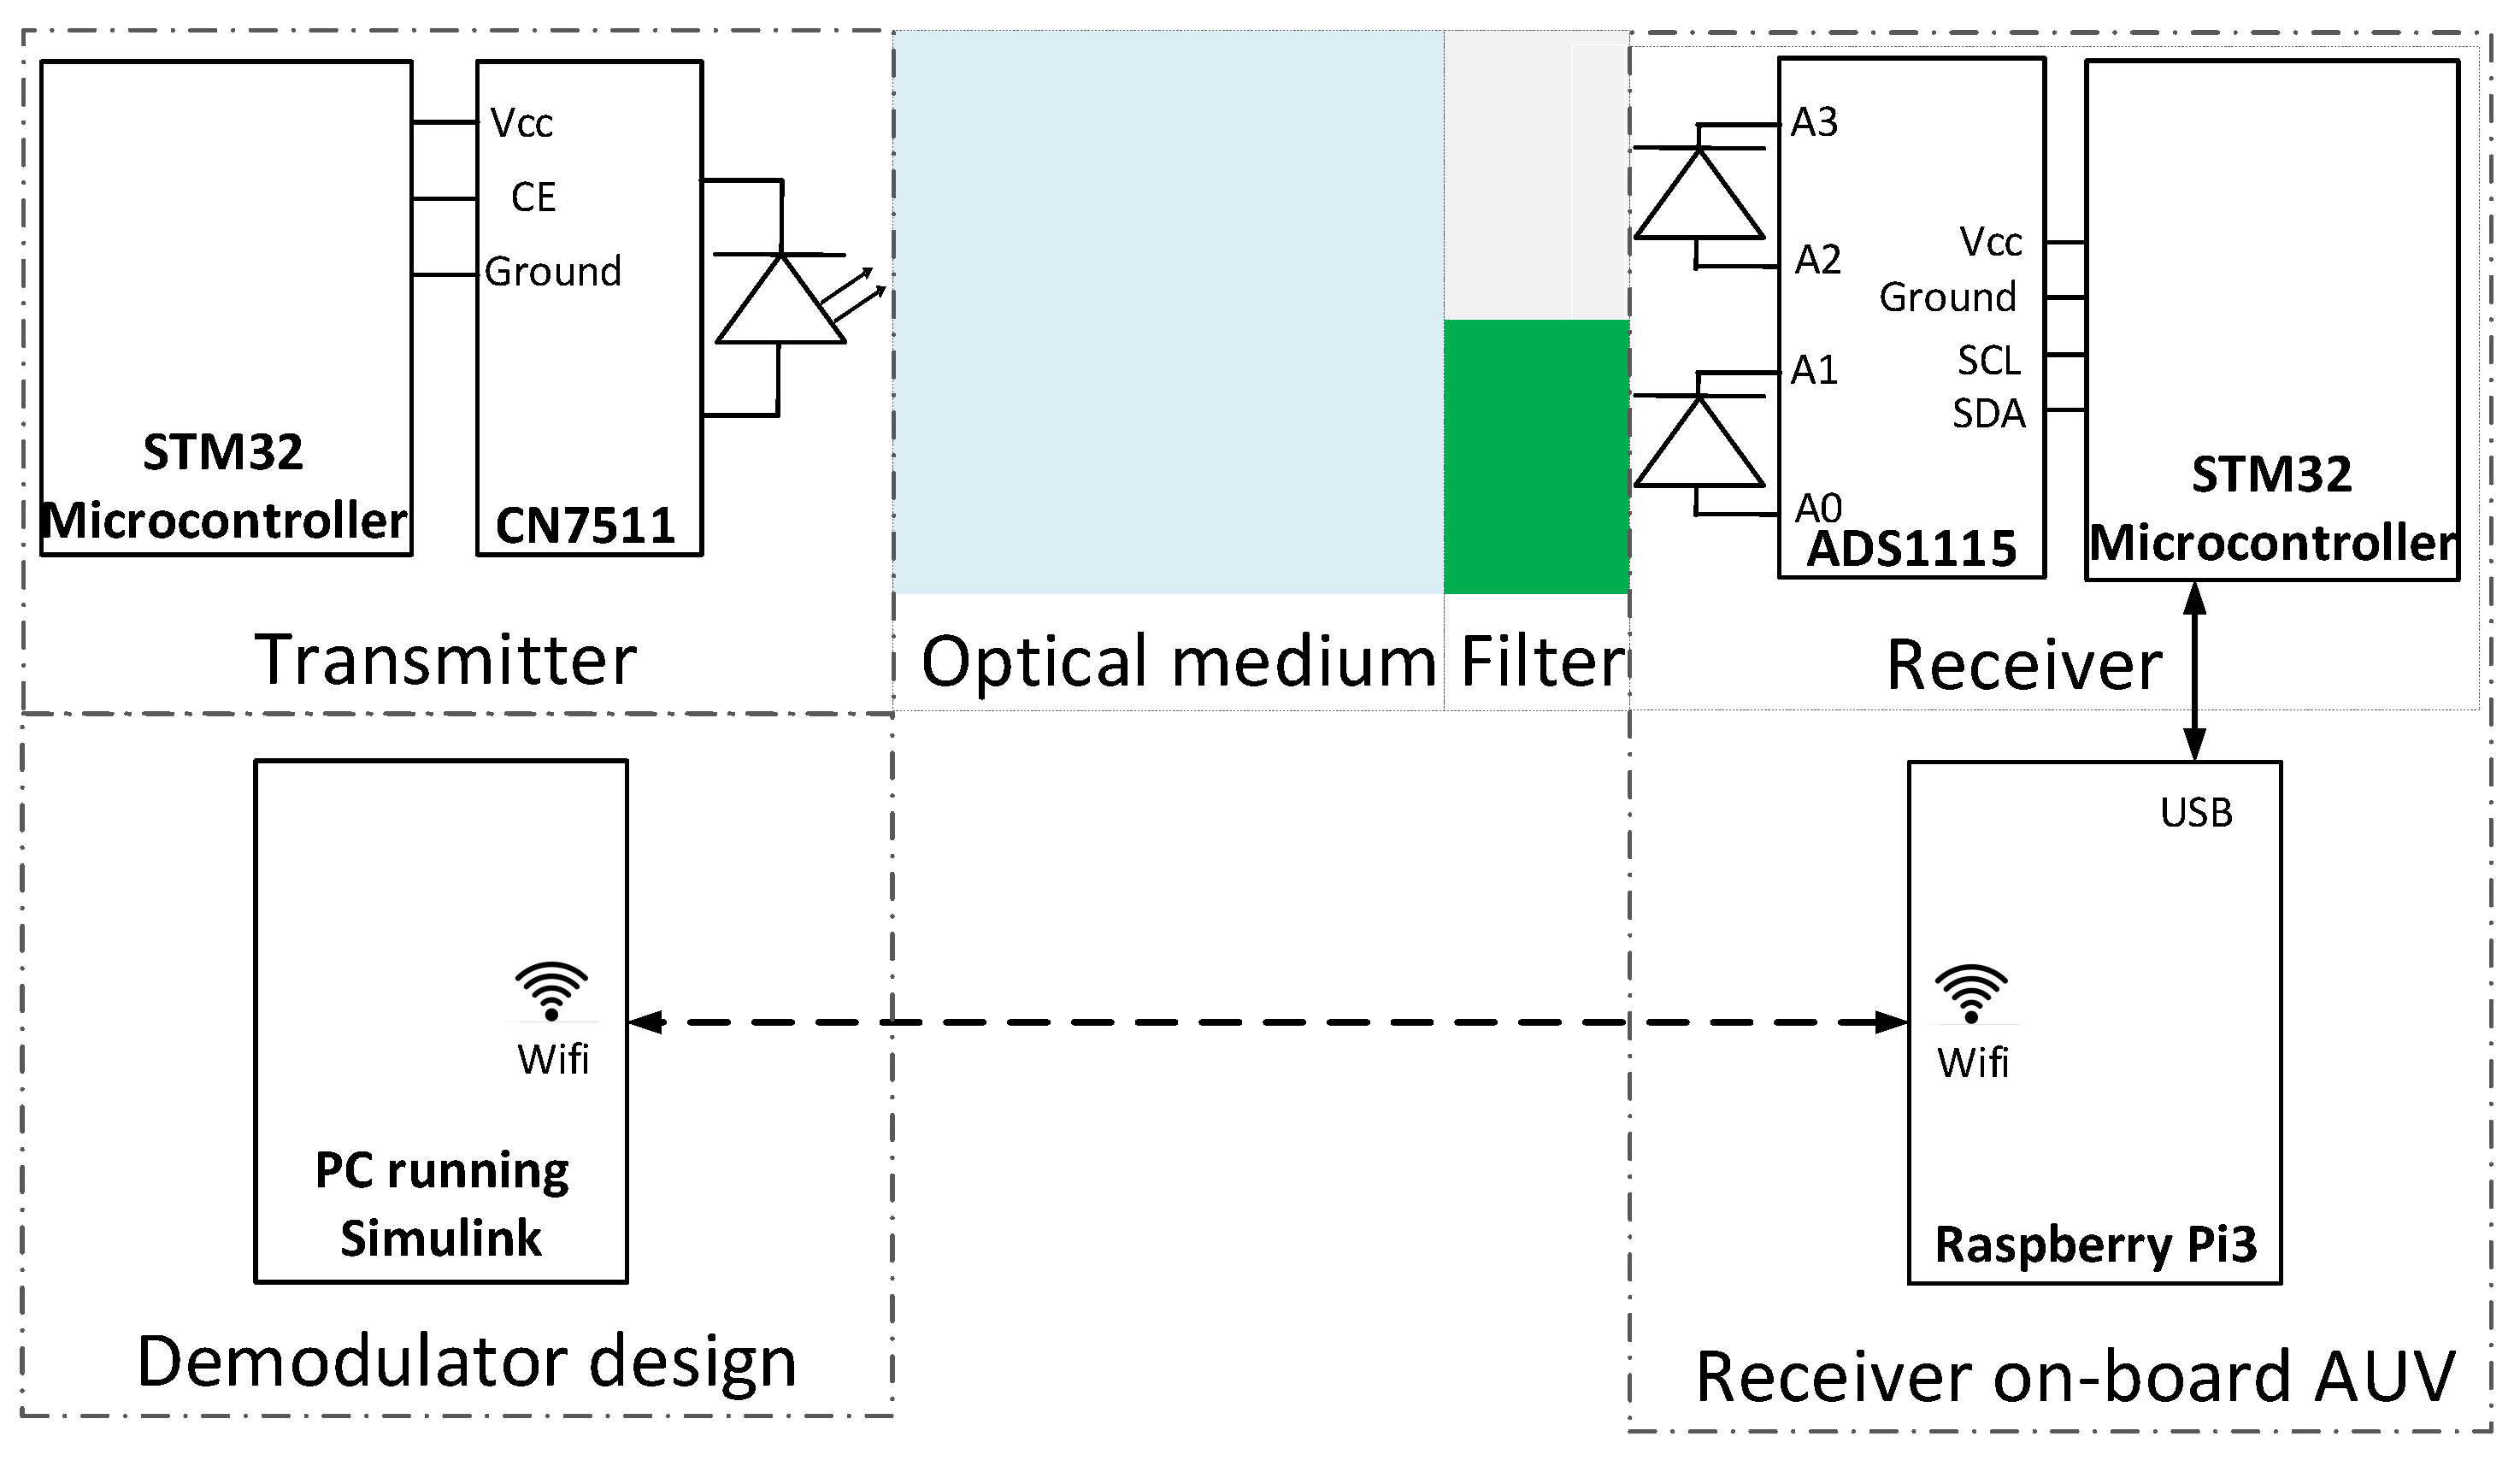
To receive the optical signal, a Vishay BPW21R photo-diode (PD) was selected due to its large dye area. It has a high sensitivity and a centre wavelength of 565 nm with a 50° symbol angle of half sensitivity. Its high spectral response within the visible spectrum made it a good choice for the experimentation. To digitalise the signal, a Texas Instrument ADS1115 analogue-to-digital converter (ADC) was selected due to its 16 bit resolution and an inbuilt programmable gain amplifier (PGA), as maximising receiving distance was a priority. Its monolithic package reduces susceptibility to external interference. As the deployment of the system was intended to be close to the water surface, it was anticipated that ambient light could potentially create signal to noise ratio issues when deployed, even if they were not apparent in the lab development environment. As the performance of the system with and without an optical filter was unknown, two photo diodes were used for later comparison, one with and one without an optical filter. A Rosco Laboratories “124 Dark Green” optical filter with a minimum absorptance around the selected green LEDs wavelength range was used for this. The transmitter/receiver functional diagram can be seen in Figure 3.

3.3. Software Development Strategy

Developing a communication system presents numerous areas of difficulty; not only does the hardware need to be within budget but more concerning was the development of software to perform the signal processing, required for modulation and demodulation tasks. Using a model based design environment such as Simulink presents the opportunity to develop a system that operates the same way when deployed as it does in simulation, as well as being able to input data into the model for analysis during development. Part of the aim was to produce a system that works in less than ideal conditions, which in turn requires either an in depth knowledge of the operating constraints when deployed to produce a fully characterised model or real world data produced from experimentation. Therefore, real world data and a software in the loop style approach towards system development were used within the Simulink design environment, as described in Figure 4. Being able to simulate the system and determine exactly how it will behave prior to deployment was advantageous. The code produced by the Simulink coder will behave the same way when deployed as it does in simulation, assuming adequate computational resources are available and the timing provided comes from the same source. Robot Operating System (ROS) is a middleware platform developed to integrate robotic systems; it hosts applications which are referred to as ROS nodes that make up a robotic systems software stack. ROS automaticity conveys messages between nodes in an asynchronous manor, which can also be distributed on different computers. ROS is a pre-existing system used in the project being codeveloped alongside this study and presented an ideal means of conveying illuminance messages from the receiving microcontroller to Simulink.

3.4. Modulation and Transmission

The code in the model first serialised four 8 bit integers as a data packet. A lead in pulse was applied with a duty cycle of 1000 ms. This pulse was used to synchronise the transmitted waveform with the receiver, the resulting waveform was periodic and asynchronous. The transmitted waveform was split into two, as it shared its functionality with other functions the docking lights performed. For synchronisation purposes the lead in pulse was created, this pulse duration was of a specified constant duty cycle and could be differentiated from other pulses; its falling edge was used to synchronise the communication sequences, as well as setting a timeout counter at the receiver. This function also prevented ambient lighting effects from triggering the system and sampling the data too early. The serialised four byte data packet was passed to a process that modulated the data to produce the appropriate LED output.
On off keying (OOK), as a means of keying the data, is a common and simple strategy that was used successfully by Wen et al. and Baiden et al. It was deemed sufficient as a modulation technique at this stage of the project [20,22]. While the process described seems convoluted for the purposes of an OOK implementation, it allows the modulation method to be changed without a complete overhaul of the hardware and the associated Simulink model. The signal generated in the simulation from a single data packet is illustrated in Figure 5. The transmitted waveform has three parts: The rising edge of the first part shows the lead in pulse, which was used to synchronise the proceeding waveform. The larger section of the waveform that is logic 0 was reserved for positional signalling for the AUV; this is not part of the communications system and has been omitted.

3.5. Hardware Implementation

The receiver was attached to an AUV, which is currently in development. This allowed the existing functionality to be directly implemented for future underwater deployments. The receiver attached to the AUV can be seen in Figure 2b. ROS core ran on a Raspberry Pi3, which relayed the signal data sampled by the ADC’s directly to Simulink via WiFi and when in the water could instead be logged using ROS bag functionality [24]. This configuration provided a Simulink model with raw luminescence data read from the ADC; the rostopic hz command was used to ensure there was adequate bandwidth available to facilitate this. The strategy utilising ROS was similar to the one used by DeMarco et al. allowing ROS to be used as a messaging system between the software and hardware components that make up the overall system, with the optical communications system constituting a small part in the overall system’s functionality [25].

3.6. Demodulation Design Using Real World Data

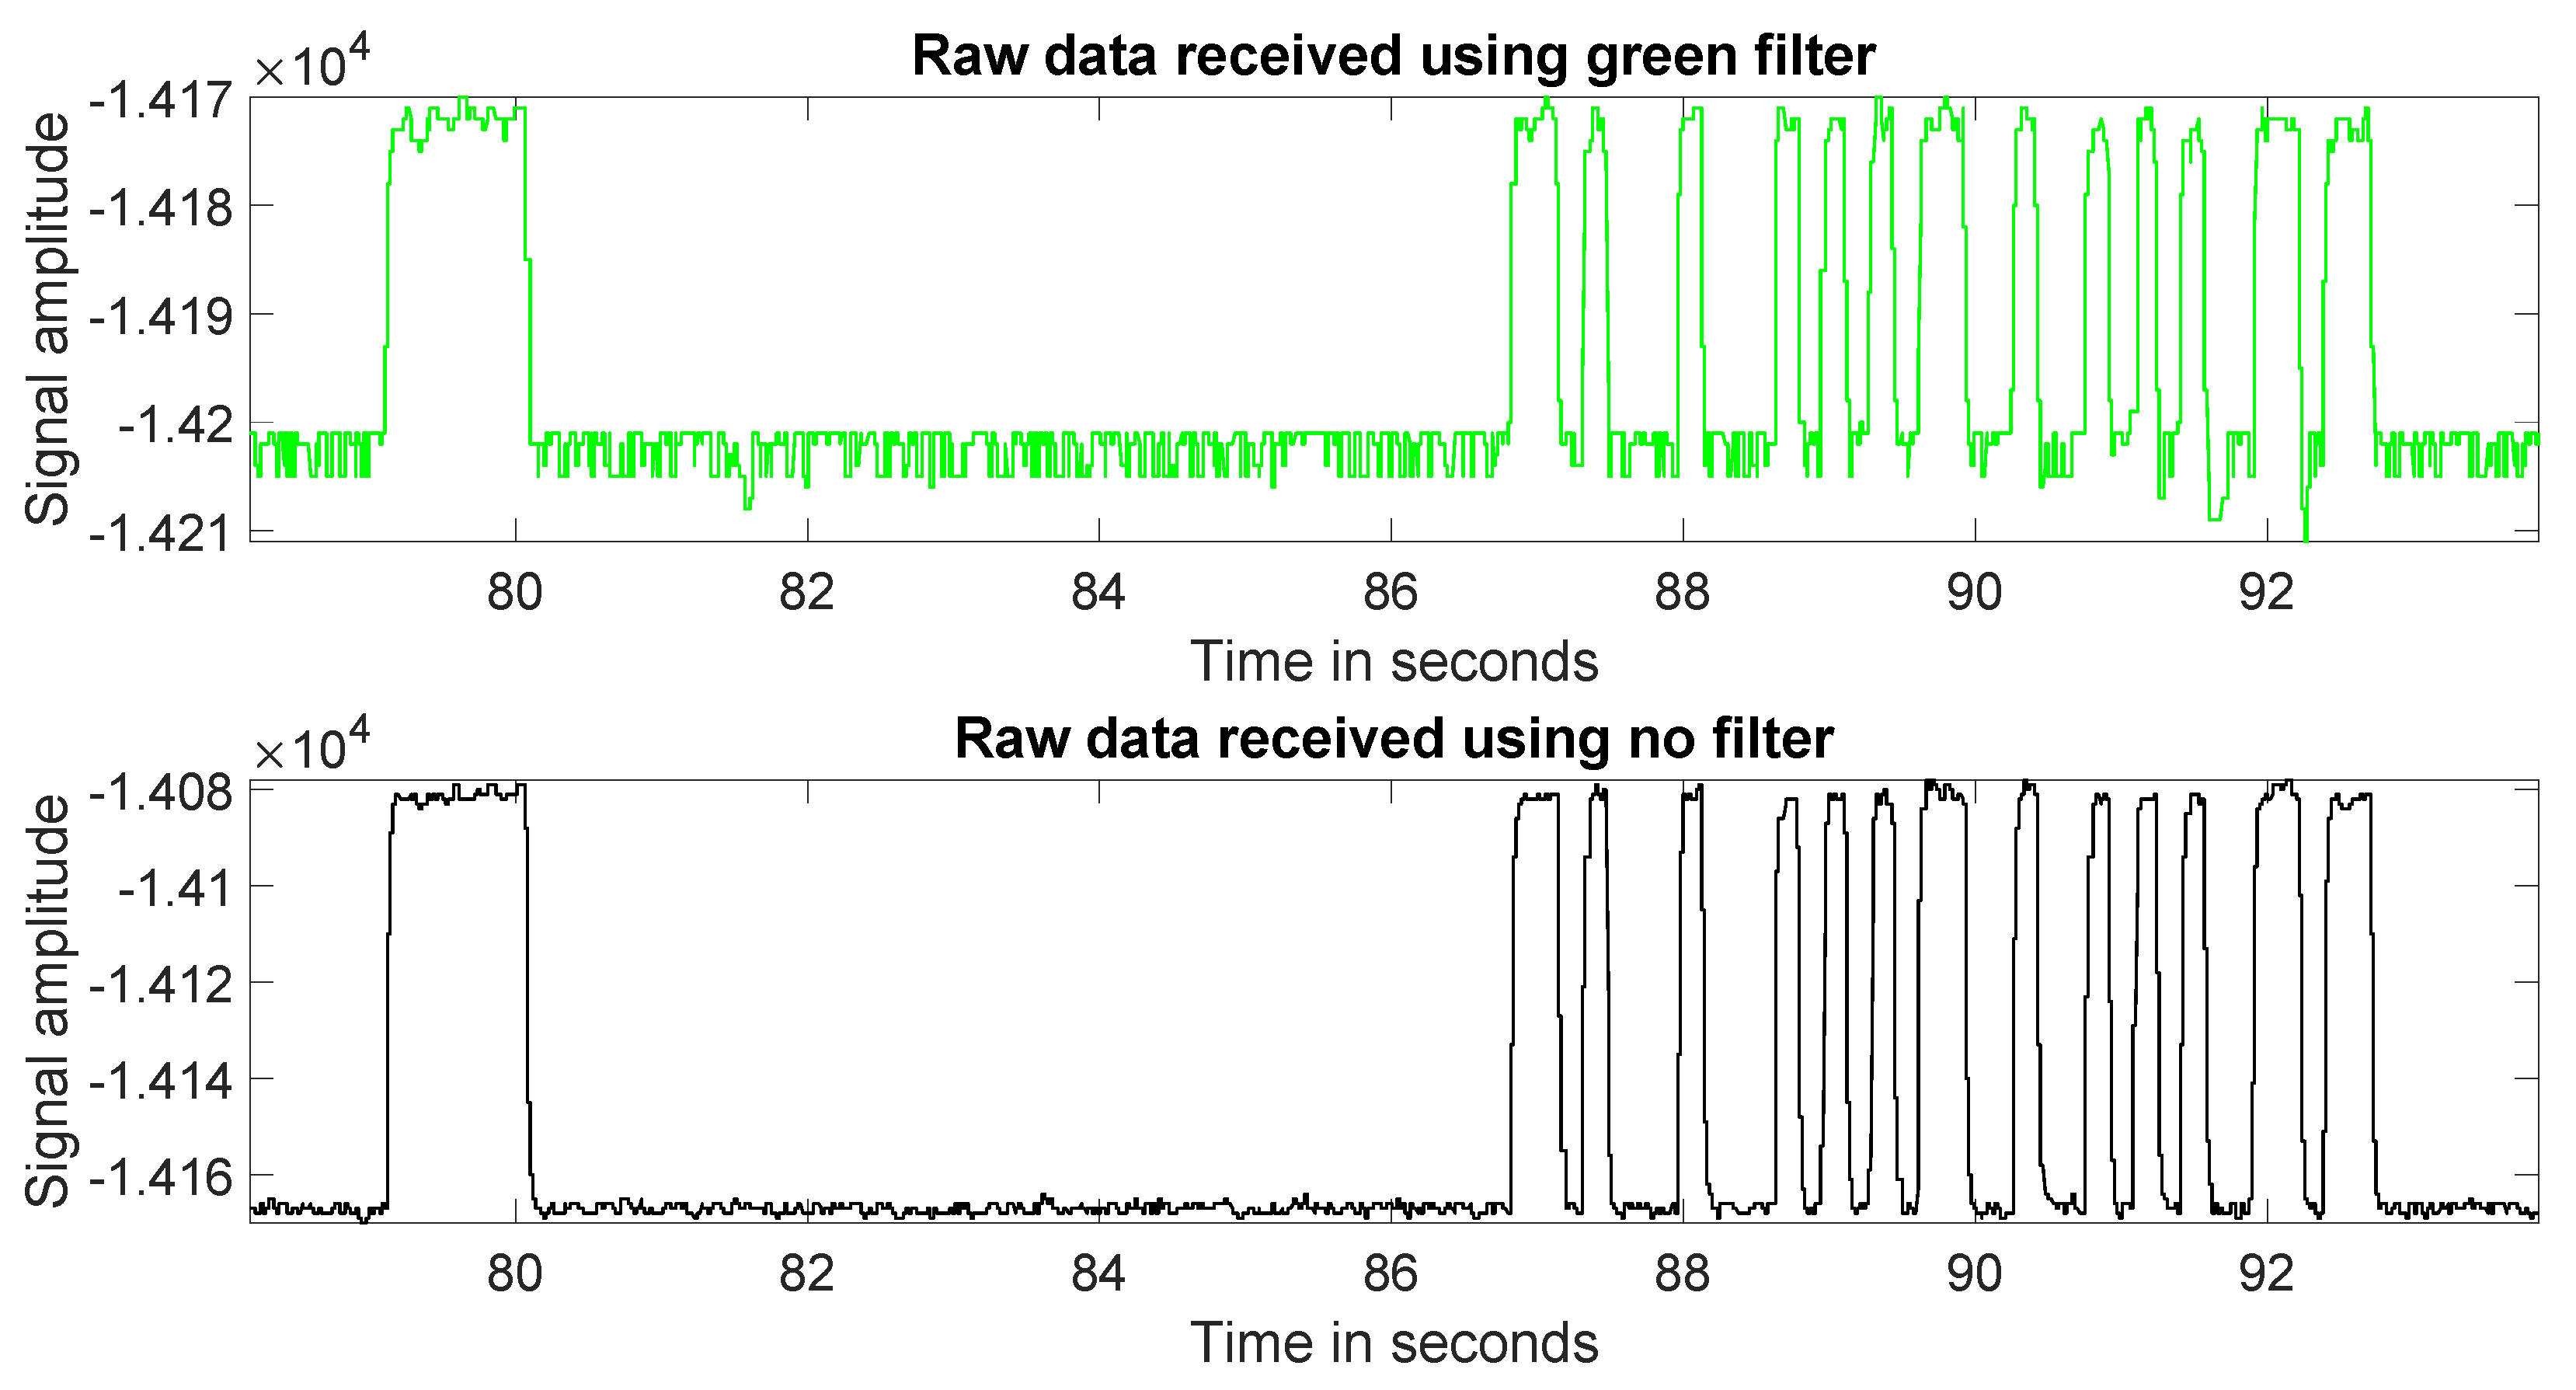
It is clear in Figure 6 that in the received waveforms a significant proportion of noise is present, as well as a DC bias. The noise present in the green filtered signal is more significant than in the unfiltered signal, which is likely due to the signal being attenuated by the filter. It should also be noted that in the front end of the receiver there is the potential for electrical noise to be picked up as well as optical noise in the photodiode.
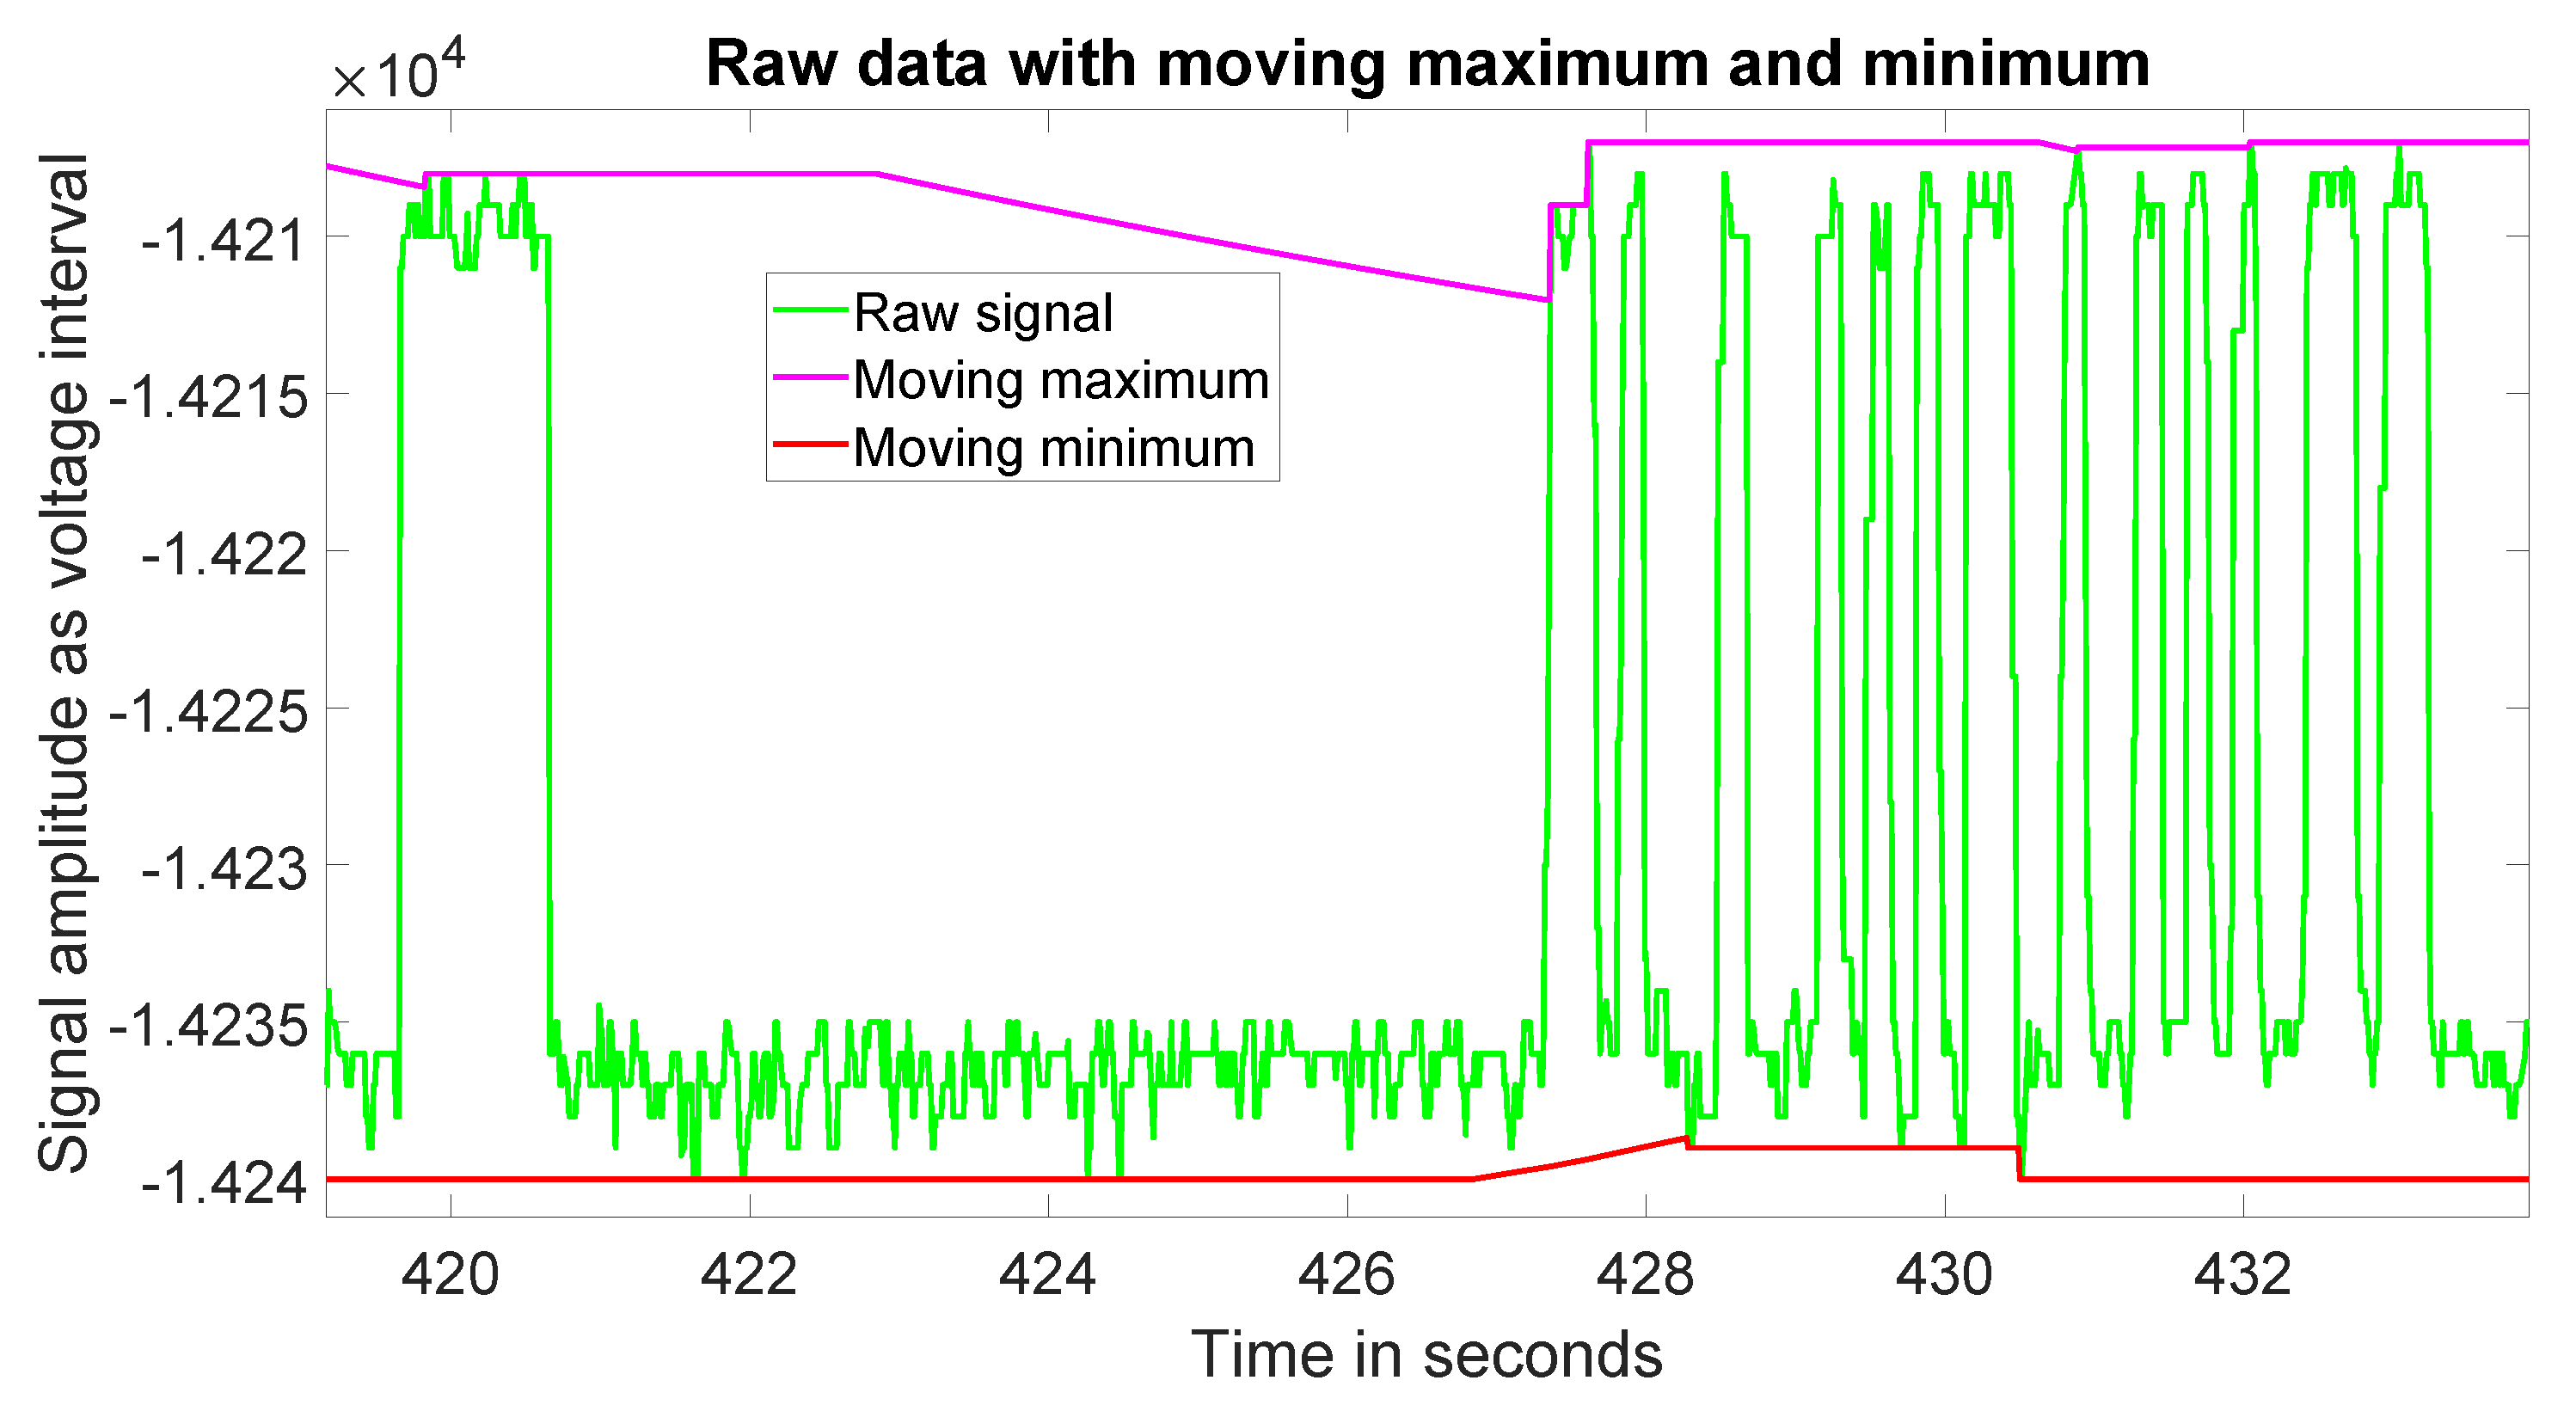
On inspection of the signal’s rise and fall events, there are first-order effects present due to the internal capacitance of both the transmitter and receiver circuits, which was expected and also experienced by Baiden et al., Wen et al. and Sticklus et al. [19,20,22]. The following task was to design a means of extracting the transmitted data from the signal. The first step inverted the signal by applying a gain of −1. The aim was to produce a thresholded signal closely resembling the waveform produced by the transmitter model running on the microcontroller. Determining the maximum and minimum of the signal amplitude at any given time required a moving maximum and minimum in order to eliminate the DC bias and adjust for changes in ambient light.
A decaying moving maximum and minimum function with a timeout was derived in favour of using the native windowed moving maximum and minimum functionality within Simulink, due to the memory resources and the processing intensive element by element comparison it required to function. This operation held the previous maximum and minimum and compared it with the new input. If a new maximum or minimum was determined, it was updated and a time out was applied. When the timeout counter expired, a first-order decay was applied towards the respective maximum or minimum. The decay tended to the minimum and maximum, respectively, until a new value was found.
This provided an effective method of tracking the maximum and minimum, which required far fewer resources than Simulink’s native moving maximum and minimum block required; its output is illustrated in Section 4.2. The point at which the received signal’s amplitude started to rise represented the instance just after the transmitters’ respective GPIO pins transitioned to logic 1 and the reverse was true for the falling edge. Following the moving maximum and minimum, thresholding functionality was applied respective to these events. Thresholding was performed using a state machine rather than a comparison between the input and an arbitrary constant. This functionality utilised four states in a sequence to resolve the thresholded output.
The input to the thresholding algorithm was the luminescence signal, as a function of the difference between the moving maximum and minimum and making it a unit value. In the subsequent experiments, the high and low threshold values were both set to the unit value of 0.4 and 0.707, respectively; this is described using a switch statement and the sequence of if statements shown in Algorithm 1. These values represent the thresholds which trigger a transition between the high and low outputs of the algorithm and prevent the rising and falling edges of the thresholded output being triggered multiple times by signal noise. The high and low threshold values were determined through iterative testing, and a dynamic means of establishing them will be considered in future work.
Algorithm 1 State based thresholding algorithm
Input variables: M o v i n g M a x i m u m , M o v i n g M i n i m u m
Input Constants: H i g h T h r e s h o l d = 0.4 , L o w T h r e s h o l d = 0.707
Persistent variables: B u f f e r = 0 , S t a t e = 0
Output: T h r e s h o l d b u f f e r
  • d M o v i n g M a x M i n = M o v i n g M a x i m u m M o v i n g M i n i m u m
  • H i g h T r i g g e r = M o v i n g M i n i m u m + ( d M o v i n g M a x M i n H i g h T h r e s h o l d )
  • L o w T r i g g e r = M o v i n g M i n i m u m + ( d M o v i n g M a x M i n ( 1 L o w T h r e s h o l d ) )
  • B u f f e r = P r e v i o u s B u f f e r
  • S t a t e = P r e v i o u s S t a t e
  • if S t a t e = 0 then
  •  
  • if I n p u t > = H i g h T r i g g e r then
  •    S t a t e = 1
       T h r e s h o l d B u f f e r = 1
  • end if
  • else if S t a t e = 1 then
  •  
  • if I n p u t > = L o w e r T r i g g e r then
  •    S t a t e = 2
  • end if
  • else if S t a t e = 2 then
  •  
  • if I n p u t < = L o w e r T r i g g e r then
  •    S t a t e = 3
       T h r e s h o l d b u f f e r = 0
  • end if
  • else
  •  
  • if I n p u t < = H i g h T r i g g e r then
  •    S t a t e = 0
  • end if
  • end if
     
  • return T h r e s h o l d b u f f e r
The lead in pulse generated a synchronisation pulse and set a timeout counter. This function also prevented ambient lighting effects triggering the system from sampling the data too early in the receiver. Following this subsystem block, the synchronisation pulse was used to set respective sample times to sample the thresholded waveform in which each element of data resided, as shown in Section 5.1. This process produced a sequence of serialised bits, which, at the end of the sequence, were then concatenated into the four bytes. Start and stop bits were used to ensure the sequence was valid but were later discarded.
At this stage in the project, the received data were inspected and compared within the Matlab environment, to generate the statistics presented in Section 4.2. In future implementations, the code generated from the receiver model will operate on a microcontroller without any interaction with Simulink and the data received will be outputted from the microcontroller using a ROS message. A key factor in the development of the demodulation model design was time keeping, as the OOK modulation technique relies on sampling the received waveform at specific intervals; if the signalling periods used to key in the data or lead in pulse are subject to timing drift of more than half of a data pulse period, the received signal will become erroneous. This was a significant factor to consider in using a simple OOK implementation.

4. Experimentation

4.1. Experiment 1

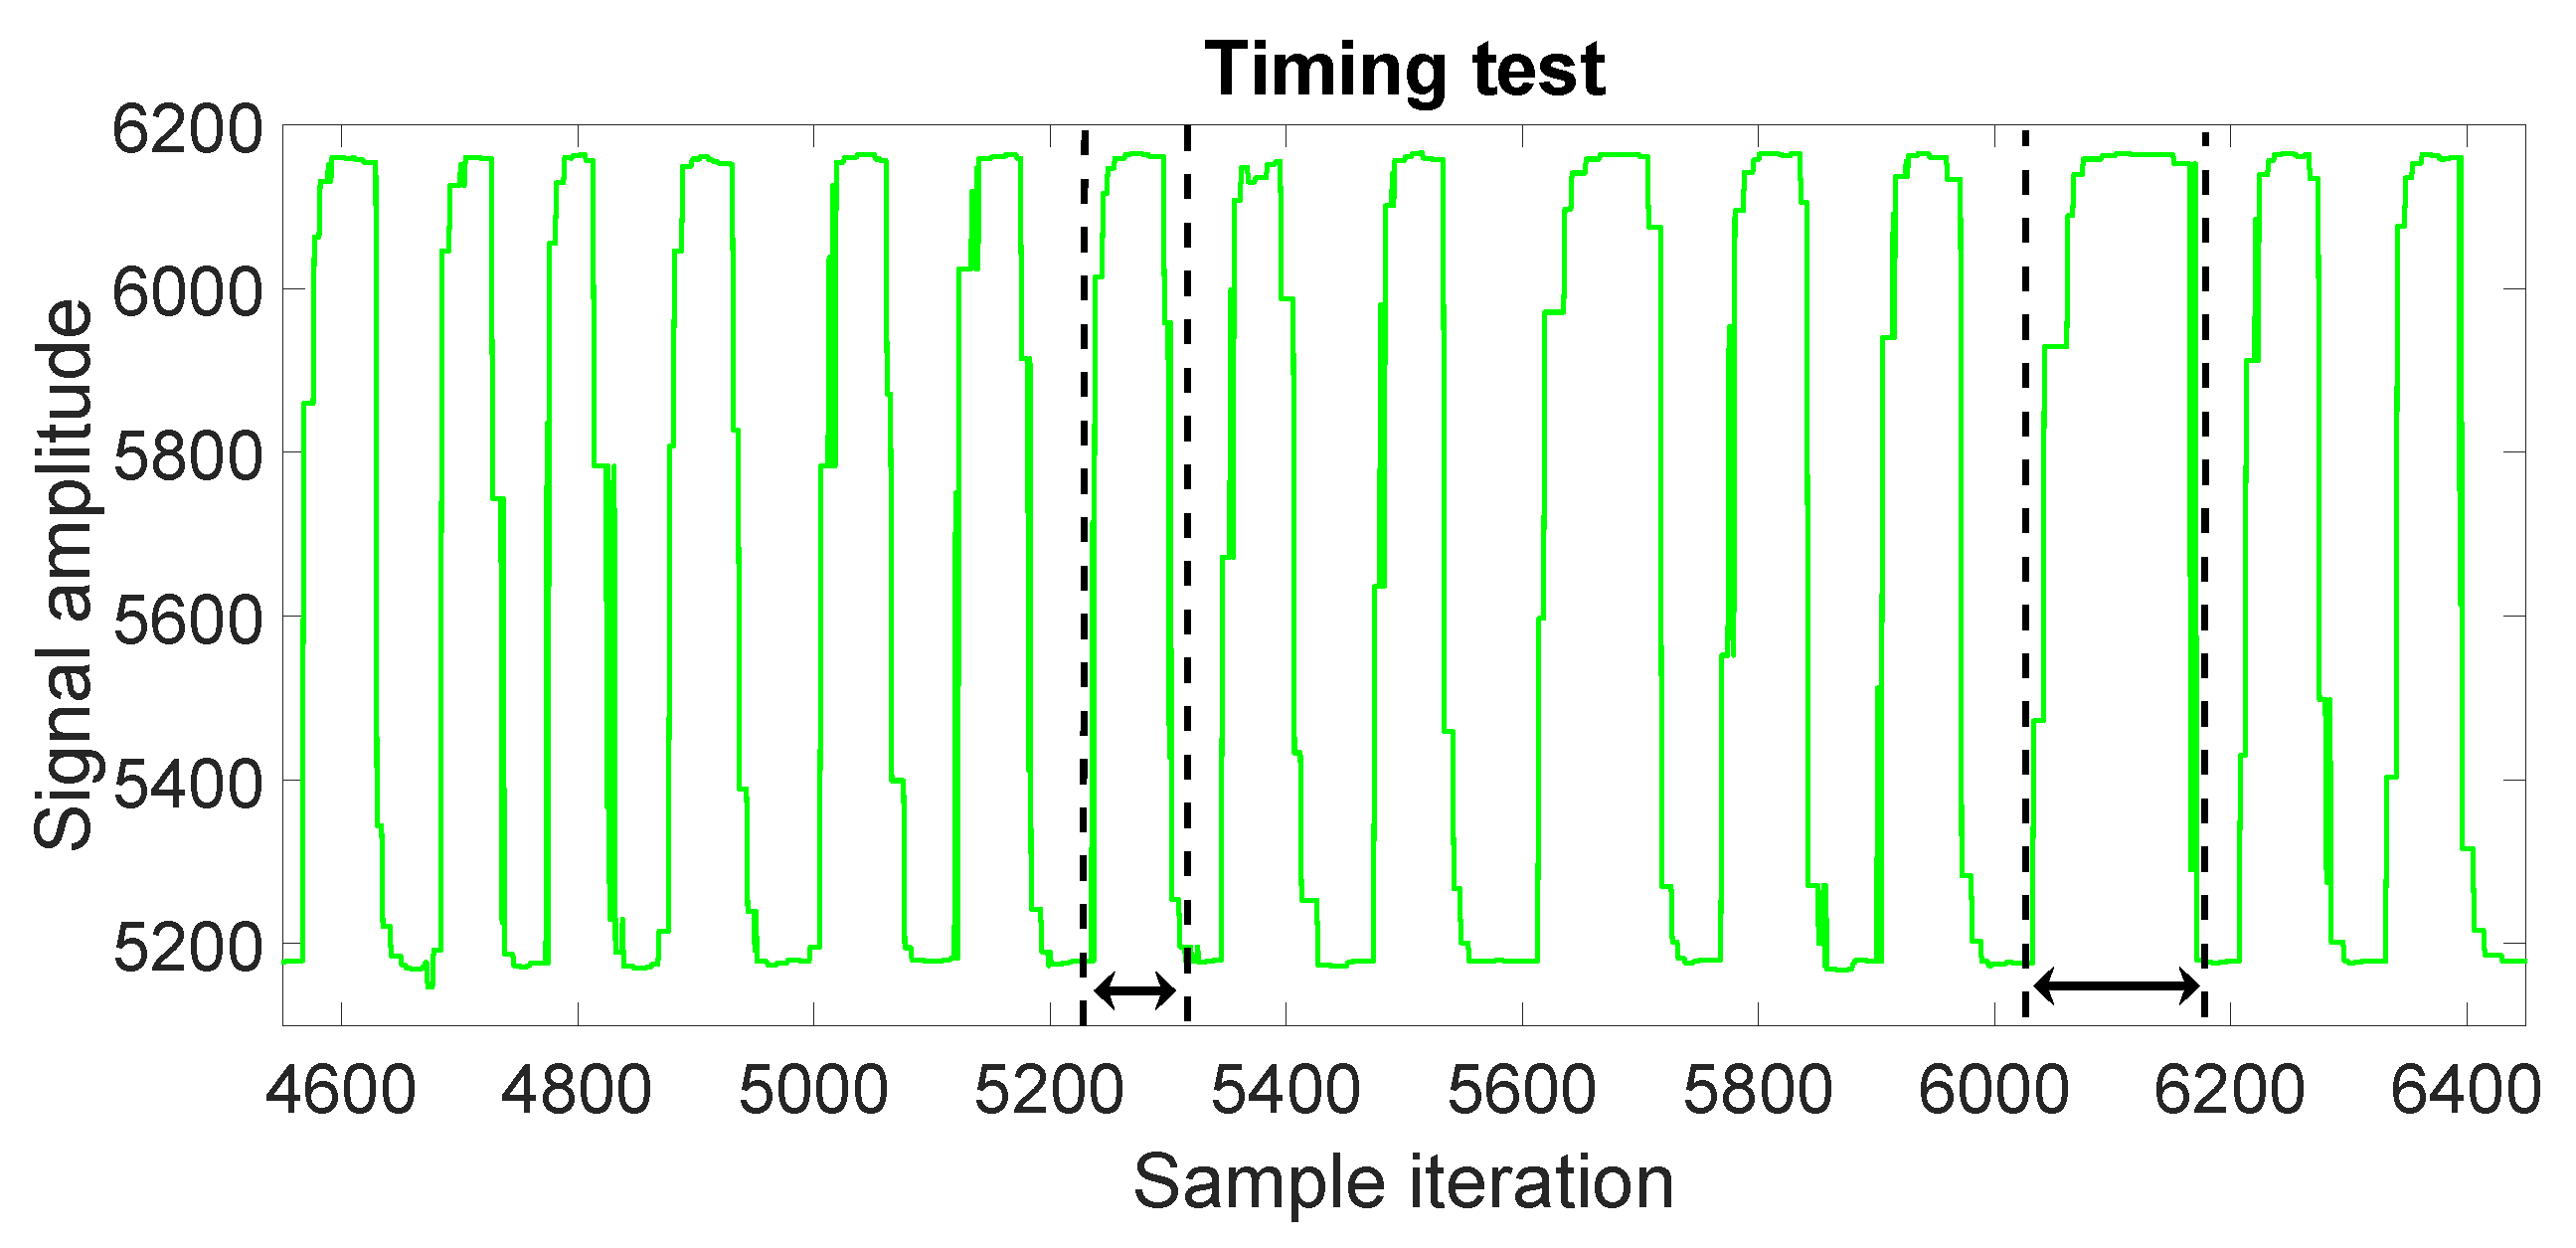
Early on in the development it was found that the signals received were nothing like those expected, with some very notable variations in signal duty cycle lengths. To further investigate this, the transmitter was temporarily reprogrammed to produce a periodic pulse to determine if the timing at the receiver was an issue; the received signal is plotted in Section 5.1.
It shows that the periodic signal transmitted had an inconsistent duty cycle when received. It was determined to be due to Simulink adding a time stamp to data samples on arrival with respect to the host computers local clock, rather than using time from the ROS message supplied by the microcontroller, due to the ROS messages being sent through the network and, as the network latency was variable, the received waveform became unusable. This was overcome by saving the received data to the Matlab workspace and then replacing the time signal in the structure with the ROS header time that was assigned to the message by the receiving microcontroller.
Once resolved, a primary experiment in a controlled laboratory environment was conducted to gather some initial data. This was undertaken from a distance of 1 m and at an angle of incidence of approximately 0° from the horizontal. The resulting waveforms can be seen in Figure 6. The data collected were used to design the receiver and ensure its functionality before gathering large amounts of data in Experiment 2.

4.2. Experiment 2

The purpose of the following experiment was to produce a best case set of results that form a benchmark for subsequent future experiments. In-air testing was used to minimise the spectral scatterance Φ s ( λ ) and absorptance Φ a ( λ ) . The transmitter was mounted on a stand with a heat sink mounted on the back to dissipate the heat from the LED. The receiver, mounted next to the AUV’s forward facing camera at the same elevation, was placed facing the transmitter. Both height and yaw angle, from the horizontal between the transmitter and receiver, were checked using a laser line guide to ensure optimisation of optical signal strength. Figure 7 shows the experiment setup; while sampling data, the lights were turned off and blinds closed.
Data was collected starting from a distance of 1 m and moved in increments of 1 m until 12 m was reached. For each increment, five data samples were collected, each for a duration of 10 min. At the end of each data sample collection, the receiving hardware was powered off and restarted to ensure confidence in the repeatability of the experiment. All of the received data were logged and processed sequentially in the simulation of the receiver demodulation model. The demodulated bytes of data were then compared with the corresponding known transmitted data bytes to determine a success rate, as a fraction of the number of correct data bits divided by the total number of data bits received.

5. Results and Discussion

5.1. Experiment 1

The first part of this experiment identified the issue related to timing drift in the received periodic signal explained above; it is clear in Figure 8 that there was a significant shift present in the signal’s duty cycle, as illustrated by the vertical lines.
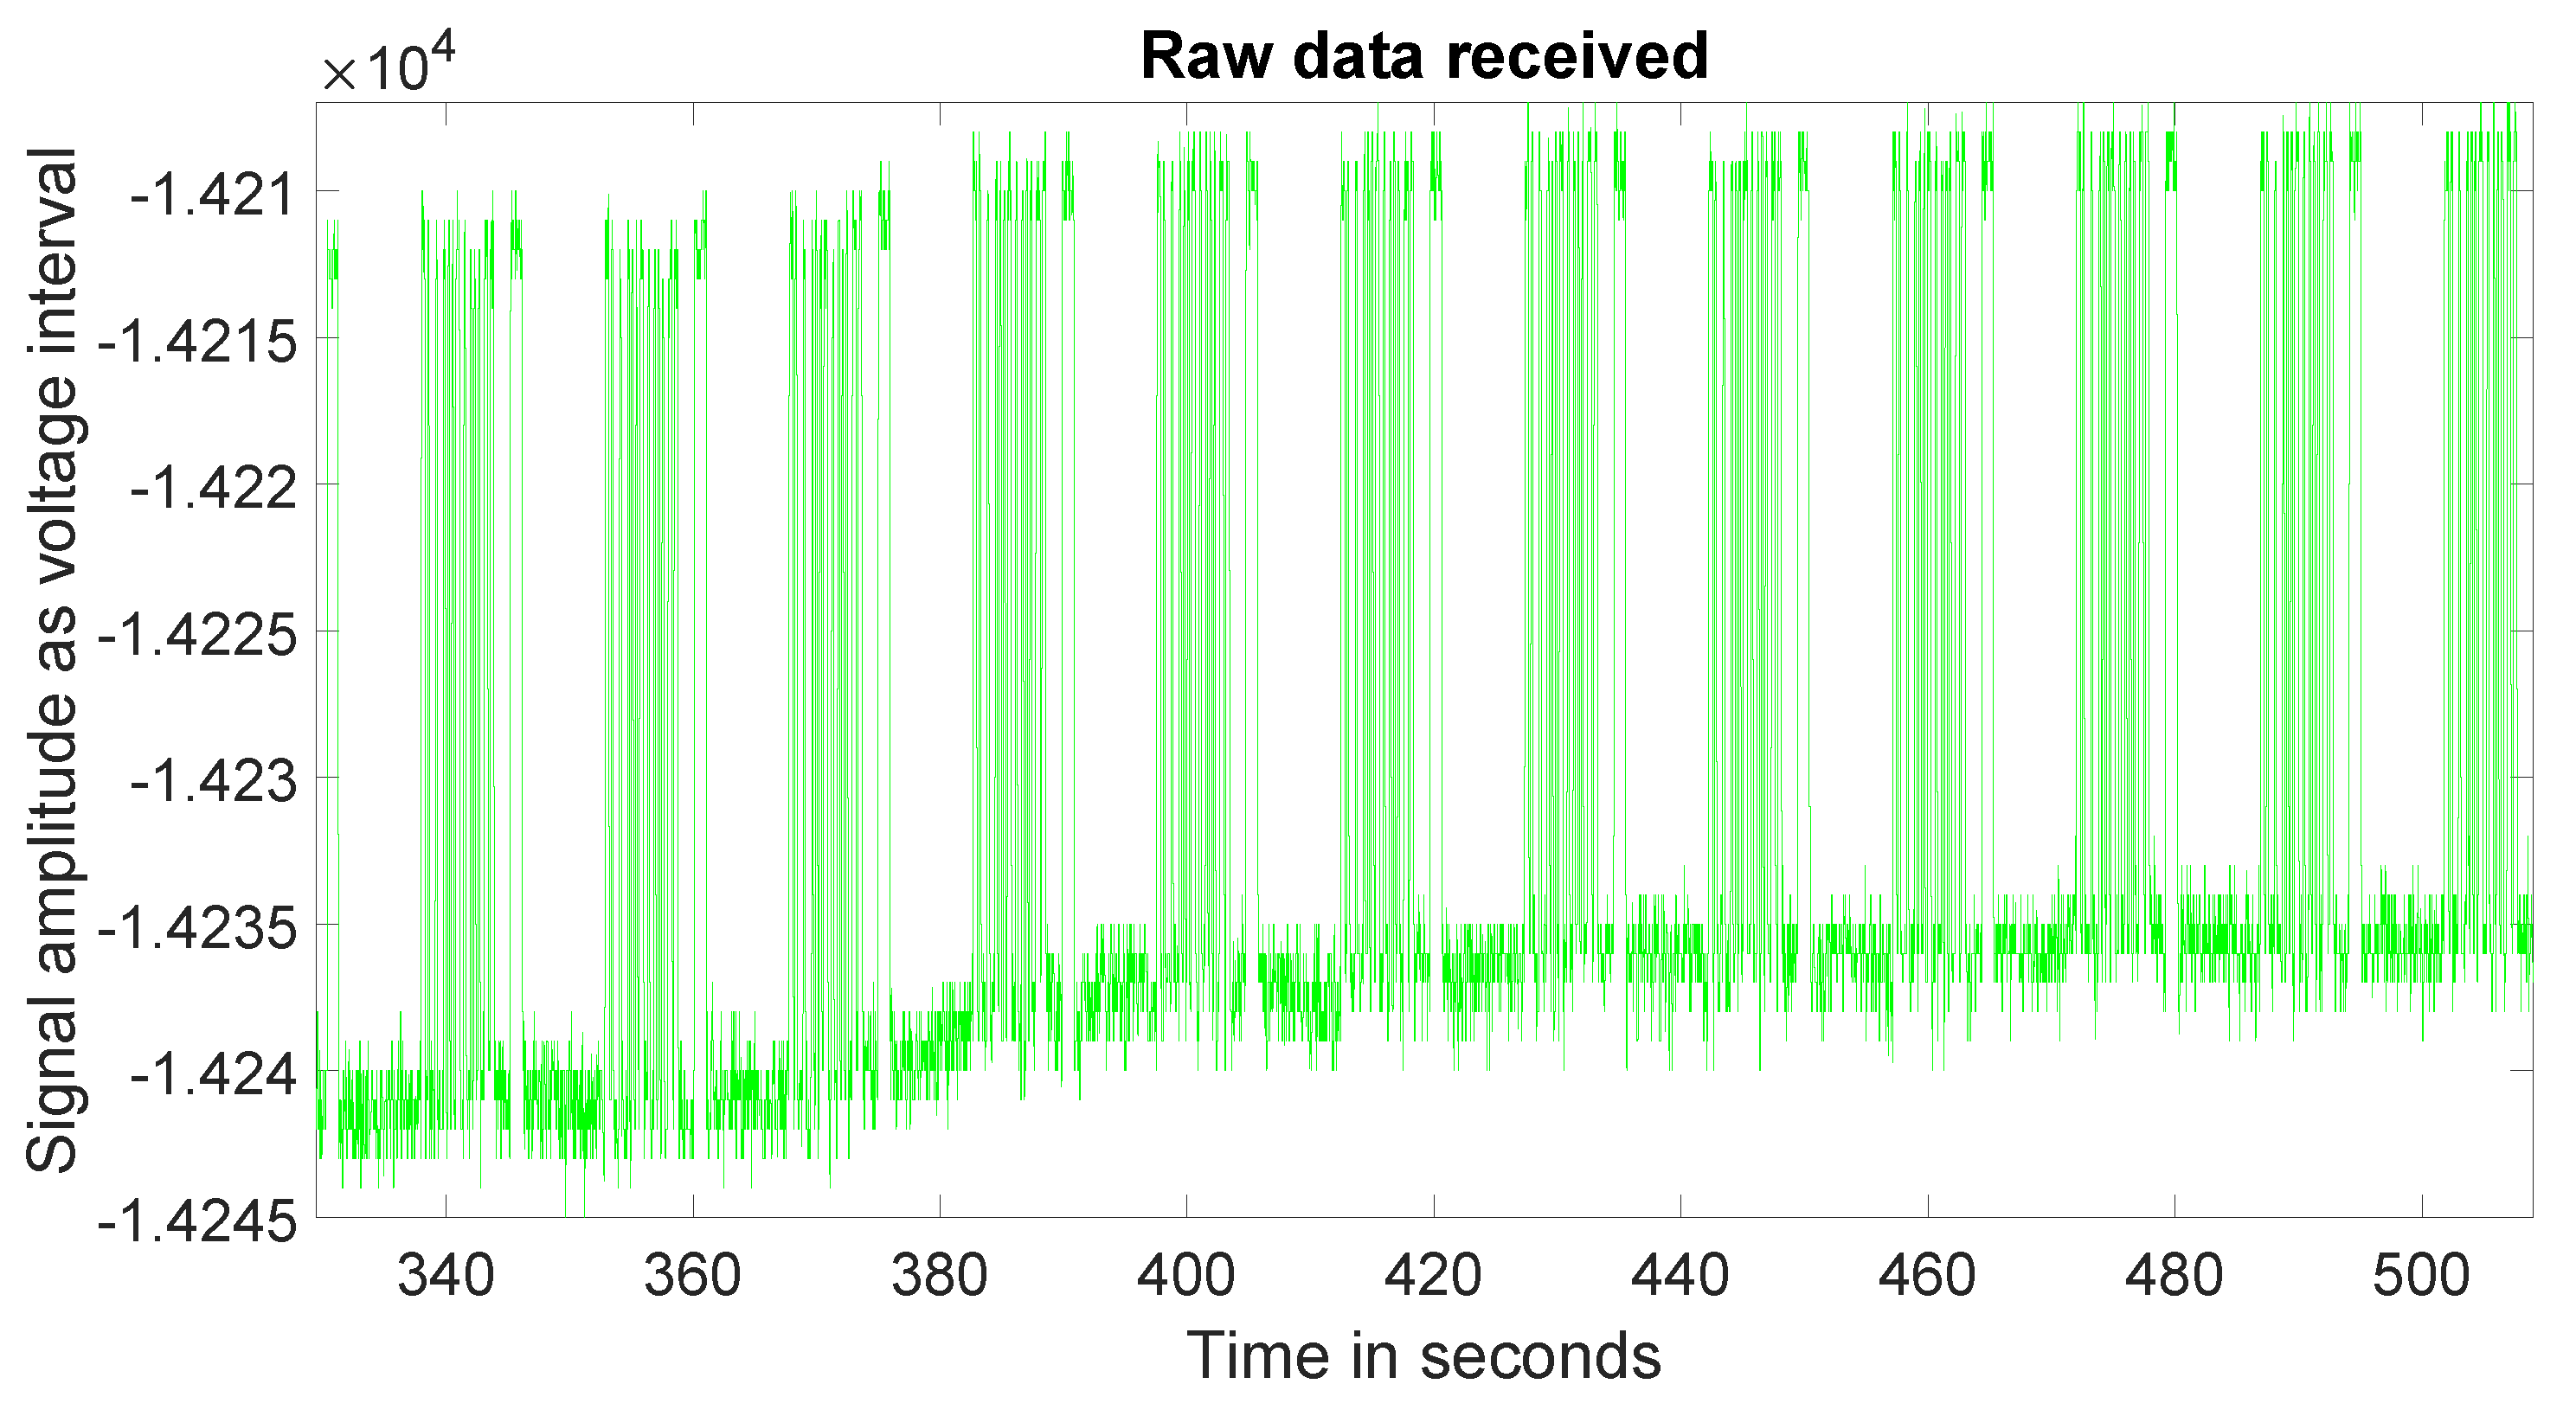
This issue was explained in the experiment description. During experimentation using the code from the transmitter model, it became clear that DC bias could have notable variation from beginning to end. This also demonstrated that the DC bias was subject to environmental conditions, largely due to solar irradiance, which is visible in Figure 9.
The effect ceased when Experiment 1 was isolated in a room without natural light; at this stage in the project, the objective was to establish a set of results to form a benchmark for future comparisons. Thus, it was decided to conduct the rest of the experimentation in isolation from these effects. Figure 10 shows the moving maximum and minimum values applied to the raw signal, as described in Section 3. The operation required substantially fewer resources than the windowed moving maximum and minimum functionality native to Simulink utilised, in terms of both memory required to store previous elements within the window and the processing required to interrogate each element. It was noted that, while there were DC and some transient effects present due to ambient light, the moving maximum and minimum functionality performed well at coping with this variability.
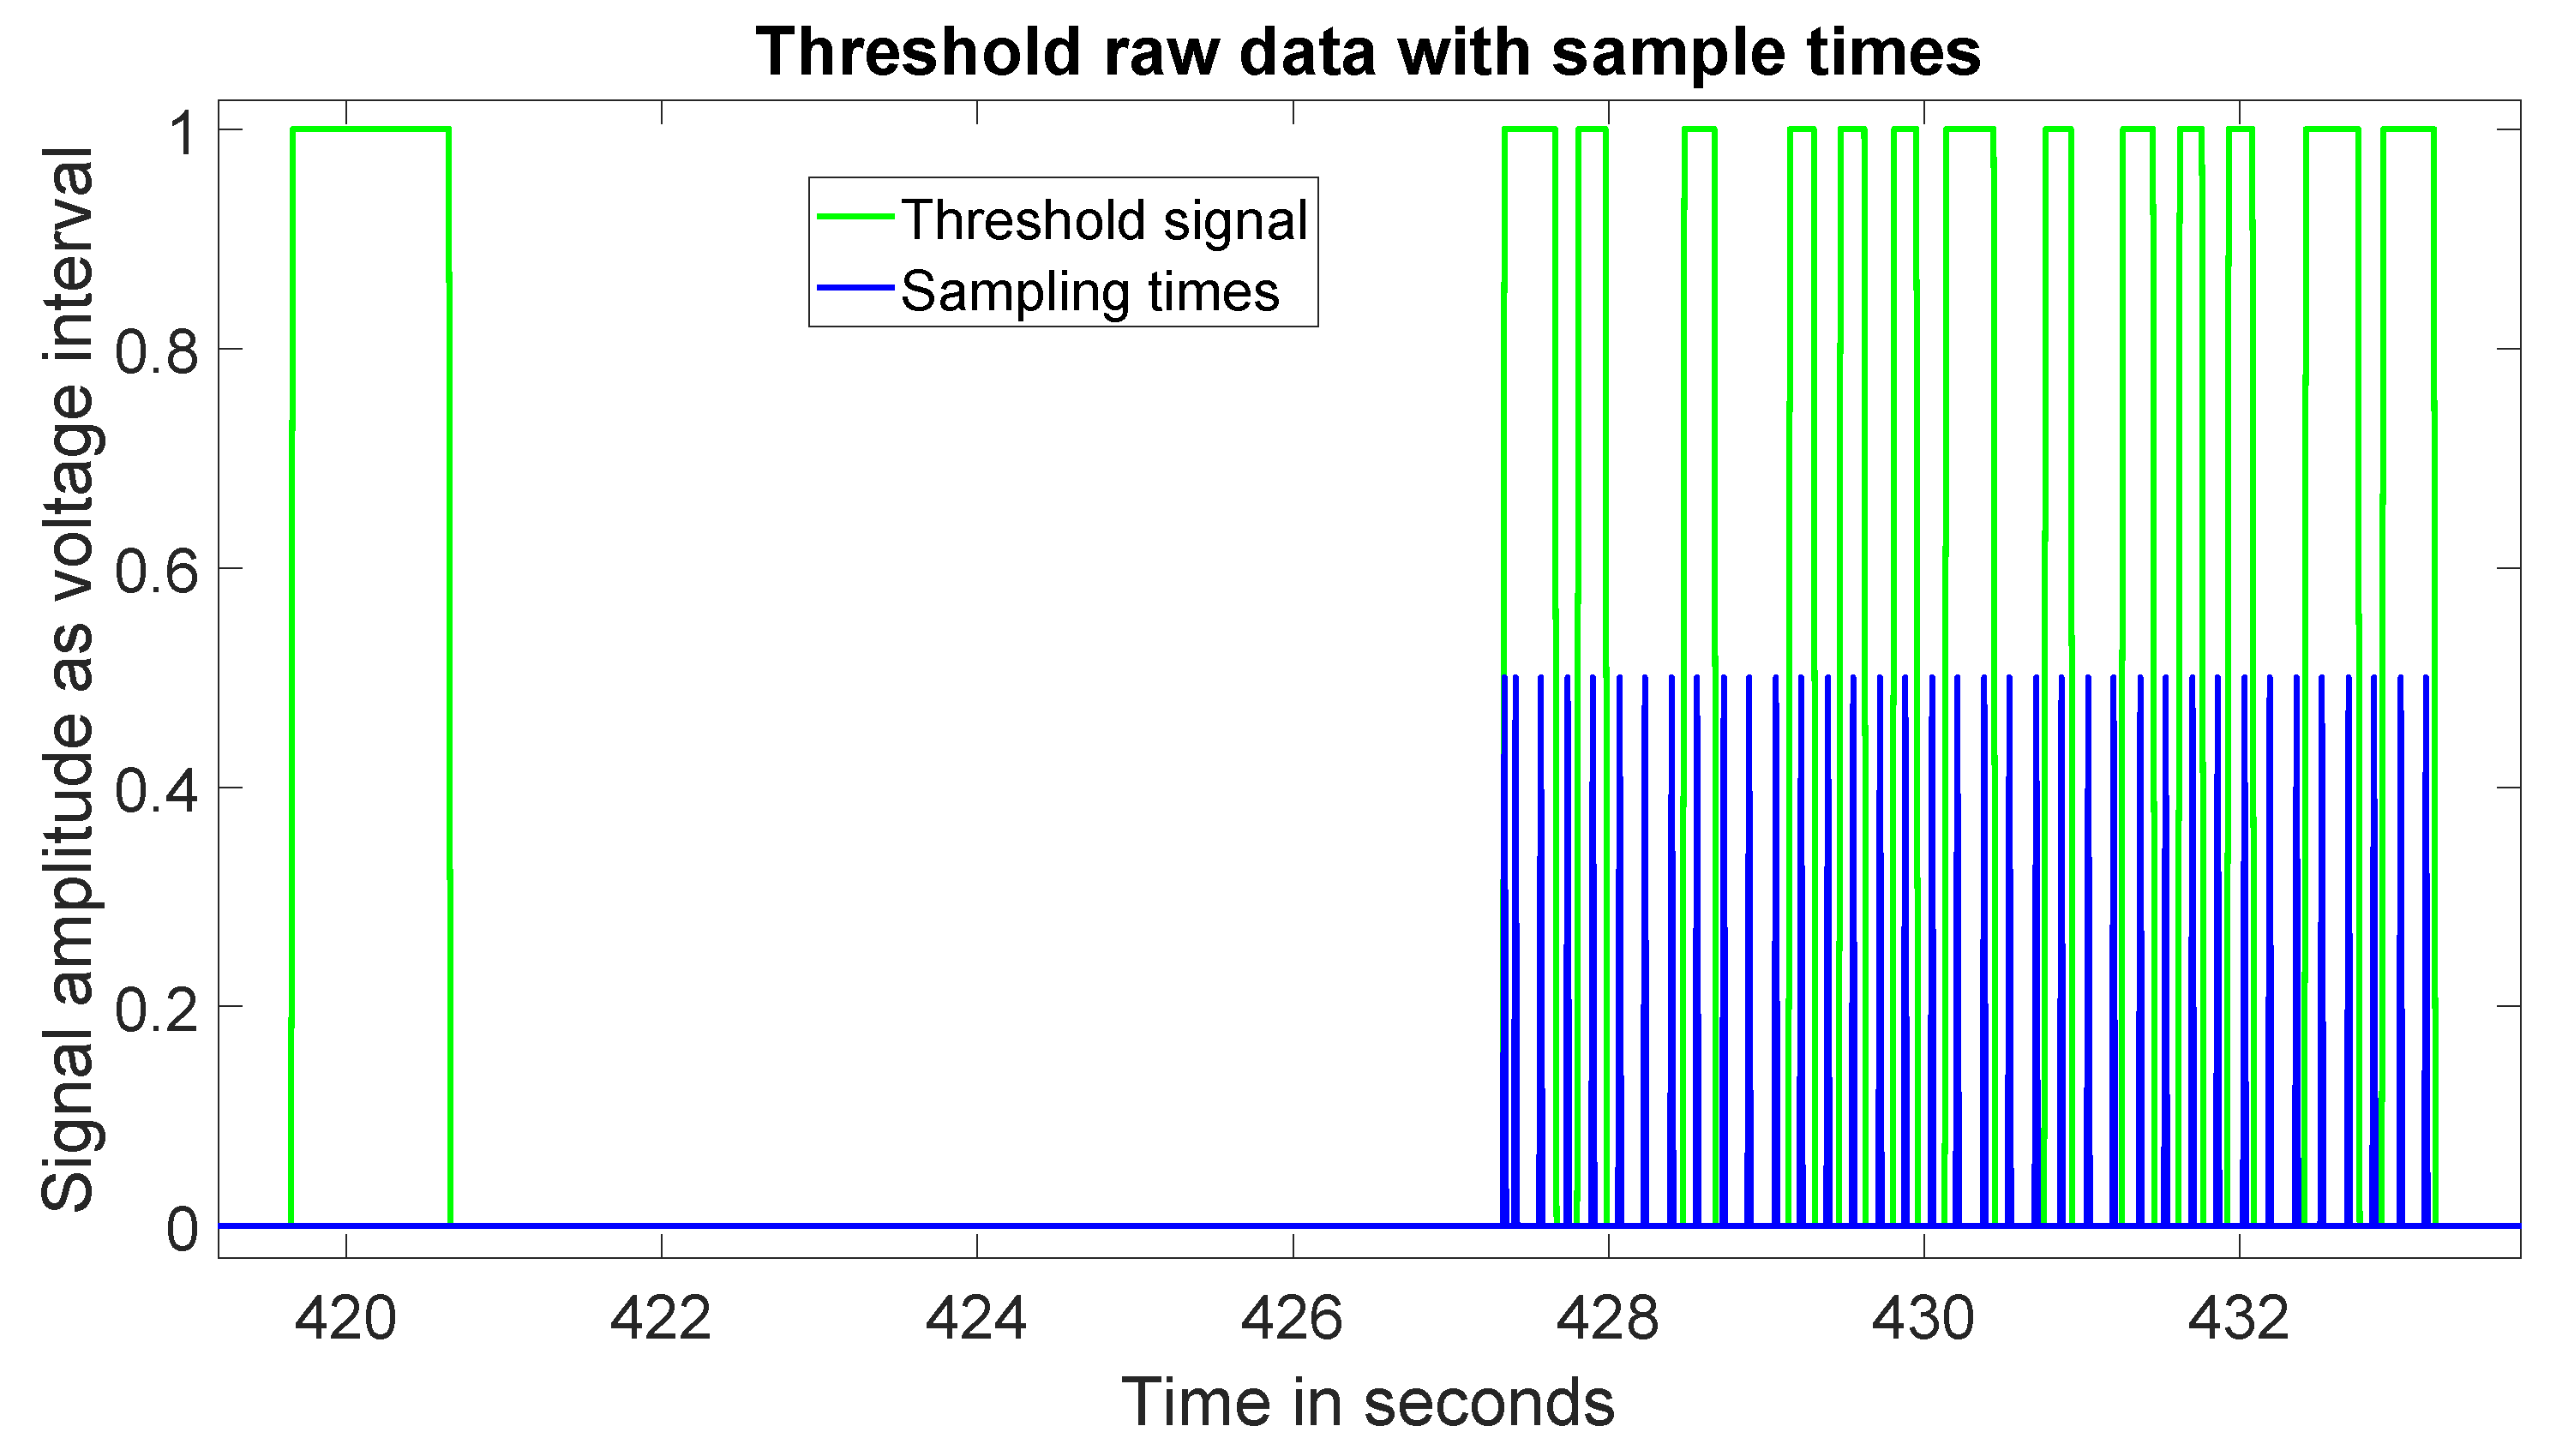
Once the moving maximum and minimum had been established, the thresholding function described in Algorithm 1 produced the filtered signal that could then be used to sample the data bits in the next step; a sample of this is shown in Figure 11. As described above, the lead in pulse was used to determine the sample times to extract the bits of data. Figure 11 illustrates the sampling times applied to the thresholded signal. Once sampled, the bits were concatenated into bytes for inspection. This experiment successfully demonstrated the system’s principle of operation, which preceded the next phase of testing.

5.2. Experiment 2

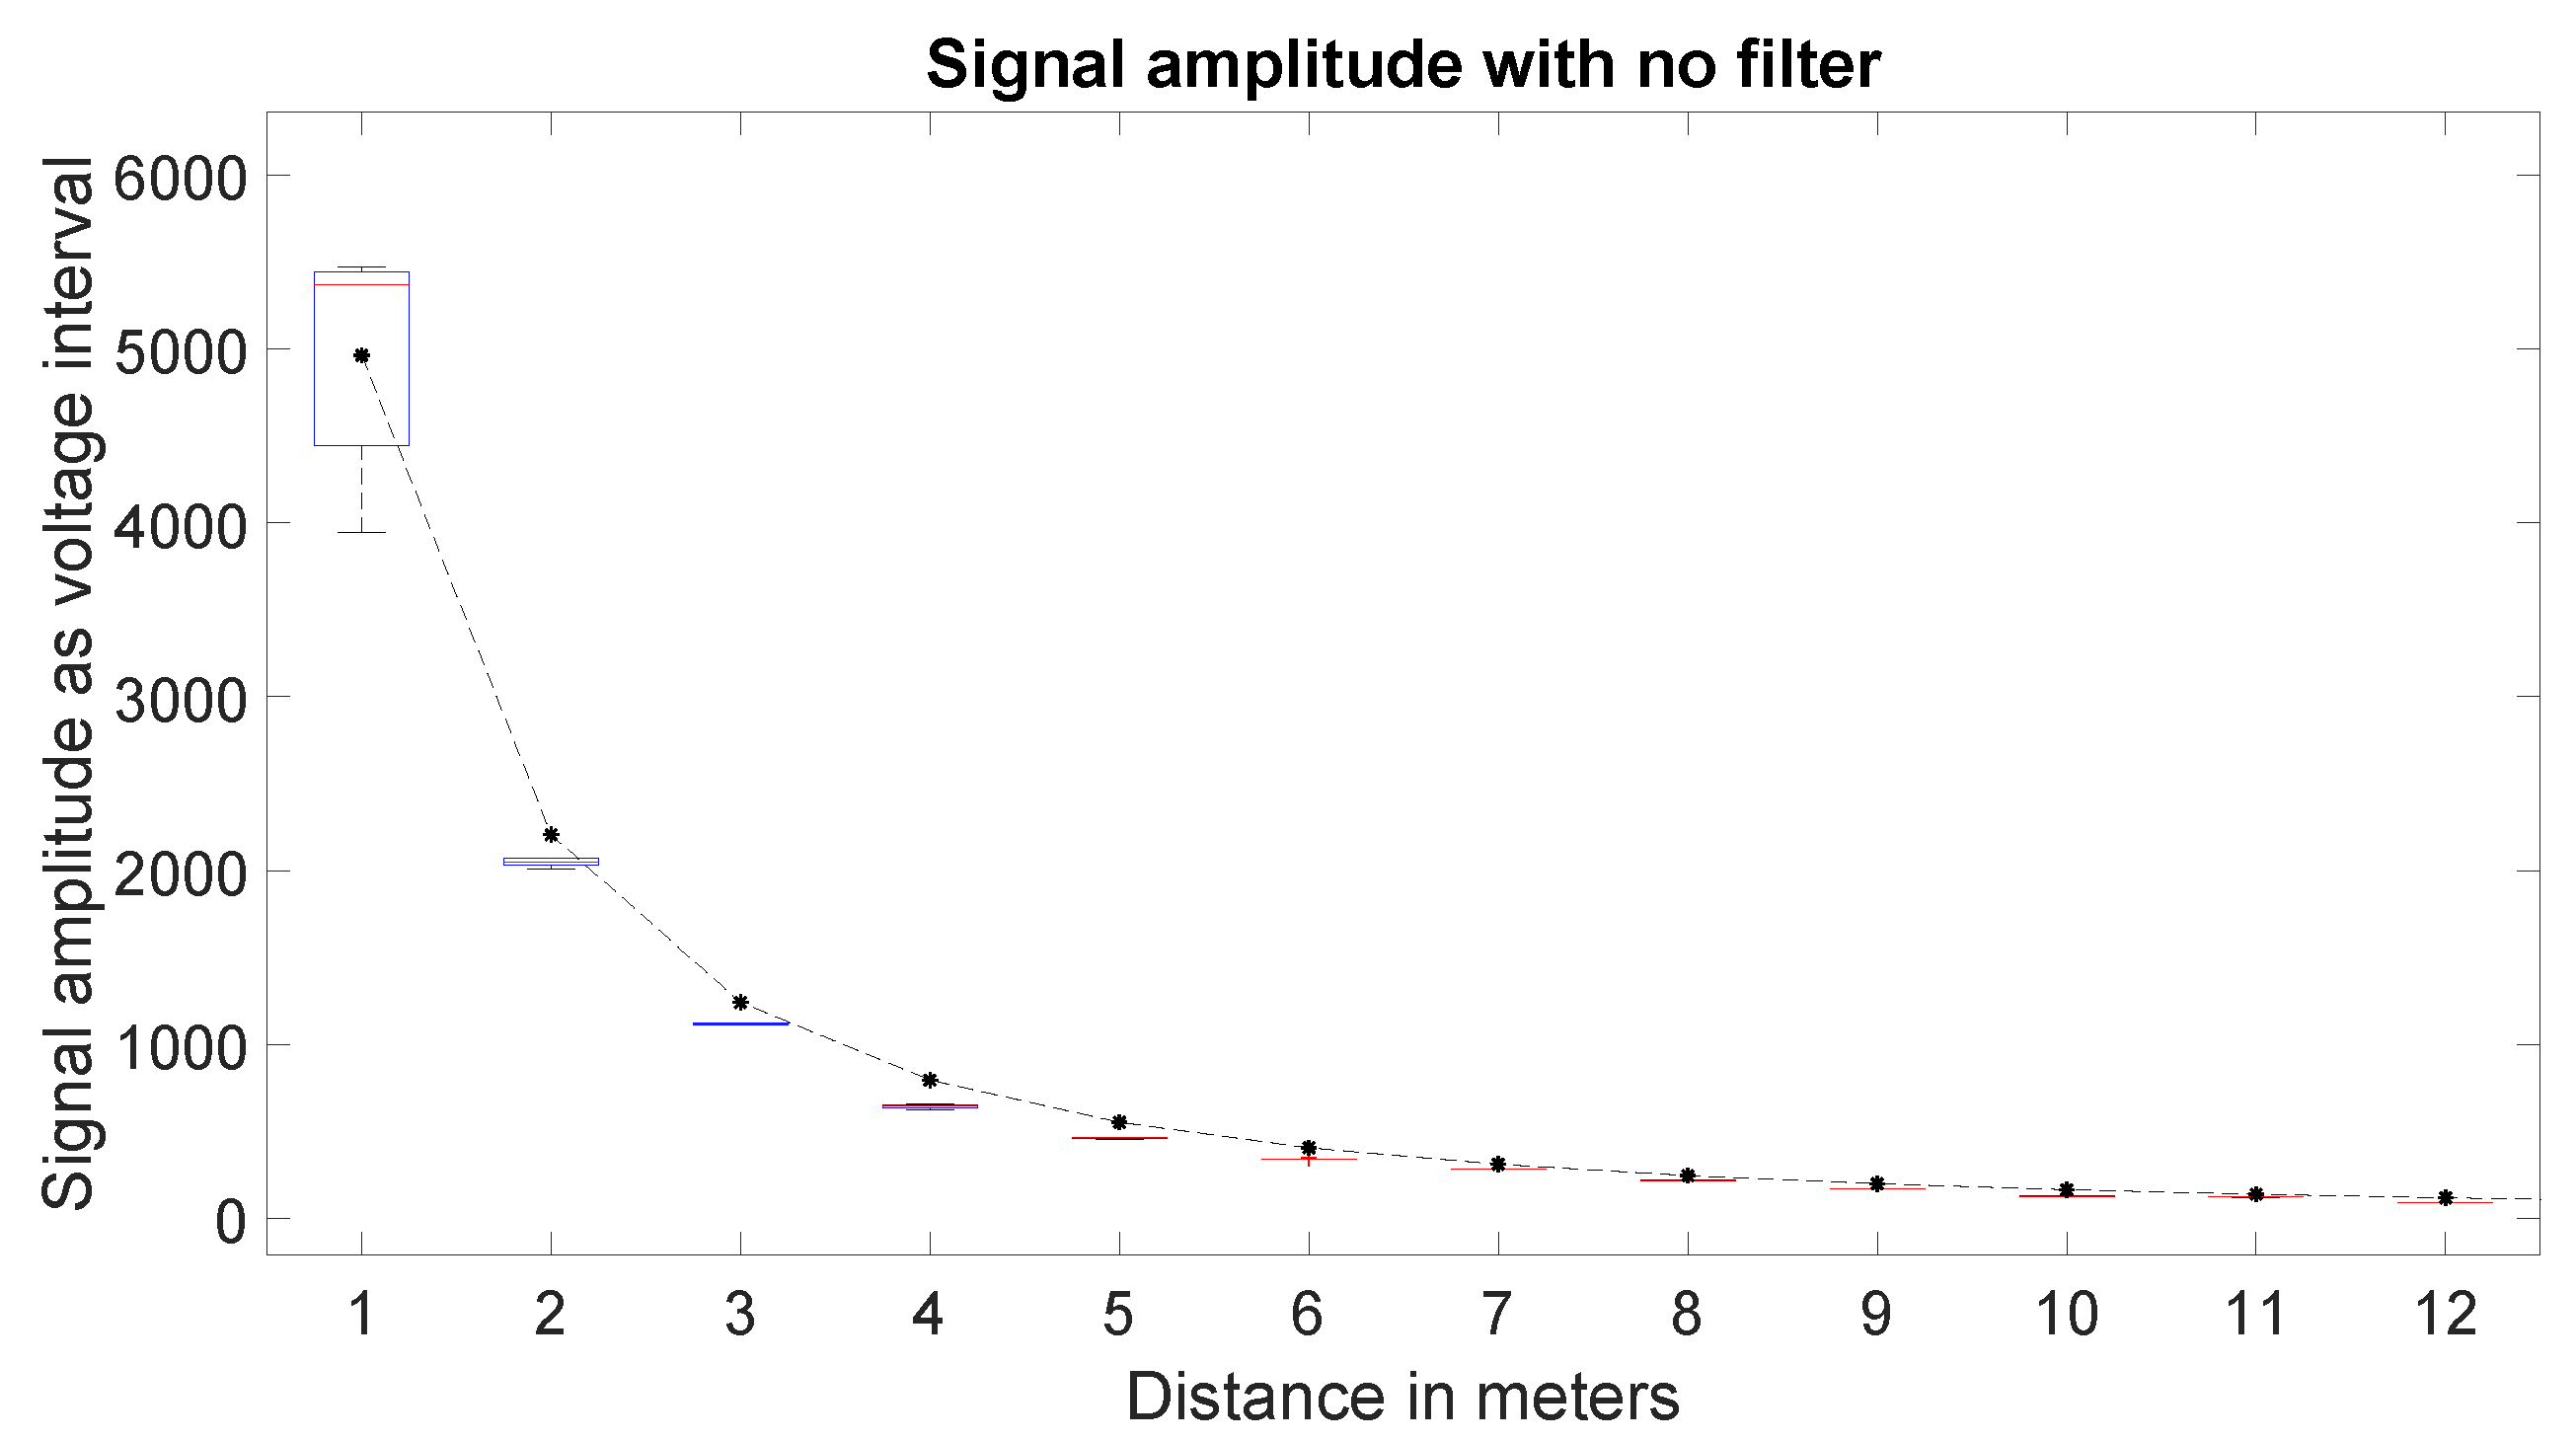
Firstly, the attenuation of the signal’s minimum and maximum values were plotted to ensure their decaying characteristic was consistent with an inverse square. Figure 12 and Figure 13 show the decay of the signal with the green filter and with no filter, respectively. It is notable from the signal featuring the green filter in Figure 12 that its amplitude was significantly smaller than that of the signal with no filter at the same distances, which is expected and is a key limiting factor in terms of transmission distance, as the green filter increases the spectral absorptance Φ a ( λ ) along the path. Figure 14 shows the transmission success rate when using the green filter and no filter, respectively.
A number of factors influenced the decay rate of the signals displayed in Figure 12 and Figure 13. As the experimentation was conducted in air, the effects of absorbance and scattering due to suspended particles was anticipated to be low. However the intensity decrease of light through the air was subject to the inverse square law (Equation (8)). Both plots in Figure 12 and Figure 13 feature a dotted line which is an estimate of the signal decay with respect to distance. It can be seen in both graphs that the signal amplitude is lower than the estimate the line depicts, which indicates that the estimated effect accounts for a significantly large proportion of the decay in the signal received and is considered the most dominant factor.
In both cases, the fidelity of the received signal was significantly high with the lowest success rate at 0.9815. Some notable differences in performance are visible in Figure 14. At a distance of 1 m, the distribution in the success rate widens in the unfiltered results compared to the green, indicating slightly better performance up close with the those using the green filter. At 12 m, the results without a filter clearly outperform the ones using the green filter, which was to be expected, as the filter increases the spectral absorptance Φ a ( λ ) .
The results gathered using no filter outperformed the ones with the green filter in terms of success rate, which is unsurprising as its signal amplitude with respect to distance is significantly higher due to the absence of a spectral filter. As mentioned above, one of the overarching reasons for using this design approach was that it allowed for instances in which errors occurred to be analysed in detail during simulation. It was found that the sources of error in this experiment tended to relate to random noise triggering the thresholding function. These findings and ways to mitigate them will factor into subsequent design iterations with a view to improve the systems performance.

6. Conclusions and Further Work

Figure 14 shows that the system did successfully transmit and receive data at distances of 1–12 m and with surprisingly high fidelity, given the simplicity of using OOK as a modulation technique. The increased spectral absorptance Φ a ( λ ) due to the green filter was also responsible for a considerable difference in the amplitudes between the results seen in Figure 12 and Figure 13, with the expected exponential decay with respect to distance present.
In comparison between the filtered and unfiltered sets of results, those using the green filter clearly under performed their counterpart. Given the data were collected in controlled idealised conditions, when exposed to less than optimal conditions and transient light sources within the photo diode’s spectral response range, signal to noise ratio may become a significant issue.
As the photodiode selected responds to light sources across the whole visible optical spectrum and considering the green filter attenuates large portions of the spectral range, it is not clear if the unfiltered results would still outperform those with the green filter. Subsequently, future experiments will keep both the filtered and unfiltered photo receivers to provide further contrast. On closer inspection of the raw signal received, it was clear that the OOK technique is prone to noise due to ambient effects. Higher signal fidelity may be achieved by experimenting with different modulation techniques, such as frequency shift keying (FSK) and this will be considered in further work. The next phase of implementation and testing will take the receiver model and implement it fully on embedded hardware, as well as outputting the data and signal statistics as a ROS message, followed by in water testing for comparison with the now established benchmark results.
Further to this, the introduction of some error detection or correction codes will be added in future implementations; a simple checksum may suffice, although a forward looking error correction, such as a linear block code, may be more useful [26]. Further improving the electronics used, such as the ADC and amplifier configuration, as well as increasing the transmission rate, would likely yield a higher success rate, thus is an opportunity to further increase bandwidth and utility with longer range. Another consideration discussed by Anguita et al. is the use of simulated hardware for signal processing; to do this, the model should be modified to use only integers and fixed point integers as a numbering system throughout the model, enabling high speed hardware description language (VHDL) to be generated and FPGAs used for parallelised signal processing [27]. In the long term, using principles found in protocols such as JANUS as a base to produce a similar optical equivalent may further increase the system’s utility [12].

Author Contributions

J.G. preformed the Formal analysis, Investigation, Project administration, Visualisation, and Writing—original draft; J.G., F.B. and O.M. shared tasks such as Conceptualisation, Methodology, and Software development; Supervision was provided by O.M., F.B. and M.A.; and Writing—review and editing was done by O.M., M.A., F.B. and B.A. All authors have read and agreed to the published version of the manuscript.

Funding

All of the funding for equipment and materials used for experiments in this study have been kindly provided by the Faculty of Engineering and Technology at Liverpool John Moores University.

Conflicts of Interest

The authors declare no conflict of interest. The funders had no role in the design of the study; in the collection, analyses, or interpretation of data; in the writing of the manuscript, or in the decision to publish the results.

References

  1. Wynn, R.B.; Huvenne, V.A.I.; Le Bas, T.P.; Murton, B.J.; Connelly, D.P.; Bett, B.J.; Ruhl, H.A.; Morris, K.J.; Peakall, J.; Parsons, D.R.; et al. Autonomous Underwater Vehicles (AUVs): Their past, present and future contributions to the advancement of marine geoscience. Mar. Geol. 2014, 352, 451–468. [Google Scholar] [CrossRef] [Green Version]
  2. Saeed, N.; Celik, A.; Al-Naffouri, T.Y.; Alouini, M.S. Underwater optical wireless communications, networking, and localization: A survey. Ad Hoc Netw. 2019, 94, 101935. [Google Scholar] [CrossRef] [Green Version]
  3. Kaushal, H.; Kaddoum, G. Underwater Optical Wireless Communication. IEEE Access 2016, 4, 1518–1547. [Google Scholar] [CrossRef]
  4. Vallicrosa, G.; Bosch, J.; Palomeras, N.; Ridao, P.; Carreras, M.; Gracias, N. Autonomous homing and docking for AUVs using Range-Only Localization and Light Beacons. IFAC-PapersOnLine 2016, 49, 54–60. [Google Scholar] [CrossRef]
  5. Li, D.J.; Chen, Y.H.; Shi, J.G.; Yang, C.J. Autonomous underwater vehicle docking system for cabled ocean observatory network. Ocean Eng. 2015, 109, 127–134. [Google Scholar] [CrossRef]
  6. McEwen, R.; Hobson, B.; McBride, L.; Bellingham, J. Docking Control System for a 54-cm-Diameter (21-in) AUV. Ocean. Eng. IEEE J. 2008, 33, 550–562. [Google Scholar] [CrossRef]
  7. Lin, A.; Tong, Z.; Song, Y.; Kong, M.; Xu, J. Underwater Wireless Optical Communication System Using Blue LEDs. J. Phys. Conf. Ser. 2016, 679, 012032. [Google Scholar] [CrossRef] [Green Version]
  8. Liu, S.; Ozay, M.; Okatani, T.; Xu, H.; Sun, K.; Lin, Y. Detection and Pose Estimation for Short-Range Vision-Based Underwater Docking. IEEE Access 2019, 7, 2720–2749. [Google Scholar] [CrossRef]
  9. Bosch, J.; Gracias, N.; Ridao, P.; Istenič, K.; Romagós, D. Close-Range Tracking of Underwater Vehicles Using Light Beacons. Sensors 2016, 16, 429. [Google Scholar] [CrossRef] [PubMed]
  10. Palomeras, N.; Vallicrosa, G.; Mallios, A.; Bosch, J.; Vidal Garcia, E.; Hurtos, N.; Carreras, M.; Ridao, P. AUV homing and docking for remote operations. Ocean Eng. 2018, 154, 106–120. [Google Scholar] [CrossRef]
  11. Keller, K.M. Sonar Based Positioning and Docking for Autonomous Underwater Vehicles. Ph.D. Thesis, Department of Electrical Engineering and Electronics, The University of Liverpool, Liverpool, UK, 2002. [Google Scholar]
  12. Potter, J.; Alves, J.; Green, D.; Zappa, G.; Nissen, I.; McCoy, K. The JANUS underwater communications standard. In Proceedings of the 2014 Underwater Communications and Networking (UComms), Sestri Levante, Italy, 3–5 September 2014; pp. 1–4. [Google Scholar] [CrossRef]
  13. Abdou, A.; Shaw, A.; Mason, A.; Al-Shamma’a, A.; Cullen, J.; Wylie, S.; Diallo, M. A matched Bow-tie antenna at 433 MHz for use in underwater wireless sensor networks. J. Phys. Conf. Ser. 2013, 450, 012048. [Google Scholar] [CrossRef] [Green Version]
  14. Johnson, L.; Jasman, F.; Green, R.J.; Leeson, M. Recent advances in underwater optical wireless communications. Underw. Technol. 2014, 32, 167–175. [Google Scholar] [CrossRef]
  15. Smart, J.H. Underwater optical communications systems part 1: Variability of water optical parameters. In Proceedings of the MILCOM 2005—2005 IEEE Military Communications Conference, Atlantic City, NJ, USA, 17–20 October 2005; Volume 2, pp. 1140–1146. [Google Scholar] [CrossRef]
  16. Mobley, C. Light and Water: Radiative Transfer in Natural Waters; Academic Press Inc., 1994. [Google Scholar]
  17. Smith, R.; Baker, K. Optical properties of the clearest natural waters (200–800 nm). Appl. Opt. 1981, 20, 177–184. [Google Scholar] [CrossRef] [PubMed]
  18. Giles, J.W.; Bankman, I.N. Underwater optical communications systems. Part 2: Basic design considerations. In Proceedings of the MILCOM 2005—2005 IEEE Military Communications Conference, Atlantic City, NJ, USA, 17–20 October 2005; Volume 3, pp. 1700–1705. [Google Scholar] [CrossRef]
  19. Sticklus, J.; Adam Hoeher, P.; Röttgers, R. Optical Underwater Communication: The Potential of Using Converted Green LEDs in Coastal Waters. IEEE J. Ocean. Eng. 2018, 1–13. [Google Scholar] [CrossRef] [Green Version]
  20. Wen, D.; Cai, W.; Pan, Y. Design of underwater optical communication system. In Proceedings of the OCEANS 2016, Shanghai, China, 10–13 April 2016; pp. 1–4. [Google Scholar] [CrossRef]
  21. Farr, N.E.; Pontbriand, C.T.; Ware, J.D.; Pelletier, L.A. Non-visible light underwater optical communications. In Proceedings of the 2016 IEEE Third Underwater Communications and Networking Conference (UComms), Lerici, Italy, 30 August–1 September 2016; pp. 1–4. [Google Scholar] [CrossRef]
  22. Baiden, G.; Bissiri, Y.; Masoti, A. Paving the way for a future underwater omni-directional wireless optical communication systems. Ocean Eng. 2009, 36, 633–640. [Google Scholar] [CrossRef]
  23. De León, J.C.B.; Restrepo-Martínez, A.; Branch-Bedoya, J.W. Computational analysis of Bayer colour filter arrays and demosaicking algorithms in digital photoelasticity. Opt. Lasers Eng. 2019, 122, 195–208. [Google Scholar] [CrossRef]
  24. Quigley, M.; Conley, K.; Gerkey, B.; Faust, J.; Foote, T.; Leibs, J.; Wheeler, R.; Ng, A.Y. ROS: An open-source Robot Operating System. In Proceedings of the ICRA Workshop on Open Source Software, Kobe, Japan, 12–17 May 2009; Volume 3, p. 5. [Google Scholar]
  25. DeMarco, K.; West, M.E.; Collins, T.R. An implementation of ROS on the Yellowfin autonomous underwater vehicle (AUV). In Proceedings of the OCEANS’11 MTS/IEEE KONA, Waikoloa, HI, USA, 19–22 September 2011; pp. 1–7. [Google Scholar] [CrossRef]
  26. Hatamian, M.; Barati, H.; Berenjian, S.; Naghizadeh, A.; Razeghi, B. Error control coding in optical fiber communication systems: An overview. ACSIJ Adv. Comput. Sci. Int. J. 2015, 4. Available online: http://www.acsij.org/acsij/article/view/117 (accessed on 5 February 2020).
  27. Anguita, D.; Brizzolara, D.; Parodi, G. VHDL modules and circuits for Underwater optical wireless communication systems. Wseas Trans. Commun. 2010, 9, 525–552. Available online: https://www.researchgate.net/publication/228650154 (accessed on 18 January 2020).
Figure 1. Model of optical transmittance.
Electronics 09 00655 g001
Figure 2. Illustration of transmitter receiver hardware.
Electronics 09 00655 g002
Figure 3. Transmitter receiver functional diagram.
Electronics 09 00655 g003
Figure 4. Software development workflow diagram.
Electronics 09 00655 g004
Figure 5. Simulated transmitter signal.
Electronics 09 00655 g005
Figure 6. Sample of filtered and unfiltered signal received during Experiment 1.
Electronics 09 00655 g006
Figure 7. Experiment 2 setup.
Electronics 09 00655 g007
Figure 8. Illustration of variable timing drift experienced during sampling process.
Electronics 09 00655 g008
Figure 9. Sample of received signal during showing multiple data packets.
Electronics 09 00655 g009
Figure 10. Sample of data packet featuring the moving maximum and minimum signals.
Electronics 09 00655 g010
Figure 11. Sampled data packet post thresholding, featuring sample times for individual bits.
Electronics 09 00655 g011
Figure 12. Box plot of attenuation of the signal with respect to distance using the green filter.
Electronics 09 00655 g012
Figure 13. Box plot of attenuation of the signal with respect to distance using no filter.
Electronics 09 00655 g013
Figure 14. Box plot of success rate as unit value.
Electronics 09 00655 g014