Article

Performance Analysis of a Clustering Model for QoS-Aware Service Recommendation

1
Jiangsu Key Laboratory of Broadband Wireless Communication and Internet of Things, Nanjing University of Posts and Telecommunications, Nanjing 210003, China
2
School of Internet of Things, Nanjing University of Posts and Telecommunications, Nanjing 210003, China
*
Authors to whom correspondence should be addressed.
Electronics 2020, 9(5), 740; https://doi.org/10.3390/electronics9050740
Submission received: 1 March 2020 / Revised: 23 April 2020 / Accepted: 23 April 2020 / Published: 30 April 2020
(This article belongs to the Section Computer Science & Engineering)

Abstract

:
The numbers of web services are growing rapidly in recent years. One of the most challenging issues in service computing is the personalized recommendation of Web services. Most of the current research recommends services based on Quality of Service (QoS)-aware data with few considerations of service-side factors, such as service functions. In this paper, a new QoS-aware Web service recommendation model based on user and service clustering (RMUSC) is proposed to gain an advance in recommended accuracy. Firstly, similar users are clustered together by a Top-N similarity algorithm through the user QoS records. Secondly, a K-means++ based filtering service cluster is established. Finally, a user and services collaborative scheme is exploited and obtains potential user QoS preferences to generate recommendations. The experimental results show that when the density of the service invocation matrix is 5%, 10% and 20%. the average absolute error (MAE) and root mean square error (RMSE) of RMUSC are lower than those of other methods.

1. Introduction

Powered by the advanced technology of Internet, web services with various functions improve the lives of common people [1,2]. However, it is difficult for users to select appropriate web services themselves, as a result of a shortage of professional knowledge and numerous web services. Therefore, how to efficiently and accurately recommend services based on user preference has become a challenging issue for both industry and academia [3,4,5].
The basic assumptions of the web service recommendation method are [6]: (1) Users prefer a service and its similar services; (2) Users prefer services that are used by other users with similar backgrounds and preferences; (3) Users prefer a service with certain characteristics as well as other services with similar characteristics. At present, the web service recommendation methods mainly include recommendation based on IF/THEN rules [7], content recommendation [8], collaborative filtering recommendation [9] and mixed recommendation [10]. Figure 1 shows the general structure of web service recommendation. The web service recommendation is widely used in office automatic (OA), internet of vehicles, and tourism services. The service recommendation management platform is utilized for web service customization and publishing. Business, vehicle and tourist scenes are the main applications of the service recommendation.
The collaborative filtering recommendation (CFR) is a mainstream recommendation method [11,12]. Compared with other recommendation approaches, CFR has two advantages—first, there is no special requirement for recommended objects, and recommendations can be generated based on complex and abstract resources. Second, only explicit or implicit user history evaluation data is needed. No prior knowledge of the user’s own attributes is required. Although the collaborative filtering recommendation has achieved many important research results, there are still many key issues to be solved, including data sparsity, cold start and scalability [13]. The data sparsity problem is that users in the current dataset have less ratings on related web services, and it is difficult to consider the influence of potential factors on users’ preferences for web services. However, each potential factor has a great impact on the accuracy of recommendation. This will greatly reduce the accuracy of web service recommendations. The advantage of CFR is that it can effectively handle complex unstructured objects without special requirements for recommendation objects [12]. However, the CFR-based service recommendation methods are significantly affected by diverse factors, such as server-side features and the sparsity of the user information matrix.
Most of web service recommendations establish a model for service recommendation based on the users’ information, history records, user preference and Quality of Service (QoS). Moreover, other factors can be considered to improve recommendation accuracy, such as geographical factors or service functional factors. However, with the sparseness of the QoS matrix, the user neighborhood and service functions’ attributes are rarely considered when improving the accuracy of web service recommendations. In order to effectively improve the recommended performance, this paper will propose a new QoS-aware Web service recommendation model based on users and services clustering (RMUSC), which will combine user and service factors to obtain higher accuracy Web service recommendations. There is currently a WSDream project on the www.github.com code hosting site that uses Planet-Lab to collect QoS datasets from 5925 web service calls from 339 users in 73 countries, and we will get data from this open source project [14,15,16,17,18]. In general, the main contributions are shown as follows.
  • We build a new services features extraction system and extract the characteristics of services based on WSDL files and perform users clustering based on the QoS of the user who invokes the service.
  • We exploit similar user clusters and services clusters by a collaborative filtering matrix factorization and obtain potential user QoS preferences to generate recommendations.
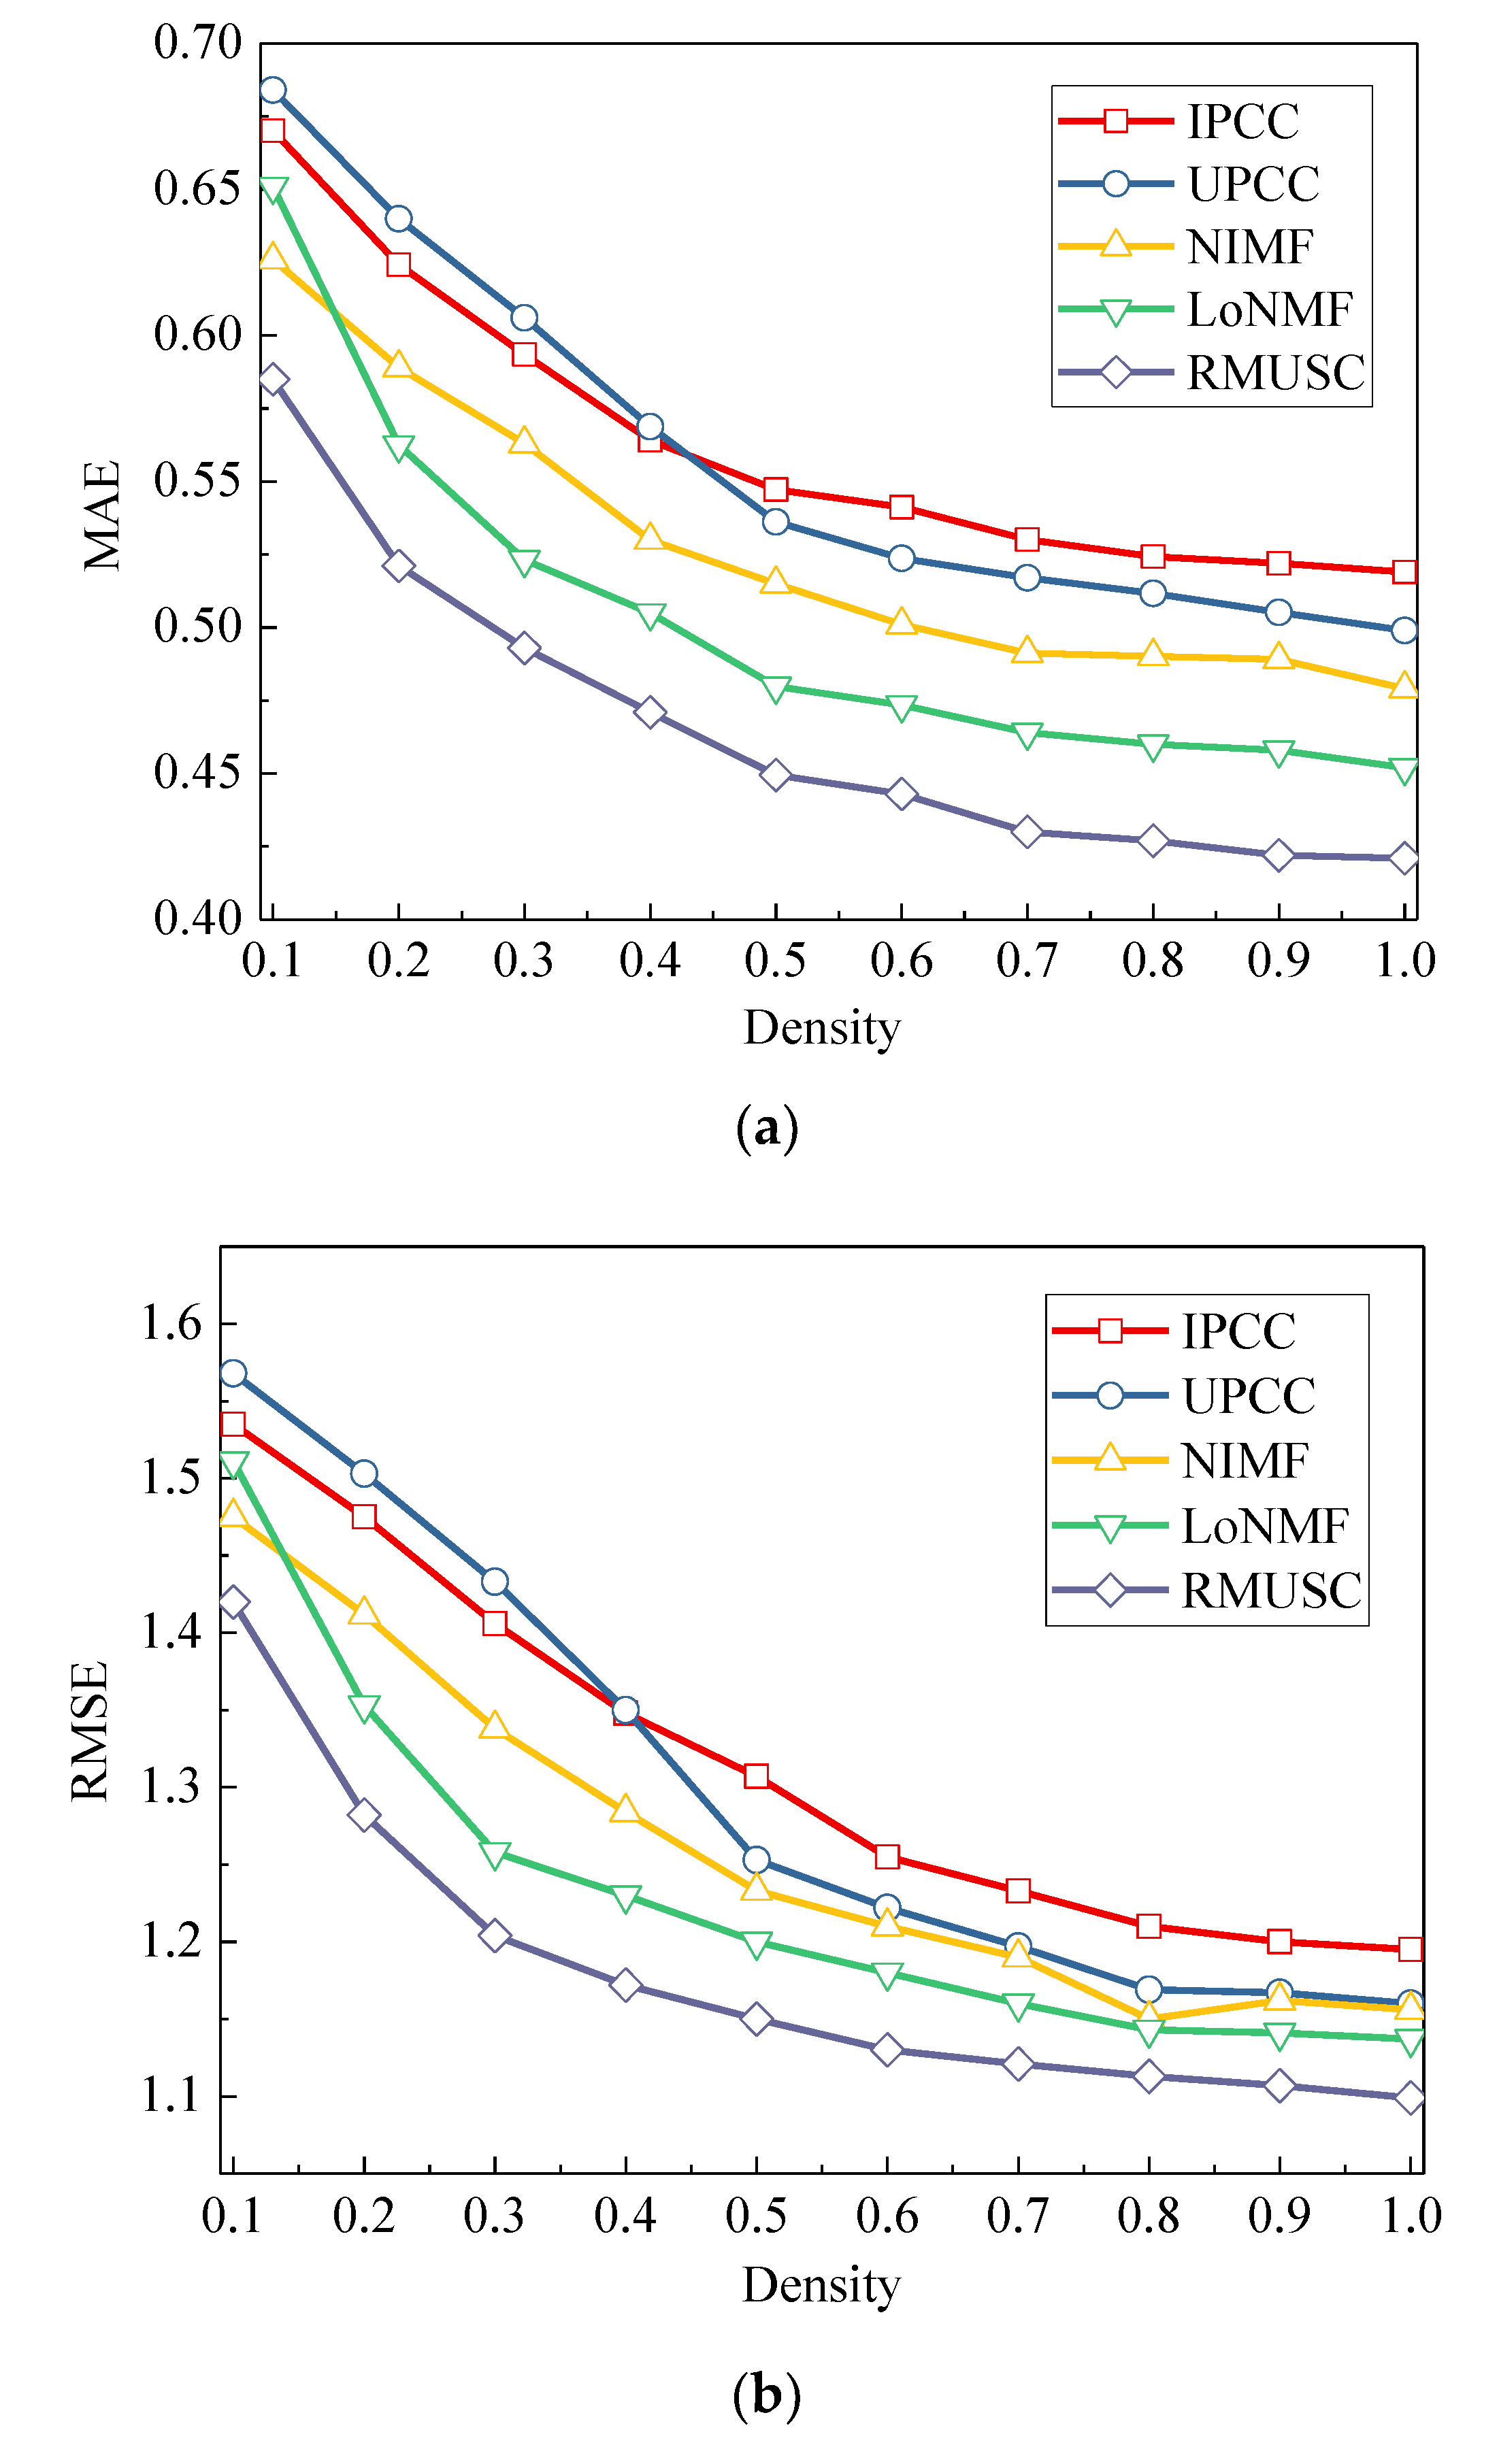
  • We develop a novel recommendation method by jointly considering the QoS of users and service clustering, whereby improving the accuracy of the recommendation. We perform the experiment based on real data sets—called WSDream—and compare with other methods on the basis of MAE and RMSE. It turns out that our approach achieves a better performance compared to other mainstream approaches.
The remainder of this paper is organized as follows: Section 2 introduces the related work about services recommendation. Section 3 depicts the principles of the RMUSC model, and combines our similar user cluster and service cluster in the recommendation model based on user and service clustering (RMUSC) to predict potential QoS values. In Section 4, experiments are performed to evaluate the approach. Section 5 concludes this paper with potential future directions.

2. Related Works

Many researchers have made many attempts to get higher accuracy and better performance of web service recommendation algorithms. Zheng Cheng [19] and others mainly introduced the factor of geography, relying on matrix decomposition to alleviate the sparsity of the prediction matrix, and fast convergence using a stochastic gradient descent algorithm, give prediction results, and improve the synergy through this scheme. The filtering algorithm has more accurate prediction results than other algorithms. Deng Ailin et al. in Reference [20] developed a collaborative filtering algorithm (IPR) based on project scoring prediction. The algorithm uses a project-based collaborative filtering method to fill the user’s scoring items and collect the scoring null values, and the similarity between users is calculated on the merged union. In order to solve the effect of neglecting the sparsity of QoS between Mashup and service and the multi-dimensional information on recommendation accuracy, Cao et al. in [21] proposed a qos-aware service recommendation for IoT Mashup applications based on relational topic model and factorization machine. Shun Li et al. [22] pointed out that in the web2.0 scenario, the WSDL file of the web service has a field describing the service function. By extracting the relevant fields, the service is classified according to the function by statistical methods, so as to solve the service recommendation result function mismatch problem.
To solve the QoS-aware ASC problem with multiple QoS criteria constraints, Wang [23] proposed an extended version of the classical graphplan and backward A* search algorithm. Pappalardo et al. [24] proposed a reputation-based model that can support the composition of complex cloud services. In order to solve the problem of traditional Web service recommendation methods dealing with a large amount of service data, Zhang [25] proposed a CA-QGS algorithm based on Spark’s quotient space granularity analysis. It takes into account both cost and QoS measures. Traditional Item-based collaborative filtering (ICF) involves privacy issues. In response to this shortcoming, Yan et al. [26] improved the traditional method and integrated position-sensitive hashing (LSH) technology. Zhang et al. [27] proposed a new framework for combining web service grouping, distance estimation, service utilization level estimation and project-to-project comparison (Pearson correlation coefficient (PCC)). Kang et al. [28] based on the preference of a user’s QoS and diversity characteristics of service potential, using the user’s interest and QoS preference for web service history to calculate the ranking score of Web service candidates, an advanced algorithm about diversity-aware Web service ranking is proposed. A Web service map is also constructed on the base of the functional similarity between Web services, and Web service candidate entries are evaluated on the base of their scores and the degree of diversity derived from the Web service map. Yan Hu [29] proposed an advanced time-aware collaborative filtering method for high-quality Web service recommendation. They integrate time information into similarity measurements and QoS predictions. In addition, for the purpose of alleviating the problem of data sparseness, a hybrid personalized random walk algorithm is invented to reason the similarity of indirectly associated users and the similarity of services.
The aforementioned studies achieve good performance in predicting and recommending related services and variables based on QoS. However, most of them ignore the significance of service functions and user similarity. References [19,28] consider the contextual characteristics of services without the service function characteristics. Reference [22] considers the similarity of the service geographical level without the functional attributes of services and the similarity of the users. References [25,29] indicated that, by leveraging the collaborative filtering algorithm [30], many recommendation models are deeply affected by the sparseness of QoS matrix data, which may cause the low similarity of recommended results. Therefore, this paper proposes a clustering model that combines user QoS and services, which can solve the above problems and thus improve the accuracy of recommendations.

3. RMUSC Architecture

The RMUSC recommendation model proposed in this paper is shown in Figure 2. First, extract the context features according to the WSDL document of the Web service to obtain its functional description and clustering features. Then, the user performs clustering based on the QoS of the history request service. The matrix decomposition model is used to predict user QoS and generate service recommendations, thereby solving the problem of data sparsity in the traditional CFR algorithm. Finally, the RMUSC recommended model is used for testing and verification, 70% of the data set is used for model training and the best parameters are obtained, and the remaining data is used for recommended performance testing. The generated recommendation results will be compared with other Web service recommendation algorithms [30,31,32,33,34].

3.1. Web Service Clustering Algorithm

3.1.1. WSDL Service Description Files

Generally, the web service is provided to the user on the client side; for example, in the browser, the user can directly browse and use the service provided by the current web page. Web services in the client are generally described using a WSDL file [35,36,37,38]. The contextual characteristics of the WSDL file describe the functional categories to which the service belongs. We select the five most representative contextual features from the WSDL file, including WSDL text, WSDL type, WSDL prompt message, WSDL port, and web service name. These features expose the functionality of web services, based on which service function clustering. According to the service API in the dataset, the open web crawler Hertrix to collect the WSDL is used. Text data of the service, filter the text through the WSDL tag, and get the required text data and store it in the database. Then format the data to get the standard dataset entered when the next feature value is extracted [39,40]. Table 1 shows the characteristics of a WSDL service description document.

3.1.2. Web Service Feature Word Extraction

At present, the main tools used in relevant context research are word frequency analysis, TF (Term Frequency) [41], which indicates the number of times a word appears in the entire text, because the more times a word appears in the text, the more it reflects the theme of the text. IDF (Inverse Document Frequency) [42], which mainly indicates how often a word appears in multiple texts, and how important the word is to the text topic. A word appears in multiple texts, indicating that the word is not unique and is weaker in embodying the subject of the text [43].
The web service description text has many compound words, such as housework, classroom, and football. We perform a stem-drying analysis on the stem-to-stem analysis method to obtain a content vector [44,45].
F w is defined as the word frequency of each word in the content vector as follows:
F w = T F w T F w ¯   .
T F w is defined as the total number of words in the sample document, and T F w ¯ is how often the word w appears in the document. The larger F w the more likely the word w is to be a content descriptor. In this paper, a threshold δ is set, and if F w exceeds this threshold, the word can be set as a content descriptor.
The inverse document frequency IDF of each content descriptor is defined as follows:
I D F w = log | N | d D S u m ( w d ) ,
where | N | is the total number of documents, and d D S u m ( w d ) is the number of documents containing word w . T F I D F is used to assess how important a word is to a text topic.
T F I D F = F w × I D F w .
In this paper, a threshold ε is set for the result of the above formula, and each content descriptor is calculated by the above formula. The word above the threshold becomes the characteristic word of the current text, which reflects the theme of the text, that is, the description of the web service function described in this paper. The feature words of each service text are merged into a feature word set of the web service, denoted as F V s i .
NGD (Normalized Google Distance) [46] is a related representation of two words obtained by standardization calculation using data obtained by the Google search engine. The calculation is as follows:
N G D ( x , y ) = max { log f ( x ) , log f ( y ) } log f ( x , y ) log M min { log f ( x ) , log f ( y ) }
M is the total number of web pages searched by Google using the feature words x , y , log f ( x ) , log f ( y ) is the number of hits searched using the feature words x , y respectively, and f ( x , y ) is the number of web pages that appear simultaneously using x , y .
This paper uses the normal Google distance to normalize the feature words of the web service and uses the normalized Google distance formula to calculate the similarity of the two web services. The calculation formula is as follows:
S i m S ( S 1 , S 2 ) = S i F V s 1 S j F V s 2 N G D ( S i , S j ) | F V s 1 | × | F V s 2 |
| F V s 1 | and | F V s 2 | are the characteristic word vectors of the web service S 1 , S 2 , separately, and | F V s 1 | is the cardinality (modulo) of the vector.

3.1.3. Web Service Clustering Decision

Because the selection of the initial type center of the classical clustering algorithm K-means is random, the cluster center may be too close, which greatly affects the classification results [47]. The selection principle of the initial center of the K-means++ algorithm is that the distance between them should be as large as possible, and the final error of the classification result can be significantly improved. Based on the service feature word set and its Google distance, K-means++ algorithm is used to cluster various web services [48]. The Algorithm 1 we develop is expressed as follows:
Algorithm 1 K-means++ clustering based on service function feature word set matrix.
1:
Select the number of clusters K ;
2:
randomly select one from the feature word set vector F V s i of each service as the initial cluster center C 1 ;
3:
Calculate the distance D ( x ) between each vector and the current nearest cluster center, calculate the probability D ( x ) 2 x X D ( x ) 2 that each vector becomes the next cluster center, and determine the next center according to the probability wheel;
4:
Repeat the third step until K cluster centers are selected;
5:
For F V s i of each service, calculate its normalized Google distance to K cluster centers, and classify it into the class to which the center with the smallest distance belongs;
6:
Recalculate the center of all elements in each category C ( i ) ;
7:
Repeat steps 5 and 6 until the cluster center no longer changes;
8:
Get web service clustering S ( i ) = { s | s C ( i ) , i [ 1 , k ] } ;

3.2. User Clustering Algorithm

User similarity can be calculated by QoS values provided by different users who invoke the same Web service. In some cases, the QoS value of a user may be lost. Missing values can be predicted by using other QoS values observed by similar users [49].
Since the cosine similarity measure only considers the similarity between the two vector directions, the influence of the dimension between different vectors is not considered, and the scores of different users will be different [50]. The method of modified cosine similarity calculation mitigates effects of this difference on the results by subtracting the average score of the user’s rating items. We use the modified cosine similarity to mensurate the similarity. As follows:
S i m U ( i , j ) = k I i j ( R i , k R i ¯ ) ( R j , k R j ¯ ) k I i ( R i , k R i ¯ ) 2 k I j ( R j , k R j ¯ ) 2 ,
where I i j is the set of items that the users i , j have scored together, we use I i to represent the item set of the user i scored, I j is the item set of the user j scored, R i , k is the score of user i on the score item k, and R i , k is the score of user j for the score item k , R i , R j is the average of the scores of user i and user j for their respective scoring items.
We call the QoS data of the web service according to the user history and use the modified cosine similarity to cluster each similar user. Each user calculates the nearest N users as the neighbor of the current user. Algorithm 2, for grouping the most loved N users for each user is as follows:
Algorithm 2 Top-N user clustering algorithm
1:
input I i , I j , I i j , R i , k , R j , k ;
2:
Calculate i , j , k ;
3:
for each 0 < j m do
4:
 for each 0 < j m 1 and j i do
5:
  Calculate S i m U ( i , j ) , stored in the temp map;
6:
 end for
7:
  Take the first N users in the temp mapping table to form the neighbor set U ( i ) = { U k |   U k T o p N ( U i ) , i k } of user i ;
8:
end for
9:
Output U ( i ) .

3.3. User QoS Prediction Algorithm

In a wide range of internet interactions, users calling web services have their own specificities, which lead to a sparse matrix of user calls. On the other hand, many services called by users may not have been visited before, and there is no relevant data as predictive support, which leads to the problem of cold boot. As for the scoring matrix of services, there will be some potential factors that have a significant impact on users’ preferences for web services. Under this premise, the matrix decomposition method is widely used to decompose the service matrix called by the user into low rank, and uses the inner product of the matrix to predict missing values in the user score matrix [51,52].
The user’s scoring matrix for the service is defined as R = U T S , U R l × m is the user feature matrix, and S R l × m is the service feature matrix. the feature vector in the user feature matrix is represented as p i and the service feature vector as q j . Then the missing value r ^ i , j in the scoring matrix of user i for service j as follows:
r ^ i , j = p i T × q j
Collaborative filtering methods are widely used in many studies to get the prediction of QoS, usually in the following form:
l = min 1 2 i = 1 m j = 1 n I i , j ( r i , j r ^ i , j ) 2 + λ 1 2 U F 2 + λ 2 2 S F 2
where I i , j represents the call of user i to service j , the value of I i , j is 1 when the service is called, otherwise it is 0. · F 2 is the square of the F-norm. The latter two are regularization terms mitigating over-fitting user service matrices, λ i , λ j are used as parameters to control over-fitting constraints.
However, due to the sparseness of QoS data, the traditional collaborative filtering algorithm has major defects in predicting QoS values. We can collaboratively predict a user’s QoS preferences for services based on user clustering and service clustering. In general, user preferences based on user similarity clustering defined as follows:
min l ( R U , S , U ) = 1 2 i = 1 m j = 1 n I i , j ( r i , j r ^ i , j ) 2 + i m k U ( i ) S i m U ( i , k ) p i p k F 2 + λ 1 2 U F 2
The goal of this optimization problem is to find users with similar preferences based on the web service feature matrix. On the other side, we predict the potential web service preferences for related users based on similar user clustering:
min l ( R U , S , U ) = 1 2 i = 1 m j = 1 n I i , j ( r i , j r ^ i , j ) 2 + j n d S ( j ) S i m U ( j , d ) q j q d F 2 + λ 2 2 S F 2
This optimization problem is to find a web service with potential user preferences based on the user feature matrix.
We use these two optimization sub-problems to merge for the collaborative user features and service features we need, and get the missing user values in the user service call matrix, this model described as follows:
min l ( R U , S , U , S ) = 1 2 i = 1 m j = 1 n I i , j ( r i , j r ^ i , j ) 2 + α 2 i m k U ( i ) S i m U ( i , k ) p i p k F 2 + β 2 j n d S ( j ) S i m S ( j , d ) q j q d F 2 + λ 1 2 U F 2 + λ 2 2 S F 2
where α , β are the weight coefficient to control the user feature and the service feature. A larger value of α indicates that adjacent users have a greater influence on the current predicted QoS, and the service feature has a greater impact on the current predicted QoS if β is larger.
The gradient descent algorithm is used to explore the optimal solution of the Equation (11), The update of the factors p i , p j of the target feature vector is iterated by the following method:
p i = p i l p i = p i γ [ j = 1 n I i , j ( r ^ i , j r i , j ) q j + α k U ( i ) S i m U ( i , k ) ( p i p k ) ]
q i = q i l q i = q i γ [ i = 1 m I i , j ( r ^ i , j r i , j ) p i + β d S ( j ) S i m S ( j , d ) ( q j q d ) ] ,
where γ is an iteration factor controlling the number and speed of iterations.
We use a new gradient descent algorithm to calculate the missing QoS values in the service invocation matrix. The flow for Algorithm 3 is listed hereafter:
Algorithm 3 Gradient descent iteration to find the optimal solution
1:
Input: Training matrix R
2:
Initialize the matrix R and find the eigenvectors p i , q j of the user matrix U and the service matrix S
3:
Iterate through the following steps until the iteration termination condition is met
4:
for each non-empty r ^ i , j R do
5:
   r ^ i , j = p i T × q j ;
6:
  for each j [ 1 , n ] , k U ( i ) do
7:
     e 1 = j = 1 n I i , j ( r ^ i , j r i , j ) q j + α k U ( i ) S i m U ( i , k ) ( p i p j ) ;
8:
  end for;
9:
  for each i [ 1 , m ] , d S ( j ) do
10:
     e 2 = i = 1 m I i , j ( r ^ i , j r i , j ) p i + β d S ( j ) S i m S ( j , d ) ( q j q d ) ;
11:
  end for;
12:
   p i = p i γ e 1 ;
13:
   q j = q j γ e 2 ;
14:
end for;
15:
Calculate M A E , R M S E ;
16:
Terminate the iteration, output the target matrices U and S .

4. Simulation Results and Analysis

In this paper, the typical data set is selected for the performance analysis of the recommended algorithm. The data set contains 339 user invocations to 5825 web services in the real world and more than 1.5 million invocation records [17]. We used 70% of the user invocation records to train the algorithm to get the optional values for the relevant parameters. The remaining 30% of the user data is used to validate our algorithm model. We get a sparse matrix by randomly deleting some records in the user call matrix.
Through the recommended models and experiments, the QoS value r ^ i , j of the recommended service is obtained. We use the mean absolute error (MAE) and the root mean square error (RMSE) to evaluate the accuracy of the experimental results. The accuracy increases with the decrease of both values. The calculation is indicated as below:
M A E = 1 N | r i , j r ^ i , j |
where r i , j is the QoS value that user i actually invocates to web service j , r ^ i , j is the QoS value predicted by the model, N is the amount of predicted values, and MAE rates the relative error of the predicted value as a whole to the true value. The relative maximum error is usually emphasized with RMSE, defined as follows:
R M S E = 1 n | r i , j r ^ i , j | 2

4.1. User Services Clustering Analysis

Figure 3 shows three original sets of user services. Each presents the initial center of each original set. In practice, the location of user service sets can be automatically obtained. K similar service clustering (denoted by Si) can be derived by Algorithm 1 from user service sets. In Figure 4, X axis represents the offset of “portType” and Y axis is the offset of “service”. “portType” and “service” are the characteristic words as shown in Table 1. Each point set with different color represents a similar distribution. Each “*”, denoted by Ci, is the center of each service center. Ci is determined by the proposed algorithm. We can observe that there is K (K = 6) service clustering after adapting the proposed algorithm in Figure 4. Furthermore, the original sets are almost evenly divided by the service clustering, which verified the effectiveness of the algorithm.
The accuracy of clustering (precision) is an important indicator to measure the effect of clustering. This article will use the same data set for clustering and analysis. The calculation formula of precision is:
P = A A + B
where A is the number of points in the category, and B is the number of points not in the category but recorded as the category. The accuracy of clustering directly reflects the pros and cons of the clustering effect. This paper will use the density-based clustering algorithm (DBSCAN) and the traditional K-means algorithm for clustering on the same data set, and use the clustering results to calculate the clustering accuracy. From Figure 5, the service clustering algorithm in this paper has obvious advantages over the other two clustering algorithms in the number of clusters and maintain good recommendation accuracy as the number of clusters grows.

4.2. Effects of α, β and Density on Service Recommendation

In Figure 6, we can make a conclusion that the model we support gets the optimal solution when the parameter α = 0.4, β = 0.5. Before reaching 0.4 and 0.5, MAE and RMSE decrease as the parameter increases; after reaching this value, it increases as the number increases. It shows that the fusion of user neighborhood and service function characteristics into the recommendation model can improve the accuracy of recommendation. Using only one party reduces the accuracy of the recommendation, and the clustering weight of the service is greater than the user’s clustering weight. Therefore, the parameters are α = 0.4, β = 0.5. To illustrate the generality of the two parameters at different matrix densities, we discuss them in the following figure. The basic method is to show by fixing one of the values and intercepting a face of the other parameter.
Figure 7 shows the effect of the results of α , β and density on service recommendation. α is the weight coefficient of similar users in the recommendation model. If it is too large, it will dominate the recommendation results of the recommendation model. It can be concluded from Figure 7a that when α = 0.4, the recommended model proposed in this paper gets the optimal value. Before reaching the threshold value of 0.4, MAE and RMSE decrease with the increase of the parameter. β controls the influence of service function characteristics on the recommendation model. It can be seen from Figure 7b that MAE and RMSE reach the optimal value when the threshold of β parameter is 0.5.

4.3. Service Recommendation Analysis

For the sake of showing that the model we develop has higher accuracy in two evaluation factors above, we compare with the following mainstream collaborative filtering algorithms—(1) IPCC, similar services for recommendation on the basis [18]. (2) UPCC, on the base of similar behavior between users [18]. (3) NIMF [19], similar users merge with the matrix factorization model for recommendation. (4) LoNMF [9], which uses local similar neighbor matrix factorization model for recommendation. Table 2 shows that the proposed RMUSC considers both the factor of user-side and service-side.
This paper randomly deletes some QoS data in the data set for simulating the data sparsity of the user service invocation matrix, so that the matrix density of the invocation matrix R can be controlled. The matrix density is large represents the more data is available. Verifying the reliability of the experiment, we repeat the experiment at each matrix density ten times. Finally, we continuously verify and iterate the parameters in the recommended model during the experiment, we set α = 0.4, β = 0.5, γ = 0.013, N = 10. The comparison results of service recommendation algorithms is shown in Figure 8.
In Figure 8, we can see that our method obtains smaller values of MAE and RMSE evaluation parameters than the other four mainstream recommendation algorithms. This proves that our recommendation approach has better recommendation accuracy. It shows that the application of service function features and adjacent user features to the model-based collaborative filtering recommendation algorithm has a better recommendation result. It can also be seen that as the density of the matrix increases, the values of MAE and RMSE will become smaller and smaller, indicating that the increase in available data will increase the recommended accuracy of the recommended model.
Figure 9 shows the recommended comparison of the method and other mainstream methods. It can be seen that when the recommendation result is configured to 10, our method has a greater performance than the second ranked LoNMF method, and the recommendation precision is improved by about 19%. This shows that the recommendation results obtained by our recommendation method are highly recognized.

5. Conclusions

In this paper, a new recommendation model by jointly considering the impact of service function characteristics and similar user preferences is developed. In the proposed model, the useful information is merged with the matrix factorization model to predict the missing QoS values. The experimental results show that the proposed model outperforms the other mainstream recommendation algorithms in light of recommendation efficiency and accuracy. In the immediate future, the Web service can be tagged to enhance the performance of the proposed recommendation model. Moreover, regional users generally have similar user service features. Therefore, user location can also be considered one of the factors for the accuracy of Web service recommendation by user classification.
In the future, we will work on optimizing algorithms to reduce complexity and optimize the framework to improve efficiency. The existing problem is that the method proposed in this article uses the QoS record of the user’s historical call service, and there is a lag in processing efficiency. We hope to try online real-time processing, further optimize and improve the architecture, improve data acquisition and analytical processing power.

Author Contributions

F.D. and T.W. completed the methodology; T.W. completed the design; T.W. wrote the paper. S.R. revised the paper. F.D. and J.B. reviewed the paper. All authors have read and agreed to the published version of the manuscript.

Funding

This work is partially supported by the Research Foundation of Ministry of Education-China Mobile (No. MCM20170205), the Postdoctoral Science Foundation, China (Nos. 2019M661900 and 2019K026), the Six talent peaks project of Jiangsu Province (No. DZXX-008), and the NUPTSF (Nos. NY217146 and NY220028).

Conflicts of Interest

The authors declare no conflict of interest.

References

  1. Wang, B.; Kong, W.; Guan, H.; Xiong, N. Air Quality Forcasting based on Gated Recurrent Long Short Term Memory Model in Internet of Things. IEEE Access 2019, 7, 69524–69534. [Google Scholar] [CrossRef]
  2. Niu, B.; Huang, Y. An Improved Method for Web Text Affective Cognition Computing Based on Knowledge Graph, Computers. Mater. Contin. 2019, 59, 1–14. [Google Scholar]
  3. Karande, A.M.; Kalbande, D.R. Web service selection based on QoS using tModel working on feed forward network. In Proceedings of the 2014 International Conference on Issues and Challenges in Intelligent Computing Techniques (ICICT), Ghaziabad, India, 7–8 February 2014; pp. 29–33. [Google Scholar]
  4. Wen, T.; Bao, J.; Ding, F. QoS-Aware Web Service Recommendation Model Based on Users and Services Clustering. In Proceedings of the International Conference on Information Technology and Electrical Engineering 2018, Xiamen, China, 7–8 December 2018; pp. 1–6. [Google Scholar]
  5. Jiang, W.; Chen, J.; Jiang, Y.; Xu, Y.; Wang, Y.; Tan, L.; Liang, G. A New Time-Aware Collaborative Filtering Intelligent Recommendation System. Comput. Mater. Contin. 2019, 61, 849–859. [Google Scholar] [CrossRef]
  6. Mao, C.; Chen, J. QoS prediction for Web services based on similarity-aware slope one collaborative filtering. Informatics 2013, 37, 139–148. [Google Scholar]
  7. Chellappa, R.K.; Sin, R.G. Personalization versus Privacy: An Empirical Examination of the Online Consumer’s Dilemma. Inf. Technol. Manag. 2005, 6, 181–202. [Google Scholar] [CrossRef]
  8. Chen, Z.; Limin, S.; Feng, L. Exploiting Web service geographical neighborhood for collaborative QoS prediction. Future Gener. Comput. Syst. 2017, 68, 248–259. [Google Scholar] [CrossRef]
  9. Zheng, Z.; Ma, H.; Lyu, M.R.; King, I. Collaborative Web service QoS prediction via neighborhood integrated matrix factorization. IEEE Trans. Serv. Comput. 2013, 6, 289–299. [Google Scholar] [CrossRef]
  10. Lo, W.; Yin, J.; Li, Y.; Wu, Z. Efficient Web service QoS prediction using local neighborhood matrix factorization. Eng. Appl. Artif. Intell. 2015, 38, 14–23. [Google Scholar] [CrossRef]
  11. Melville, P.; Mooney, R.J.; Nagarajan, R. Content-boosted collaborative filtering for improved recommendations. In Proceedings of the Eighteenth National Conference on Artificial Intelligence, Edmonton, AB, Canada, 28 July–1 August 2002; pp. 187–192. [Google Scholar]
  12. Yao, L.; Sheng, Q.Z.; Ngu, A.H.H.; Yu, J.; Segev, A. Unified Collaborative and Content-Based Web Service Recommendation. IEEE Trans. Serv. Comput. 2015, 8, 453–466. [Google Scholar] [CrossRef]
  13. Kang, G.; Liu, J.; Tang, M.; Liu, X.F.; Fletcher, K. Web service selection for resolving conflicting service requests. In Proceedings of the 9th IEEE International Conference on Web Services (ICWS’11), Washington, DC, USA, 5 July 2011; pp. 387–394. [Google Scholar]
  14. Wu, H.C.; Luk RW, P.; Wong, K.F. Interpreting TF-IDF term weights as making relevance decisions. ACM Trans. Inf. Syst. 2008, 26, 55–59. [Google Scholar] [CrossRef]
  15. Hwang, S.Y.; Hsu, C.; Lee, C.H. Service Selection for Web Services with Probabilistic QoS. IEEE Trans. Serv. Comput. 2017, 8, 467–480. [Google Scholar] [CrossRef]
  16. Zheng, Z.; Ma, H.; Lyu, M.R.; King, I. QoS-aware Web service recommendation by collaborative filtering. IEEE Trans. Serv. Comput. 2011, 4, 140–152. [Google Scholar] [CrossRef]
  17. Zheng, Z.; Zhang, Y.; Lyu, M.R. Investigating QoS of Real-World Web Services. IEEE Trans. Serv. Comput. 2014, 7, 32–39. [Google Scholar] [CrossRef]
  18. Sarwar, B.; Karypis, G.; Konstan, J.; Riedl, J. Item-based collaborative filtering recommendation algorithms. In Proceedings of the 10th international conference on World Wide Web, Hong Kong, China, 1–5 May 2001; pp. 285–295. [Google Scholar]
  19. Jung, K.Y.; Lee, J.H. Prediction of user preference in recommendation system using associative user clustering and Bayesian estimated value. In Proceedings of the Australian Joint Conference on Artificial Intelligence, Canberra, Australia, 2–6 December 2002; pp. 284–296. [Google Scholar]
  20. Zhang, R.; Li, C.; Sun, H.; Wang, Y.; Huai, J. Quality of Web service prediction by collective matrix factorization. In Proceedings of the 2014 IEEE International Conference on Services Computing (SCC), Anchorage, AK, USA, 27 June–2 July 2014; pp. 432–439. [Google Scholar]
  21. Cao, B.; Liu, J.; Wen, Y.; Li, H.; Xiao, Q.; Chen, J. QoS-aware service recommendation based on relational topic model and factorization machines for IoT Mashup applications. J. Parallel Distrib. Comput. 2019, 132, 177–189. [Google Scholar] [CrossRef]
  22. Tapang, C.C. Web Services Description Language (WSDL) Explained, Microsoft Developer Netw. Available online: http://www.fdi.ucm.es/profesor/jjruz/WebSI/Bibliografia/WSDL1.pdf (accessed on 15 April 2017).
  23. Wang, Z.; Cheng, B.; Zhang, W.; Chen, J. Q-Graphplan: QoS-Aware Automatic Service Composition with the Extended Planning Graph. IEEE Access 2020, 8, 8314–8323. [Google Scholar] [CrossRef]
  24. Messina, F.; Pappalardo, G.; Comi, A.; Rosaci, D.; Sarné, G.M.L. Combining reputation and QoS measures to improve cloud service composition. Int. J. Grid Util. Comput. 2017, 8, 142–151. [Google Scholar] [CrossRef]
  25. Zhang, Y.; Zhou, Y.; Wang, F.; Sun, Z.; He, Q. Service Recommendation based on Quotient Space Granularity Analysis and Covering Algorithm on Spark. Knowl.-Based Syst. 2018, 147, S0950705118300662. [Google Scholar] [CrossRef]
  26. Yan, C.; Cui, X.; Qi, L.; Xu, X.; Zhang, X. Privacy-aware data publishing and integration for collaborative service recommendation. IEEE Access 2018, 6, 43021–43028. [Google Scholar] [CrossRef]
  27. Kumar, S.S.; Anouncia, S.M. QoS-Based Concurrent User-Service Grouping for Web Service Recommendation. Autom. Control Comput. Sci. 2018, 52, 220–230. [Google Scholar] [CrossRef]
  28. Zheng, Z.; Zhang, Y.; Lyu, M.R. Distributed QoS evaluation for real-world Web services. In Proceedings of the 2010 IEEE International Conference on Web Services (ICWS), Miami, FL, USA, 5–10 July 2010; pp. 83–90. [Google Scholar]
  29. Herlocker, J.L.; Konstan, J.A.; Terveen, L.G.; Riedl, J.T. Evaluating collaborative filtering recommender systems. ACM Trans. Inf. Syst. 2004, 22, 5–53. [Google Scholar] [CrossRef]
  30. Park, H.S.; Park, M.H.; Cho, S.B. Mobile information recommendation using multi-criteria decision making with Bayesian network. Int. J. Inf. Technol. Decis. Mak. 2015, 14, 317–338. [Google Scholar] [CrossRef]
  31. Gu, Q.; Zhou, J.; Ding, C. Collaborative filtering: Weighted nonnegative matrix factorization incorporating user and item graphs. In Proceedings of the 2010 SIAM International Conference on Data Mining (SDM), Columbus, OH, USA, 29 April–1 May 2010; pp. 199–210. [Google Scholar]
  32. Zhang, C.-X.; Zhang, Z.-K.; Yu, L.; Liu, C.; Liu, H.; Yan, X.-Y. Information filtering via collaborative user clustering modeling. Phys. A Stat. Mech. Appl. 2014, 396, 195–203. [Google Scholar] [CrossRef] [Green Version]
  33. Lo, W.; Yin, J.; Deng, S.; Li, Y.; Wu, Z. Collaborative Web service QoS prediction with location-based regularization. In Proceedings of the 2012 IEEE 19th International Conference on Web Services (ICWS), Honolulu, HI, USA, 24–29 June 2012; pp. 464–471. [Google Scholar]
  34. Chen, X.; Zheng, Z.; Liu, X.; Huang, Z.; Sun, H. Personalized QoS-aware Web service recommendation and visualization. IEEE Trans. Serv. Comput. 2013, 6, 35–47. [Google Scholar] [CrossRef]
  35. Lu, G.; Ji, X.; Li, J.; Yuan, D. Difference factor’ KNN collaborative filtering recommendation algorithm. In Advanced Data Mining and Applications; Springer: Cham, Switzerland, 2014; pp. 175–184. [Google Scholar]
  36. Deng, S.G.; Huang, L.T.; Wu, J.; Wu, Z.H. Trust-based personalized service recommendation: A network perspective. J. Comput. Sci. Technol. 2014, 29, 69–80. [Google Scholar] [CrossRef]
  37. Yin, J.; Lo, W.; Deng, S.; Li, Y.; Wu, Z.; Xiong, N. Colbar: A collaborative location-based regularization framework for QoS prediction. Inf. Sci. 2014, 265, 68–84. [Google Scholar] [CrossRef]
  38. Yu, D.; Liu, Y.; Xu, Y.; Yin, Y. Personalized QoS prediction for web services using latent factor models. In Proceedings of the 2014 IEEE International Conference on Services Computing (SCC), Anchorage, AK, USA, 27 June–2 July 2014; pp. 107–114. [Google Scholar]
  39. Zhang, L.; Zhang, B.; Liu, Y.; Gao, Y.; Zhu, Z. A web service QoS prediction approach based on collaborative filtering. In Proceedings of the 2010 IEEE Asia-Pacific Services Computing Conference, Hangzhou, China, 6–10 December 2010; pp. 725–731. [Google Scholar]
  40. Yu, T.; Zhang, Y.; Lin, K.J. Efficient algorithms for web services selection with end-to-end QoS constraints. ACM Trans. Web 2007, 1, 1–26. [Google Scholar] [CrossRef]
  41. Yu, Q.; Zheng, Z.; Wang, H. Trace norm regularized matrix factorization for service recommendation. In Proceedings of the 2013 IEEE 20th International Conference on Web Services (ICWS), Santa Clara, CA, USA, 28 June–3 July 2013; pp. 34–41. [Google Scholar]
  42. Tang, M.; Jiang, Y.; Liu, J.; Liu, X.F. Location-aware collaborative filtering for QoS-based service recommendation. In Proceedings of the 2012 IEEE 19th International Conference on Web Services, Honolulu, HI, USA, 24–29 June 2012; pp. 202–209. [Google Scholar]
  43. Yu, C.; Huang, L. Time-aware collaborative filtering for QoS-based service recommendation. In Proceedings of the 2014 IEEE International Conference on Web Services, Anchorage, AK, USA, 27 June–2 July 2014; pp. 265–272. [Google Scholar]
  44. Zhu, J.; He, P.; Zheng, Z.; Lyu, M. Towards online, accurate, and scalable QoS prediction for runtime service adaptation. In Proceedings of the IEEE 34th International Conference on Distributed Computing Systems, Madrid, Spain, 30 June–3 July 2014; pp. 237–318. [Google Scholar]
  45. Liu, G.; Meng, K.; Ding, J.; Nees, J.P.; Guo, H.; Zhang, X. An Entity-Association-Based Matrix Factorization Recommendation Algorithm. Comput. Mater. Contin. 2019, 58, 101–120. [Google Scholar]
  46. Kuang, L.; Xia, Y.; Mao, Y. Personalized services recommendation based on context-aware QoS prediction. In Proceedings of the 2012 IEEE Conference on Web Services, Honolulu, HI, USA, 24–29 June 2012; pp. 400–406. [Google Scholar]
  47. Iqbal, R.; Grzywaczewski, A.; Halloran, J.; Doctor, F.; Iqbal, K. Design implications for task-specific search utilities for retrieval and re-engineering of code. Enterp. Inf. Syst. 2015, 1751–7575. [Google Scholar] [CrossRef] [Green Version]
  48. He, P.; Zhu, J.; Zheng, Z.; Xu, J.; Lyu, M. Location-based hierarchical matrix factorization for Web service recommendation. In Proceedings of the 2014 IEEE Conference on Web Services, Anchorage, AK, USA, 27 June–2 July 2014; pp. 297–304. [Google Scholar]
  49. Gao, M.; Ling, B.; Yang, L.; Wen, J.; Xiong, Q.; Li, S. From similarity perspective: A robust collaborative filtering approach for service recommendations. Front. Comput. Sci. 2019, 13, 231–246. [Google Scholar] [CrossRef] [Green Version]
  50. Mahmud, S.; Iqbal, R.; Doctor, F. Cloud enabled data analytics and visualization framework for health-shocks prediction. Future Gener. Comput. Syst. 2015. [Google Scholar] [CrossRef]
  51. Koren, Y.; Bell, R.; Volinsky, C. Matrix factorization techniques for recommender systems. Computer 2009, 42, 30–37. [Google Scholar] [CrossRef]
  52. Yao, Z.; Gao, K. User recommendation method based on joint probability matrix decomposition in CPS networks. Comput. Commun. 2020, 157, 221–231. [Google Scholar] [CrossRef]
Figure 1. The recommended service application scenarios.
Electronics 09 00740 g001
Figure 2. Recommendation model based on user and service clustering (RMUSC) modeling architecture.
Electronics 09 00740 g002
Figure 3. Distribution of original data sets.
Electronics 09 00740 g003
Figure 4. Results of Web services clustering (K service clusters from three original data sets).
Electronics 09 00740 g004
Figure 5. Performance comparisons of clustering algorithms on precision.
Electronics 09 00740 g005
Figure 6. Impact of α and β . (a) Impact on MAE; (b) Impact on RMSE.
Electronics 09 00740 g006
Figure 7. Effect results of α , j i and density on service recommendation. (a) Effect of α under different matrix densities; (b) Effect of β under different matrix densities.
Electronics 09 00740 g007
Figure 8. Comparison results of service recommendation algorithms. (a) Results of mean absolute error; (b) Results of root mean square error.
Electronics 09 00740 g008
Figure 9. Comparison results of recommended precision.
Electronics 09 00740 g009
Table 1. WSDL service description document.
Label TypeDescription
typesType of data
messageMessages used by web services
portTypeWeb service execution
bindingCommunication protocols
serviceService name
Table 2. Comprehensive factors of different recommendation models.
MethodUser Side FactorService Side Factor
IPCCNone
UPCCNone
NIMFNone
LoMMFNone
RMUSC

