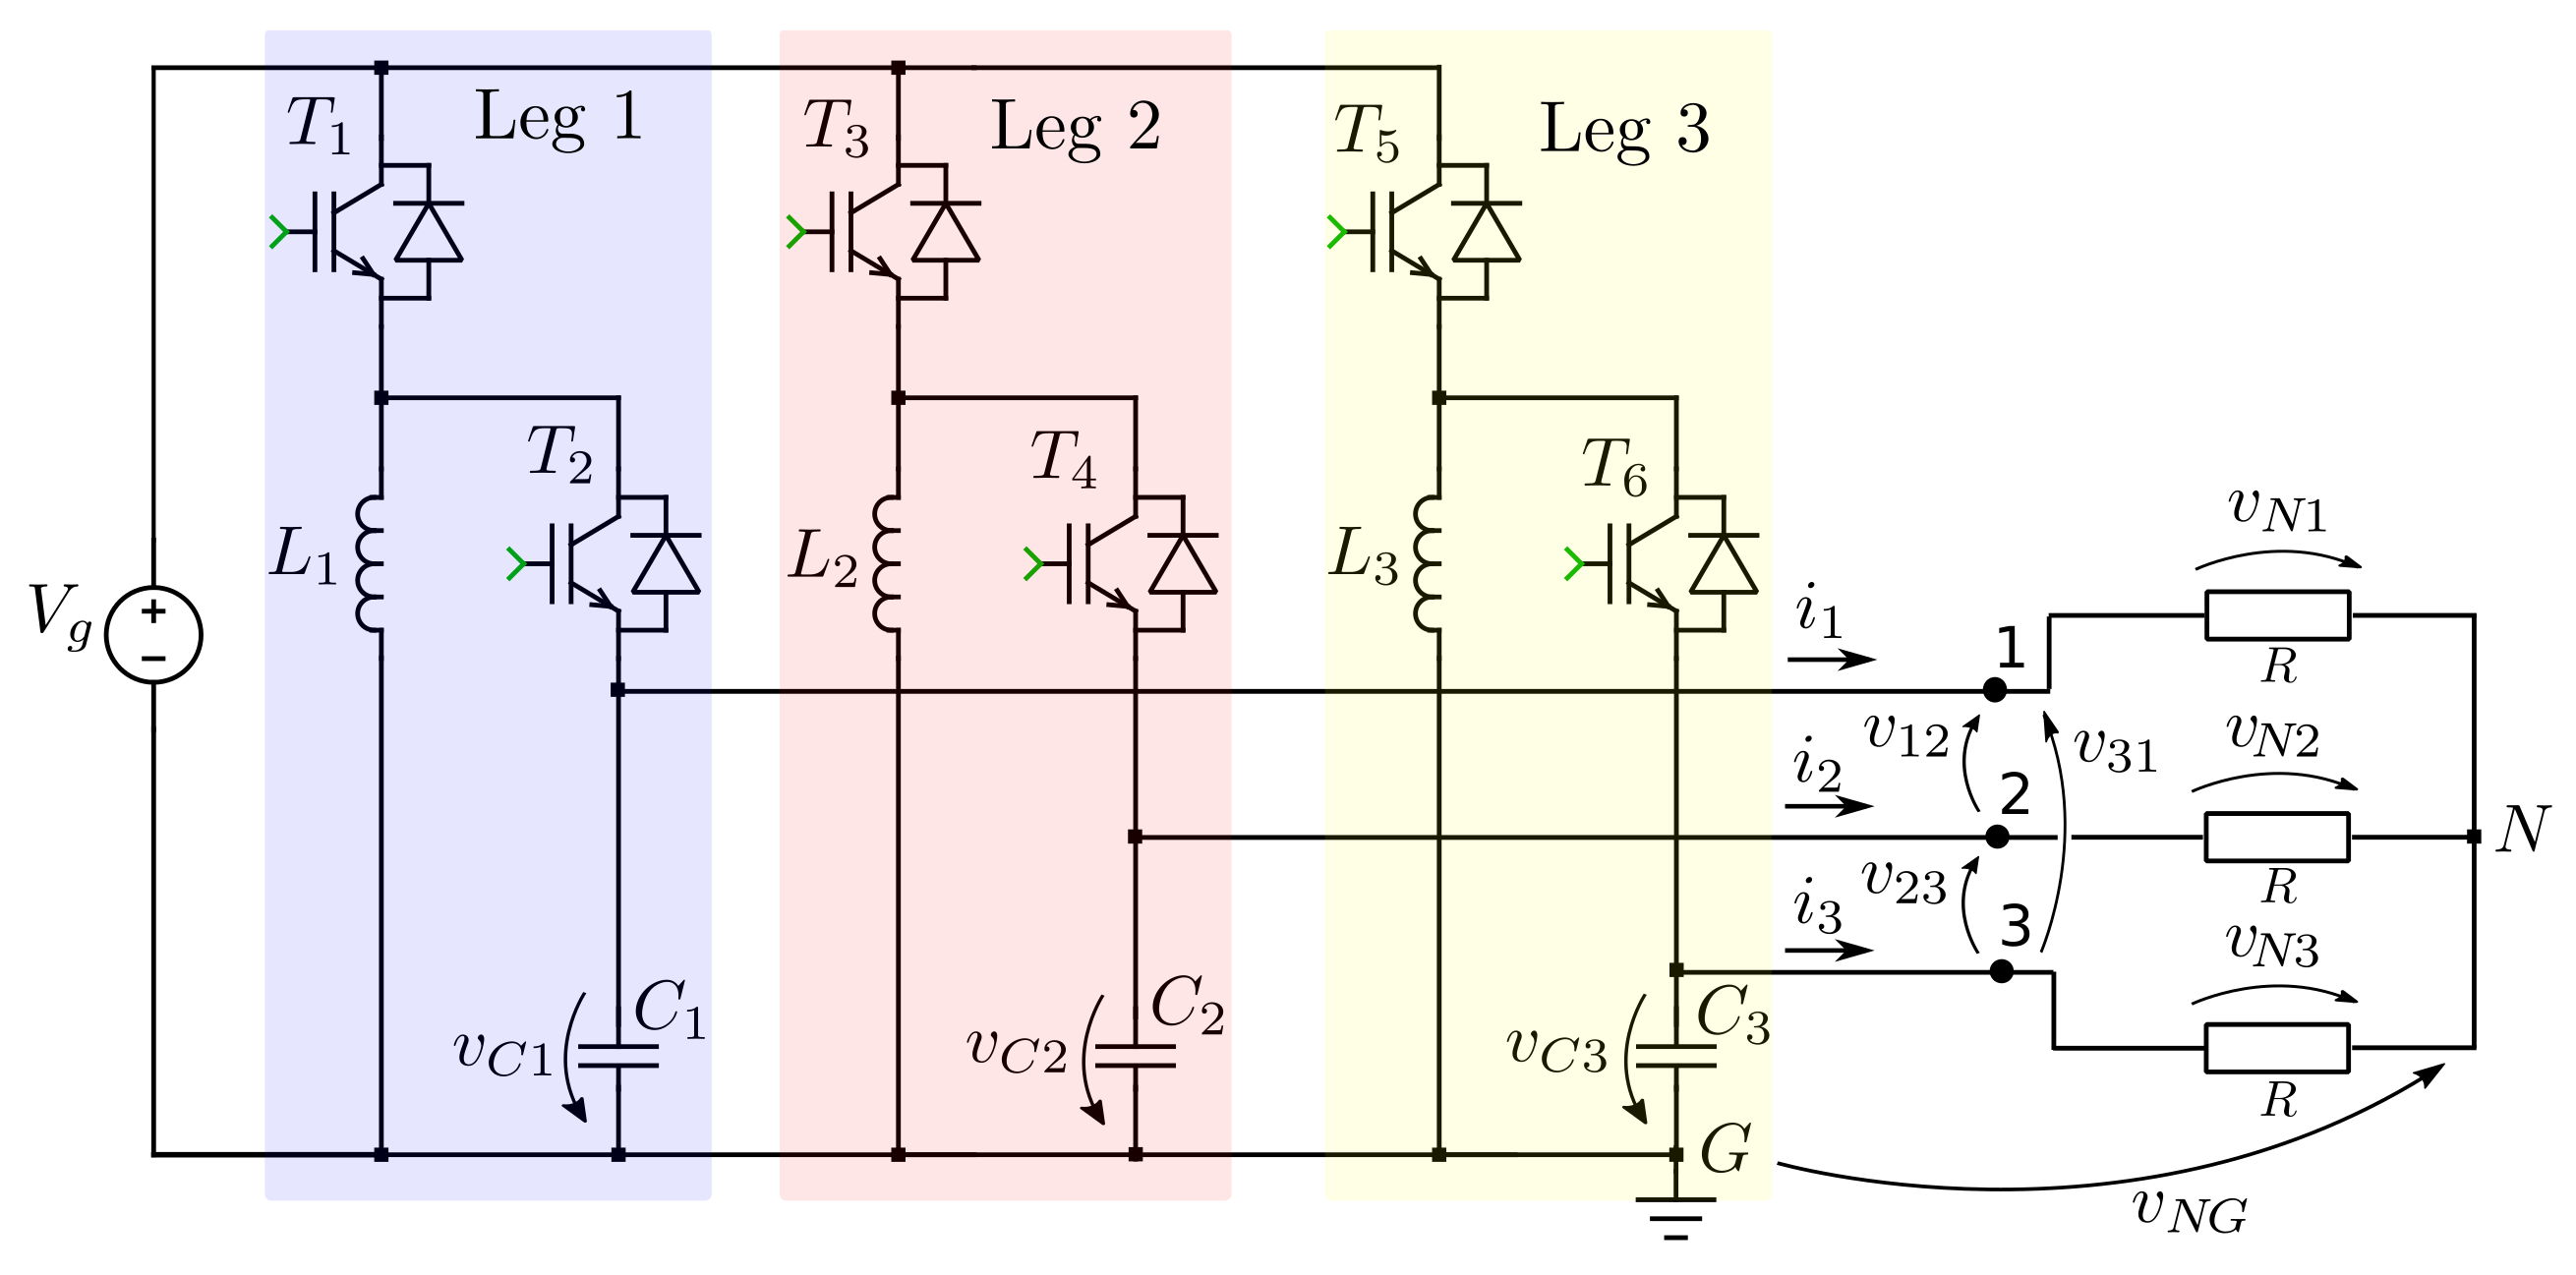
Figure 1.
Three-phase Buck-Boost inverter topology.
Figure 1.
Three-phase Buck-Boost inverter topology.
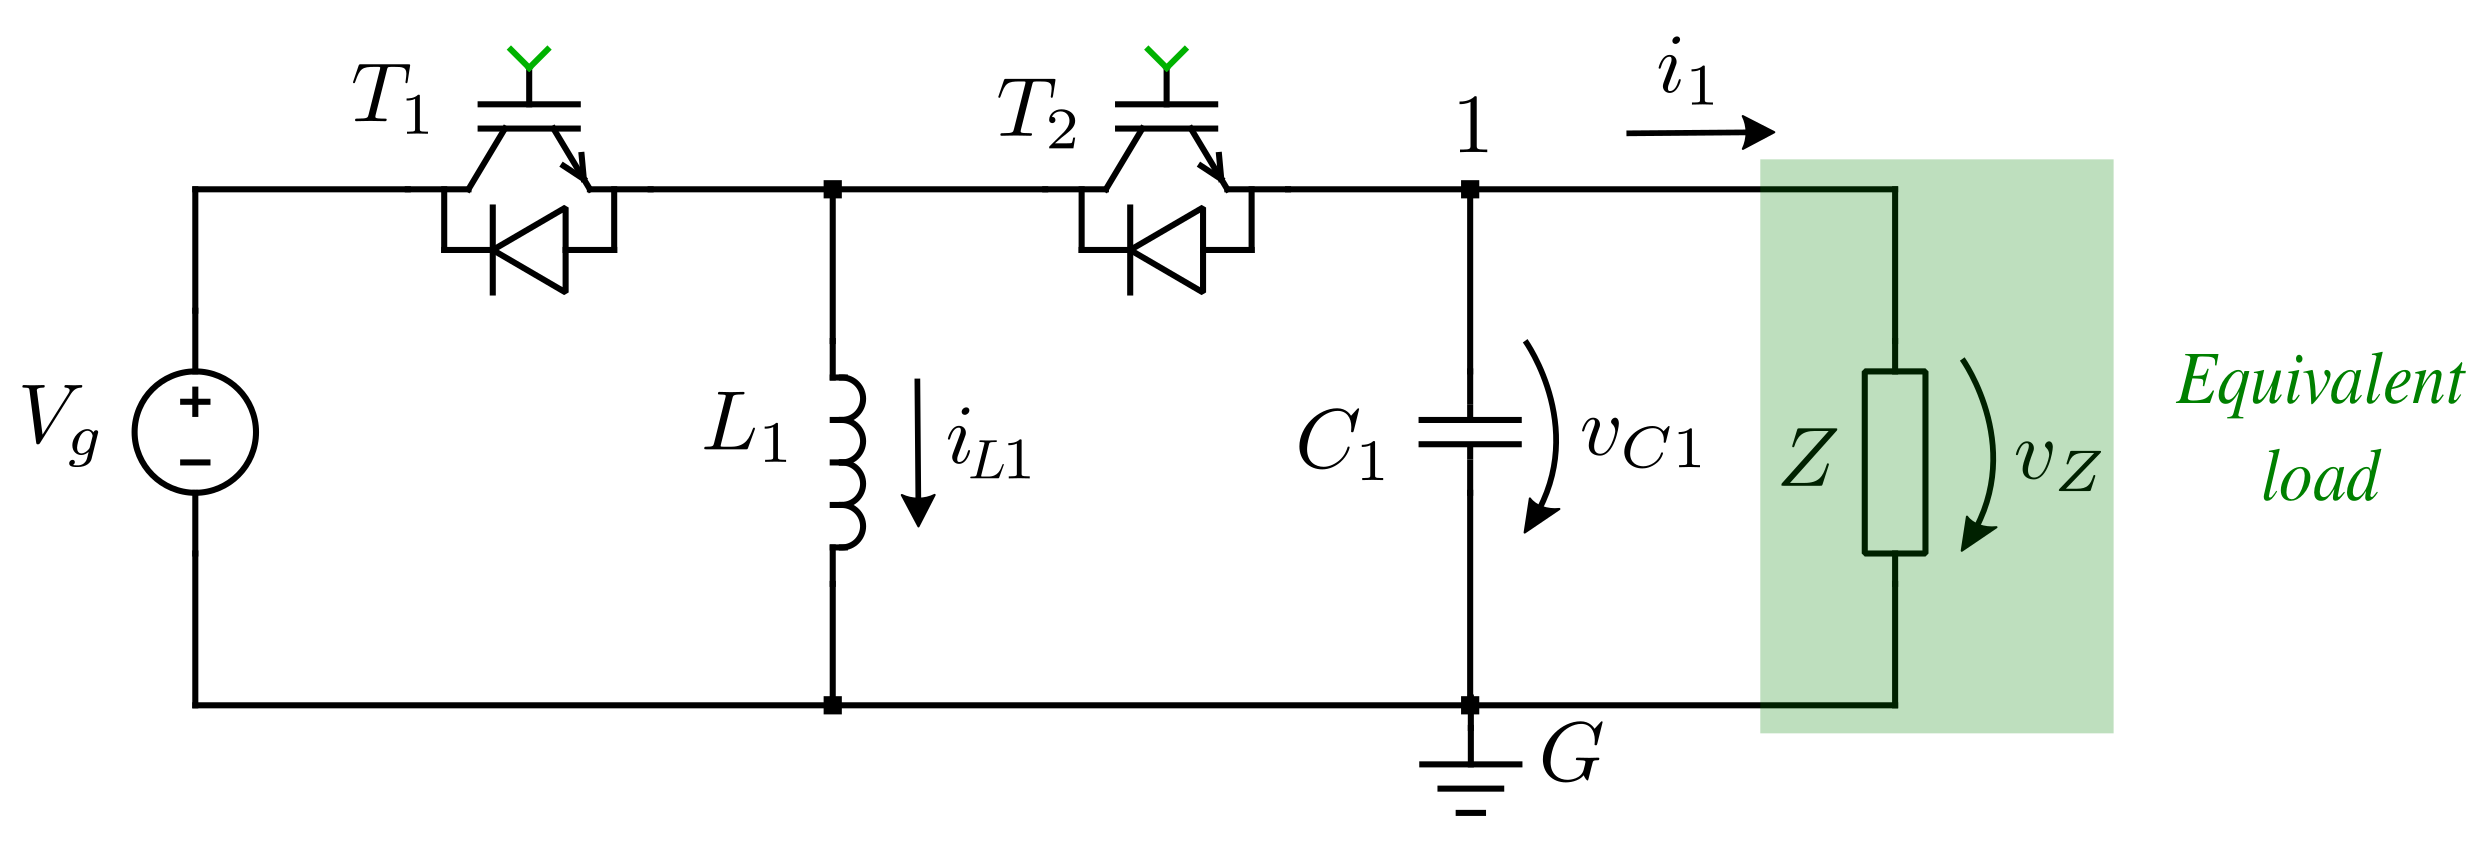
Figure 2.
Leg 1 equivalent circuit.
Figure 2.
Leg 1 equivalent circuit.
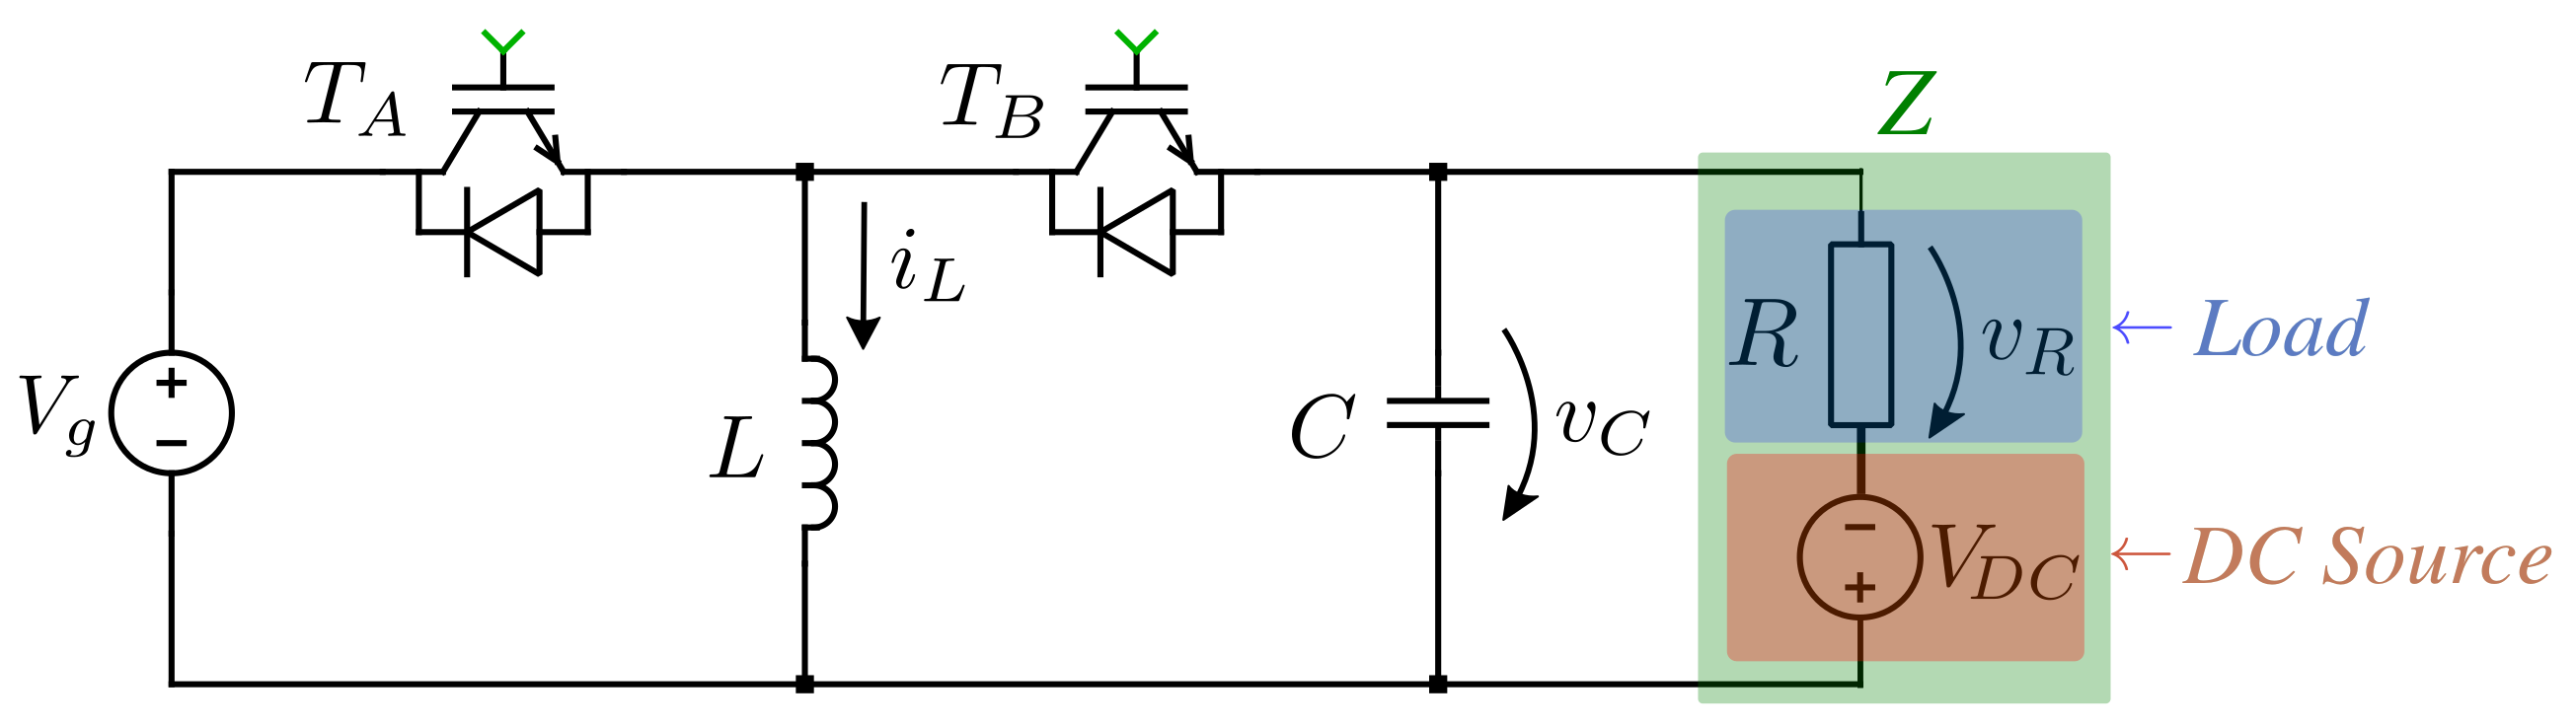
Figure 3.
Single-phase equivalent circuit.
Figure 3.
Single-phase equivalent circuit.
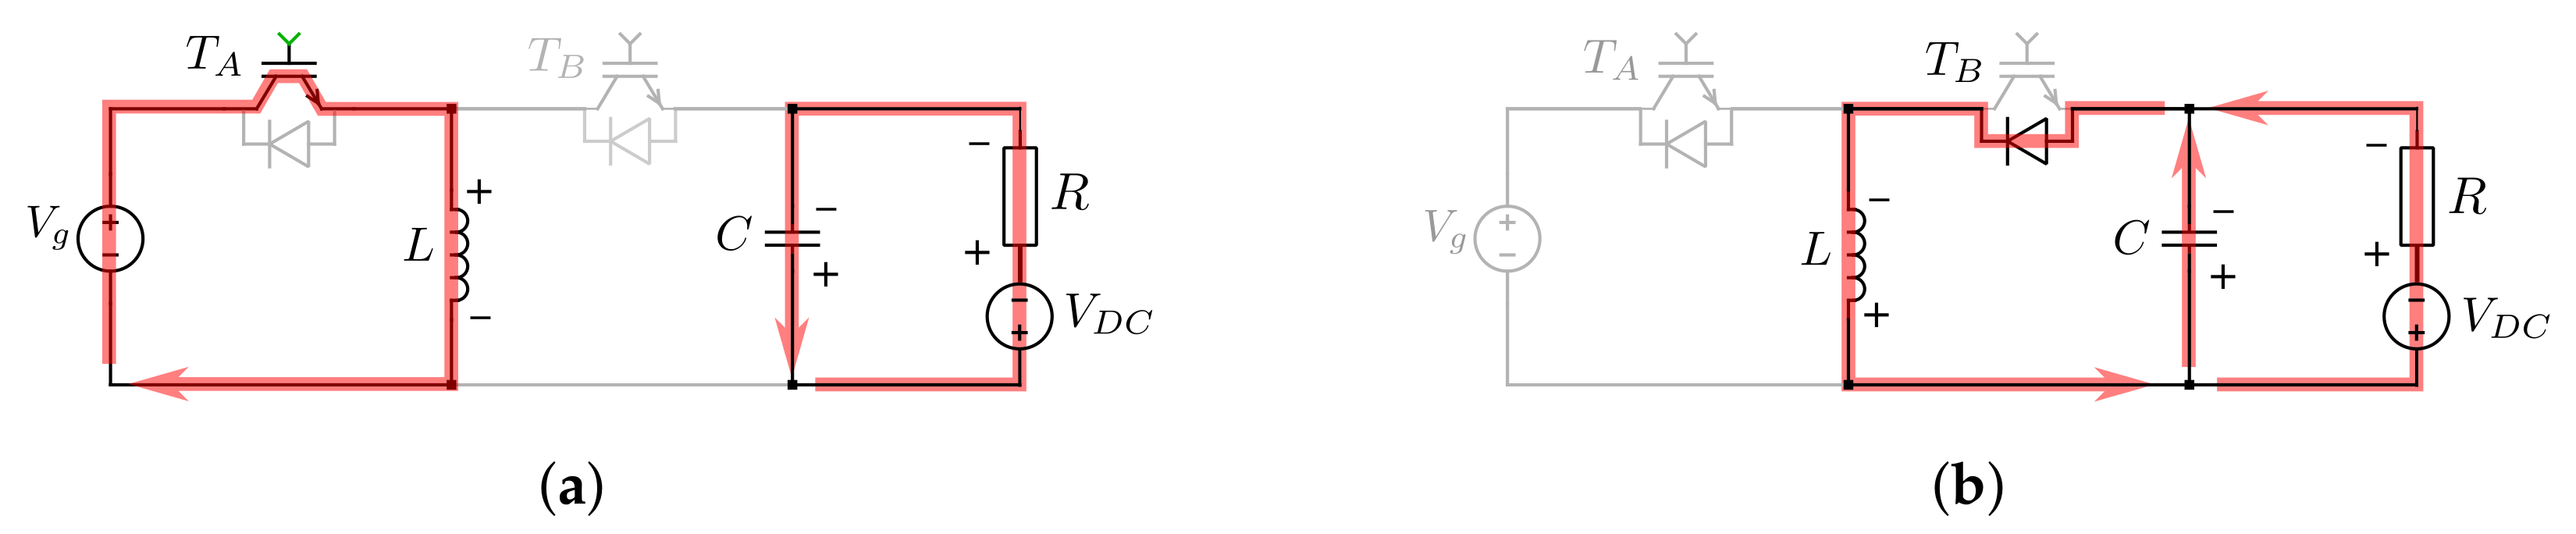
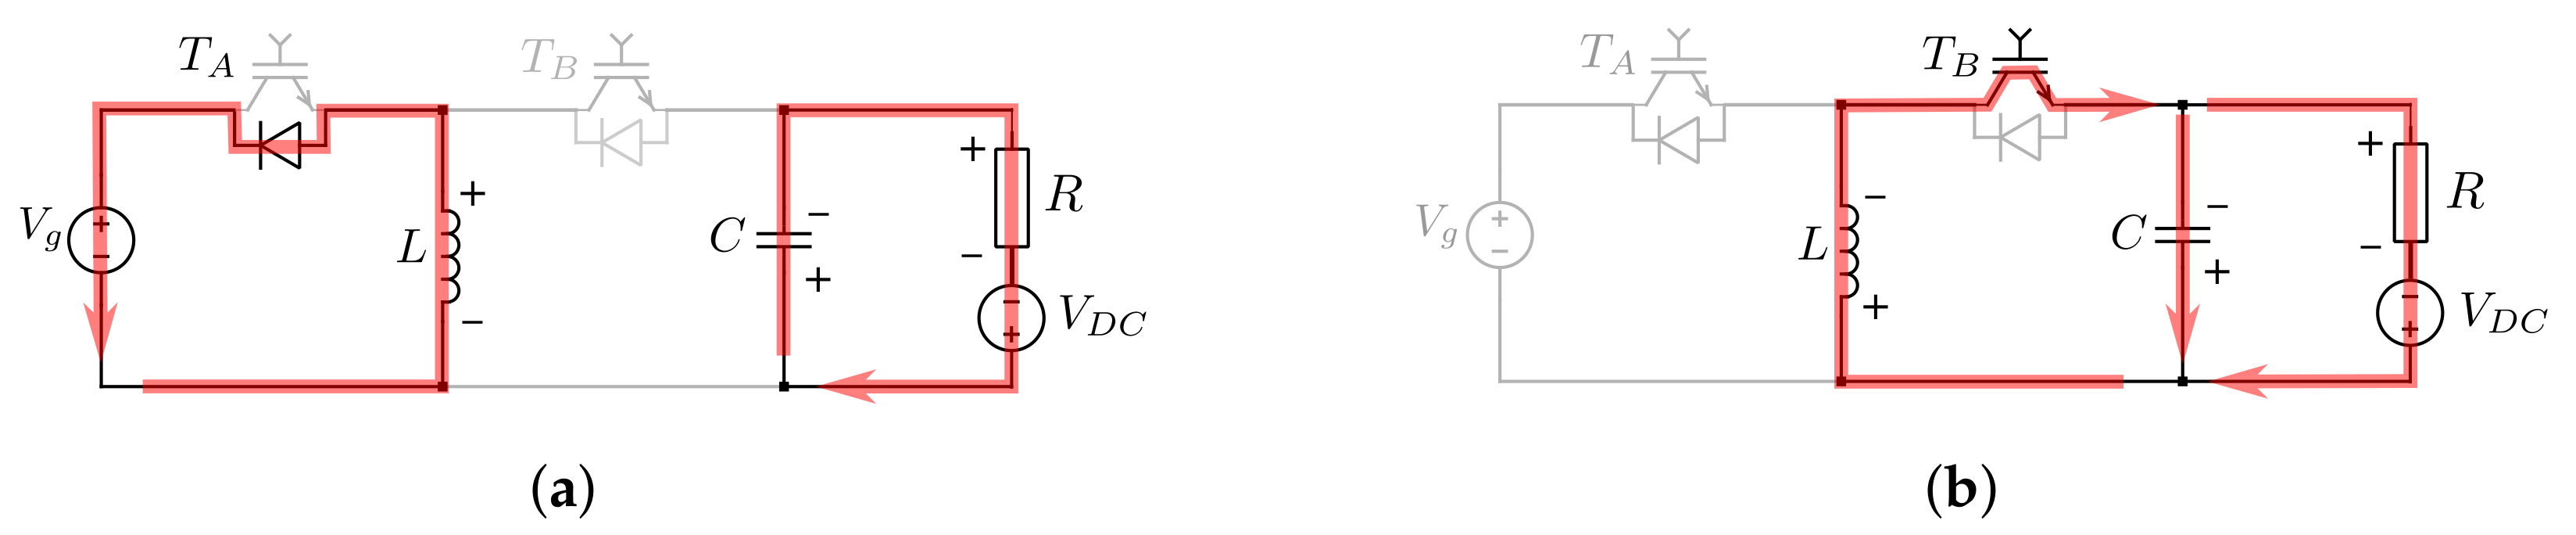
Figure 4.
Steps of operation in each half cycle of R load voltage.
Figure 4.
Steps of operation in each half cycle of R load voltage.
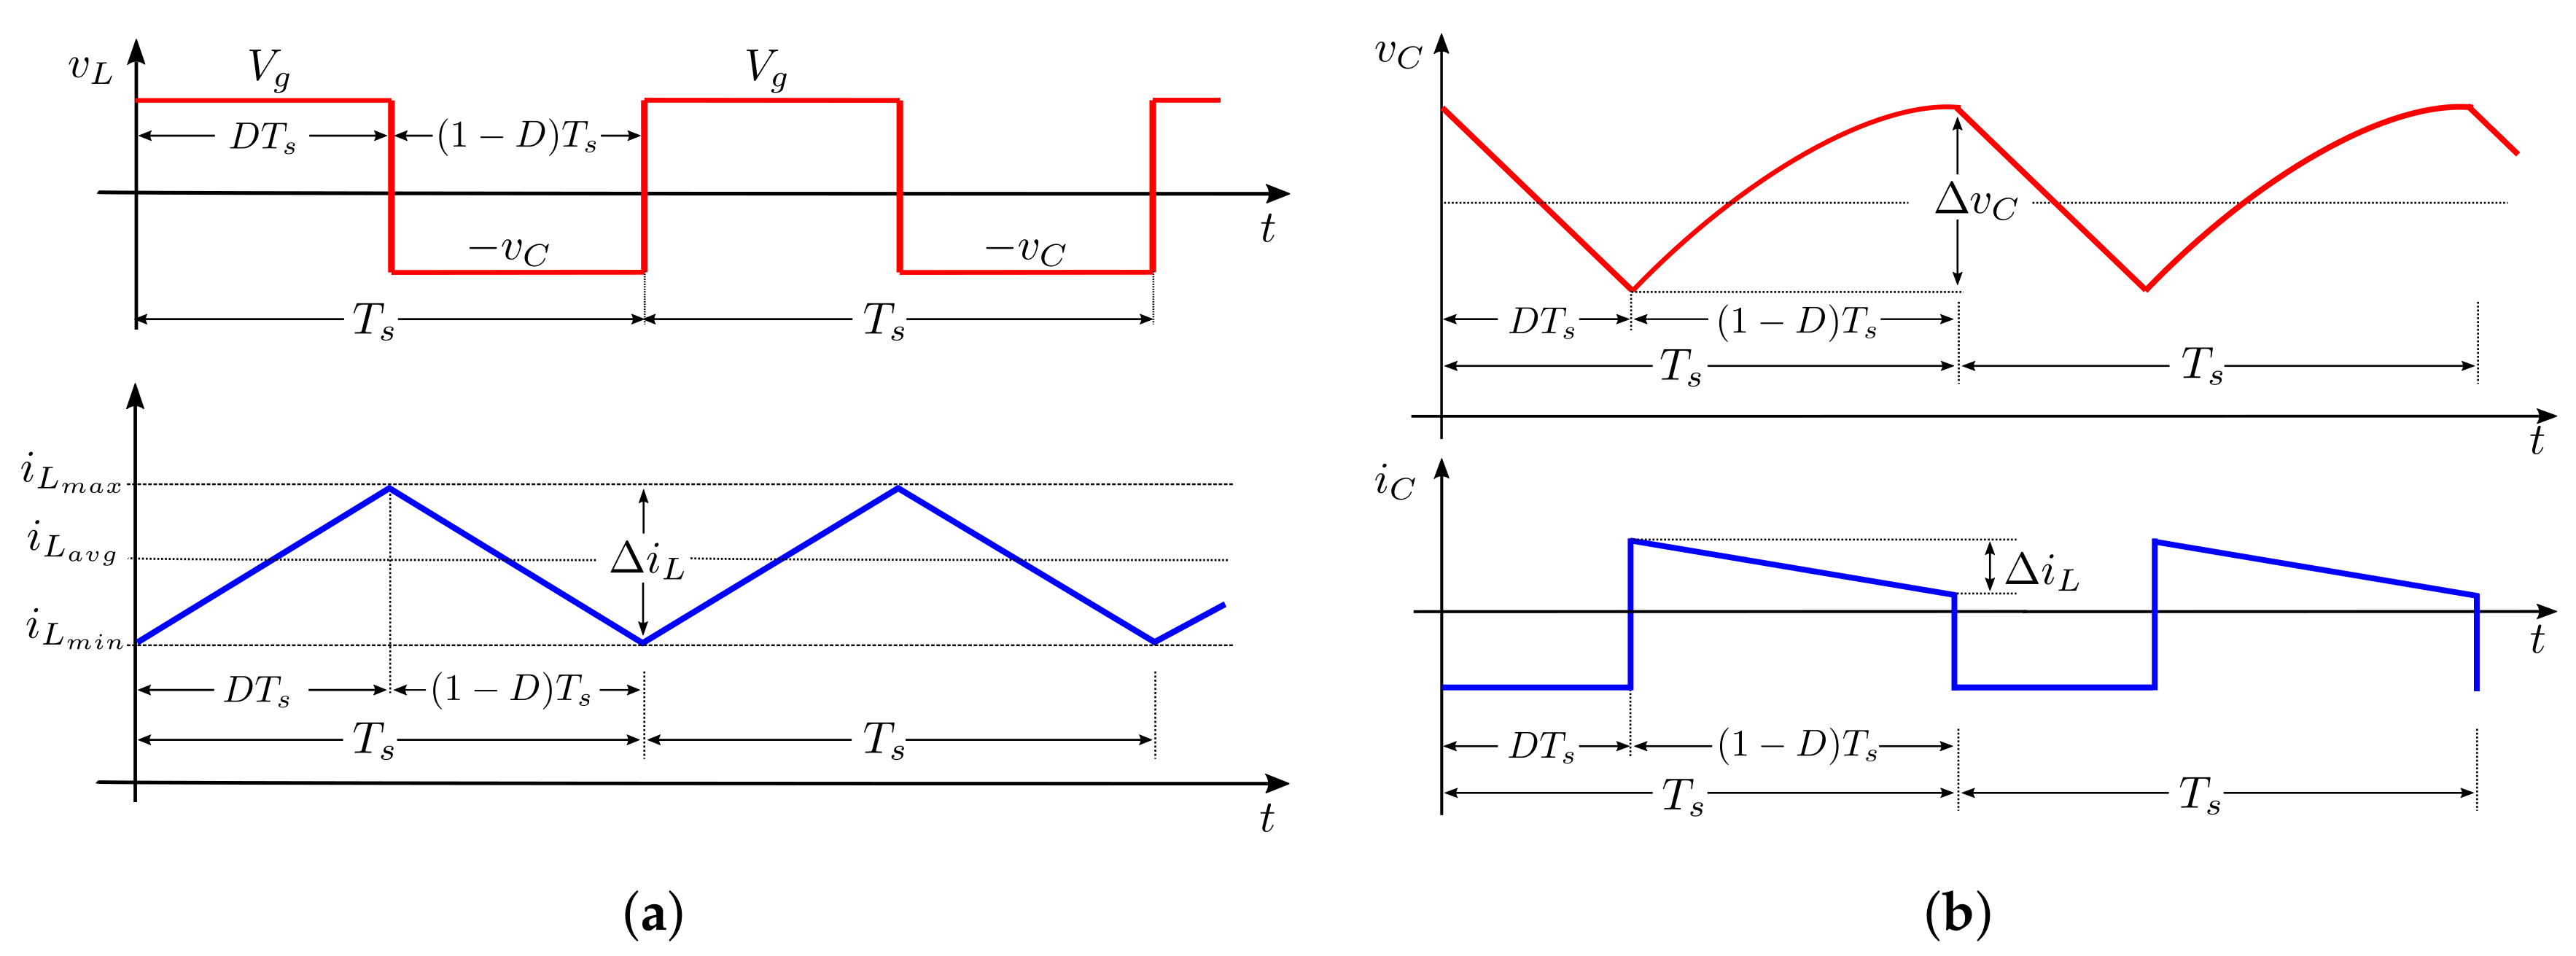
Figure 7.
Stationary waveforms of inductors and capacitors: (a) Inductor waveforms; (b) Capacitor waveforms.
Figure 7.
Stationary waveforms of inductors and capacitors: (a) Inductor waveforms; (b) Capacitor waveforms.
Figure 8.
Single-phase equivalent circuit model PLECS schematic.
Figure 8.
Single-phase equivalent circuit model PLECS schematic.
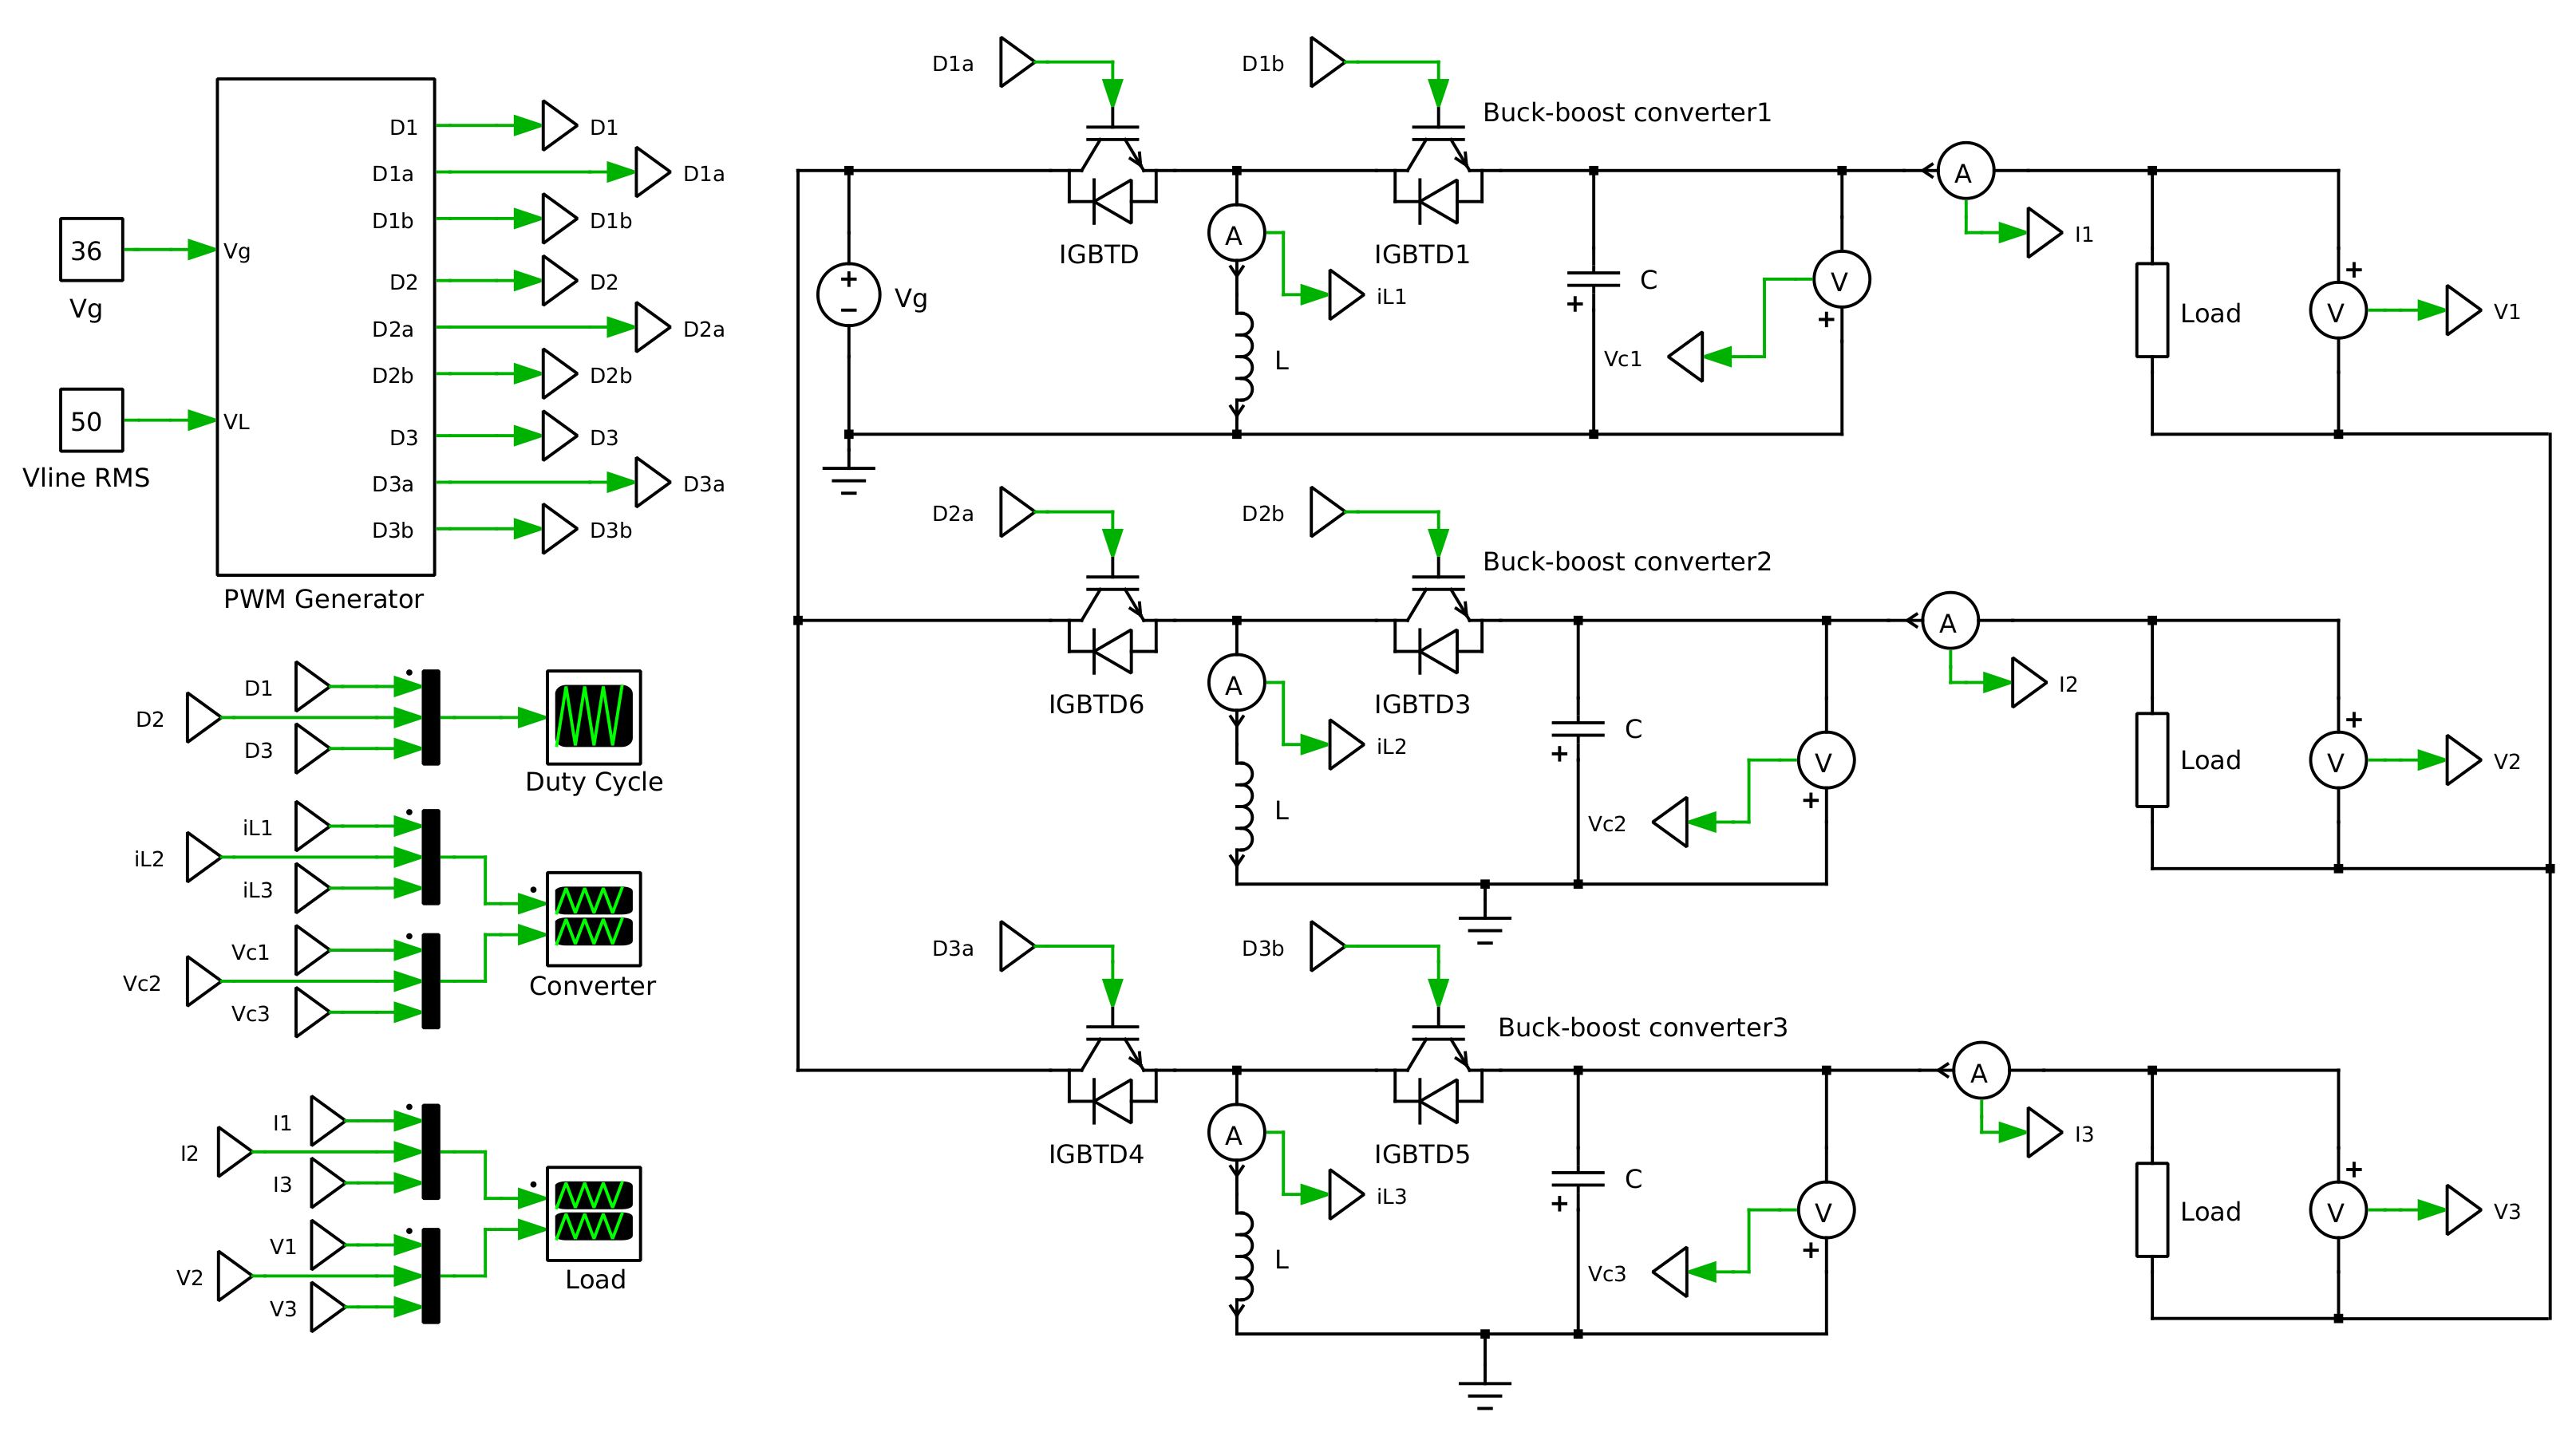
Figure 9.
Three-phase inverter PLECS schematic.
Figure 9.
Three-phase inverter PLECS schematic.
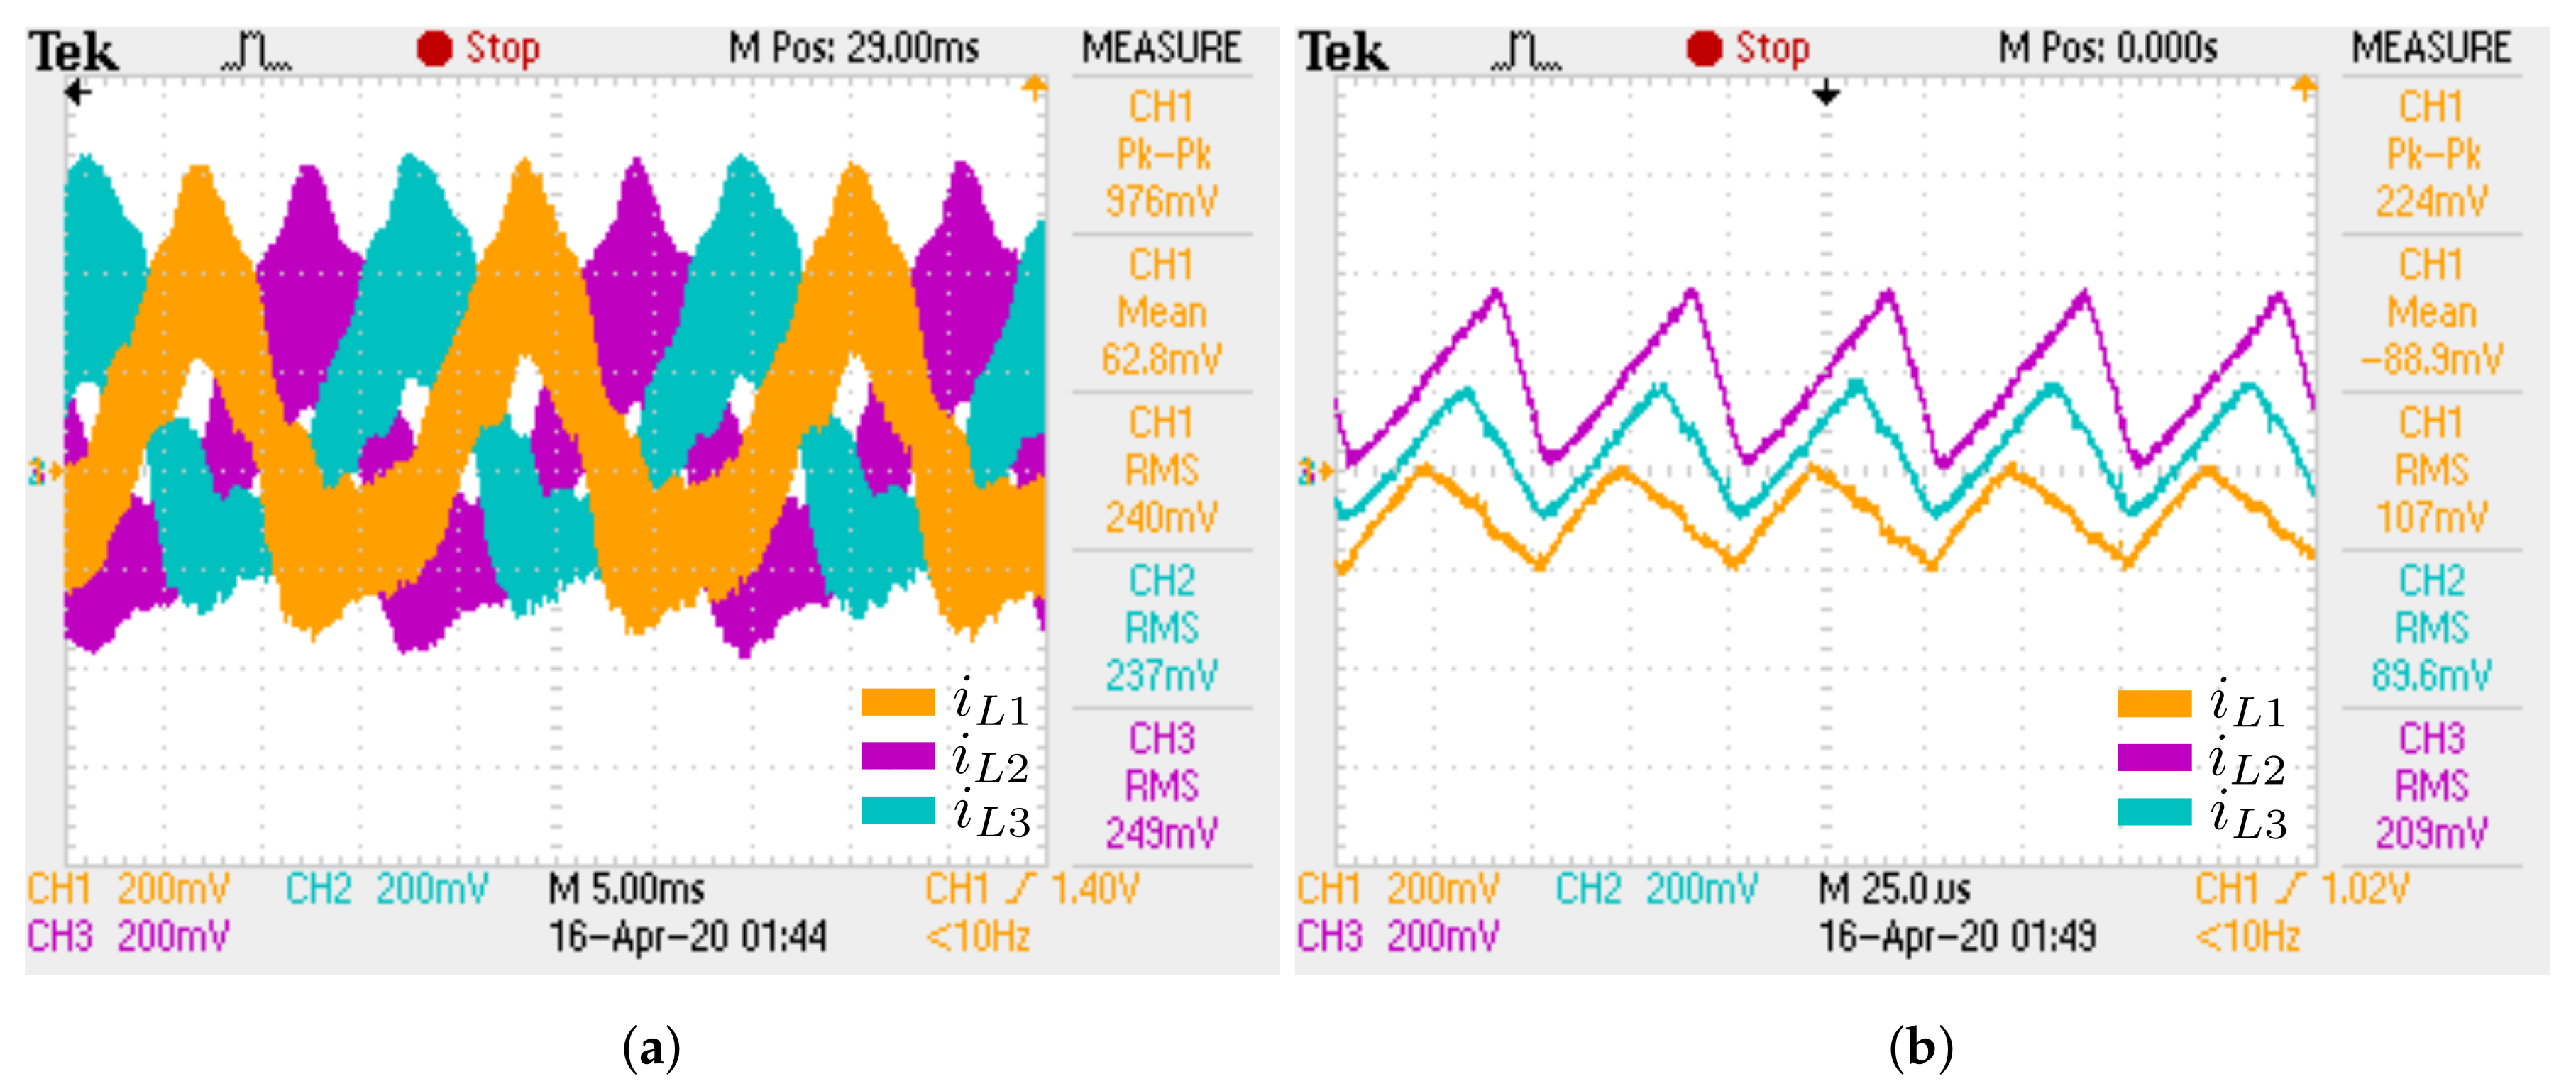
Figure 11.
Inductor currents for R load case: (a) Three-phase model; (b) Single-phase and three-phase
(leg 1) models.
Figure 11.
Inductor currents for R load case: (a) Three-phase model; (b) Single-phase and three-phase
(leg 1) models.
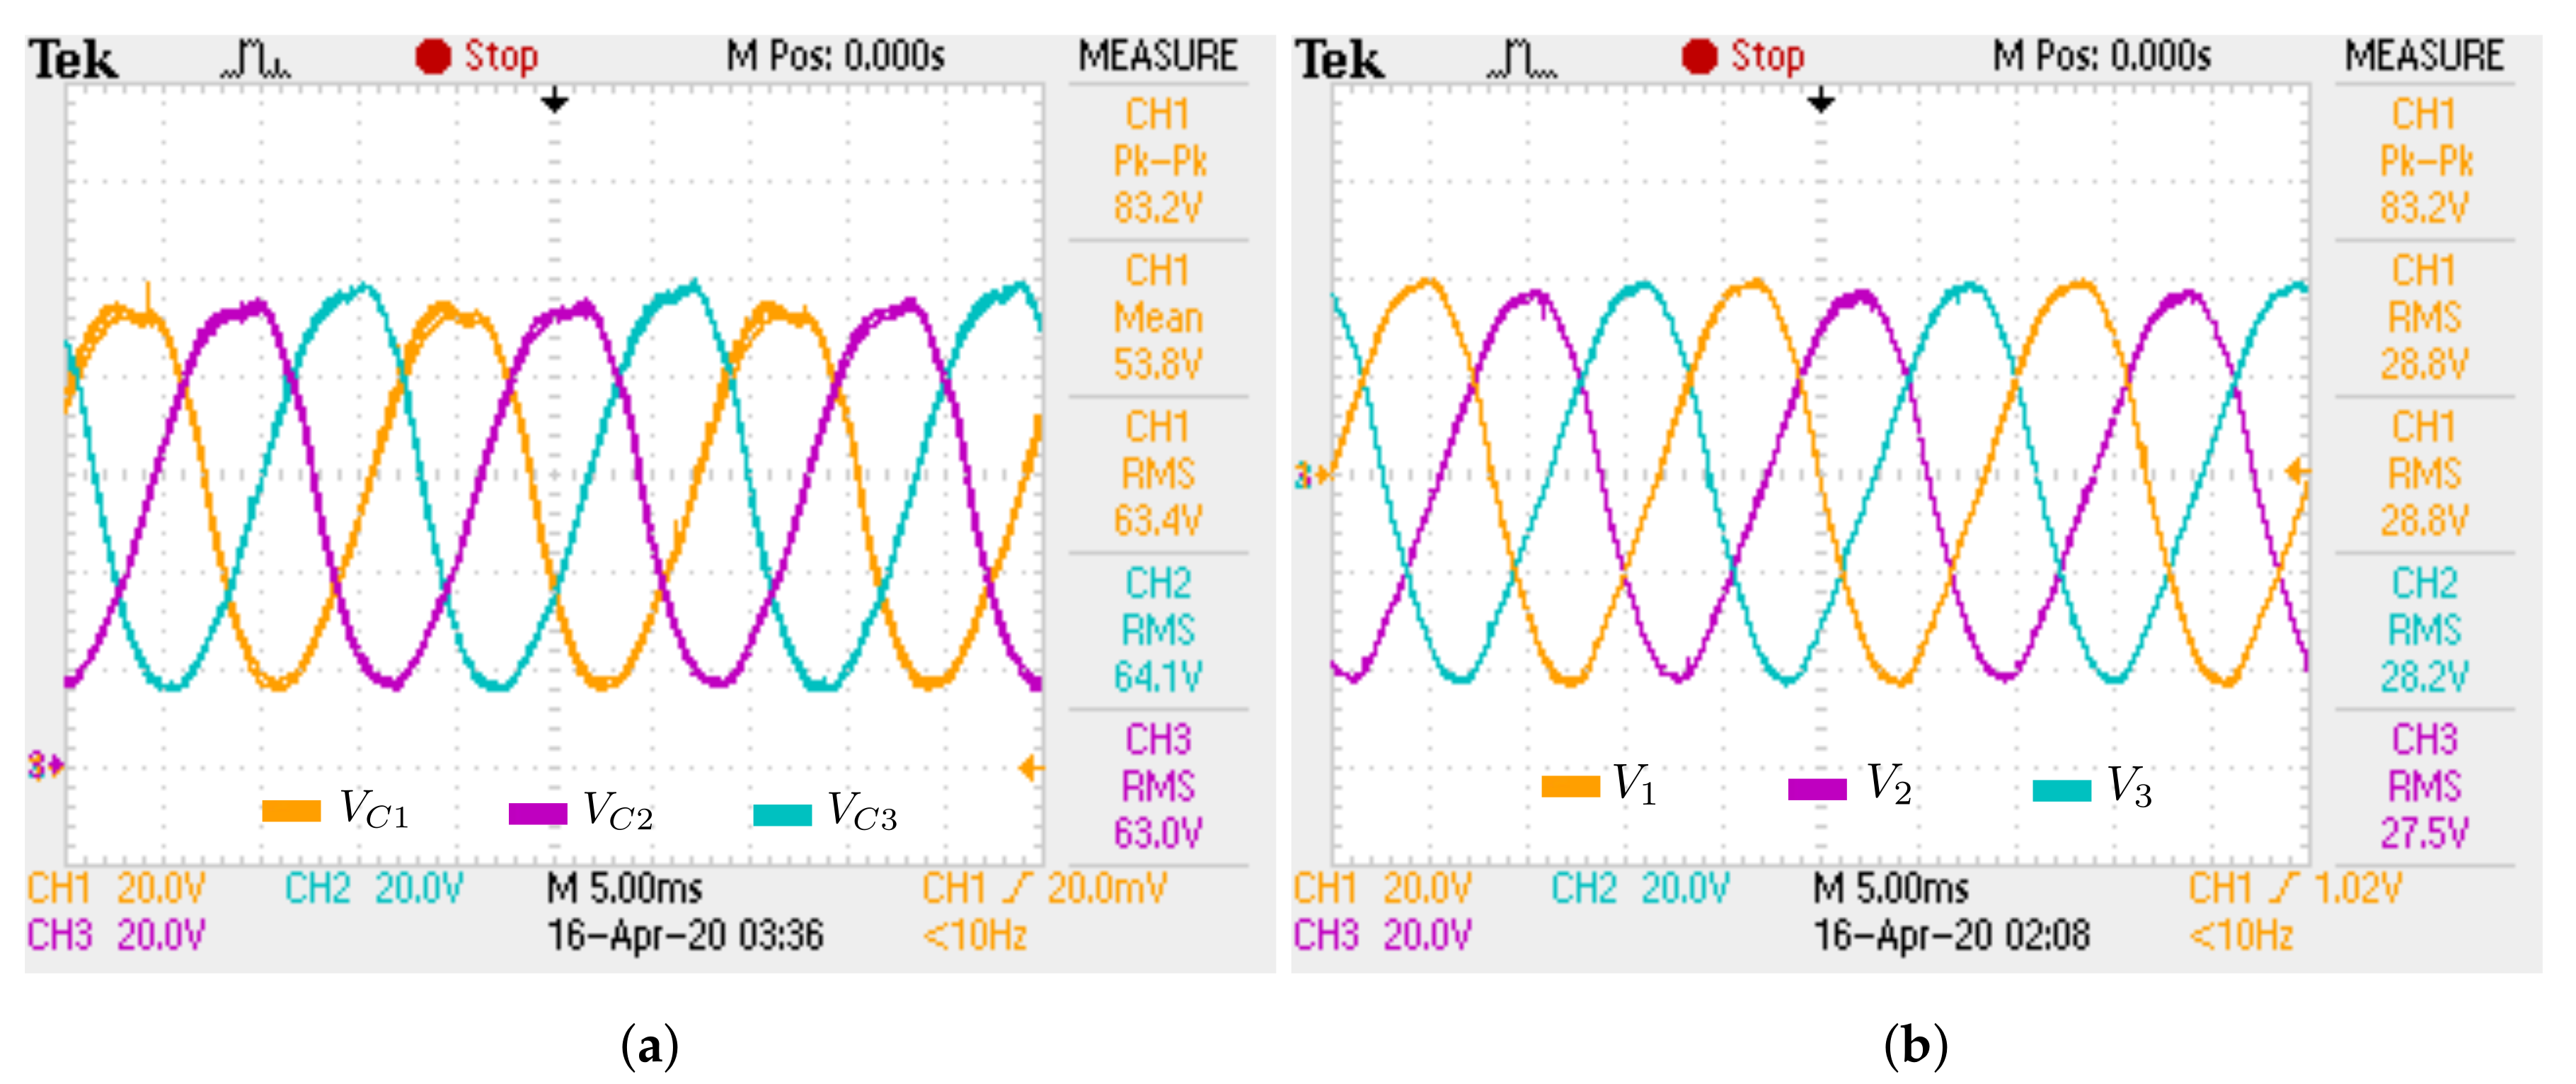
Figure 12.
Capacitor voltages for R load case: (a) Three-phase model; (b) Single-phase and three-phase
(leg 1) models.
Figure 12.
Capacitor voltages for R load case: (a) Three-phase model; (b) Single-phase and three-phase
(leg 1) models.
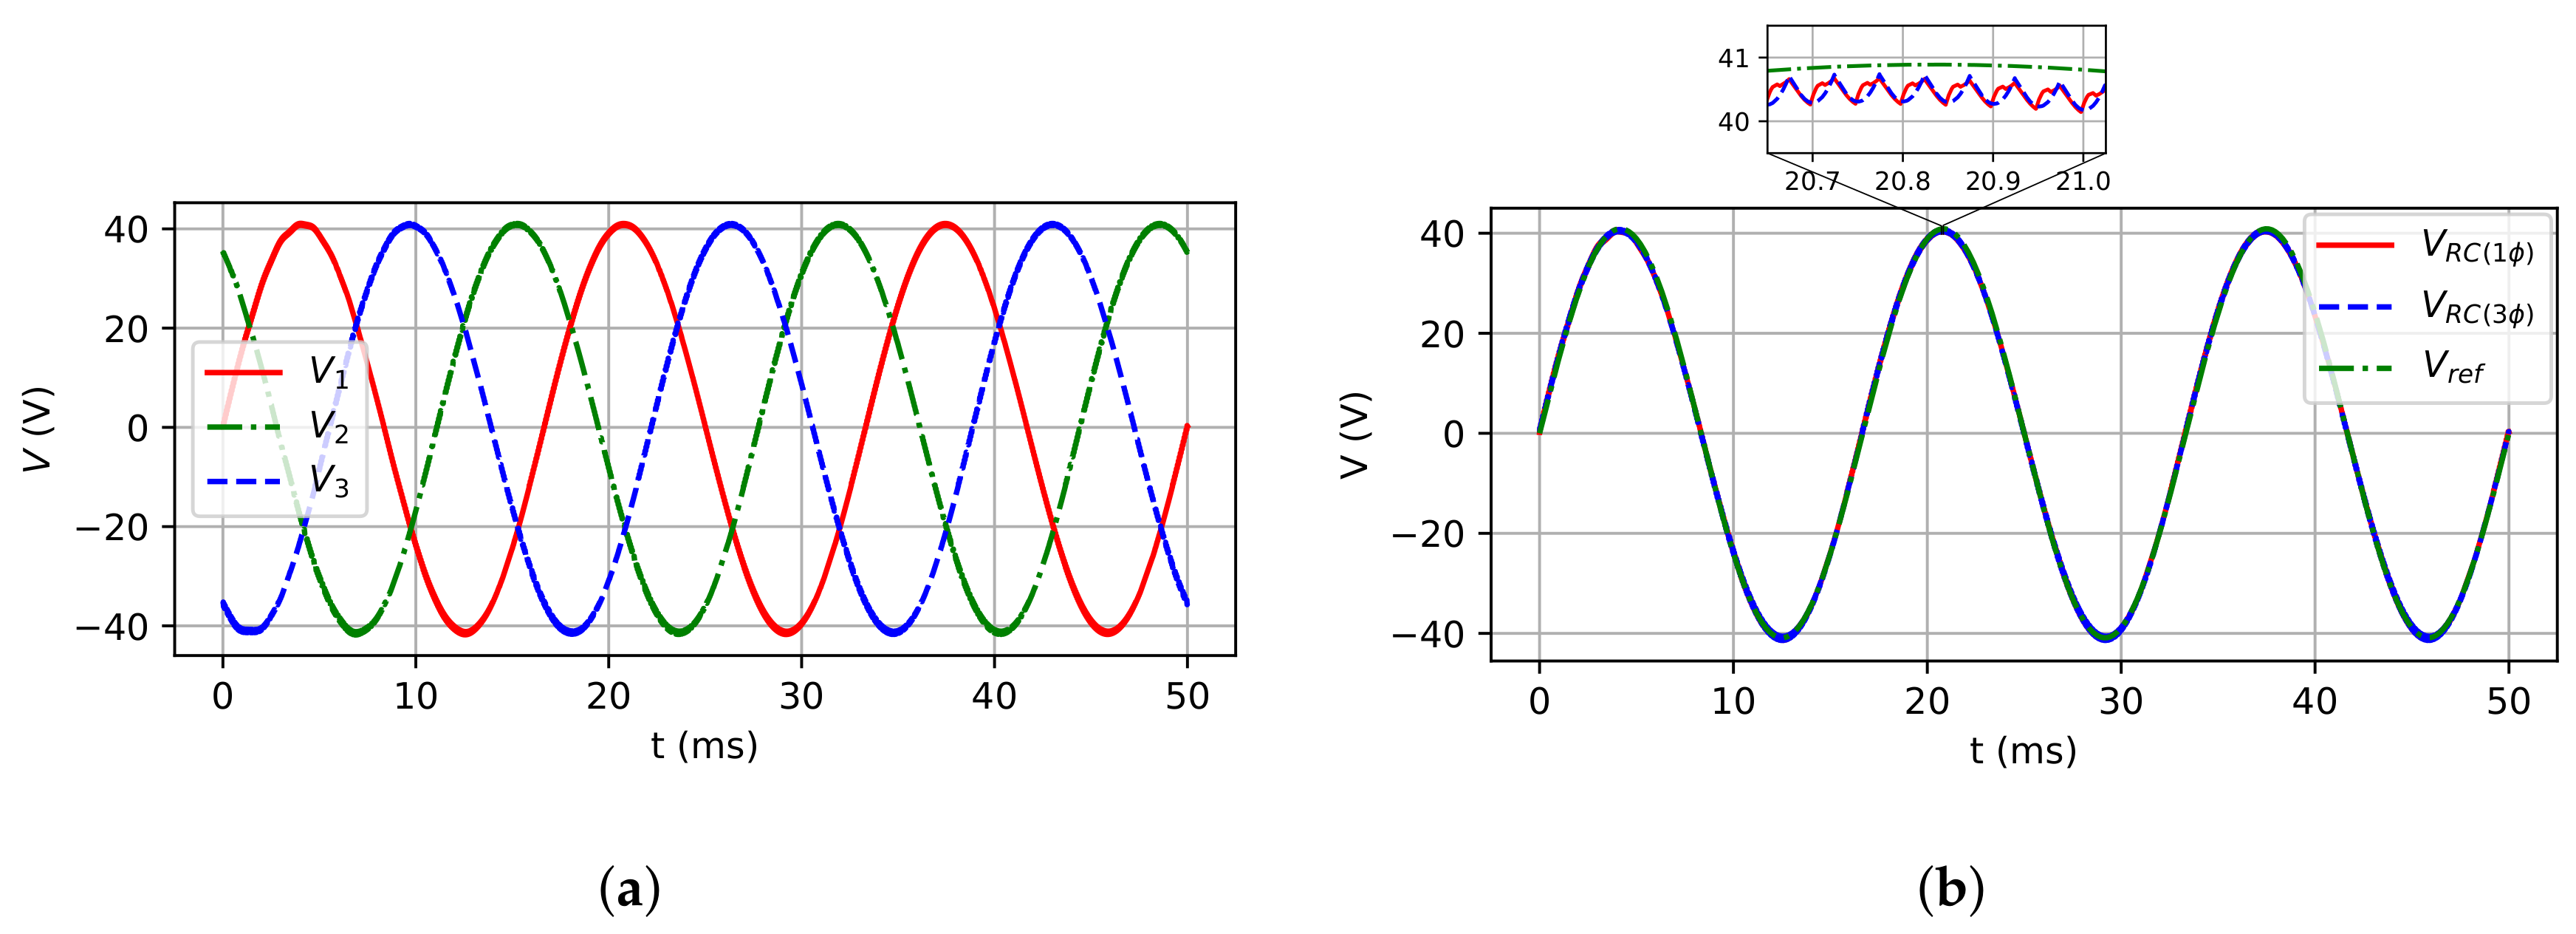
Figure 13.
Load phase voltages for R load case: (a) Three-phase model; (b) Single-phase and three-phase
(leg 1) models.
Figure 13.
Load phase voltages for R load case: (a) Three-phase model; (b) Single-phase and three-phase
(leg 1) models.
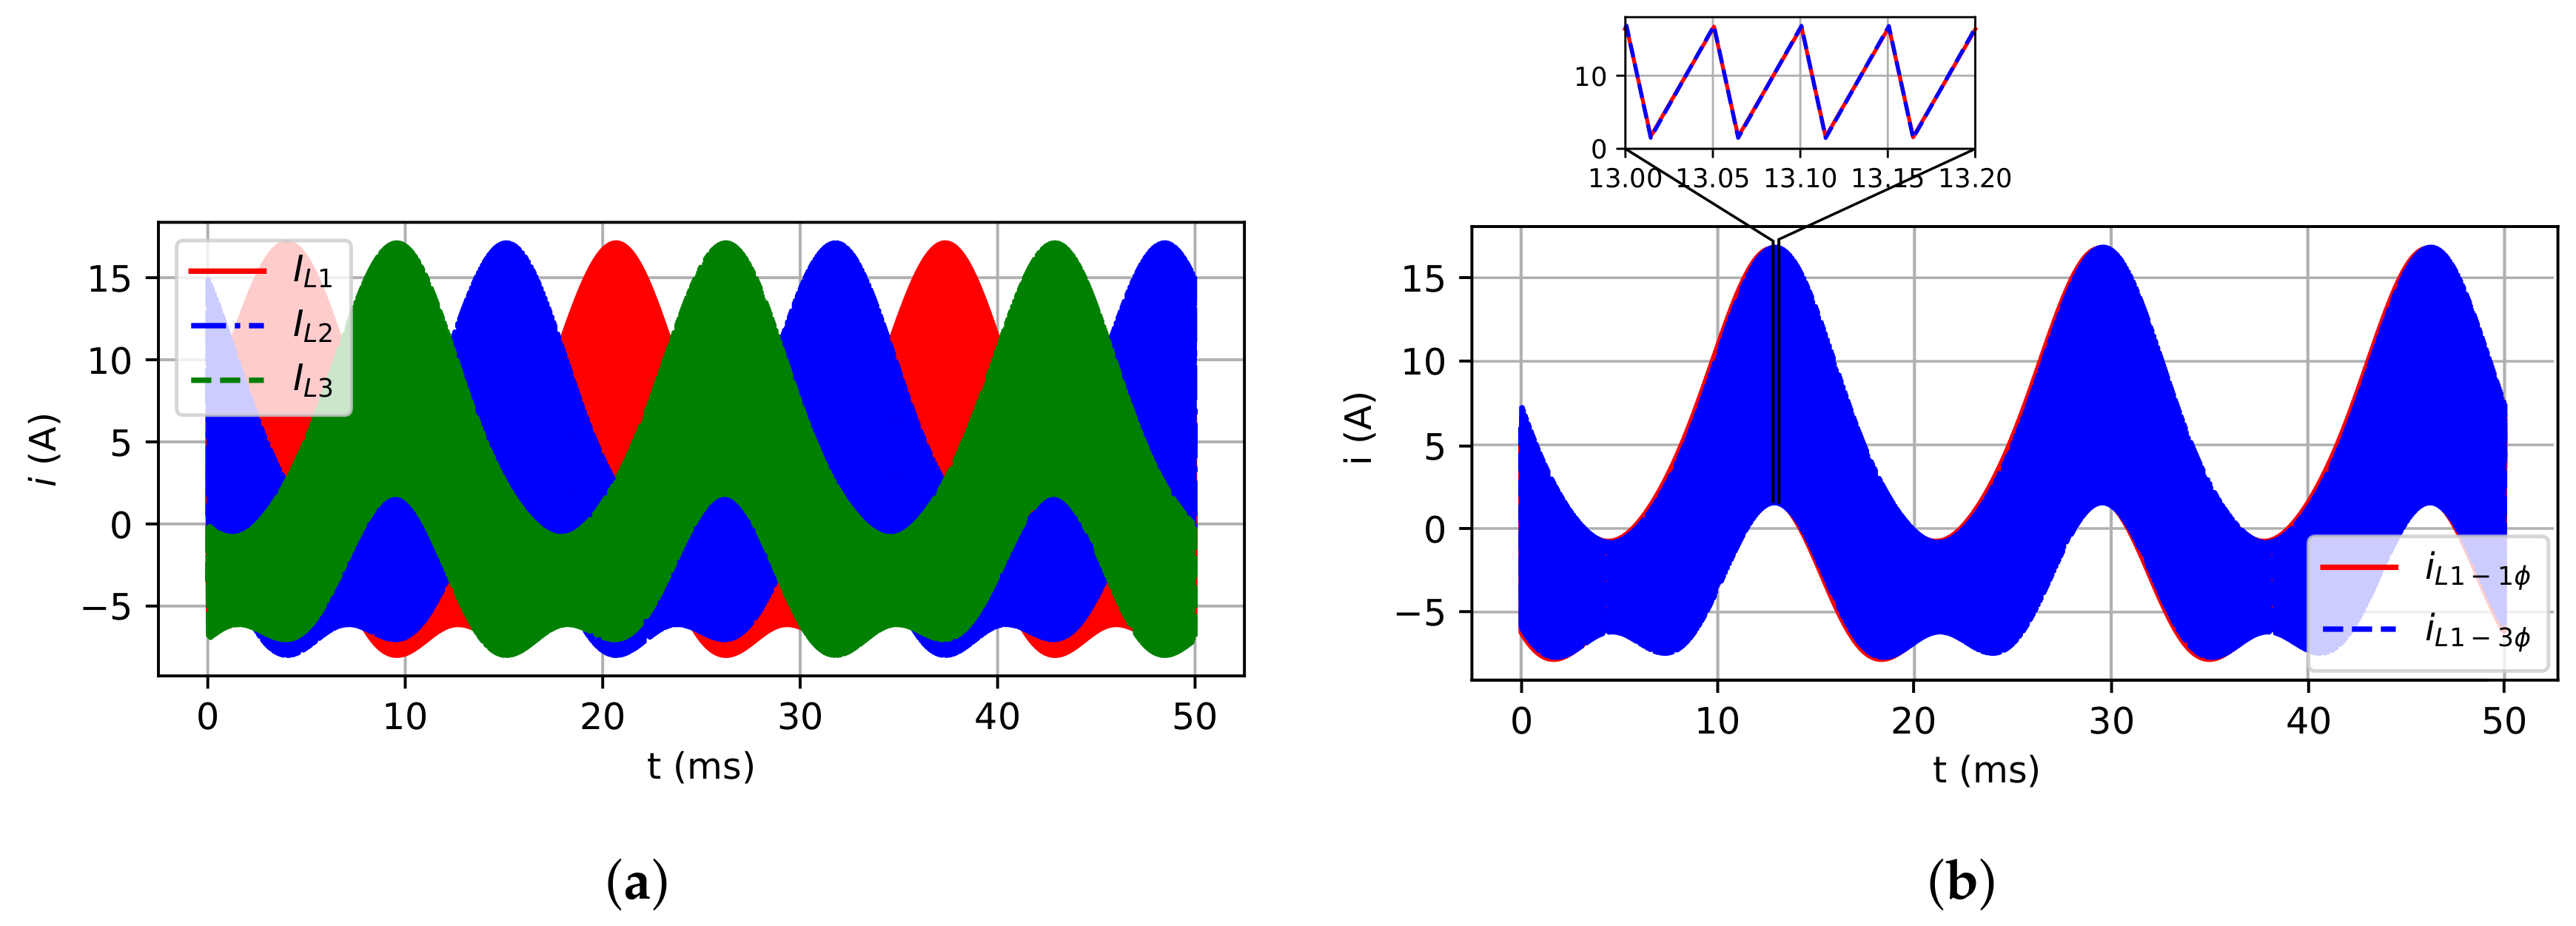
Figure 14.
Inductor currents for RL load case: (a) Three-phase model; (b) Single-phase and three-phase
(leg 1) models.
Figure 14.
Inductor currents for RL load case: (a) Three-phase model; (b) Single-phase and three-phase
(leg 1) models.
Figure 15.
Capacitor voltages for RL load case: (a) Three-phase model; (b) Single-phase and three-phase
(leg 1) models.
Figure 15.
Capacitor voltages for RL load case: (a) Three-phase model; (b) Single-phase and three-phase
(leg 1) models.
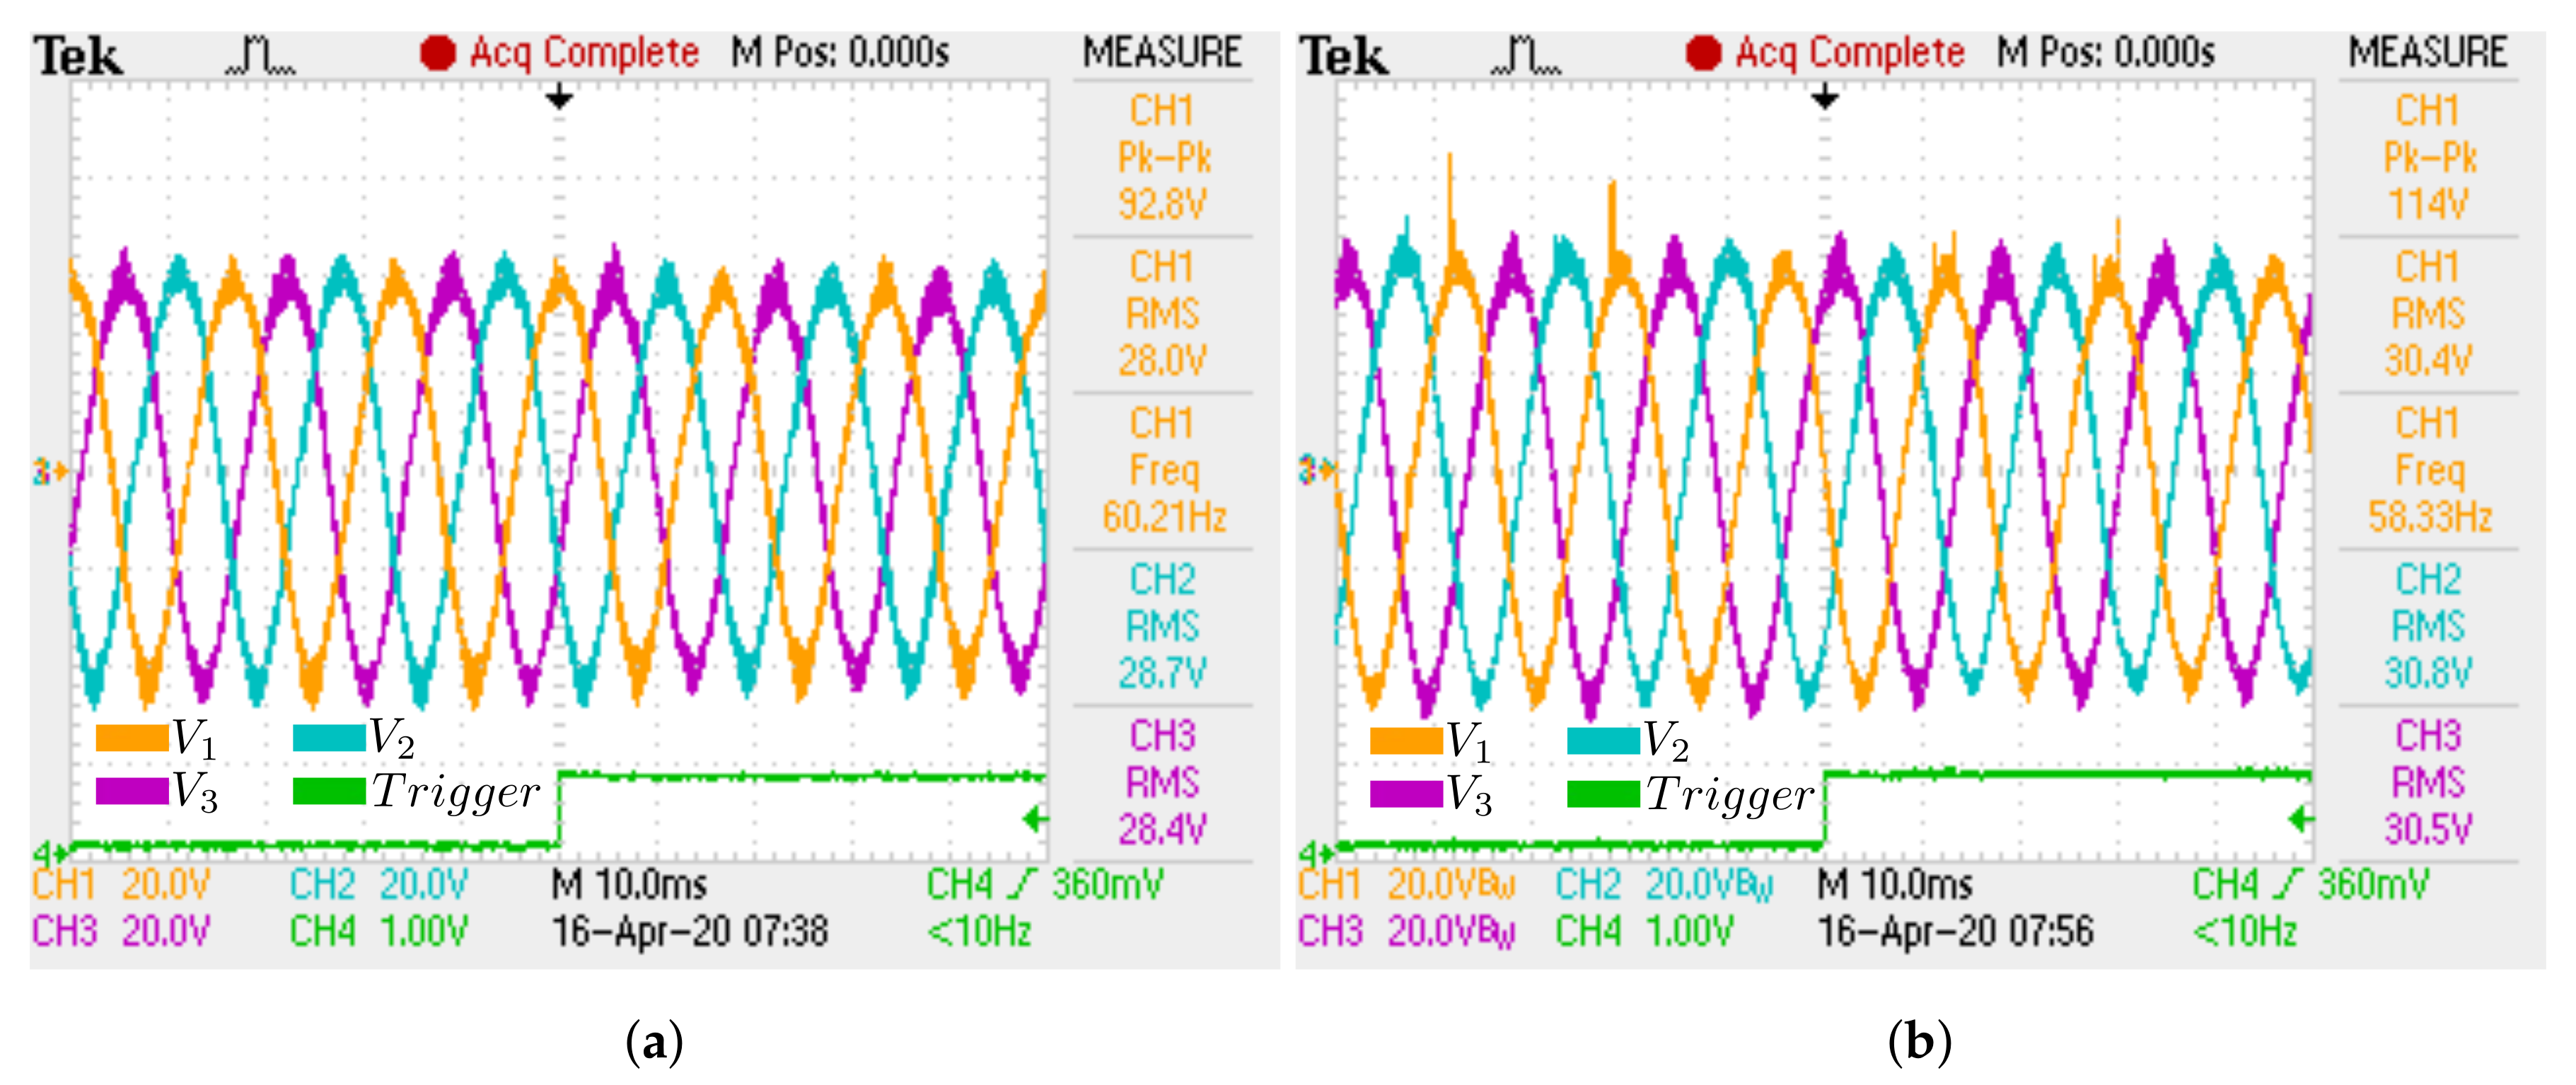
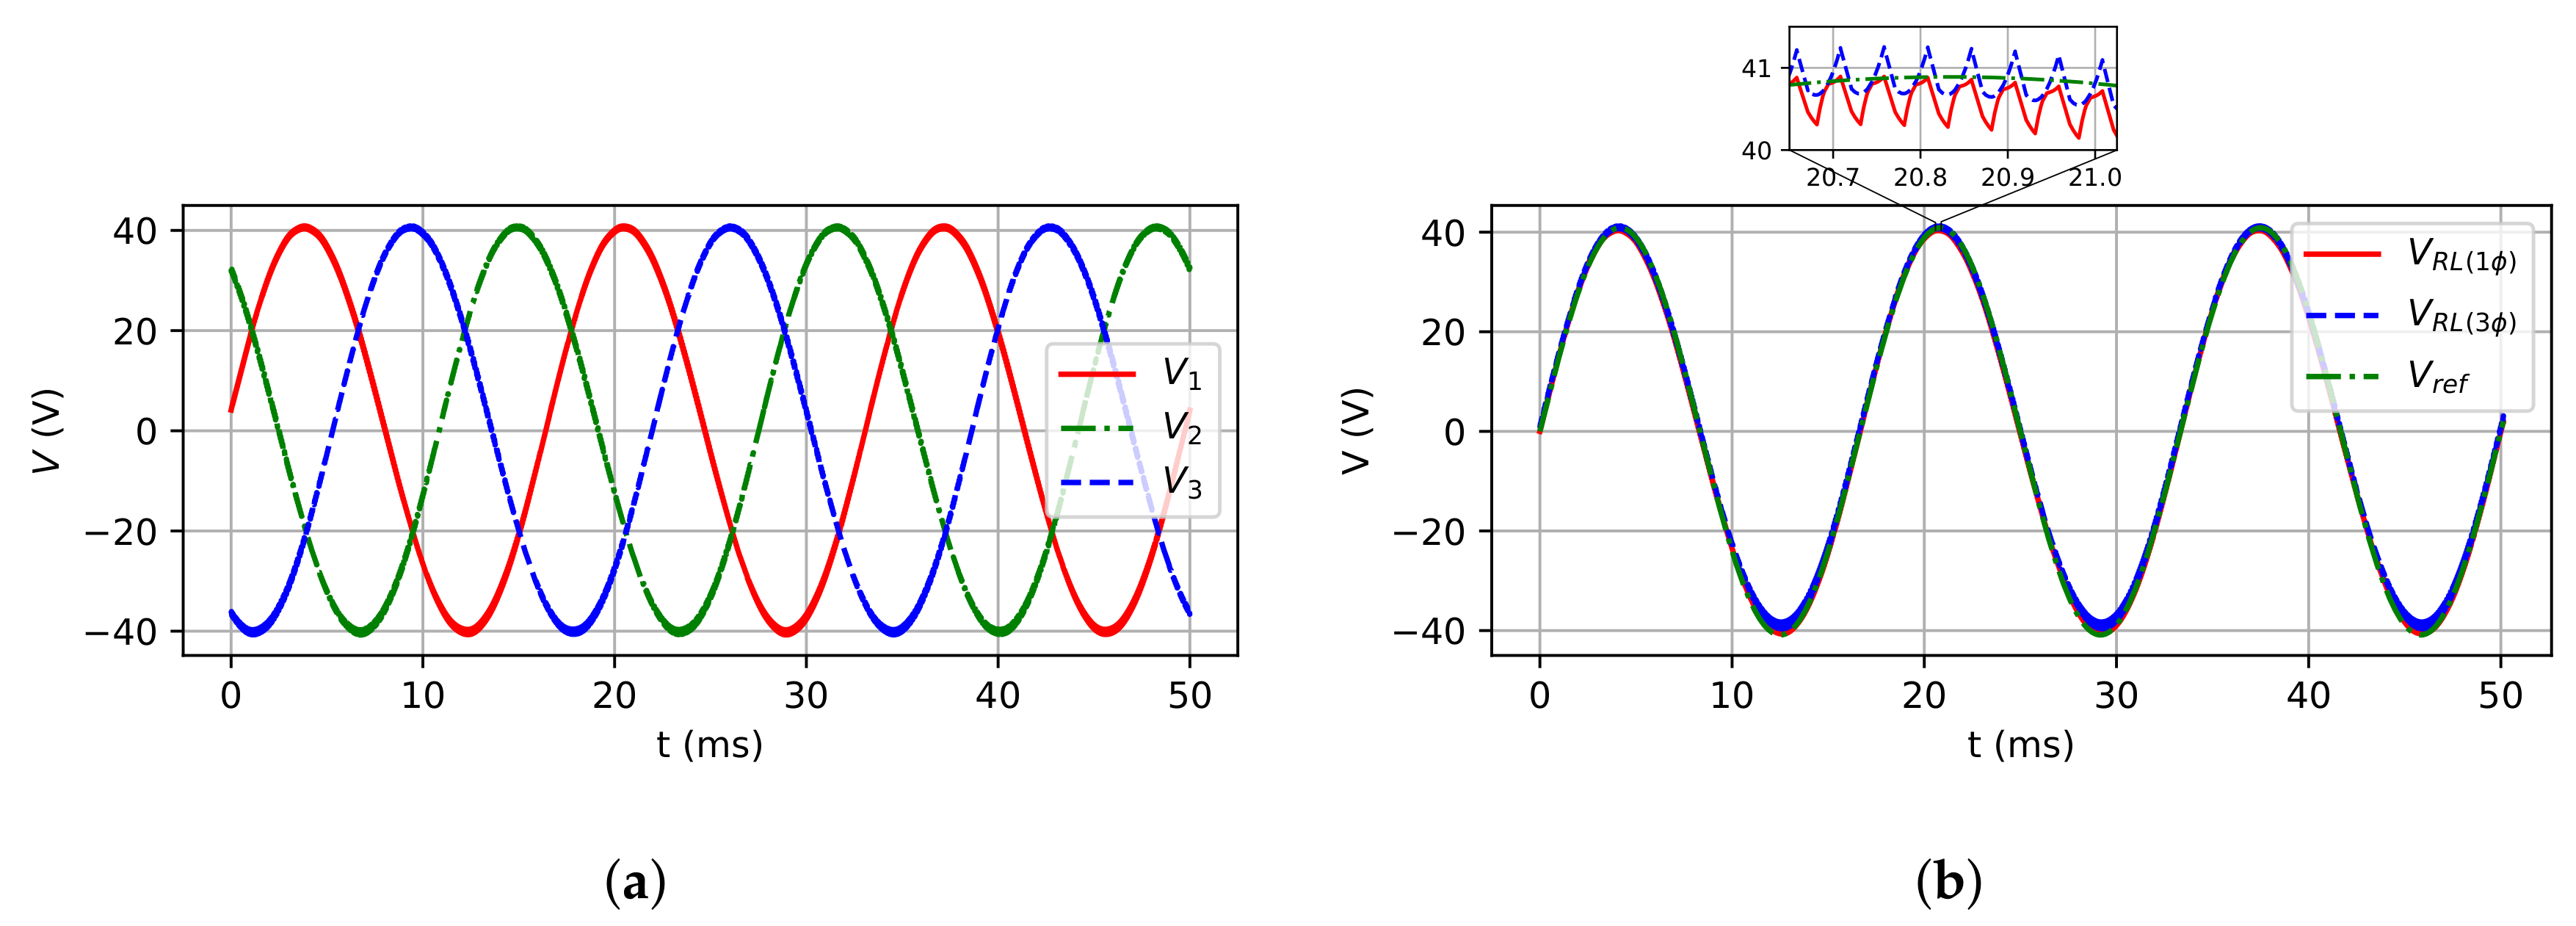
Figure 16.
Load phase voltages for RL load case: (a) Three-phase model; (b) Single-phase and
three-phase (leg 1) models.
Figure 16.
Load phase voltages for RL load case: (a) Three-phase model; (b) Single-phase and
three-phase (leg 1) models.
Figure 17.
RL load case: (a) Load phase currents of single-phase and three-phase (leg 1) models; (b)
Load phase voltage and current of the single-phase model.
Figure 17.
RL load case: (a) Load phase currents of single-phase and three-phase (leg 1) models; (b)
Load phase voltage and current of the single-phase model.
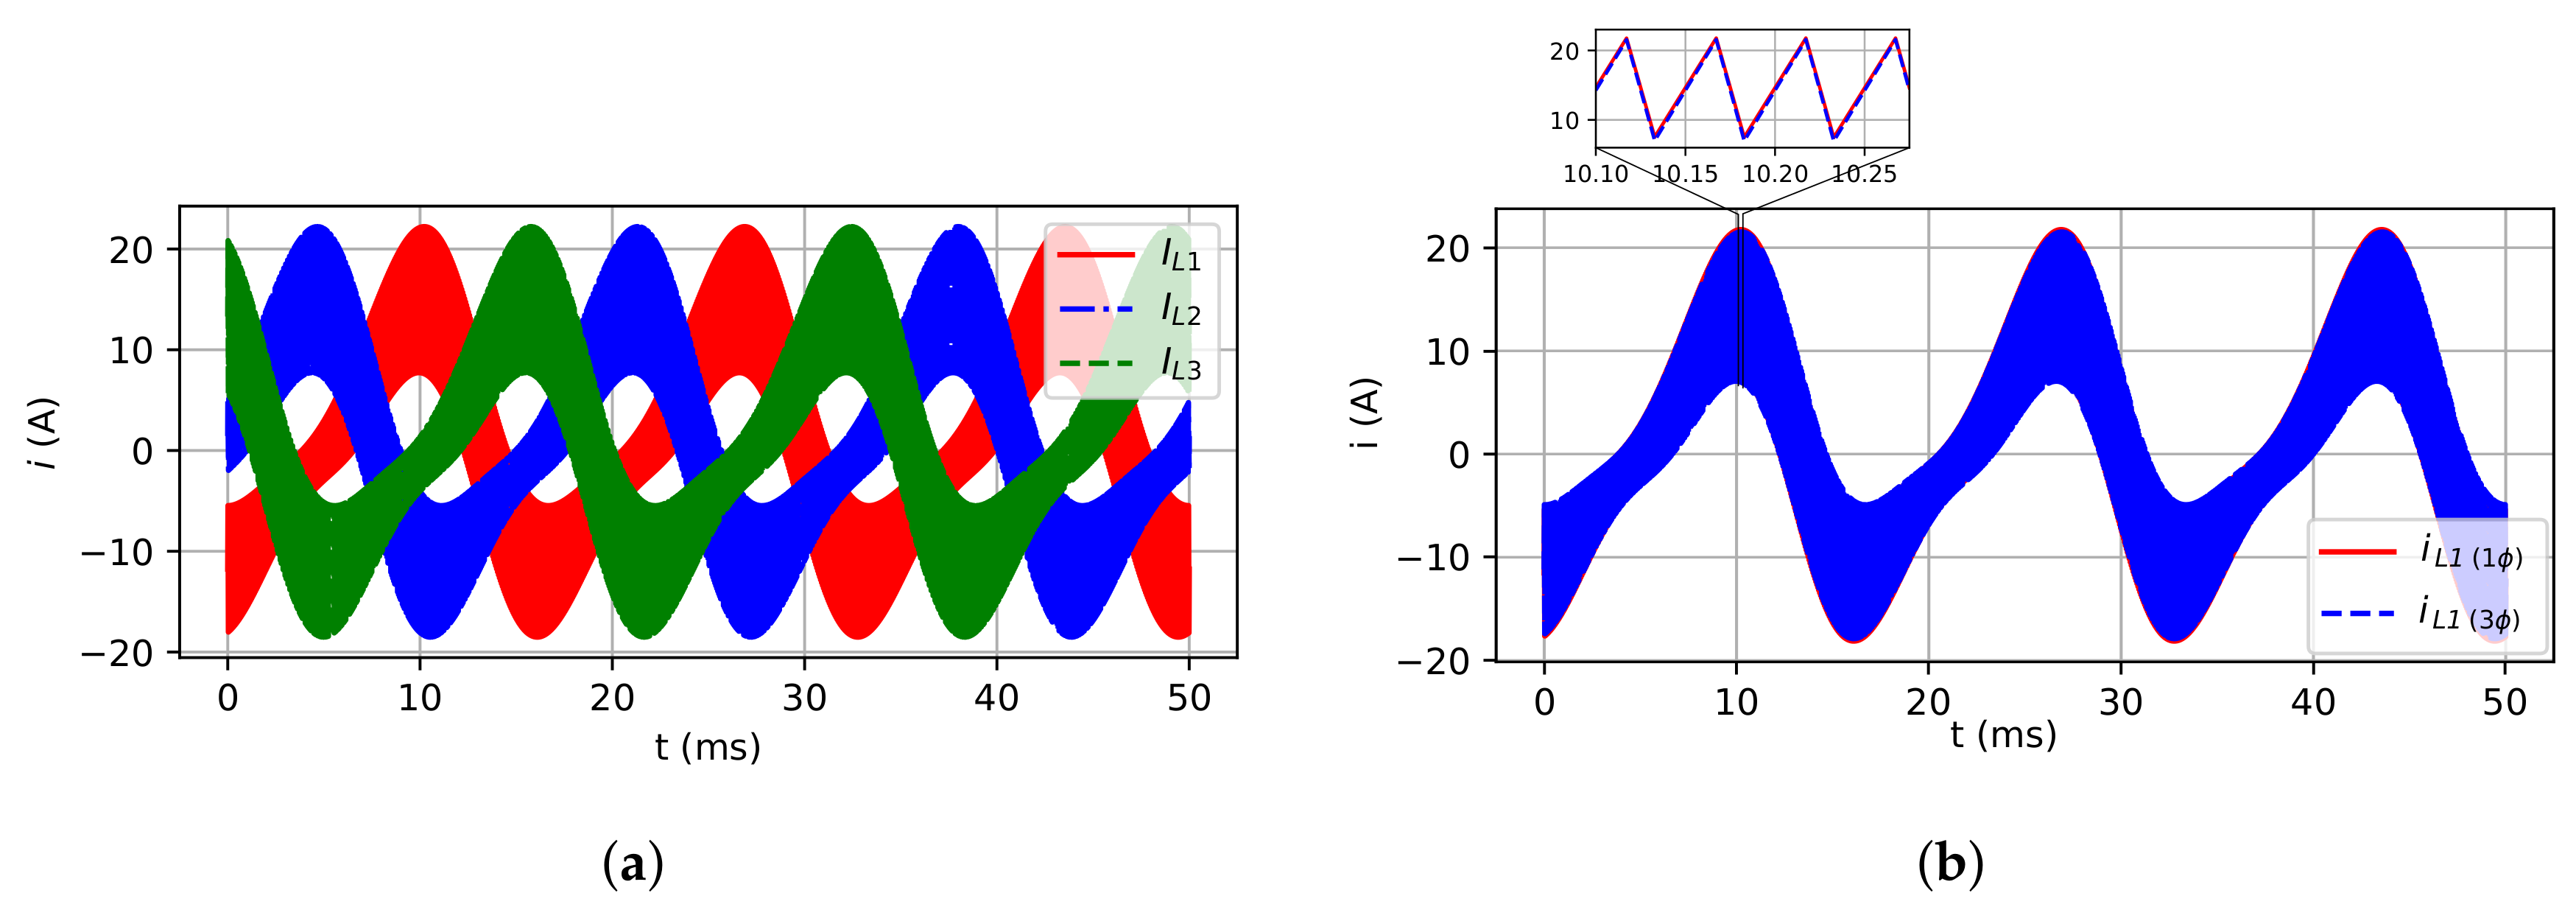
Figure 18.
Inductor currents for RC load case: (a) Three-phase model; (b) Single-phase and three-phase
(leg 1) models.
Figure 18.
Inductor currents for RC load case: (a) Three-phase model; (b) Single-phase and three-phase
(leg 1) models.
Figure 19.
Capacitor voltages for RC load case: (a) Three-phase model; (b) Single-phase and three-phase
(leg 1) models.
Figure 19.
Capacitor voltages for RC load case: (a) Three-phase model; (b) Single-phase and three-phase
(leg 1) models.
Figure 20.
Load phase for RC load case: (a) Three-phase model; (b) Single-phase and three-phase
(leg 1) models.
Figure 20.
Load phase for RC load case: (a) Three-phase model; (b) Single-phase and three-phase
(leg 1) models.
Figure 21.
RC load case: (a) Load phase currents of single-phase and three-phase (leg 1) models;
(b) Load phase voltage and current of the single-phase model.
Figure 21.
RC load case: (a) Load phase currents of single-phase and three-phase (leg 1) models;
(b) Load phase voltage and current of the single-phase model.
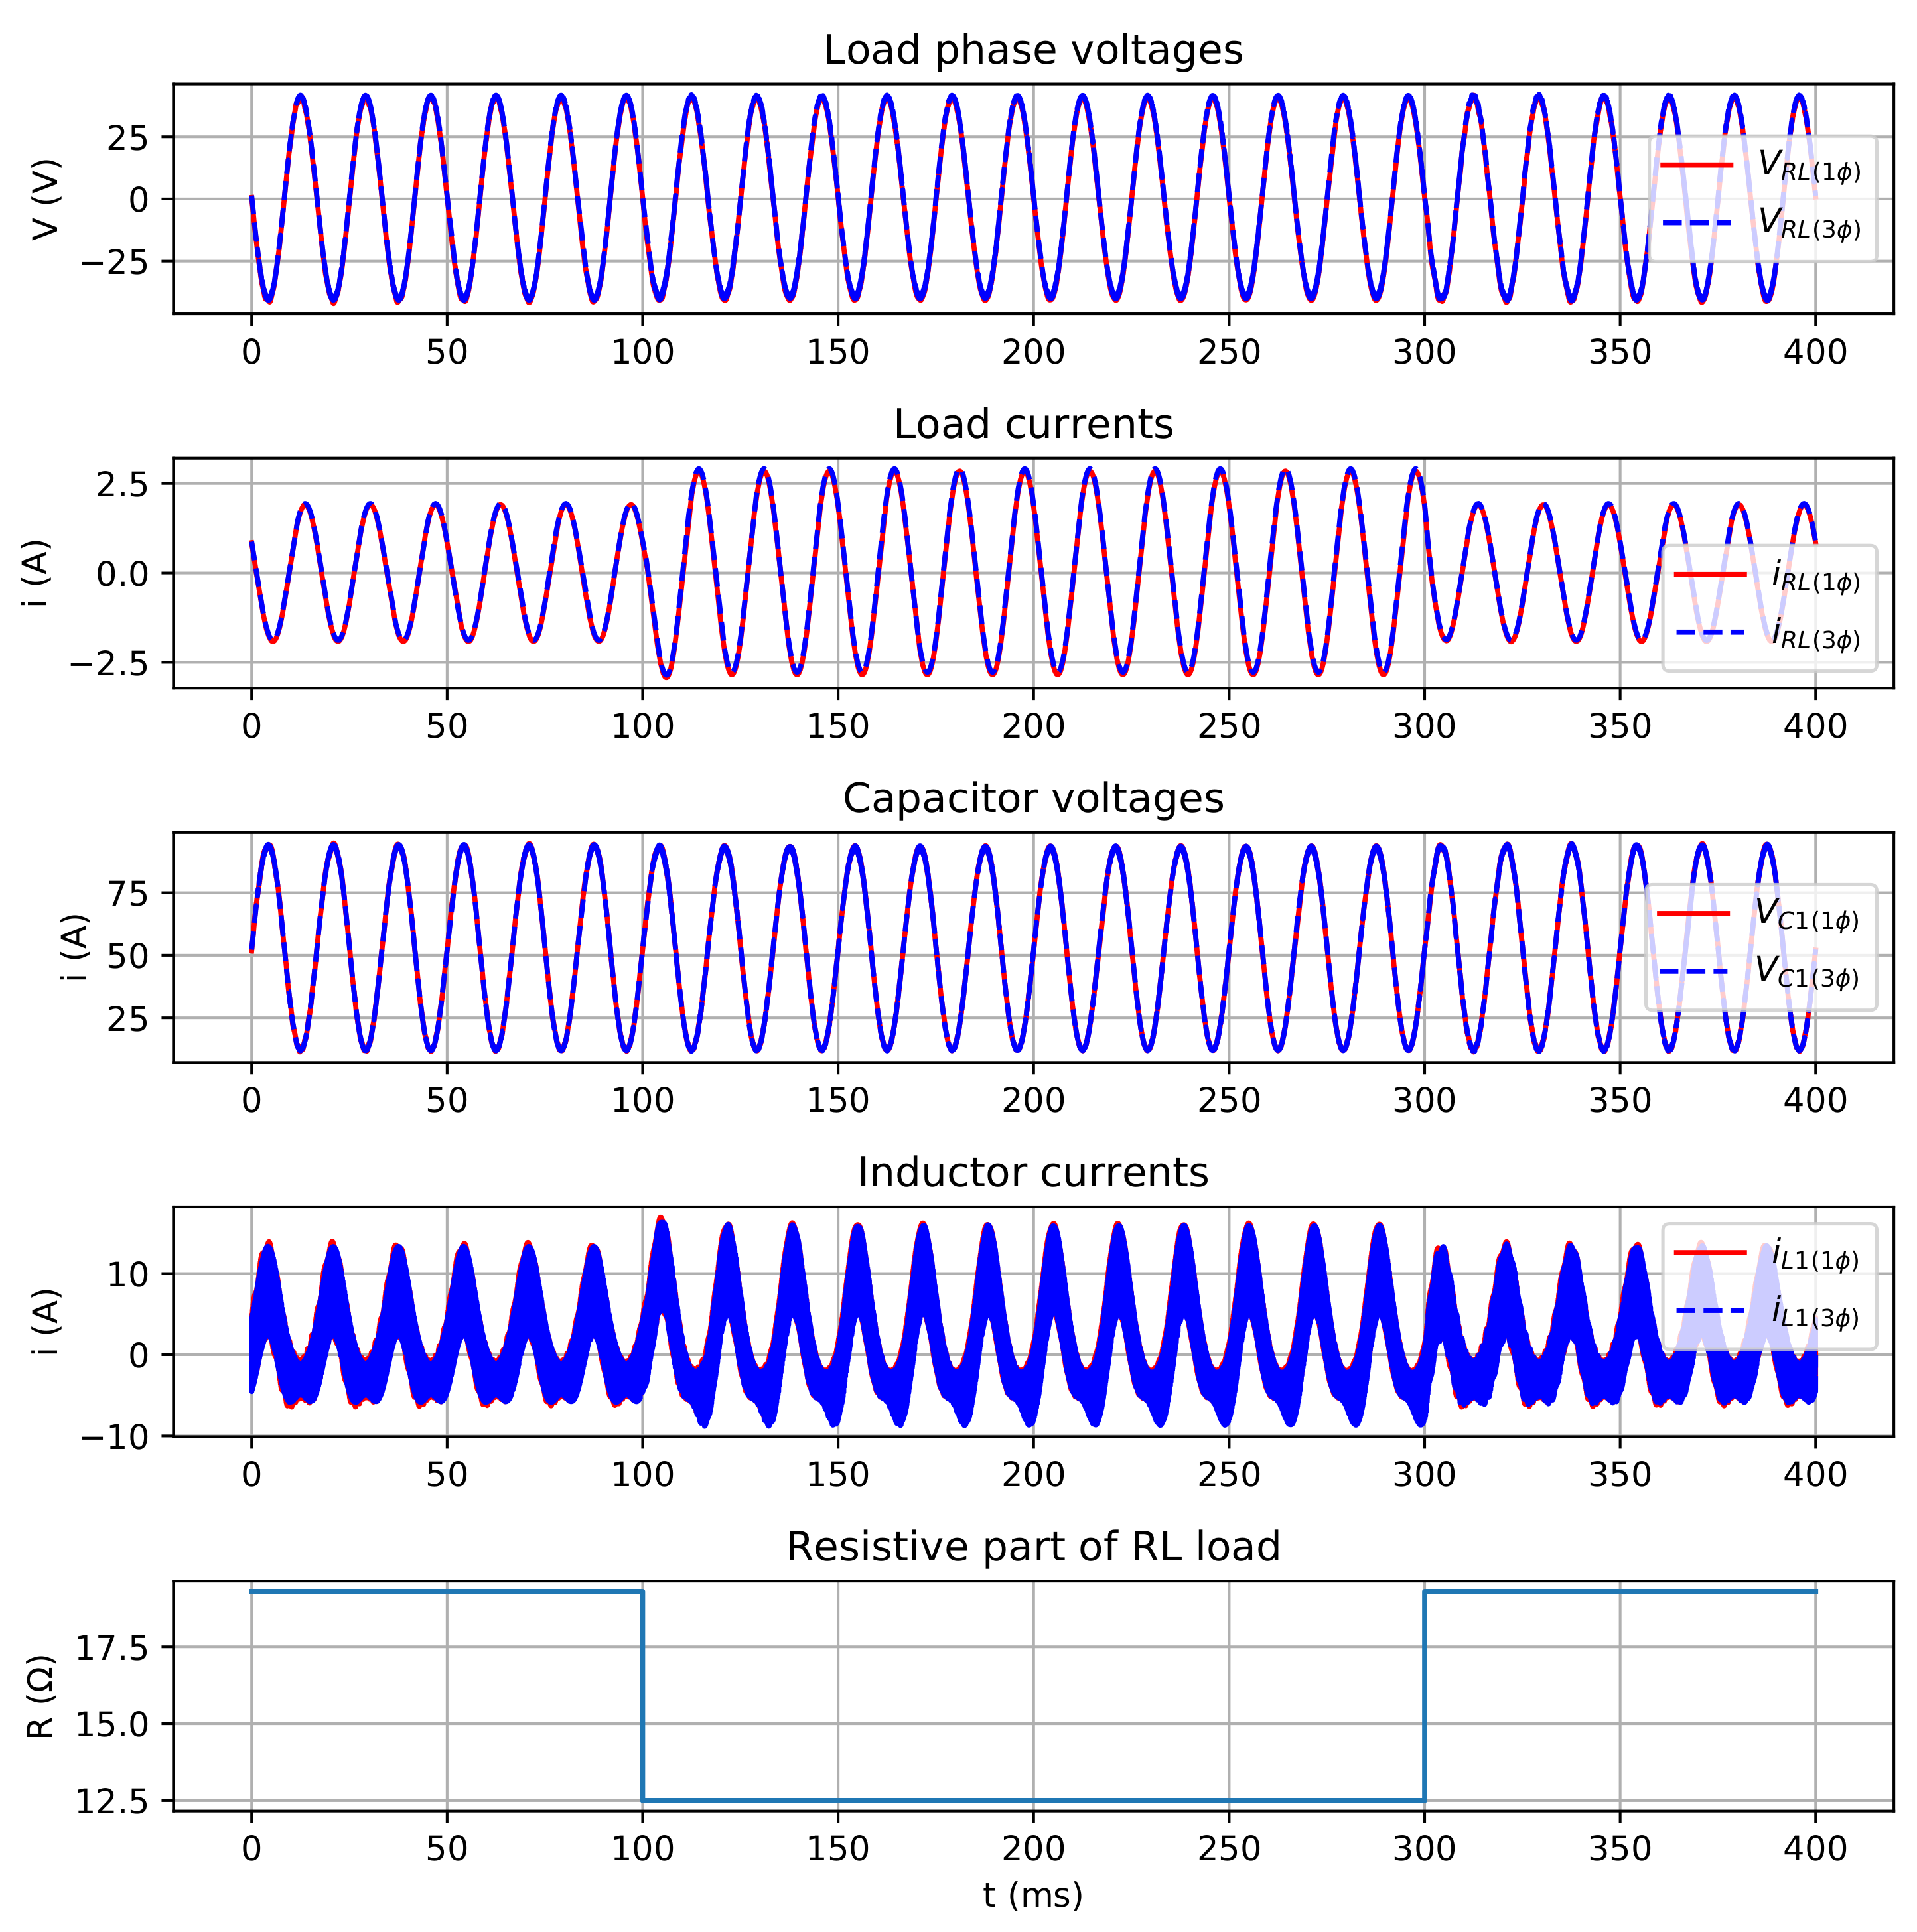
Figure 22.
Waveforms during the transient period.
Figure 22.
Waveforms during the transient period.
Figure 23.
Prototype with resistive load.
Figure 23.
Prototype with resistive load.
Figure 24.
Experimental inductor waveforms for R load case: (a) Inductor currents (25A/V); (b) Details
of inductor currents (25A/V).
Figure 24.
Experimental inductor waveforms for R load case: (a) Inductor currents (25A/V); (b) Details
of inductor currents (25A/V).
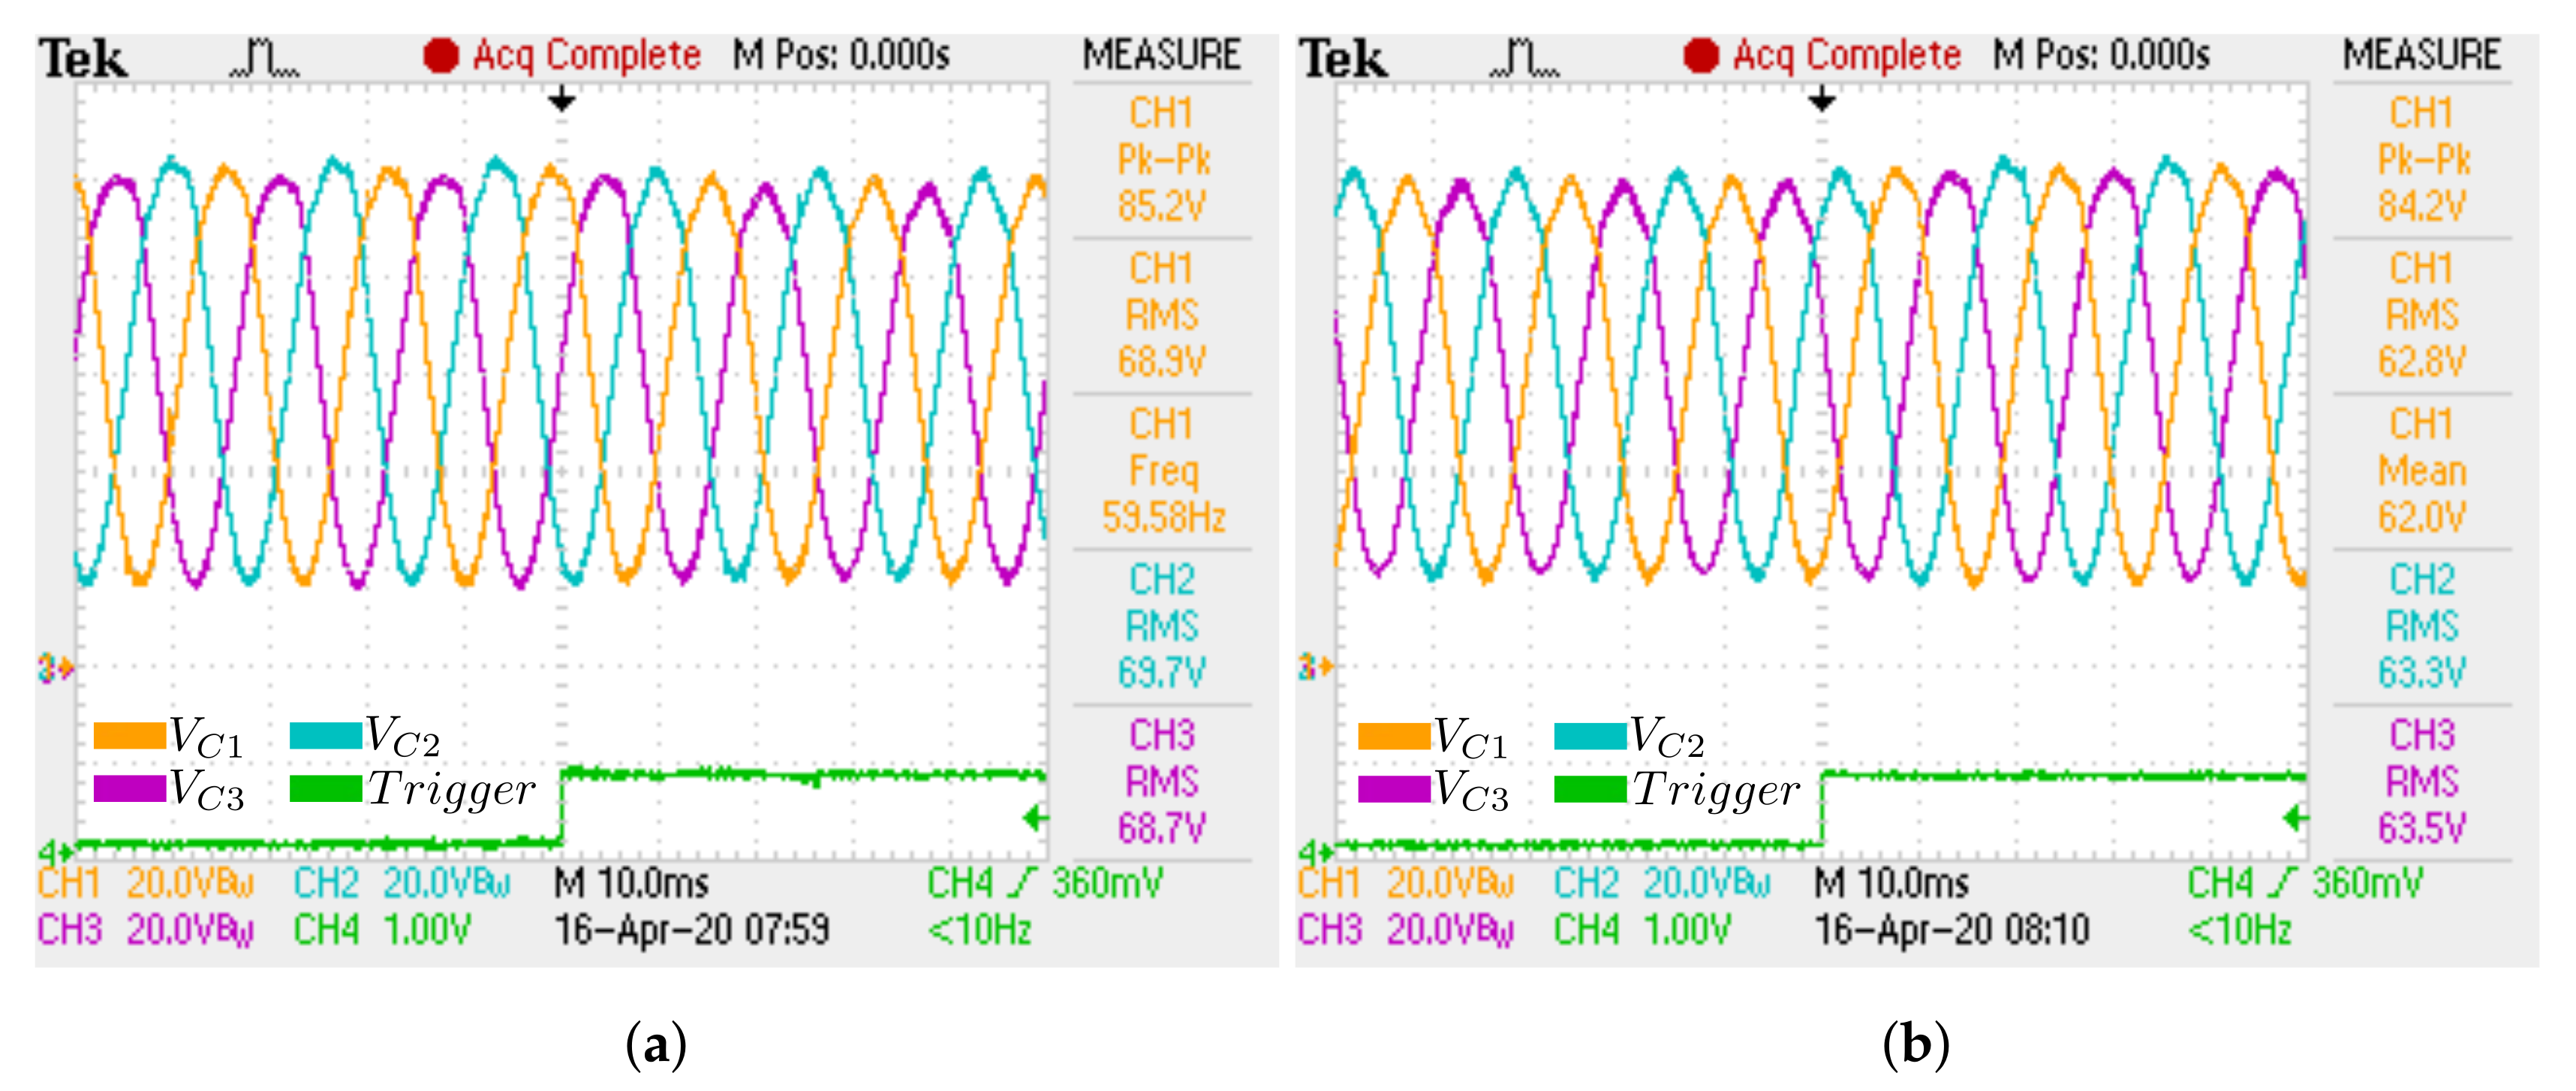
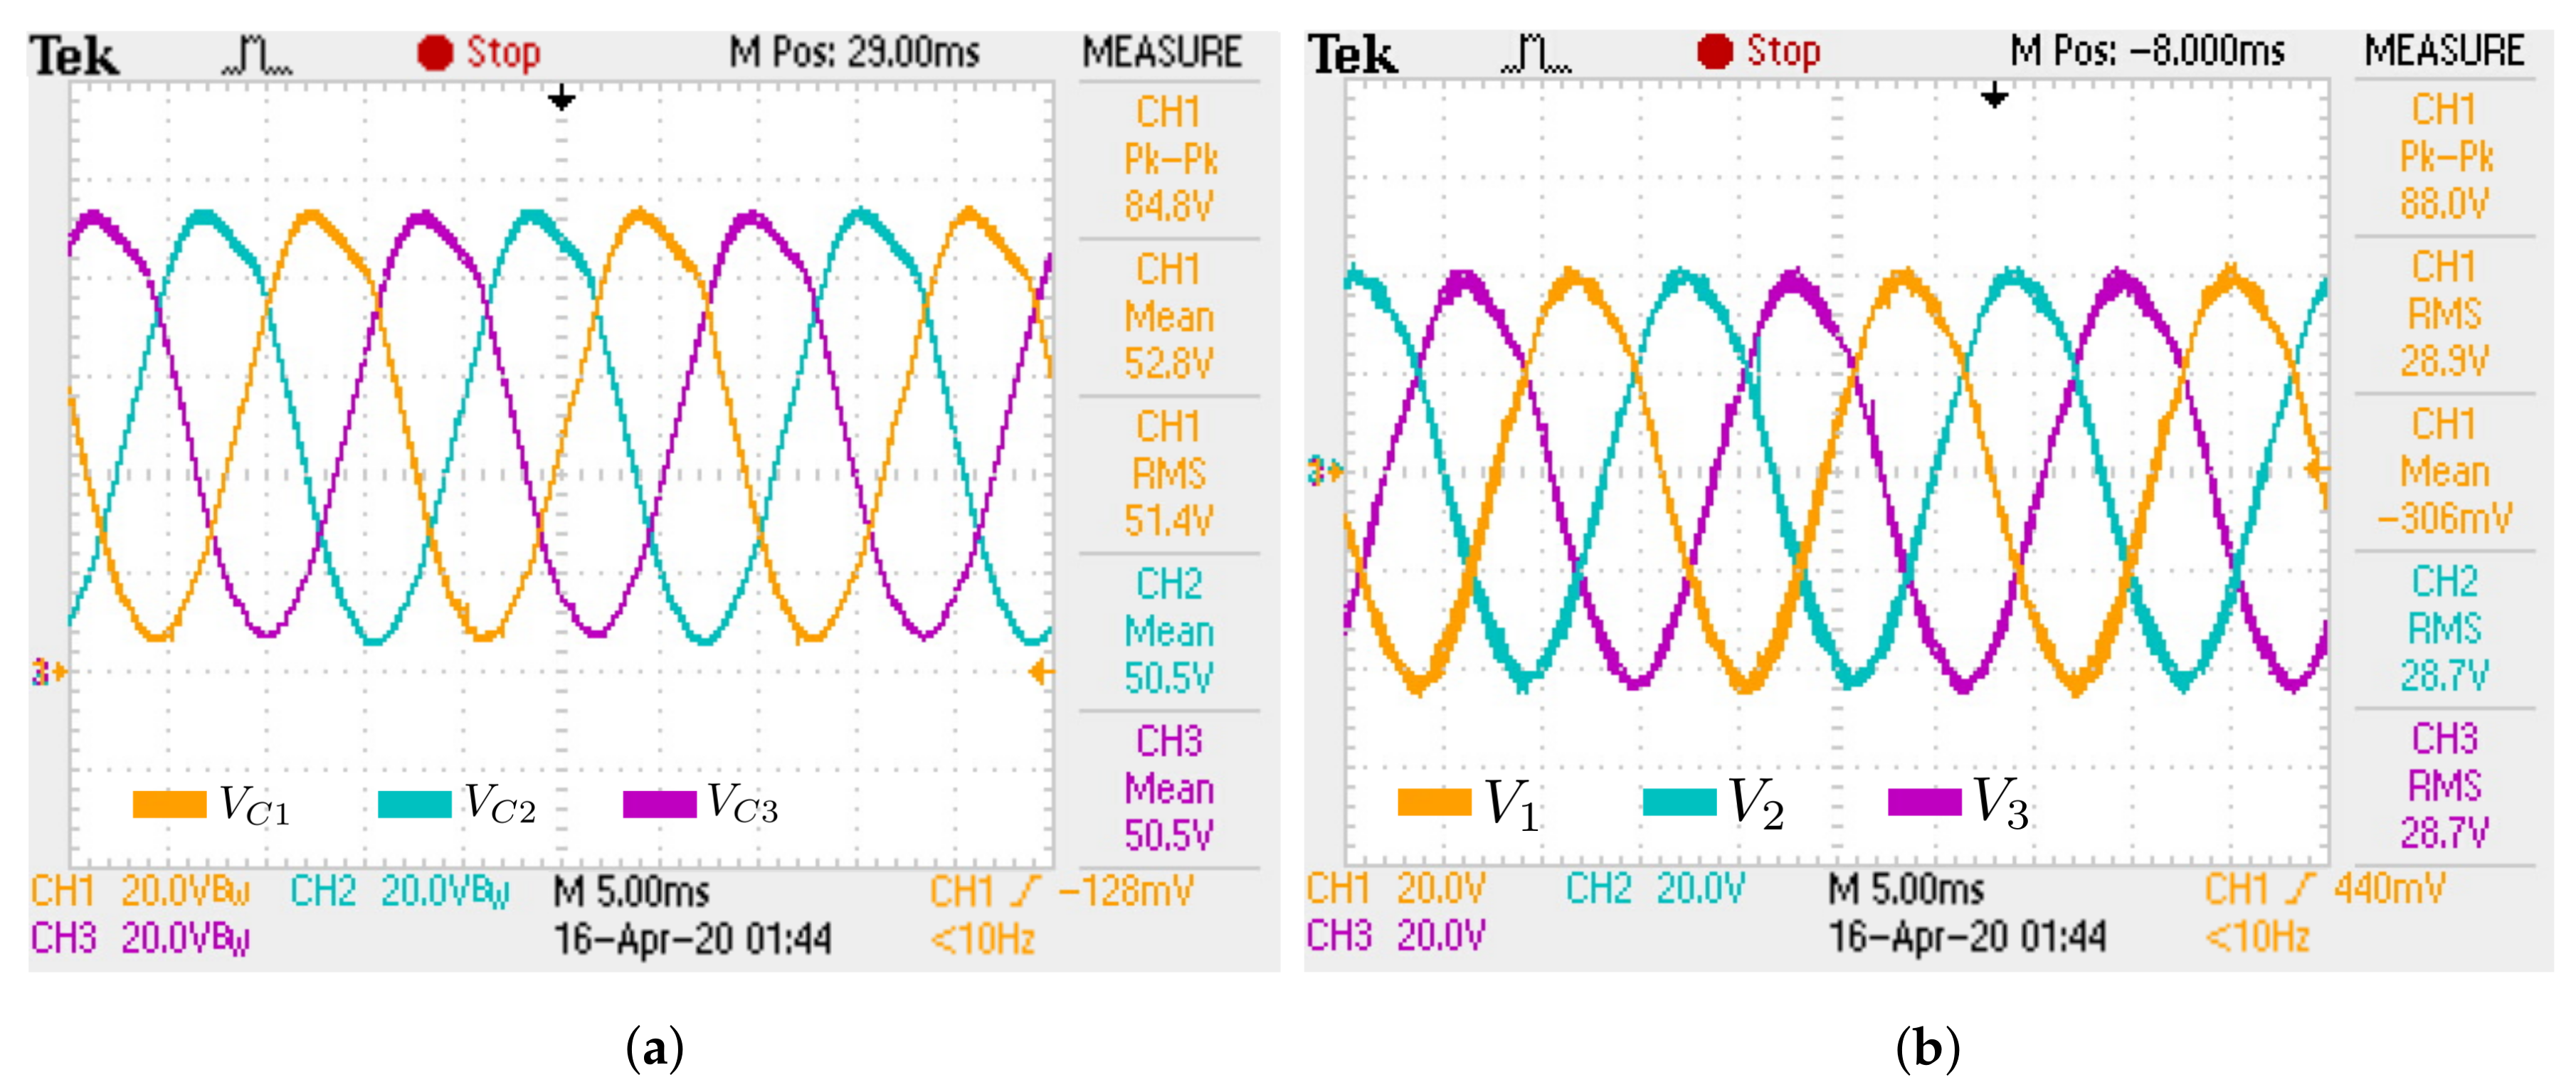
Figure 25.
Experimental waveforms of capacitor and load phase voltages for R load case: (a) Capacitor
voltages; (b) Load phase voltages.
Figure 25.
Experimental waveforms of capacitor and load phase voltages for R load case: (a) Capacitor
voltages; (b) Load phase voltages.
Figure 26.
Experimental inductor waveforms for RL load case: (a) Inductor currents (25A/V);
(b) Details of inductor currents (25A/V).
Figure 26.
Experimental inductor waveforms for RL load case: (a) Inductor currents (25A/V);
(b) Details of inductor currents (25A/V).
Figure 27.
Experimental waveforms of capacitor and load phase voltages for RL load case: (a) Capacitor
voltages; (b) Load phase voltages.
Figure 27.
Experimental waveforms of capacitor and load phase voltages for RL load case: (a) Capacitor
voltages; (b) Load phase voltages.
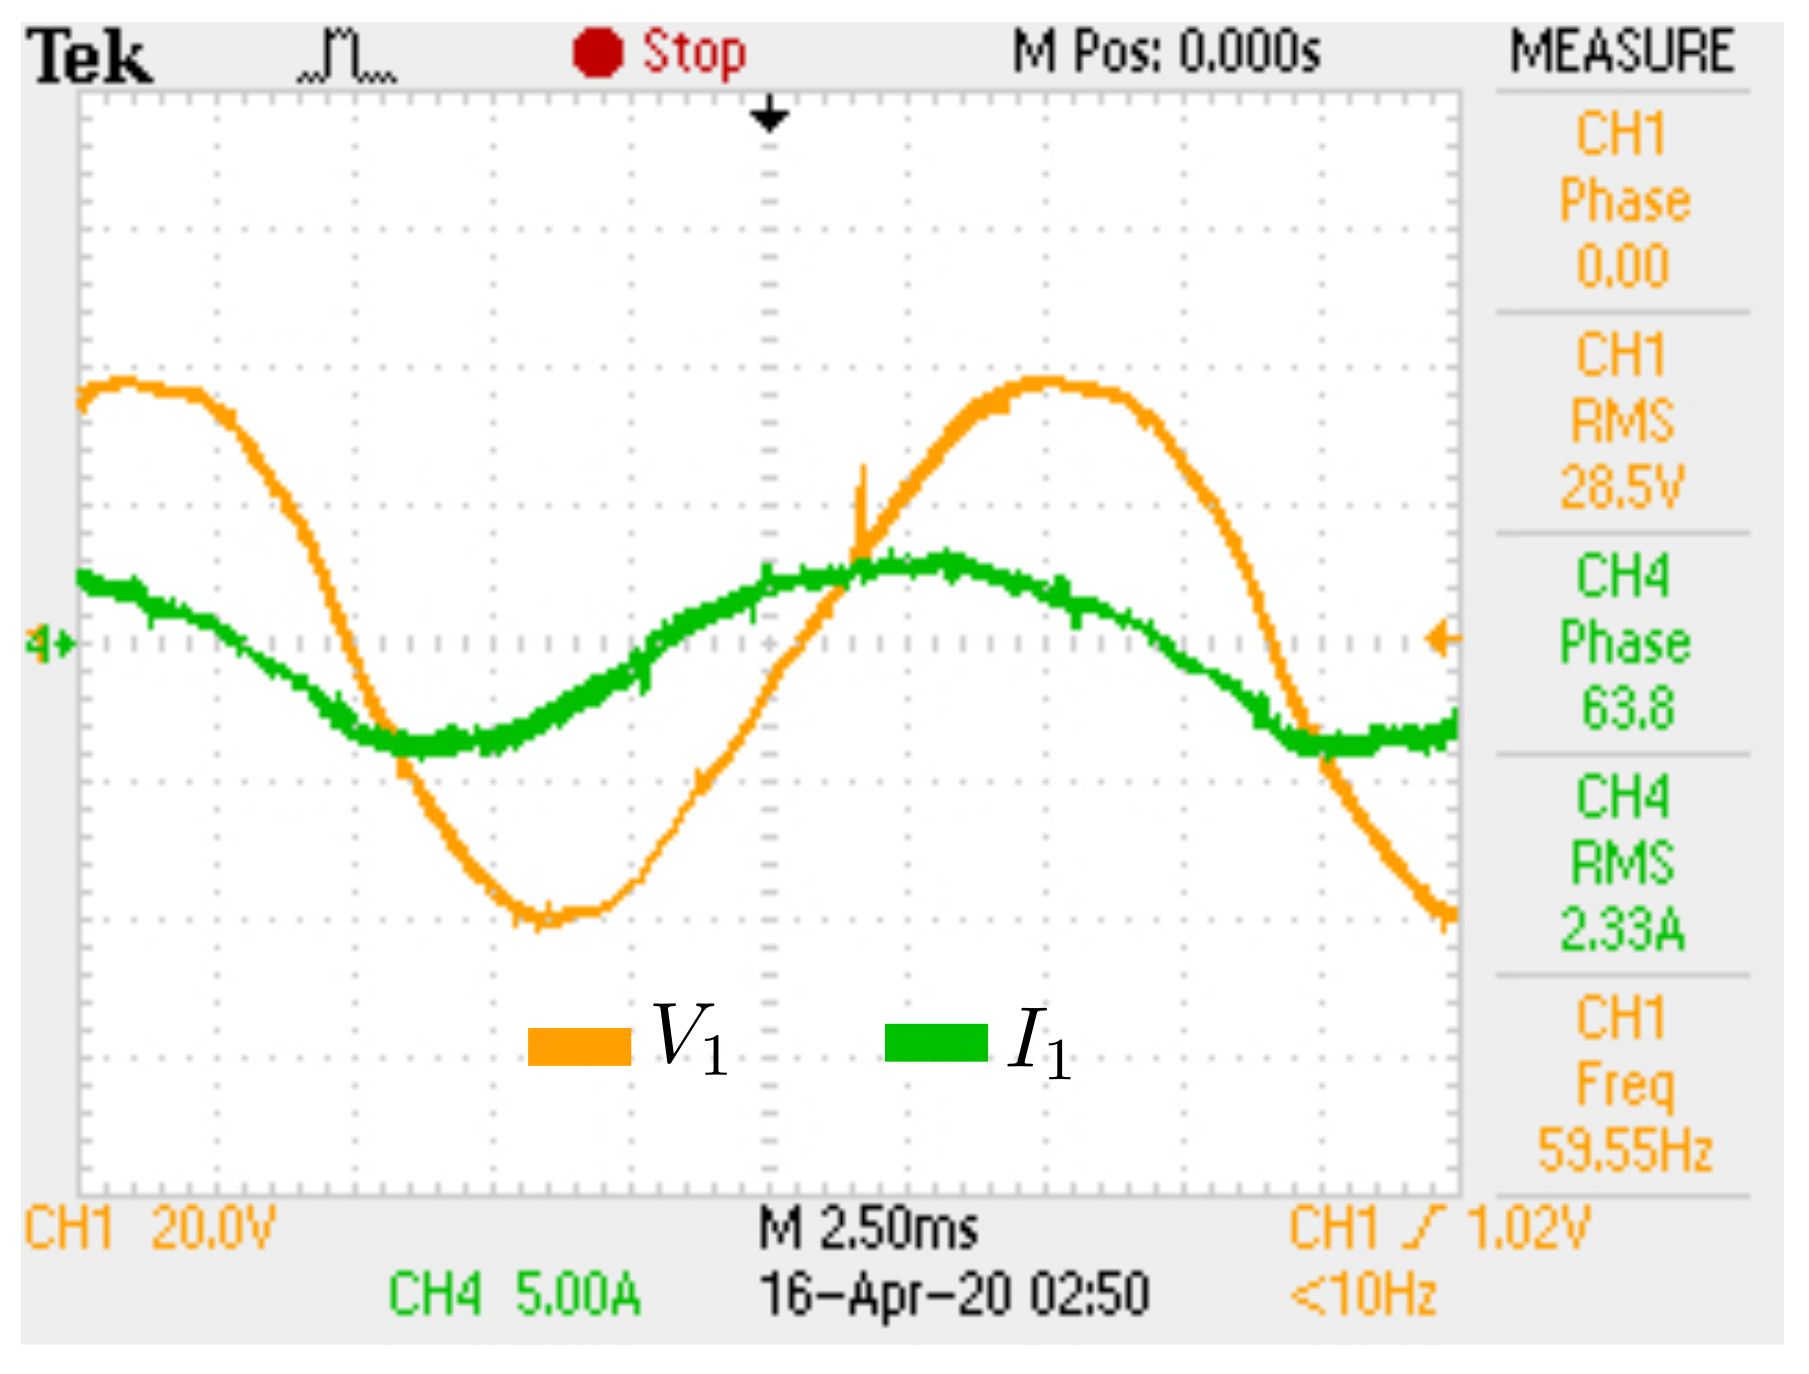
Figure 28.
Load voltage and current for phase 1: RL load.
Figure 28.
Load voltage and current for phase 1: RL load.
Figure 29.
Experimental inductor waveforms for RC load case: (a) Inductor currents (25A/V);
(b) Details of inductor currents (25A/V).
Figure 29.
Experimental inductor waveforms for RC load case: (a) Inductor currents (25A/V);
(b) Details of inductor currents (25A/V).
Figure 30.
Experimental waveforms of capacitor and load phase voltages for RC load case: (a) Capacitor
voltages; (b) Load phase voltages.
Figure 30.
Experimental waveforms of capacitor and load phase voltages for RC load case: (a) Capacitor
voltages; (b) Load phase voltages.
Figure 31.
Load voltage and current for phase 1: RC load.
Figure 31.
Load voltage and current for phase 1: RC load.
Figure 32.
Experimental load phase voltages for RL transition load case: (a) First transition; (b) Second
transition.
Figure 32.
Experimental load phase voltages for RL transition load case: (a) First transition; (b) Second
transition.
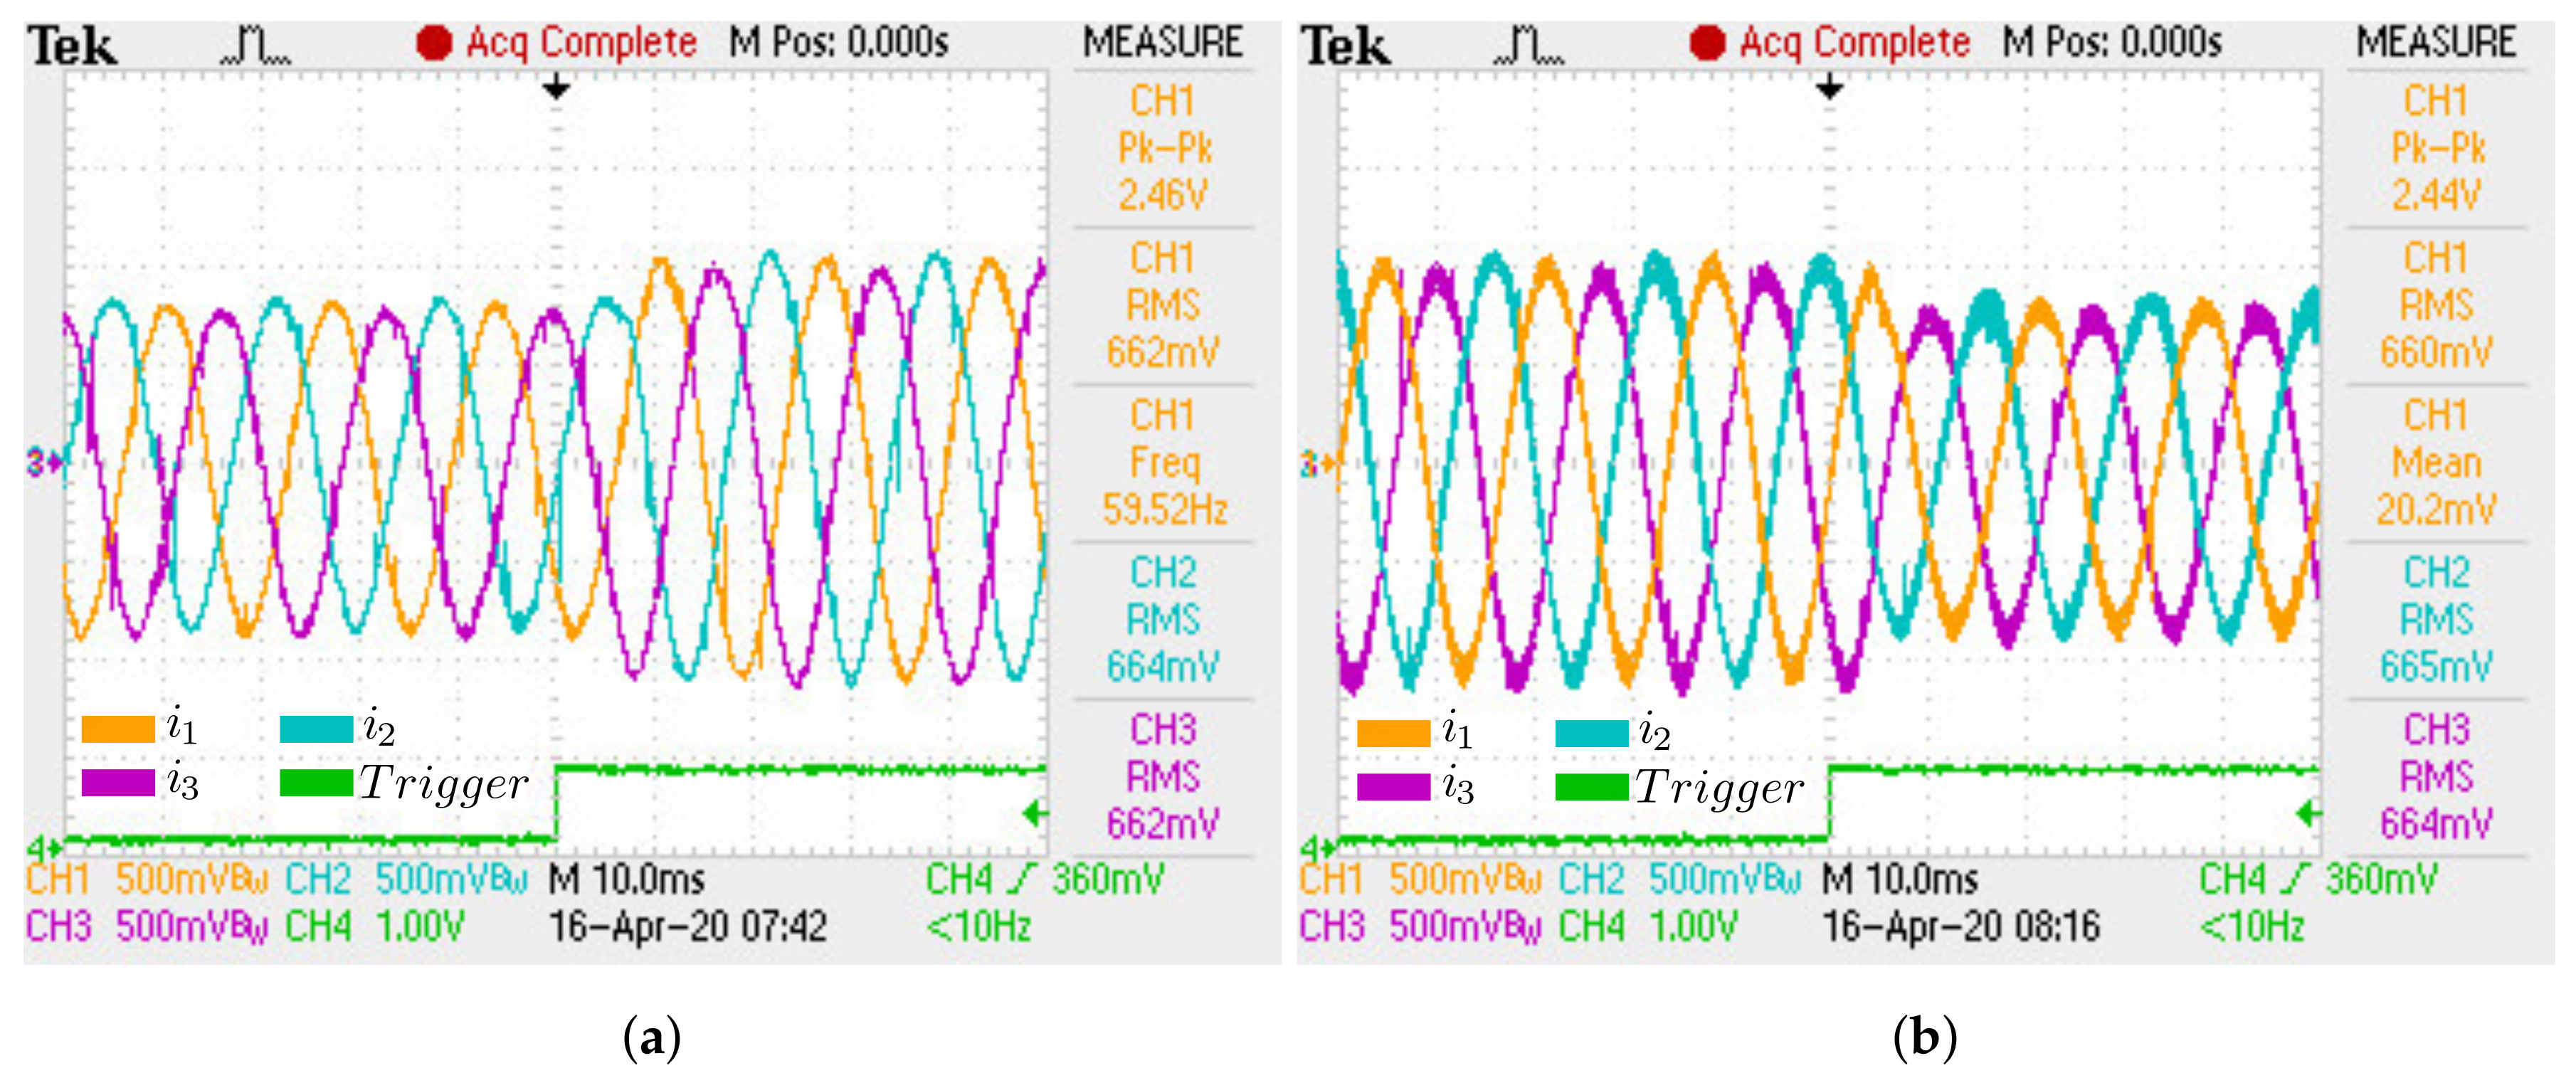
Figure 33.
Experimental load phase currents for RL transition load case: (a) First transition; (b) Second
transition.
Figure 33.
Experimental load phase currents for RL transition load case: (a) First transition; (b) Second
transition.
Figure 34.
Experimental capacitor voltages for RL transition load: (a) First transition; (b) Second
transition.
Figure 34.
Experimental capacitor voltages for RL transition load: (a) First transition; (b) Second
transition.
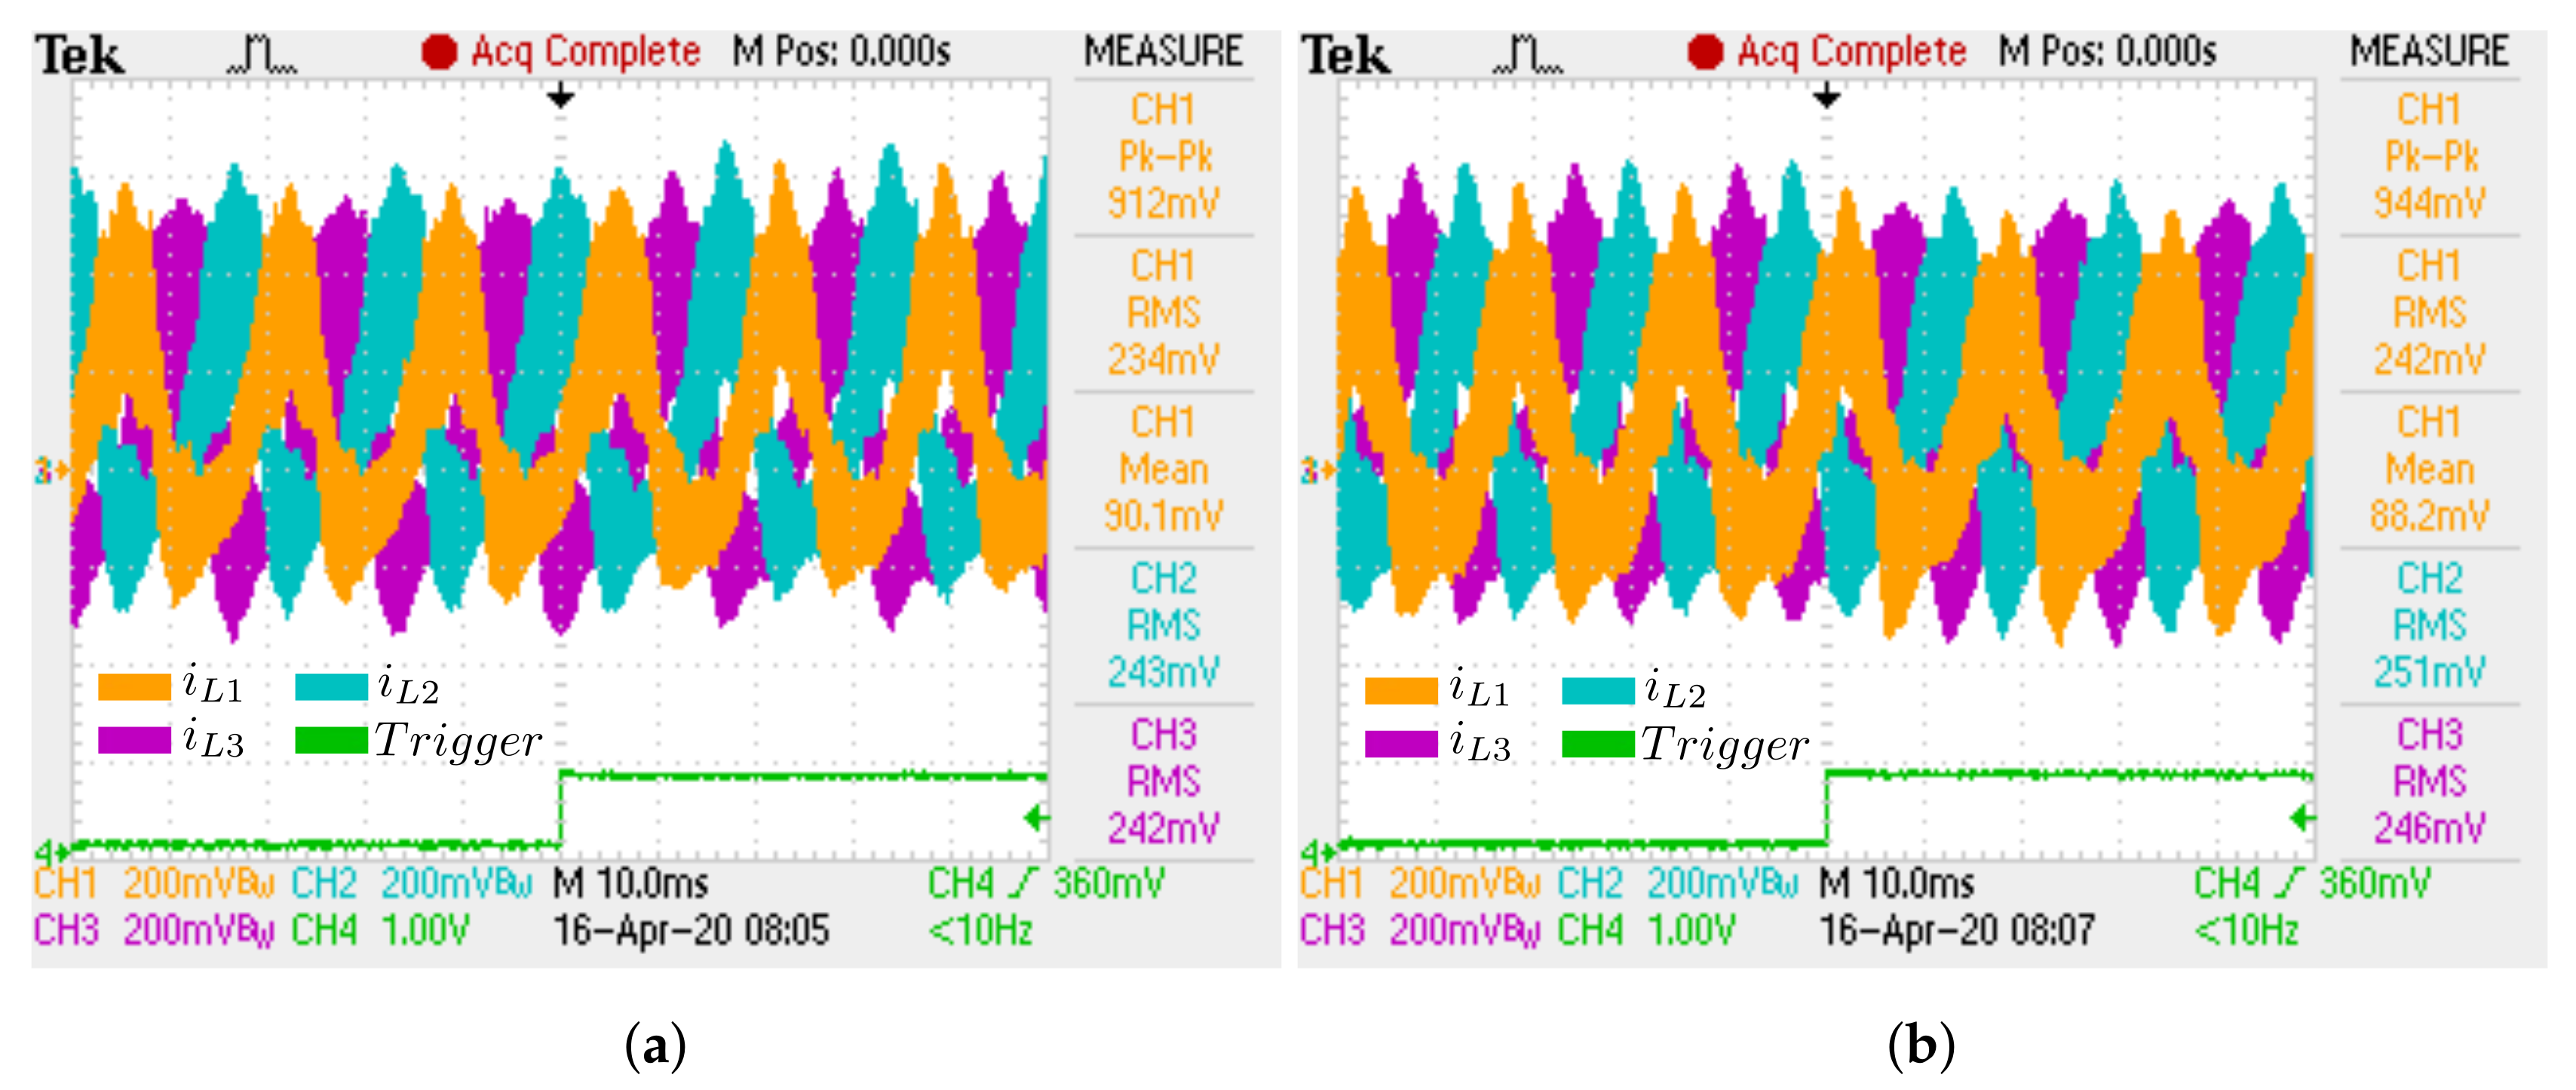
Figure 35.
Experimental Inductor currents for RL transition load: (a) First transition; (b) Second
transition.
Figure 35.
Experimental Inductor currents for RL transition load: (a) First transition; (b) Second
transition.
Table 1.
Main parameters of the inverter.
Table 1.
Main parameters of the inverter.
| Parameter | Value |
|---|
| Input voltage | 36 V |
| Output phase voltage | 28.9 V |
| DC-biased voltage capacitors | 53.0 V |
| Output frequency | 60 Hz |
| Switching frequency | 20 kHz |
| , and | 85 H |
| , and | 100 F |
| Inductor resistences | 34.4 m |
| IGBT saturation voltage | 2.5 V |
| Diode forward voltage | 1.7 V |
| Diode series resistence | 50 m |
Table 2.
RMS (root mean square), average and peak-to-peak values for the simulated currents and voltages: R load.
Table 2.
RMS (root mean square), average and peak-to-peak values for the simulated currents and voltages: R load.
| Quantity | RMS | Average | Peak-to-Peak |
|---|
| 29.09 V | 0.084 V | 82.7 V |
| 29.12 V | 0.0025 V | 82.9 V |
| 61.19 V | 53.84 V | 83.02 V |
| 61.23 V | 53.87 V | 83.21 V |
| 6.31 A | 1.89 A | 26.9 A |
| 6.36 A | 1.91 A | 27.3 A |
Table 3.
RMS (root mean square), average, and peak-to-peak values for the simulated currents and voltages: RL load.
Table 3.
RMS (root mean square), average, and peak-to-peak values for the simulated currents and voltages: RL load.
| Quantity | RMS | Average | Peak-to-Peak |
|---|
| 28.84 V | 0.063 V | 82.3 V |
| 28.88 V | 0.003 V | 82.6 V |
| 2.09 A | 0.05 A | 5.92 A |
| 2.1 A | –0.008 A | 5.92 A |
| 50.31 V | 52.96 V | 83.4 V |
| 50.35 V | 52.98 V | 83.4 V |
| 5.96 A | 1.38 A | 23.8 A |
| 6.03 A | 1.42 A | 24.2 A |
Table 4.
RMS (root mean square), average, and peak-to-peak values for the simulated currents and voltages: RC load.
Table 4.
RMS (root mean square), average, and peak-to-peak values for the simulated currents and voltages: RC load.
| Quantity | RMS | Average | Peak-to-Peak |
|---|
| 29.21 V | 0.042 V | 84.57 V |
| 29.25 V | 0.0062 V | 84.85 V |
| 2.31 A | 0.025 A | 6.73 A |
| 2.31 A | −0.008 A | 6.74 A |
| 60.8 V | 53.16 V | 85.12 V |
| 60.9 V | 53.18 V | 85.15 V |
| 9.27 A | 0.89 A | 41.2 A |
| 9.22 A | 0.89 A | 40.7 A |
Table 5.
Comparisons between simulated results of single-phase model with experimental results of three-phase model: R load.
Table 5.
Comparisons between simulated results of single-phase model with experimental results of three-phase model: R load.
| Quantity | Simulated Single-Phase Model | Experimental Three-Phase Model | |Error| |
|---|
| RMS | 29.09 V | 28.7 V | 1.35% |
| Peak-to-peak | 82.7 V | 84.8 V | 2.47% |
| RMS | 61.19 V | 60.7 V | 0.81% |
| Peak-to-peak | 83.02 V | 82.4 V | 0.75% |
| RMS | 6.31 A | 6.12 A | 3.10% |
| Peak-to-peak | 26.9 A | 26.25 A | 2.47% |
Table 6.
Comparison between simulated results of a single-phase model with experimental results of the three-phase model: RL load.
Table 6.
Comparison between simulated results of a single-phase model with experimental results of the three-phase model: RL load.
| Quantity | Simulated Single-Phase Model | Experimental Three-Phase Model | |Error| |
|---|
| RMS | 28.84 V | 28.6 V | 0.83% |
| Peak-to-peak | 82.3 V | 82.0 V | 0.36% |
| RMS | 2.09 A | 2.14 A | 2.33% |
| Peak-to-peak | 5.92 A | 6.0 A | 1.33% |
| RMS | 50.31 V | 51.4 V | 2.10% |
| Peak-to-peak | 83.4 V | 84.8 V | 1.65% |
| RMS | 5.96 A | 6.0 A | 0.66% |
| Peak-to-peak | 23.8 A | 24.4 A | 0.25% |
Table 7.
Comparison between simulated results of single-phase model with experimental results of a three-phase model: RC load.
Table 7.
Comparison between simulated results of single-phase model with experimental results of a three-phase model: RC load.
| Quantity | Simulated Single-Phase Model | Experimental Three-Phase Model | |Error| |
|---|
| RMS | 29.21 V | 28.6 V | 2.13% |
| Peak-to-peak | 84.57 V | 82.0 V | 3.13% |
| RMS | 2.31 A | 2.14 A | 7.9% |
| Peak-to-peak | 6.73 A | 6.0 A | 12.7% |
| RMS | 60.8 V | 63.4 V | 4.1% |
| Peak-to-peak | 85.12 V | 83.2 V | 2.3% |
| RMS | 9.27 A | 9.75 A | 4.92% |
| Peak-to-peak | 39.2 A | 36.5 A | 7.39% |

 ,
, 


