
Neck Circumference as a Screening Tool for Metabolic Syndrome among Lebanese College Students

 , ,
, ,  ,
,  ,
,
Abstract
:1. Introduction
2. Methods
2.1. Sampling
2.2. Minimal Sample Size Calculation
2.3. Anthropometrics
2.4. Biochemical Markers
2.5. Blood Pressure Measurement
2.6. Metabolic Syndome
2.7. Questionnaires
- (1)
- Demographic and lifestyle habits questionnaire: adapted from Levitsky et al. 2004 [18], had 10 open-ended questions assessing number of meals consumed per day and frequency of eating outside the home, living arrangements, smoking status and alcohol consumption.
- (2)
- The International Physical Activity Questionnaire (IPAQ) 2014 [19] short form: a validated tool used to assess level of physical activity, which consists of seven questions designed to measure both duration and frequency exercise of light, moderate and vigorous physical activity completed by participant in the past week. Metabolic equivalent of tasks (MET) was then calculated by multiplying the total minutes spent participating in the activity by the frequency (days) and the constants of 3.3, 4.0 and 8.0 for light, moderate and vigorous activity, respectively. The total MET value was then computed by summing up the respective MET values for all activities that were carried out in bouts longer than 10 min in duration.
3. Statistics
4. Results
5. Discussion
6. Conclusions
Author Contributions
Funding
Institutional Review Board Statement
Informed Consent Statement
Data Availability Statement
Conflicts of Interest
References
- World Health Organization. Obesity and Overweight. 2022. Available online: https://www.who.int/news-room/fact-sheets/detail/obesity-and-overweight (accessed on 28 May 2022).
- Biro, F.M.; Wien, M. Childhood obesity and adult morbidities. Am. J. Clin. Nutr. 2010, 91, 1499S–1505S. [Google Scholar] [CrossRef] [PubMed] [Green Version]
- Schelbert, K.B. Comorbidities of obesity. Prim. Care 2009, 36, 271–285. [Google Scholar] [CrossRef] [PubMed]
- Guh, D.P.; Zhang, W.; Bansback, N.; Amarsi, Z.; Birmingham, C.L.; Anis, A.H. The incidence of co-morbidities related to obesity and overweight: A systematic review and meta-analysis. BMC Public Health 2009, 9, 88. [Google Scholar] [CrossRef] [PubMed] [Green Version]
- Grundy, S.M. Obesity, Metabolic Syndrome, and Cardiovascular Disease. J. Clin. Endocrinol. Metab. 2004, 89, 2595–2600. [Google Scholar] [CrossRef]
- Alberti, K.G.; Zimmet, P.; Shaw, J. The metabolic syndrome--a new worldwide definition. Lancet 2005, 366, 1059–1062. [Google Scholar] [CrossRef]
- Cornier, M.A.; Dabelea, D.; Hernandez, T.L.; Lindstrom, R.C.; Steig, A.J.; Stob, N.R.; Van Pelt, R.E.; Wang, H.; Eckel, R.H. The metabolic syndrome. Endocr. Rev. 2008, 29, 777–822. [Google Scholar] [CrossRef]
- Okorodudu, D.O.; Jumean, M.F.; Montori, V.M.; Romero-Corral, A.; Somers, V.K.; Erwin, P.J.; Lopez-Jimenez, F. Diagnostic performance of body mass index to identify obesity as defined by body adiposity: A systematic review and meta-analysis. Int. J. Obes. 2010, 34, 791–799. [Google Scholar] [CrossRef] [Green Version]
- Lee, C.M.; Huxley, R.R.; Wildman, R.P.; Woodward, M. Indices of abdominal obesity are better discriminators of cardiovascular risk factors than BMI: A meta-analysis. J. Clin. Epidemiol. 2008, 61, 646–653. [Google Scholar] [CrossRef]
- Nuttall, F.Q. Body Mass Index: Obesity, BMI, and Health: A Critical Review. Nutr. Today 2015, 50, 117–128. [Google Scholar] [CrossRef] [Green Version]
- Buss, J. Limitations of body mass index to assess body fat. Workplace Health Saf. 2014, 62, 264. [Google Scholar] [CrossRef]
- Joshipura, K.; Muñoz-Torres, F.; Vergara, J.; Palacios, C.; Pérez, C.M. Neck Circumference May Be a Better Alternative to Standard Anthropometric Measures. J. Diabetes Res. 2016, 2016, 6058916. [Google Scholar] [CrossRef] [PubMed] [Green Version]
- Nafiu, O.O.; Burke, C.; Lee, J.; Voepel-Lewis, T.; Malviya, S.; Tremper, K.K. Neck circumference as a screening measure for identifying children with high body mass index. Pediatrics 2010, 126, e306–e310. [Google Scholar] [CrossRef] [PubMed]
- van der Kooy, K.; Seidell, J.C. Techniques for the measurement of visceral fat: A practical guide. International journal of obesity and related metabolic disorders. J. Int. Assoc. Study Obes. 1993, 17, 187–196. [Google Scholar]
- Aswathappa, J.; Garg, S.; Kutty, K.; Shankar, V. Neck circumference as an anthropometric measure of obesity in diabetics. North Am. J. Med. Sci. 2013, 5, 28–31. [Google Scholar] [CrossRef] [PubMed] [Green Version]
- Obesity: Preventing and managing the global epidemic. Report of a WHO consultation. World Health Organ. Tech. Rep. Ser. 2000, 894, 1–253. [Google Scholar]
- Pickering, T.G.; Hall, J.E.; Appel, L.J.; Falkner, B.E.; Graves, J.; Hill, M.N.; Jones, D.W.; Kurtz, T.; Sheps, S.G.; Roccella, E.J. Recommendations for blood pressure measurement in humans and experimental animals: Part 1: Blood pressure measurement in humans: A statement for professionals from the Subcommittee of Professional and Public Education of the American Heart Association Council on High Blood Pressure Research. Circulation 2005, 111, 697–716. [Google Scholar] [CrossRef] [Green Version]
- Levitsky, D.A.; Halbmaier, C.A.; Mrdjenovic, G. The freshman weight gain: A model for the study of the epidemic of obesity. International journal of obesity and related metabolic disorders. J. Int. Assoc. Study Obes. 2004, 28, 1435–1442. [Google Scholar] [CrossRef] [Green Version]
- Craig, C.L.; Marshall, A.L.; Sjöström, M.; Bauman, A.E.; Booth, M.L.; Ainsworth, B.E.; Pratt, M.; Ekelund, U.; Yngve, A.; Sallis, J.F.; et al. International physical activity questionnaire: 12-country reliability and validity. Med. Sci. Sports Exerc. 2003, 35, 1381–1395. [Google Scholar] [CrossRef] [Green Version]
- Laohabut, I.; Udol, K.; Phisalprapa, P.; Srivanichakorn, W.; Chaisathaphol, T.; Washirasaksiri, C.; Sitasuwan, T.; Chouriyagune, C.; Auesomwang, C. Neck circumference as a predictor of metabolic syndrome: A cross-sectional study. Prim. Care Diabetes 2020, 14, 265–273. [Google Scholar] [CrossRef]
- Ozkaya, I.; Tunckale, A. Neck Circumference Positively Related with Central Obesity and Overweight in Turkish University Students: A Preliminary Study. Cent. Eur. J. Public Health 2016, 24, 91–94. [Google Scholar] [CrossRef] [Green Version]
- Stabe, C.; Vasques, A.C.; Lima, M.M.; Tambascia, M.A.; Pareja, J.C.; Yamanaka, A.; Geloneze, B. Neck circumference as a simple tool for identifying the metabolic syndrome and insulin resistance: Results from the Brazilian Metabolic Syndrome Study. Clin. Endocrinol. 2013, 78, 874–881. [Google Scholar] [CrossRef] [PubMed]
- Zhou, J.-Y.; Ge, H.; Zhu, M.-F.; Wang, L.-J.; Chen, L.; Tan, Y.-Z.; Chen, Y.-M.; Zhu, H.-L. Neck circumference as an independent predictive contributor to cardio-metabolic syndrome. Cardiovasc. Diabetol. 2013, 12, 76. [Google Scholar] [CrossRef] [PubMed] [Green Version]
- Zhu, S.; Heymsfield, S.B.; Toyoshima, H.; Wang, Z.; Pietrobelli, A.; Heshka, S. Race-ethnicity–specific waist circumference cutoffs for identifying cardiovascular disease risk factors. Am. J. Clin. Nutr. 2005, 81, 409–415. [Google Scholar] [CrossRef] [PubMed] [Green Version]
- Preis, S.R.; Massaro, J.M.; Robins, S.J.; Hoffmann, U.; Vasan, R.S.; Irlbeck, T.; Meigs, J.B.; Sutherland, P.; D’Agostino, R.B.; O’Donnell, C.J.; et al. Abdominal subcutaneous and visceral adipose tissue and insulin resistance in the Framingham heart study. Obesity 2010, 18, 2191–2198. [Google Scholar] [CrossRef] [PubMed] [Green Version]
- Wang, Y.; Rimm, E.B.; Stampfer, M.J.; Willett, W.C.; Hu, F.B. Comparison of abdominal adiposity and overall obesity in predicting risk of type 2 diabetes among men. Am. J. Clin. Nutr. 2005, 81, 555–563. [Google Scholar] [CrossRef] [Green Version]
- Wang, J.; Thornton, J.C.; Bari, S.; Williamson, B.; Gallagher, D.; Heymsfield, S.B.; Horlick, M.; Kotler, D.; Laferrère, B.; Mayer, L.; et al. Comparisons of waist circumferences measured at 4 sites. Am. J. Clin. Nutr. 2003, 77, 379–384. [Google Scholar] [CrossRef] [Green Version]
- de Onis, M.; Habicht, J.P. Anthropometric reference data for international use: Recommendations from a World Health Organization Expert Committee. Am. J. Clin. Nutr. 1996, 64, 650–658. [Google Scholar] [CrossRef] [Green Version]
- Preis, S.R.; Pencina, M.J.; D’Agostino, R.B.; Meigs, J.B.; Vasan, R.S.; Fox, C.S. Neck Circumference and the Development of Cardiovascular Disease Risk Factors in the Framingham Heart Study. Diabetes Care 2012, 36, e3. [Google Scholar] [CrossRef] [PubMed] [Green Version]
- Goodpaster, B.H.; Krishnaswami, S.; Harris, T.B.; Katsiaras, A.; Kritchevsky, S.B.; Simonsick, E.M.; Nevitt, M.; Holvoet, P.; Newman, A.B. Obesity, regional body fat distribution, and the metabolic syndrome in older men and women. Arch. Intern. Med. 2005, 165, 777–783. [Google Scholar] [CrossRef] [Green Version]
- Kurtoglu, S.; Hatipoglu, N.; Mazicioglu, M.M.; Kondolot, M. Neck circumference as a novel parameter to determine metabolic risk factors in obese children. Eur. J. Clin. Investig. 2012, 42, 623–630. [Google Scholar] [CrossRef]
- Onat, A.; Hergenç, G.; Yüksel, H.; Can, G.; Ayhan, E.; Kaya, Z.; Dursunoğlu, D. Neck circumference as a measure of central obesity: Associations with metabolic syndrome and obstructive sleep apnea syndrome beyond waist circumference. Clin. Nutr. 2009, 28, 46–51. [Google Scholar] [CrossRef] [PubMed]
- Yang, G.-R.; Yuan, S.-Y.; Fu, H.-J.; Wan, G.; Zhu, L.-X.; Bu, X.-L.; Zhang, J.-D.; Du, X.-P.; Li, Y.-L.; Ji, Y.; et al. Neck Circumference Positively Related with Central Obesity, Overweight, and Metabolic Syndrome in Chinese Subjects With Type 2 Diabetes: Beijing Community Diabetes Study 4. Diabetes Care 2010, 33, 2465–2467. [Google Scholar] [CrossRef] [PubMed] [Green Version]
- Santosa, S.; Jensen, M.D. Why are we shaped differently, and why does it matter? Am. J. Physiol. Endocrinol. Metab. 2008, 295, E531–E535. [Google Scholar] [CrossRef] [PubMed] [Green Version]
- Filgueiras, M.D.S.; Albuquerque, F.M.D.; Castro, A.P.P.; Rocha, N.P.; Milagres, L.C.; Novaes, J.F.D. Neck circumference cutoff points to identify excess android fat. J. Pediatr. 2019, 96, 356–363. [Google Scholar] [CrossRef] [PubMed]
- Imafuku, Y. Evaluation of the measurement of waist circumference. Rinsho Byori 2007, 55, 1097–1102. [Google Scholar] [PubMed]


| Male (89; 33.5%) | Female (177; 66.5%) | ||
|---|---|---|---|
| Parameter | Mean ± SD | Mean ± SD | p-Value |
| Age (years) | 20.61 ± 3.15 | 20.54 ± 3.03 | 0.899 |
| BMI (kg/m2) | 25.01 ± 4.48 | 23.68 ± 4.56 | 0.016 |
| Hip circumference (cm) | 101.80 ± 11.83 | 100.82 ± 10.31 | 0.776 |
| Neck circumference (cm) | 38.68 ± 2.75 | 34.79 ± 2.90 | <0.001 |
| Waist circumference (cm) | 89.51 ± 11.34 | 83.74 ± 11.04 | <0.001 |
| LDL-cholesterol (mg/dL) | 100.17 ± 32.70 | 91.85 ± 27.26 | 0.049 |
| Total cholesterol (mg/dL) | 162.87 ± 35.62 | 162.97 ± 28.14 | 0.726 |
| Triglycerides (mg/dL) | 96.70 ± 53.48 | 74.20 ± 31.10 | <0.001 |
| HDL-cholesterol (mg/dL) | 45.18 ± 9.27 | 57.08 ± 12.90 | <0.001 |
| Blood glucose (mg/dL) | 86.61 ± 20.01 | 80.59 ± 6.79 | <0.001 |
| C-reactive protein (mg/) | 2.44 ± 3.21 | 1.83 ± 2.45 | 0.019 |
| Cortisol (nmol/L) | 494.51 ± 158.19 | 387.86 ± 188.47 | <0.001 |
| Systolic blood pressure (mmHg) | 120.45 ± 10.33 | 100.79 ± 10.33 | <0.001 |
| Diastolic blood pressure (mmHg) | 7.57 ± 1.21 | 6.84 ± 0.90 | <0.001 |
| Physical activity (METs) | 2777.93 ± 3255.35 | 1164.05 ± 1611.69 | <0.001 |
| n (%) | n (%) | ||
| Smoking status (Yes) | 37 (41.6%) | 28 (15.8%) | <0.001 |
| Alcohol consumption (Yes) | 17 (19.1%) | 12 (6.8%) | 0.002 |
| Metabolic syndrome (Yes) | 9 (10.1%) | 8 (4.5%) | 0.078 |
| Metabolic Syndrome | |||
|---|---|---|---|
| Absence (n = 249) | Presence (n = 17) | p-Value | |
| Male NC (cm) | 38.45 ± 2.65 | 40.78 ± 2.89 | 0.017 |
| Female NC (cm) | 34.73 ± 2.87 | 36.06 ± 3.42 | 0.298 |
| All participants NC (cm) | 35.92 ± 3.29 | 38.56 ± 3.90 | 0.006 |
| BMI | 23.79 ± 4.30 | 29.11 ± 5.64 | <0.001 |
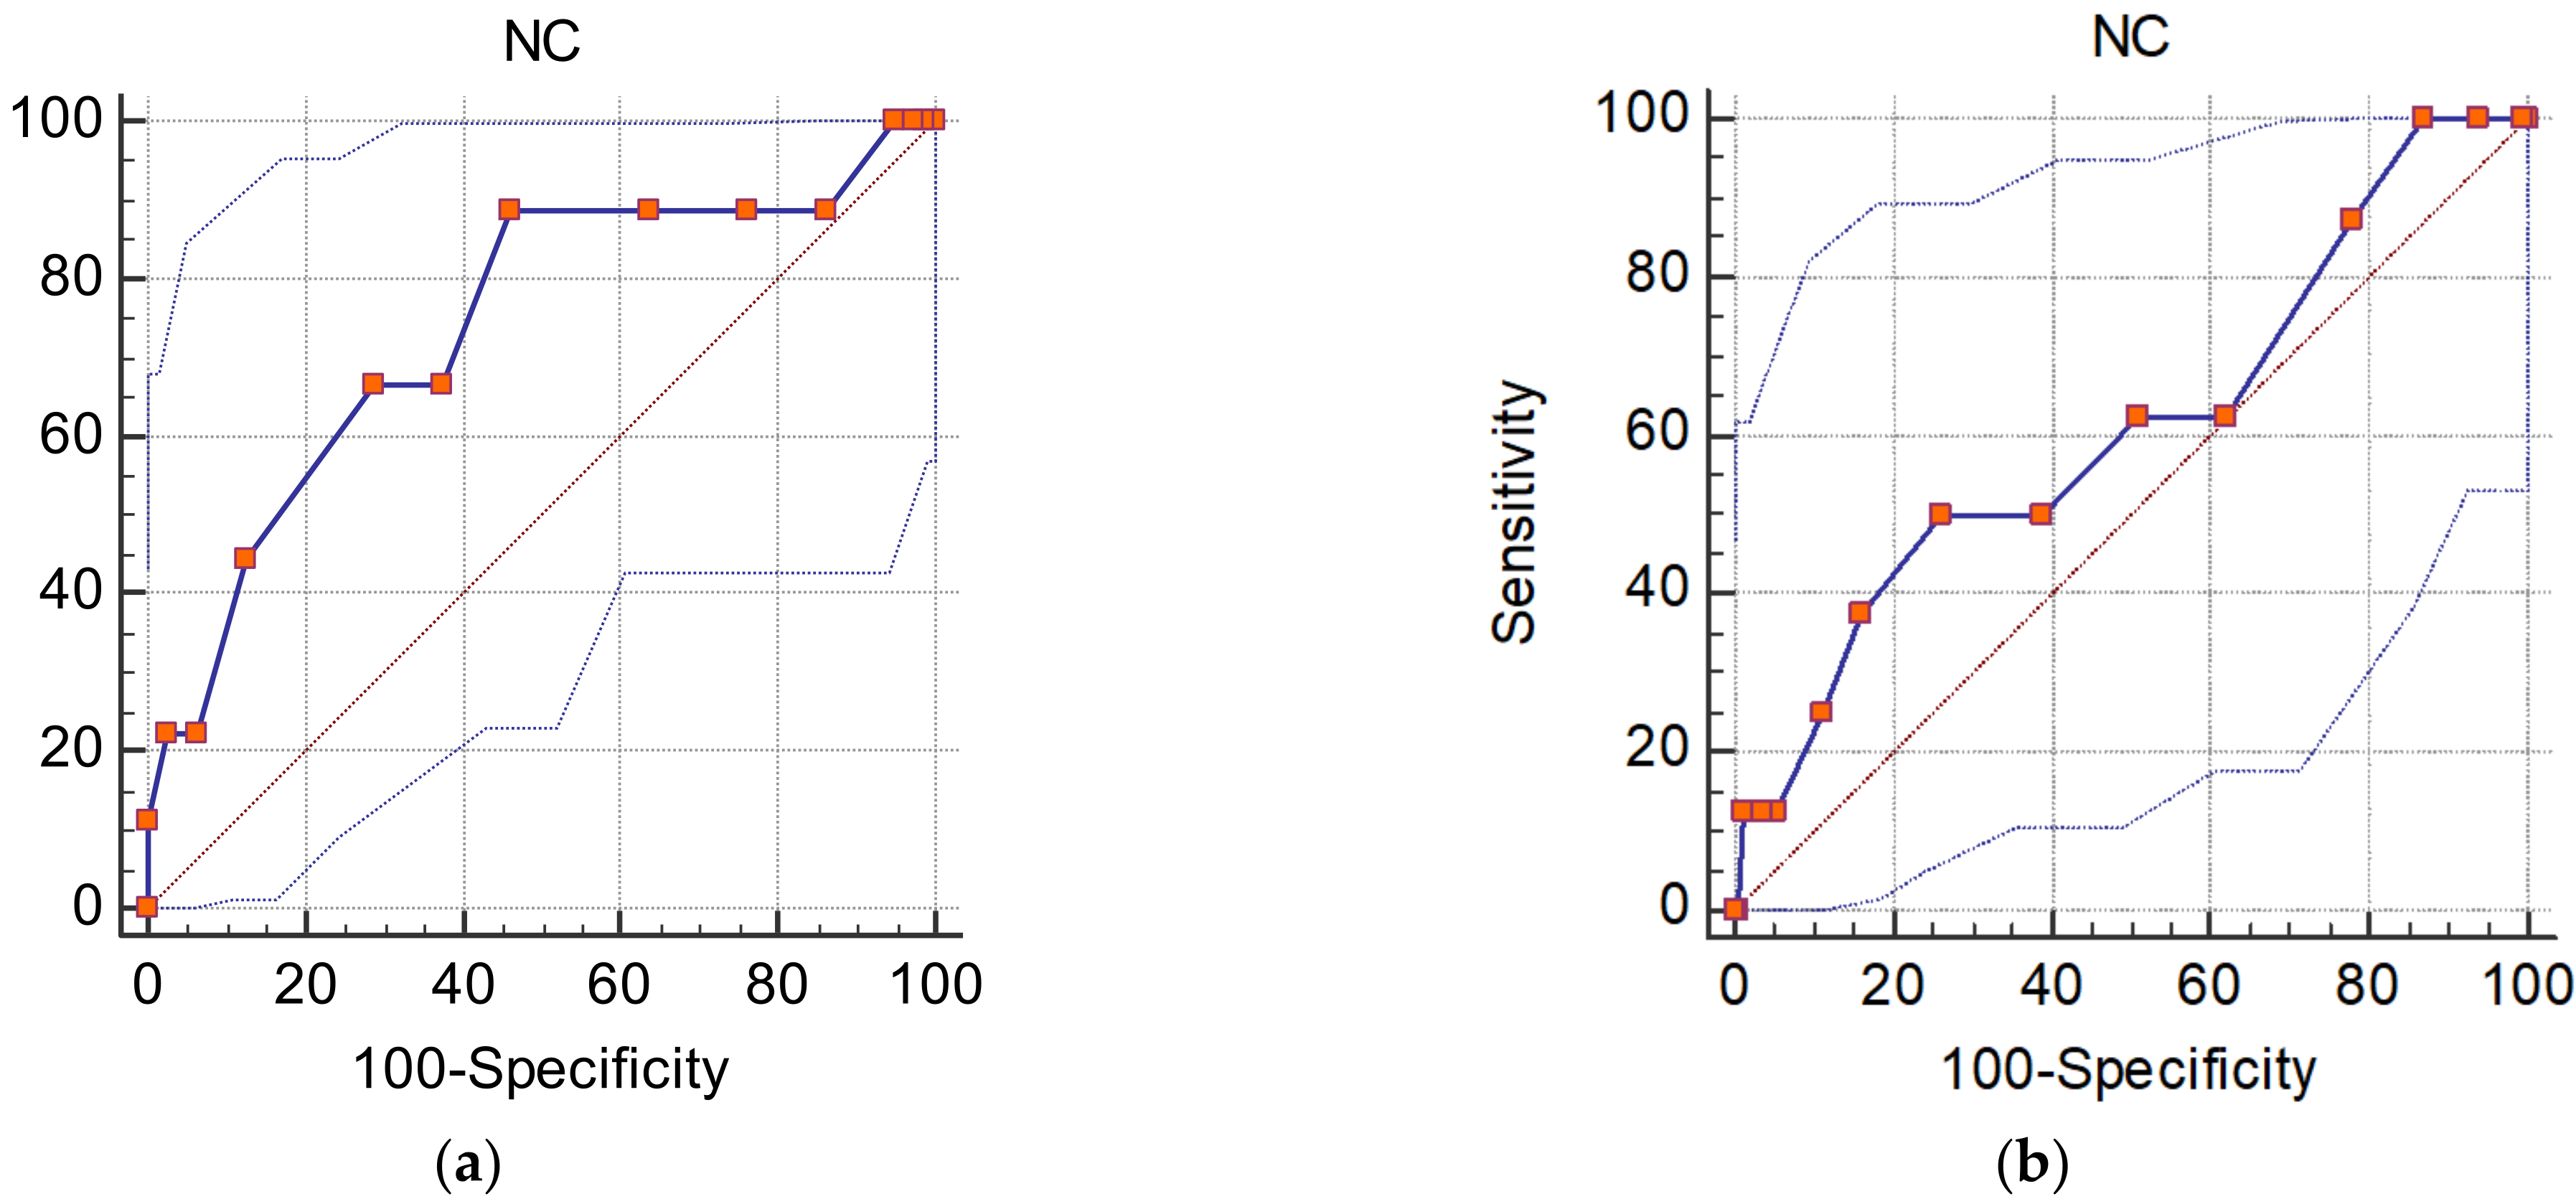
| NC (cm) | Sensitivity | Specificity | PPV | NPV | LR+ | LR− | AUC |
|---|---|---|---|---|---|---|---|
| ≥31 | 100 | 0 | 10.1 | - | 1.00 | - | 0.899 |
| >31 | 100 | 1.25 | 10.2 | 100 | 1.01 | 0 | 0.888 |
| >33 | 100 | 2.50 | 10.3 | 100.0 | 1.03 | 1.03 | 0.876 |
| >34 | 100 | 5.00 | 10.6 | 100.0 | 1.05 | 0.00 | 0.854 |
| >35 | 88.89 | 13.75 | 10.4 | 91.7 | 1.03 | 0.81 | 0.787 |
| >36 | 88.89 | 23.75 | 11.6 | 95.0 | 1.17 | 0.47 | 0.697 |
| >37 | 88.89 | 36.25 | 13.6 | 96.7 | 1.39 | 0.31 | 0.584 |
| >38 | 88.89 | 53.75 | 17.8 | 97.7 | 1.92 | 0.21 | 0.427 |
| >39 | 66.67 | 62.50 | 16.7 | 94.3 | 1.78 | 0.53 | 0.371 |
| >40 | 66.67 | 62.50 | 16.7 | 94.3 | 1.78 | 0.53 | 0.371 |
| NC (cm) | Sensitivity | Specificity | PPV | NPV | LR+ | LR− | AUC |
|---|---|---|---|---|---|---|---|
| ≥29 | 100 | 0 | 4.5 | - | 1.00 | - | 0.955 |
| >29 | 100 | 0.59 | 4.5 | 100 | 1.01 | 0.00 | 0.949 |
| >30 | 100 | 5.92 | 4.8 | 100.0 | 1.03 | 0.00 | 0.898 |
| >31 | 100 | 13.02 | 5.2 | 100.0 | 1.15 | 0.00 | 0.831 |
| >32 | 87.50 | 21.89 | 10.4 | 91.7 | 1.12 | 0.57 | 0.751 |
| >33 | 62.50 | 37.87 | 4.5 | 95.5 | 1.01 | 0.99 | 0.610 |
| >34 | 62.50 | 49.11 | 5.5 | 96.5 | 1.23 | 0.76 | 0.503 |
| >35 | 50.00 | 60.95 | 5.7 | 96.3 | 1.28 | 0.82 | 0.395 |
| >36 | 50.00 | 73.96 | 8.3 | 96.9 | 1.92 | 0.68 | 0.271 |
| >37 | 37.50 | 84.02 | 10.0 | 96.6 | 2.35 | 0.74 | 0.181 |
| Neck Circumference | ||||||
|---|---|---|---|---|---|---|
| Males | Females | All | ||||
| r | p-Value | r | p-Value | r | p-Value | |
| Age (years) | 0.04 | 0.697 | −0.006 | 0.932 | 0.01 | 0.863 |
| BMI (kg/m2) | 0.55 | <0.001 | 0.53 | <0.001 | 0.52 | <0.001 |
| Hip circumference (cm) | 0.47 | <0.001 | 0.50 | <0.001 | 0.41 | <0.001 |
| LDL-cholesterol (mg/dL) | 0.18 | 0.082 | 0.18 | 0.012 | 0.22 | <0.001 |
| Total cholesterol (mg/dL) | 0.23 | 0.024 | 0.13 | 0.64 | 0.13 | 0.34 |
| C-reactive protein (mg/L) | 0.18 | 0.083 | 0.20 | 0.007 | 0.25 | <0.001 |
| Cortisol (nmol/L) | −0.02 | 0.845 | −0.06 | 0.411 | 0.14 | 0.018 |
| Physical activity (METs) | −0.04 | 0.677 | −0.007 | 0.922 | 0.13 | 0.027 |
| Waist circumference (cm) | 0.46 | <0.001 | 0.49 | <0.001 | 0.51 | <0.001 |
| Systolic blood pressure (mmHg) | 0.10 | 0.343 | 0.18 | 0.012 | 0.40 | <0.001 |
| Diastolic blood pressure (mmHg) | 0.15 | 0.143 | 0.08 | 0.260 | 0.26 | <0.001 |
| Blood glucose (mg/dL) | −0.05 | 0.622 | 0.23 | 0.002 | 0.26 | <0.001 |
| Triglycerides (mg/dL) | 0.31 | 0.003 | 0.06 | 0.380 | 0.24 | <0.001 |
| HDL-cholesterol (mg/dL) | −0.05 | 0.59 | −0.22 | 0.003 | −0.39 | <0.001 |
Publisher’s Note: MDPI stays neutral with regard to jurisdictional claims in published maps and institutional affiliations. |
© 2022 by the authors. Licensee MDPI, Basel, Switzerland. This article is an open access article distributed under the terms and conditions of the Creative Commons Attribution (CC BY) license (https://creativecommons.org/licenses/by/4.0/).
Share and Cite
Haidar, S.A.; de Vries, N.; Poulia, K.-A.; Hassan, H.; Rached, M.; Karavetian, M. Neck Circumference as a Screening Tool for Metabolic Syndrome among Lebanese College Students. Diseases 2022, 10, 31. https://doi.org/10.3390/diseases10020031
Haidar SA, de Vries N, Poulia K-A, Hassan H, Rached M, Karavetian M. Neck Circumference as a Screening Tool for Metabolic Syndrome among Lebanese College Students. Diseases. 2022; 10(2):31. https://doi.org/10.3390/diseases10020031
Chicago/Turabian StyleHaidar, Suzan A., Nanne de Vries, Kalliopi-Anna Poulia, Hussein Hassan, Mohammad Rached, and Mirey Karavetian. 2022. "Neck Circumference as a Screening Tool for Metabolic Syndrome among Lebanese College Students" Diseases 10, no. 2: 31. https://doi.org/10.3390/diseases10020031
APA StyleHaidar, S. A., de Vries, N., Poulia, K.-A., Hassan, H., Rached, M., & Karavetian, M. (2022). Neck Circumference as a Screening Tool for Metabolic Syndrome among Lebanese College Students. Diseases, 10(2), 31. https://doi.org/10.3390/diseases10020031