
Risk of Insulin Resistance in 44,939 Spanish Healthcare Workers: Association with Sociodemographic Variables and Healthy Habits

 , , , , , and
Abstract
:1. Introduction
- TyG index: this index has demonstrated a strong correlation with the hyperinsulinemic clamp and is validated as a reliable predictor of diabetes, metabolic syndrome, and cardiovascular risk [25].
- SPISE-IR: this index is designed to estimate insulin sensitivity in non-diabetic populations and is highly useful for detecting IR in individuals with obesity [26].
- METS-IR: this score reflects the overall metabolic status and is helpful for identifying IR and stratifying the risk of metabolic complications across diverse populations [27].
2. Methods
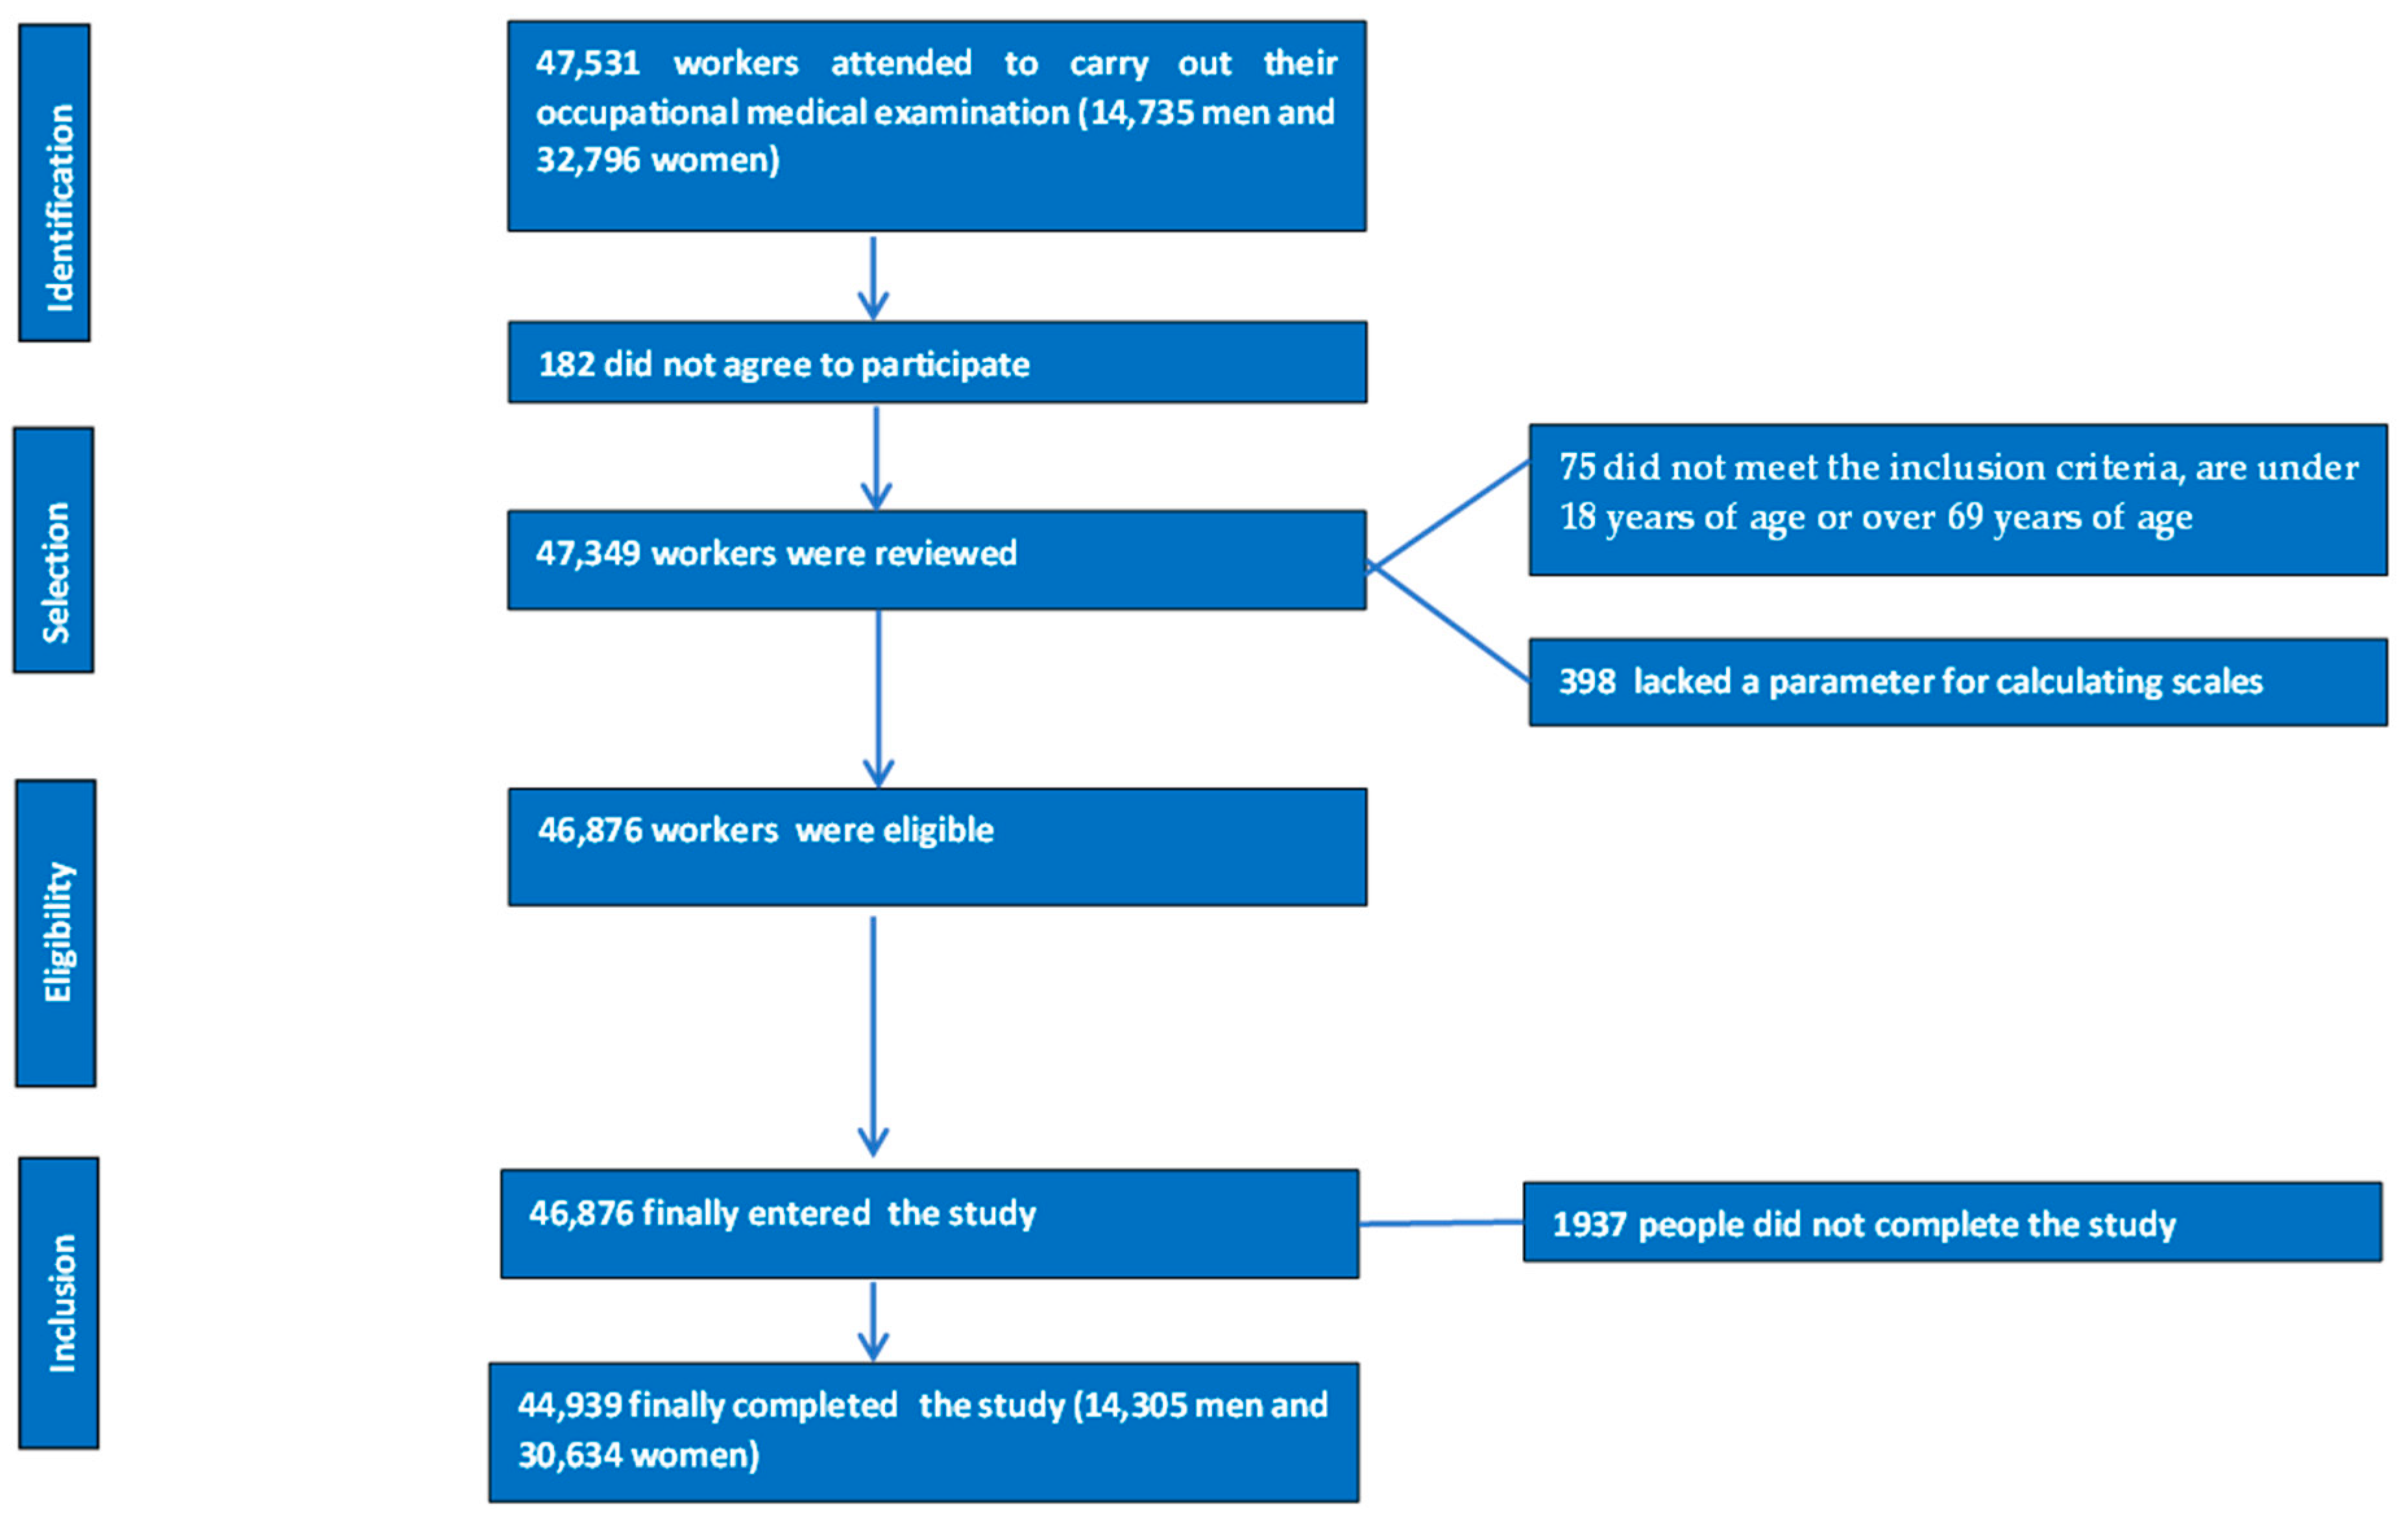
2.1. Study Design and Sample
2.1.1. Inclusion Criteria
- Aged between 18 and 69 years.
- Employed by one of the participating companies.
- Provided informed consent to participate in the study.
- Authorized the use of their data for epidemiological purposes.
2.1.2. Exclusion Criteria
- Age under 18 or over 69 years.
- No employment contract with a participating company.
- Did not provide informed consent to participate in the study.
- Did not authorize the use of their data for epidemiological purposes.
2.2. Data Collection Procedures
- Medical History: sociodemographic information (e.g., age, gender, occupation) and health-related data, such as smoking status, physical activity levels, adherence to the Mediterranean diet, and stress levels, were gathered.
- Physical and Clinical Measurements: parameters including height, weight, waist circumference, hip circumference, and systolic and diastolic blood pressure were recorded.
- Laboratory Tests: biochemical variables, such as lipid profiles, liver function markers, and fasting blood glucose levels, were analyzed.
- Height and Weight: measured using a SECA 700 scale and a SECA 220 stadiometer (SECA, Chino, CA, USA), with participants dressed only in underwear.
- Circumferences: Waist circumference was measured using a SECA measuring tape, positioned midway between the lowest rib and the iliac crest. Hip circumference was measured at the widest point of the buttocks, with participants standing upright and relaxed.
- Blood Pressure: Taken with an OMRON-M3 sphygmomanometer (OM RON, Osaka, Japan) after 10 min of rest in a seated position. Participants were instructed to abstain from food, beverages, and tobacco for at least one hour prior. Three measurements were taken at one-minute intervals, and the average was calculated.
- Triglycerides, total cholesterol, and glucose: measured using enzymatic methods.
- HDL cholesterol: measured using a precipitation method.
- LDL cholesterol: calculated using the Friedewald formula when triglycerides were below 400 mg/dL.
- TyG index [40]: calculated as TyG = LN (triglycerides × glycemia/2), with values of 8.5 or higher considered as high risk.
- Single-Point Insulin Sensitivity Estimator (SPISE): Calculated as SPISE = (600 × HDL^0.185)/(triglycerides^0.2 × BMI^1.338). SPISE-IR = 10/SPISE high-risk values are defined as 1.51 or above [41].
- Metabolic Score for Insulin Resistance (METS-IR) [42]: Calculated as METS-IR = LN(2 × glucose) + (triglycerides × BMI)/LN(HDL-c). High-risk values are defined as 50 or above.
2.3. Operational Definitions
- Professional Categories: healthcare workers were classified into four groups: physicians, nurses, health technicians (laboratory, pathology, and radiology), and nursing assistants or orderlies.
- Smoking: defined as consuming at least one cigarette per day within the past 30 days or having quit smoking within the past year.
- Mediterranean Diet Adherence: assessed using the PREDIMED questionnaire, with high adherence classified as a score of 9 or higher [43].
- Physical Activity: measured using the International Physical Activity Questionnaire (IPAQ), evaluating the frequency, duration, and intensity of physical activity [44].
2.4. Statistical Analysis
2.5. Ethical Considerations
3. Results
4. Discussion
Strengths and Limitations
5. Conclusions
Author Contributions
Funding
Institutional Review Board Statement
Informed Consent Statement
Data Availability Statement
Conflicts of Interest
References
- Fahed, G.; Aoun, L.; Bou Zerdan, M.; Allam, S.; Bou Zerdan, M.; Bouferraa, Y.; Assi, H.I. Metabolic Syndrome: Updates on Pathophysiology and Management in 2021. Int. J. Mol. Sci. 2022, 23, 786. [Google Scholar] [CrossRef] [PubMed] [PubMed Central]
- Tanase, D.M.; Gosav, E.M.; Costea, C.F.; Ciocoiu, M.; Lacatusu, C.M.; Maranduca, M.A.; Ouatu, A.; Floria, M. The Intricate Relationship between Type 2 Diabetes Mellitus (T2DM), Insulin Resistance (IR), and Nonalcoholic Fatty Liver Disease (NAFLD). J. Diabetes Res. 2020, 2020, 3920196. [Google Scholar] [CrossRef] [PubMed] [PubMed Central]
- Da Silva, A.A.; do Carmo, J.M.; Li, X.; Wang, Z.; Mouton, A.J.; Hall, J.E. Role of Hyperinsulinemia and Insulin Resistance in Hypertension: Metabolic Syndrome Revisited. Can. J. Cardiol. 2020, 36, 671–682. [Google Scholar] [CrossRef] [PubMed] [PubMed Central]
- Bucher, M.; Montaniel, K.R.C.; Myatt, L.; Weintraub, S.; Tavori, H.; Maloyan, A. Dyslipidemia, insulin resistance, and impairment of placental metabolism in the offspring of obese mothers. J. Dev. Orig. Health Dis. 2021, 12, 738–747. [Google Scholar] [CrossRef] [PubMed] [PubMed Central]
- Kosmas, C.E.; Bousvarou, M.D.; Kostara, C.E.; Papakonstantinou, E.J.; Salamou, E.; Guzman, E. Insulin resistance and cardiovascular disease. J. Int. Med. Res. 2023, 51, 3000605231164548. [Google Scholar] [CrossRef] [PubMed] [PubMed Central]
- Ahmed, B.; Sultana, R.; Greene, M.W. Adipose tissue and insulin resistance in obese. Biomed. Pharmacother. 2021, 137, 111315. [Google Scholar] [CrossRef] [PubMed]
- Lee, S.H.; Park, S.Y.; Choi, C.S. Insulin Resistance: From Mechanisms to Therapeutic Strategies. Diabetes Metab. J. 2022, 46, 15–37. [Google Scholar] [CrossRef] [PubMed] [PubMed Central]
- Van Gerwen, J.; Shun-Shion, A.S.; Fazakerley, D.J. Insulin signalling and GLUT4 trafficking in insulin resistance. Biochem. Soc. Trans. 2023, 51, 1057–1069. [Google Scholar] [CrossRef] [PubMed] [PubMed Central]
- Knudsen, J.R.; Persson, K.W.; Henriquez-Olguin, C.; Li, Z.; Di Leo, N.; Hesselager, S.A.; Raun, S.H.; Hingst, J.R.; Trouillon, R.; Wohlwend, M.; et al. Microtubule-mediated GLUT4 trafficking is disrupted in insulin-resistant skeletal muscle. Elife 2023, 12, e83338. [Google Scholar] [CrossRef] [PubMed] [PubMed Central]
- Li, H.; Meng, Y.; He, S.; Tan, X.; Zhang, Y.; Zhang, X.; Wang, L.; Zheng, W. Macrophages, Chronic Inflammation, and Insulin Resistance. Cells 2022, 11, 3001. [Google Scholar] [CrossRef] [PubMed] [PubMed Central]
- Yaribeygi, H.; Sathyapalan, T.; Atkin, S.L.; Sahebkar, A. Molecular Mechanisms Linking Oxidative Stress and Diabetes Mellitus. Oxid. Med. Cell Longev. 2020, 2020, 8609213. [Google Scholar] [CrossRef] [PubMed] [PubMed Central]
- Azhar, M.; Watson, L.P.; De Lucia Rolfe, E.; Ferraro, M.; Carr, K.; Worsley, J.; Boesch, C.; Hodson, L.; Chatterjee, K.K.; Kemp, G.J.; et al. Association of insulin resistance with the accumulation of saturated intramyocellular lipid: A comparison with other fat stores. NMR Biomed. 2024, 37, e5117. [Google Scholar] [CrossRef] [PubMed]
- He, F.F.; Li, Y.M. Role of gut microbiota in the development of insulin resistance and the mechanism underlying polycystic ovary syndrome: A review. J. Ovarian Res. 2020, 13, 73. [Google Scholar] [CrossRef] [PubMed] [PubMed Central]
- Muniyappa, R. Vascular Insulin Resistance and Free Fatty Acids: The Micro-Macro Circulation Nexus. J. Clin. Endocrinol. Metab. 2024, 109, e1671–e1672. [Google Scholar] [CrossRef] [PubMed]
- Chaurasia, B.; Summers, S.A. Ceramides in Metabolism: Key Lipotoxic Players. Annu. Rev. Physiol. 2021, 83, 303–330. [Google Scholar] [CrossRef] [PubMed] [PubMed Central]
- Elkanawati, R.Y.; Sumiwi, S.A.; Levita, J. Impact of Lipids on Insulin Resistance: Insights from Human and Animal Studies. Drug Des. Dev. Ther. 2024, 18, 3337–3360. [Google Scholar] [CrossRef] [PubMed] [PubMed Central]
- Zhao, S.L.; Liu, D.; Ding, L.Q.; Liu, G.K.; Yao, T.; Wu, L.L.; Li, G.; Cao, S.J.; Qiu, F.; Kang, N. Schisandra chinensis lignans improve insulin resistance by targeting TLR4 and activating IRS-1/PI3K/AKT and NF-κB signaling pathways. Int. Immunopharmacol. 2024, 142 Pt A, 113069. [Google Scholar] [CrossRef] [PubMed]
- Ramasubbu, K.; Devi Rajeswari, V. Impairment of insulin signaling pathway PI3K/Akt/mTOR and insulin resistance induced AGEs on diabetes mellitus and neurodegenerative diseases: A perspective review. Mol. Cell Biochem. 2023, 478, 1307–1324. [Google Scholar] [CrossRef] [PubMed]
- Bravo, C.; Mericq, V.; Pereira, A.; Corvalán, C.; Tobar, H.E.; Miranda, J.P.; Santos, J.L. Association between plasma leptin/adiponectin ratio and insulin resistance indexes in prepubertal children. Arch. Endocrinol. Metab. 2024, 68, e220353. [Google Scholar] [CrossRef] [PubMed] [PubMed Central]
- Huang, S.; Liang, H.; Chen, Y.; Liu, C.; Luo, P.; Wang, H.; Du, Q. Hypoxanthine ameliorates diet-induced insulin resistance by improving hepatic lipid metabolism and gluconeogenesis via AMPK/mTOR/PPARα pathway. Life Sci. 2024, 357, 123096. [Google Scholar] [CrossRef] [PubMed]
- Rebelos, E.; Mari, A.; Honka, M.J.; Pekkarinen, L.; Latva-Rasku, A.; Laurila, S.; Rajander, J.; Salminen, P.; Iida, H.; Ferrannini, E.; et al. Renal Cortical Glucose Uptake Is Decreased in Insulin Resistance and Correlates Inversely With Serum Free-fatty Acids. J. Clin. Endocrinol. Metab. 2024, 109, 1033–1040. [Google Scholar] [CrossRef] [PubMed]
- Diaz-Vegas, A.; Madsen, S.; Cooke, K.C.; Carroll, L.; Khor, J.X.; Turner, N.; Lim, X.Y.; Astore, M.A.; Morris, J.C.; Don, A.S.; et al. Mitochondrial electron transport chain, ceramide, and coenzyme Q are linked in a pathway that drives insulin resistance in skeletal muscle. Elife 2023, 12, RP87340. [Google Scholar] [CrossRef] [PubMed] [PubMed Central]
- Zelis, M.; Simonis, A.M.; van Dam, R.M.; Boomsma, D.I.; van Lee, L.; Kramer, M.H.; Serné, E.H.; van Raalte, D.H.; Mari, A.; de Geus, E.J.; et al. Development of a Diabetes Dietary Quality Index: Reproducibility and Associations with Measures of Insulin Resistance, Beta Cell Function, and Hyperglycemia. Nutrients 2024, 16, 3512. [Google Scholar] [CrossRef] [PubMed] [PubMed Central]
- Hu, H.; Nakagawa, T.; Honda, T.; Yamamoto, S.; Mizoue, T. Should insulin resistance (HOMA-IR), insulin secretion (HOMA-β), and visceral fat area be considered for improving the performance of diabetes risk prediction models. BMJ Open Diabetes Res. Care 2024, 12, e003680. [Google Scholar] [CrossRef] [PubMed] [PubMed Central]
- Manzanero, R.Z.; López-González, A.A.; Tomás-Gil, P.; Paublini, H.; Martínez-Jover, A.; Ramírez-Manent, J.I. Estimation of cardiometabolic risk in 25.030 Spanish kitchen workers. Acad. J. Health Sci. 2023, 38, 101–110. [Google Scholar] [CrossRef]
- Ramírez-Manent, J.I.; López-González, Á.A.; Martínez-Almoyna Rifá, E.; Paublini Oliveira, H.; Martorell Sánchez, C.; Tárraga López, P.J. Association between sociodemographic variables, healthy habits and stress with insulin resistance risk scales. J. Health. Sci. 2025, 40, 107–116. [Google Scholar]
- Aguiló Juanola, M.C.; López-González, A.A.; Tomás-Gil, P.; Paublini, H.; Tárraga-López, P.J.; Ramírez-Manent, J.I. Influence of tobacco consumption on the values of different insulin resistance risk scales and non-alcoholic fatty liver disease and hepatic fibrosis scales in 418,343 spanish people. Acad. J. Health Sci. 2024, 39, 9–15. [Google Scholar] [CrossRef]
- Tong, Y.; Xu, S.; Huang, L.; Chen, C. Obesity and insulin resistance: Pathophysiology and treatment. Drug Discov. Today 2022, 27, 822–830. [Google Scholar] [CrossRef] [PubMed]
- Neeland, I.J.; Lim, S.; Tchernof, A.; Gastaldelli, A.; Rangaswami, J.; Ndumele, C.E.; Powell-Wiley, T.M.; Després, J.P. Metabolic syndrome. Nat. Rev. Dis. Primers 2024, 10, 77. [Google Scholar] [CrossRef] [PubMed]
- Alrashed, F.A.; Iqbal, M.; Alsubiheen, A.M.; Ahmad, T. Exploring determinants of sex and family history-based disparity in type 2 diabetes mellitus prevalence among clinical patients. BMC Public Health 2024, 24, 682. [Google Scholar] [CrossRef] [PubMed] [PubMed Central]
- Mishra, M.; Wu, J.; Kane, A.E.; Howlett, S.E. The intersection of frailty and metabolism. Cell Metab. 2024, 36, 893–911. [Google Scholar] [CrossRef] [PubMed] [PubMed Central]
- Dubey, P.; Singh, V.; Venishetty, N.; Trivedi, M.; Reddy, S.Y.; Lakshmanaswamy, R.; Dwivedi, A.K. Associations of sex hormone ratios with metabolic syndrome and inflammation in US adult men and women. Front. Endocrinol. 2024, 15, 1384603. [Google Scholar] [CrossRef] [PubMed] [PubMed Central]
- Abbate, M.; Pericas, J.; Yañez, A.M.; López-González, A.A.; De Pedro-Gómez, J.; Aguilo, A.; Morales-Asencio, J.M.; Bennasar-Veny, M. Socioeconomic Inequalities in Metabolic Syndrome by Age and Gender in a Spanish Working Population. Int. J. Environ. Res. Public Health 2021, 18, 10333. [Google Scholar] [CrossRef] [PubMed] [PubMed Central]
- Christakis, M.K.; Hasan, H.; De Souza, L.R.; Shirreff, L. The effect of menopause on metabolic syndrome: Cross-sectional results from the Canadian Longitudinal Study on Aging. Menopause 2020, 27, 999–1009. [Google Scholar] [CrossRef] [PubMed]
- Saki, N.; Hashemi, S.J.; Hosseini, S.A.; Rahimi, Z.; Rahim, F.; Cheraghian, B. Socioeconomic status and metabolic syndrome in Southwest Iran: Results from Hoveyzeh Cohort Study (HCS). BMC Endocr. Disord. 2022, 22, 332. [Google Scholar] [CrossRef] [PubMed] [PubMed Central]
- Da Silva Moura, A.R.; da Paz, S.M.R.S.; Frota, K.D.M.G.; de Carvalho, C.M.R.G. Lifestyle associated with risk of metabolic syndrome in adults and the elderly. Nutrition 2022, 99–100, 111647. [Google Scholar] [CrossRef] [PubMed]
- Janssen, T.I.; Voelcker-Rehage, C. Leisure-time physical activity, occupational physical activity and the physical activity paradox in healthcare workers: A systematic overview of the literature. Int. J. Nurs. Stud. 2023, 141, 104470. [Google Scholar] [CrossRef] [PubMed]
- Montemayor, S.; Mascaró, C.M.; Ugarriza, L.; Casares, M.; Llompart, I.; Abete, I.; Zulet, M.Á.; Martínez, J.A.; Tur, J.A.; Bouzas, C. Adherence to Mediterranean Diet and NAFLD in Patients with Metabolic Syndrome: The FLIPAN Study. Nutrients 2022, 14, 3186. [Google Scholar] [CrossRef]
- Tosoratto, J.; López, P.J.T.; López-González, Á.A.; Vallejos, D.; Rifá, E.M.-A.; Ramirez-Manent, J.I. Association of Shift Work, Sociodemographic Variables and Healthy Habits with Obesity Scales. Life 2024, 14, 1503. [Google Scholar] [CrossRef]
- Vicente-Herrero, M.T.; Egea-Sancho, M.; Ramírez Iñiguez de la Torre, M.V.; López-González, A.A. Relación de los índices de adiposidad visceral (VAI) y adiposidad disfuncional (DAI) con las escalas de riesgo de resistencia a la insulina y prediabetes. Acad. J. Health Sci. 2024, 39, 25–31. [Google Scholar] [CrossRef]
- Vicente-Herrero, M.T.; Gordito Soler, M.; García Agudo, S.; Vallejos, D.; López-González, A.A.; Ramírez-Manent, J.I. Cardiometabolic risk level in 1136 Spanish professional musicians. Acad. J. Health Sci. 2024, 39, 59–66. [Google Scholar] [CrossRef]
- Duan, M.; Zhao, X.; Li, S.; Miao, G.; Bai, L.; Zhang, Q.; Yang, W.; Zhao, X. Metabolic score for insulin resistance (METS-IR) predicts all-cause and cardiovascular mortality in the general population: Evidence from NHANES 2001–2018. Cardiovasc Diabetol. 2024, 23, 243. [Google Scholar] [CrossRef] [PubMed] [PubMed Central]
- Katsimbri, P.; Grivas, A.; Papadavid, E.; Tzannis, K.; Flouda, S.; Moysidou, G.S.; Kosmetatou, M.; Kapniari, I.; Fanouriakis, A.; Boumpas, D.T. Mediterranean diet and exercise are associated with better disease control in psoriatic arthritis. Clin. Rheumatol. 2024, 43, 2877–2887. [Google Scholar] [CrossRef] [PubMed]
- Mestre-Font, M.; Busquets-Cortés, C.; Ramírez-Manent, J.I.; Tomás-Gil, P.; Paublini, H.; López-González, A.A. Influence of sociodemographic variables and healthy habits on the values of type 2 diabetes risk scales. Acad. J. Health Sci. 2024, 39, 99–106. [Google Scholar] [CrossRef]
- Yazıcı, D.; Demir, S.Ç.; Sezer, H. Insulin Resistance, Obesity, and Lipotoxicity. Adv. Exp. Med. Biol. 2024, 1460, 391–430. [Google Scholar] [CrossRef] [PubMed]
- Guillet, C.; Boirie, Y. Insulin resistance: A contributing factor to age-related muscle mass loss? Diabetes Metab. 2005, 31, S20–S25. [Google Scholar] [CrossRef] [PubMed]
- Sun, J.; Zhang, Y.; Zhang, Q.; Hu, L.; Zhao, L.; Wang, H.; Yuan, Y.; Niu, H.; Wang, D.; Zhang, H.; et al. Metabolic regulator LKB1 controls adipose tissue ILC2 PD-1 expression and mitochondrial homeostasis to prevent insulin resistance. Immunity 2024, 57, 1289–1305.e9. [Google Scholar] [CrossRef] [PubMed]
- Koh-Banerjee, P. Age-related changes in insulin sensitivity and resistance. Diabetes Res. Clin. Pract. 2022, 185, 109–115. [Google Scholar]
- Mestre Font, M.; Busquets-Cortés, C.; Ramírez-Manent, J.I.; Tomás-Gil, P.; Paublini, H.; López-González, Á.A. Influence of Sociodemographic Variables and Healthy Habits on the Values of Insulin Resistance Indicators in 386,924 Spanish Workers. Nutrients 2023, 15, 5122. [Google Scholar] [CrossRef] [PubMed] [PubMed Central]
- Chen, K.W.; Meng, F.C.; Shih, Y.L.; Su, F.Y.; Lin, Y.P.; Lin, F.; Lin, J.W.; Chang, W.K.; Lee, C.J.; Li, Y.H.; et al. Sex-Specific Association between Metabolic Abnormalities and Elevated Alanine Aminotransferase Levels in a Military Cohort: The CHIEF Study. Int. J. Environ. Res. Public Health 2018, 15, 545. [Google Scholar] [CrossRef] [PubMed] [PubMed Central]
- De Paoli, M.; Zakharia, A.; Werstuck, G.H. The Role of Estrogen in Insulin Resistance: A Review of Clinical and Preclinical Data. Am. J. Pathol. 2021, 191, 1490–1498. [Google Scholar] [CrossRef] [PubMed]
- García Agudo, S.; González Casquero, R.; Vallejos, D.; Eugercios Escribano, H.; Roberto Martín, J.A.; Gil Llinás, M. Relevancia de los índices aterogénicos como predictores precoces de riesgo cardiovascular en el contexto laboral de los profesionales sanitarios. Acad. J. Health Sci. 2024, 39, 15–22. [Google Scholar] [CrossRef]
- Rättö, H. Socioeconomic inequalities in insulin initiation among individuals with type 2 diabetes—A quasi-experimental nationwide register study. SSM Popul. Health 2022, 19, 101178. [Google Scholar] [CrossRef] [PubMed] [PubMed Central]
- Sánchez-Rodríguez, A. Socioeconomic status and insulin resistance in healthcare workers. Diabetes Metab. Syndr. Obes. 2023, 16, 103–110. [Google Scholar]
- Ladeira, L.L.C.; Nascimento, G.G.; Leite, F.R.M.; Alves-Costa, S.; Barbosa, J.M.A.; Alves, C.M.C.; Thomaz, E.B.A.F.; Batista, R.F.L.; Ribeiro, C.C.C. Obesity, Insulin Resistance, Caries, and Periodontitis: Syndemic Framework. Nutrients 2023, 15, 3512. [Google Scholar] [CrossRef] [PubMed] [PubMed Central]
- Mukharjee, S.; Bank, S.; Maiti, S. Chronic Tobacco Exposure by Smoking Develops Insulin Resistance. Endocr. Metab. Immune Disord. Drug Targets 2020, 20, 869–877. [Google Scholar] [CrossRef] [PubMed]
- Krishnamoorthy, Y.; Rajaa, S.; Murali, S.; Sahoo, J.; Kar, S.S. Association between behavioural risk factors and metabolic syndrome among adult population in India: A systematic review and meta-analysis of observational studies. Nutr. Metab. Cardiovasc. Dis. 2022, 32, 40–52. [Google Scholar] [CrossRef] [PubMed]
- García-Mayor, J.; Moreno-Llamas, A.; De la Cruz-Sánchez, E. Prevalencia de tabaquismo y hábitos de vida relacionados con la salud en función del uso del tabaco tras la implantación de la Ley 42/2010: Análisis de encuestas de salud en España 2009–2017. Rev. Española De Salud Pública 2019, 93, e201907042. (In Spanish) [Google Scholar] [PubMed] [PubMed Central]
- Kumar, A.S.; Maiya, A.G.; Shastry, B.A.; Vaishali, K.; Ravishankar, N.; Hazari, A.; Gundmi, S.; Jadhav, R. Exercise and insulin resistance in type 2 diabetes mellitus: A systematic review and meta-analysis. Ann. Phys. Rehabil. Med. 2019, 62, 98–103. [Google Scholar] [CrossRef] [PubMed]
- Małkowska, P. Positive Effects of Physical Activity on Insulin Signaling. Curr. Issues Mol. Biol. 2024, 46, 5467–5487. [Google Scholar] [CrossRef] [PubMed] [PubMed Central]
- Melnyk, B.M.; Kelly, S.A.; Stephens, J.; Dhakal, K.; McGovern, C.; Tucker, S.; Hoying, J.; McRae, K.; Ault, S.; Spurlock, E.; et al. Interventions to Improve Mental Health, Well-Being, Physical Health, and Lifestyle Behaviors in Physicians and Nurses: A Systematic Review. Am. J. Health Promot. 2020, 34, 929–941. [Google Scholar] [CrossRef] [PubMed] [PubMed Central]
- Mirabelli, M.; Chiefari, E.; Arcidiacono, B.; Corigliano, D.M.; Brunetti, F.S.; Maggisano, V.; Russo, D.; Foti, D.P.; Brunetti, A. Mediterranean Diet Nutrients to Turn the Tide against Insulin Resistance and Related Diseases. Nutrients 2020, 12, 1066. [Google Scholar] [CrossRef] [PubMed] [PubMed Central]
- Papadaki, A.; Nolen-Doerr, E.; Mantzoros, C.S. The Effect of the Mediterranean Diet on Metabolic Health: A Systematic Review and Meta-Analysis of Controlled Trials in Adults. Nutrients 2020, 12, 3342. [Google Scholar] [CrossRef] [PubMed] [PubMed Central]
- Di Lorenzo, L.; Vimercati, L.; Pipoli, A.; Manghisi, N.M.; Lampignano, L.; Caputi, A.; De Maria, L.; Zupo, R.; De Pergola, G. Interplay Between Adherence to the Mediterranean Diet and Lipid Profile: A Comparative Survey Between Day-Time Healthcare and Non-healthcare Female Workers. Front. Public Health 2021, 9, 649760. [Google Scholar] [CrossRef] [PubMed] [PubMed Central]
- Ramdas Nayak, V.K.; Satheesh, P.; Shenoy, M.T.; Kalra, S. Triglyceride Glucose (TyG) Index: A surrogate biomarker of insulin resistance. J. Pak. Med. Assoc. 2022, 72, 986–988. [Google Scholar] [CrossRef] [PubMed]
- Rattanatham, R.; Tangpong, J.; Chatatikun, M.; Sun, D.; Kawakami, F.; Imai, M.; Klangbud, W.K. Assessment of eight insulin resistance surrogate indexes for predicting metabolic syndrome and hypertension in Thai law enforcement officers. PeerJ 2023, 11, e15463. [Google Scholar] [CrossRef] [PubMed] [PubMed Central]
- Lertsakulbunlue, S.; Mungthin, M.; Rangsin, R.; Kantiwong, A.; Sakboonyarat, B. Relationship between triglyceride-glucose index and aminotransferase among Royal Thai Army personnel 2017–2021: A serial cross-sectional study. Lipids Health Dis. 2023, 22, 47. [Google Scholar] [CrossRef] [PubMed] [PubMed Central]
- Ramírez Gallegos, I.; Marina Arroyo, M.; López-González, Á.A.; Vicente-Herrero, M.T.; Vallejos, D.; Sastre-Alzamora, T.; Ramírez-Manent, J.I. The Effect of a Program to Improve Adherence to the Mediterranean Diet on Cardiometabolic Parameters in 7034 Spanish Workers. Nutrients 2024, 16, 1082. [Google Scholar] [CrossRef] [PubMed] [PubMed Central]
- Paublini, H.; López González, A.A.; Busquets-Cortés, C.; Tomas-Gil, P.; Riutord-Sbert, P.; Ramírez-Manent, J.I. Relationship between Atherogenic Dyslipidaemia and Lipid Triad and Scales That Assess Insulin Resistance. Nutrients 2023, 15, 2105. [Google Scholar] [CrossRef] [PubMed] [PubMed Central]

| Men n = 14,305 | Women n = 30,686 | Total n = 44,991 | ||
|---|---|---|---|---|
| Mean (SD) | Mean (SD) | Mean (SD) | p-value | |
| Age (years) | 41.1 (10.6) | 40.4 (10.5) | 40.6 (10.5) | <0.001 |
| Height (cm) | 176.0 (7.5) | 162.6 (6.0) | 166.8 (9.0) | <0.001 |
| Weight (kg) | 81.2 (14.5) | 63.7 (13.3) | 69.3 (15.9) | <0.001 |
| Waist circumference (cm) | 89.7 (12.6) | 76.7 (11.8) | 80.8 (13.5) | <0.001 |
| Hip circumference (cm) | 101.7 (8.8) | 99.3 (10.7) | 100.1 (10.2) | <0.001 |
| Systolic blood pressure (mmHg) | 128.2 (13.1) | 116.1 (13.8) | 119 9 (14.7) | <0.001 |
| Diastolic blood pressure (mmHg) | 79.9 (10.6) | 74.8 (10.1) | 76.4 (10.5) | <0.001 |
| Total cholesterol (mg/dL) | 191.8 (37.2) | 187.8 (34.6) | 189.1 (35.5) | <0.001 |
| HDL-c (mg/dL) | 48.9 (11.2) | 59.3 (12.8) | 56.0 (13.2) | <0.001 |
| LDL-c (mg/dL) | 165.2 (46.2) | 144.8 (38.9) | 151.3 (42.4) | <0.001 |
| Triglycerides (mg/dL) | 111.0 (73.2) | 81.7 (47.0) | 91.0 (58.3) | <0.001 |
| Glucose (mg/dL) | 93.6 (18.2) | 88.9 (12.4) | 90.4 (14.7) | <0.001 |
| AST (U/L) | 24.1 (17.2) | 18.2 (8.0) | 20.1 (12.1) | <0.001 |
| ALT (U/L) | 29.0 (36.7) | 17.3 (13.7) | 21.0 (24.2) | <0.001 |
| GGT (U/L) | 30.2 (28.8) | 18.1 (18.1) | 22.0 (22.7) | <0.001 |
| N (%) | N (%) | p-value | ||
| <30 years | 2400 (16.8) | 5984 (19.5) | 8384 (18.6) | <0.001 |
| 30–39 years | 4200 (29.4) | 8304 (27.1) | 12,504 (27.8) | |
| 40–49 years | 4512 (31.5) | 10,128 (33.0) | 14,640 (32.5) | |
| 50–59 years | 2449 (17.1) | 5150 (16.8) | 7599 (16.9) | |
| 60–69 years | 744 (5.2) | 1120 (3.6) | 1864 (1.1) | |
| Physicians | 5064 (35.4) | 5024 (16.4) | 10,088 (22.4) | <0.001 |
| Nurses | 4008 (28.0) | 12,752 (41.6) | 16,760 (37.3) | |
| Health technicians | 1728 (12.1) | 4128 (13.5) | 5856 (13.0) | |
| Nursing assistants or orderlies | 3505 (24.5) | 8782 (28.5) | 12,287 (27.3) | |
| Non-smokers | 12,001 (83.9) | 26,094 (85.0) | 38,095 (84.7) | <0.001 |
| Smokers | 2304 (16.1) | 4592 (15.0) | 6896 (15.3) | |
| No physical activity | 7512 (52.5) | 18,744 (61.1) | 26,256 (58.4) | <0.001 |
| Physical activity | 6793 (47.5) | 11,942 (38.9) | 18,735 (41.6) | |
| Non-Mediterranean diet | 7771 (54.2) | 19,243 (62.7) | 27,014 (60.0) | <0.001 |
| Mediterranean diet | 6534 (45.8) | 11,443 (37.3) | 17,977 (40.0) |
| TyG Index | METS-IR | SPISE-IR | |||||
|---|---|---|---|---|---|---|---|
| Men | n | Mean (SD) | p-Value | Mean (SD) | p-Value | Mean (SD) | p-Value |
| <30 years | 2400 | 8.0 (0.4) | <0.001 | 34.1 (7.6) | <0.001 | 1.4 (0.4) | <0.001 |
| 30–39 years | 4200 | 8.3 (0.5) | 37.3 (7.8) | 1.6 (0.5) | |||
| 40–49 years | 4512 | 8.4 (0.5) | 40.0 (8.3) | 1.7 (0.5) | |||
| 50–59 years | 2449 | 8.6 (0.6) | 42.4 (8.4) | 1.8 (0.5) | |||
| 60–69 years | 744 | 8.7 (0.6) | 43.3 (9.3) | 1.9 (0.6) | |||
| Physicians | 5064 | 8.3 (0.5) | <0.001 | 37.8 (7.5) | <0.001 | 1.6 (0.4) | <0.001 |
| Nurses | 4008 | 8.3 (0.6) | 38.0 (8.7) | 1.6 (0.5) | |||
| Health technicians | 1728 | 8.4 (0.5) | 38.7 (9.2) | 1.7 (0.6) | |||
| Nursing assistants or orderlies | 3505 | 8.5 (0.6) | 41.5 (9.7) | 1.8 (0.6) | |||
| Non-smokers | 12,001 | 8.3 (0.6) | <0.001 | 38.6 (8.6) | <0.001 | 1.6 (0.5) | <0.001 |
| Smokers | 2304 | 8.5 (0.7) | 40.1 (9.4) | 1.7 (0.6) | |||
| No physical activity | 7512 | 8.5 (0.6) | <0.001 | 41.3 (9.5) | <0.001 | 1.8 (0.6) | <0.001 |
| Physical activity | 6793 | 8.2 (0.5) | 36.2 (7.0) | 1.5 (0.4) | |||
| Non-Mediterranean diet | 7771 | 8.5 (0.6) | <0.001 | 40.8 (9.3) | <0.001 | 1.7 (0.6) | <0.001 |
| Mediterranean diet | 6534 | 8.3 (0.6) | 36.9 (7.1) | 1.5 (0.4) | |||
| Women | n | Mean (SD) | p-value | Mean (SD) | p-value | Mean (SD) | p-value |
| <30 years | 5984 | 7.9 (0.4) | <0.001 | 29.9 (5.7) | <0.001 | 1.2 (0.3) | <0.001 |
| 30–39 years | 8304 | 8.0 (0.4) | 31.8 (8.3) | 1.3 (0.5) | |||
| 40–49 years | 10,128 | 8.1 (0.4) | 34.2 (8.0) | 1.4 (0.5) | |||
| 50–59 years | 5150 | 8.3 (0.5) | 36.7 (9.1) | 1.5 (0.5) | |||
| 60–69 years | 1120 | 8.5 (0.5) | 37.0 (10.0) | 1.6 (0.6) | |||
| Physicians | 5024 | 7.9 (0.4) | <0.001 | 29.5 (5.3) | <0.001 | 1.1 (0.3) | <0.001 |
| Nurses | 12,752 | 8.0 (0.4) | 31.8 (7.4) | 1.3 (0.4) | |||
| Health technicians | 4128 | 8.2 (0.5) | 35.2 (8.8) | 1.4 (0.5) | |||
| Nursing assistants or orderlies | 8782 | 8.3 (0.5) | 36.5 (9.4) | 1.5 (0.6) | |||
| Non-smokers | 26,094 | 8.0 (0.5) | <0.001 | 33.0 (8.1) | <0.001 | 1.3 (0.5) | <0.001 |
| Smokers | 4592 | 8.2 (0.5) | 34.6 (9.6) | 1.4 (0.6) | |||
| No physical activity | 18,744 | 8.2 (0.5) | <0.001 | 34.5 (9.1) | <0.001 | 1.4 (0.5) | <0.001 |
| Physical activity | 11,942 | 8.0 (0.4) | 31.2 (6.5) | 1.2 (0.4) | |||
| Non-Mediterranean diet | 19,243 | 8.2 (0.5) | <0.001 | 33.9 (9.4) | <0.001 | 1.4 (0.5) | <0.001 |
| Mediterranean diet | 11,443 | 8.0 (0.4) | 31.9 (6.7) | 1.2 (0.5) | |||
| Total | n | Mean (SD) | p-value | Mean (SD) | p-value | Mean (SD) | p-value |
| <30 years | 8384 | 8.0 (0.4) | <0.001 | 31.1 (6.6) | <0.001 | 1.2 (0.4) | <0.001 |
| 30–39 years | 12,504 | 8.1 (0.5) | 33.7 (8.5) | 1.4 (0.5) | |||
| 40–49 years | 14,640 | 8.2 (0.5) | 36.0 (8.5) | 1.5 (0.5) | |||
| 50–59 years | 7599 | 8.4 (0.6) | 38.8 (9.7) | 1.6 (0.6) | |||
| 60–69 years | 1864 | 8.6 (0.6) | 39.2 (9.7) | 1.7 (0.6) | |||
| Physicians | 10,088 | 8.1 (0.5) | <0.001 | 33.3 (8.1) | <0.001 | 1.3 (0.4) | <0.001 |
| Nurses | 16,760 | 8.1 (0.5) | 33.7 (7.7) | 1.4 (0.5) | |||
| Health technicians | 5856 | 8.2 (0.5) | 36.2 (9.0) | 1.5 (0.5) | |||
| Nursing assistants or orderlies | 12,287 | 8.3 (0.6) | 37.9 (9.8) | 1.6 (0.6) | |||
| Non-smokers | 38,095 | 8.1 (0.5) | <0.001 | 34.8 (8.7) | <0.001 | 1.4 (0.5) | <0.001 |
| Smokers | 6896 | 8.3 (0.6) | 36.4 (9.9) | 1.5 (0.6) | |||
| No physical activity | 26,256 | 8.3 (0.5) | <0.001 | 36.5 (9.7) | <0.001 | 1.5 (0.6) | <0.001 |
| Physical activity | 18,735 | 8.1 (0.5) | 33.0 (7.1) | 1.3 (0.4) | |||
| Non-Mediterranean diet | 27,014 | 8.4 (0.5) | <0.001 | 36.3 (9.6) | <0.001 | 1.5 (0.5) | <0.001 |
| Mediterranean diet | 17,977 | 8.1 (0.4) | 33.2 (7.0) | 1.3 (0.5) | |||
| TyG Index High | METS-IR High | SPISE-IR High | |||||
|---|---|---|---|---|---|---|---|
| Men | n | % | p-Value | % | p-Value | % | p-Value |
| <30 years | 2400 | 4.0 | <0.001 | 3.8 | <0.001 | 4.1 | <0.001 |
| 30–39 years | 4200 | 16.0 | 8.1 | 9.1 | |||
| 40–49 years | 4512 | 22.9 | 12.6 | 17.0 | |||
| 50–59 years | 2449 | 27.4 | 22.5 | 24.5 | |||
| 60–69 years | 744 | 38.7 | 22.6 | 25.8 | |||
| Physicians | 5064 | 16.6 | <0.001 | 7.9 | <0.001 | 9.5 | <0.001 |
| Nurses | 4008 | 18.6 | 8.3 | 12.6 | |||
| Health technicians | 1728 | 19.4 | 10.9 | 13.9 | |||
| Nursing assistants or orderlies | 3505 | 23.3 | 20.5 | 23.3 | |||
| Non-smokers | 12,001 | 17.6 | <0.001 | 11.1 | <0.001 | 13.6 | <0.001 |
| Smokers | 2304 | 27.1 | 15.6 | 17.7 | |||
| No physical activity | 7512 | 24.0 | <0.001 | 17.8 | <0.001 | 20.4 | <0.001 |
| Physical activity | 6793 | 13.8 | 5.3 | 7.4 | |||
| Non-Mediterranean diet | 7771 | 22.7 | <0.001 | 16.5 | <0.001 | 18.8 | <0.001 |
| Mediterranean diet | 6534 | 15.0 | 7.3 | 8.9 | |||
| Women | n | % | p-value | % | p-value | % | p-value |
| <30 years | 5984 | 3.2 | <0.001 | 2.8 | <0.001 | 1.4 | <0.001 |
| 30–39 years | 8304 | 4.2 | 3.9 | 4.8 | |||
| 40–49 years | 10,128 | 5.1 | 4.6 | 6.0 | |||
| 50–59 years | 5150 | 16.5 | 9.6 | 11.2 | |||
| 60–69 years | 1120 | 22.9 | 14.3 | 15.7 | |||
| Physicians | 5024 | 2.5 | <0.001 | 2.6 | <0.001 | 1.9 | <0.001 |
| Nurses | 12,752 | 3.9 | 3.1 | 3.5 | |||
| Health technicians | 4128 | 11.6 | 7.1 | 9.3 | |||
| Nursing assistants or orderlies | 8782 | 12.0 | 9.1 | 11.1 | |||
| Non-smokers | 26,094 | 6.4 | <0.001 | 4.7 | <0.001 | 5.5 | <0.001 |
| Smokers | 4592 | 10.8 | 5.9 | 8.7 | |||
| No physical activity | 18,744 | 8.2 | <0.001 | 6.6 | <0.001 | 8.1 | <0.001 |
| Physical activity | 11,942 | 5.2 | 2.1 | 2.7 | |||
| Non-Mediterranean diet | 19,213 | 7.8 | <0.001 | 6.0 | <0.001 | 7.5 | <0.001 |
| Mediterranean diet | 11,413 | 5.9 | 2.7 | 3.4 | |||
| Total | n | % | p-value | % | p-value | % | p-value |
| <30 years | 8384 | 3.1 | <0.001 | 1.4 | <0.001 | 2.1 | <0.001 |
| 30–39 years | 12,504 | 8.2 | 5.2 | 6.3 | |||
| 40–49 years | 14,640 | 10.5 | 7.0 | 9.4 | |||
| 50–59 years | 7599 | 20.0 | 13.8 | 15.5 | |||
| 60–69 years | 1864 | 29.2 | 17.6 | 19.7 | |||
| Physicians | 10,088 | 7.4 | <0.001 | 4.3 | <0.001 | 5.1 | <0.001 |
| Nurses | 16,760 | 9.6 | 5.0 | 5.7 | |||
| Health technicians | 5856 | 13.9 | 6.8 | 10.7 | |||
| Nursing assistants or orderlies | 12,287 | 15.2 | 12.4 | 14.6 | |||
| Non-smokers | 38,095 | 9.9 | <0.001 | 6.7 | <0.001 | 8.1 | <0.001 |
| Smokers | 6896 | 16.2 | 9.2 | 11.7 | |||
| No physical activity | 26,256 | 12.7 | <0.001 | 9.8 | <0.001 | 11.6 | <0.001 |
| Physical activity | 18,735 | 8.3 | 3.3 | 4.4 | |||
| Non-Mediterranean diet | 27,014 | 11.8 | <0.001 | 9.4 | <0.001 | 10.9 | <0.001 |
| Mediterranean diet | 17,977 | 8.9 | 3.9 | 5.1 | |||
| TyG Index High | p-Value | METS-IR High | p-Value | SPISE-IR High | p-Value | |
|---|---|---|---|---|---|---|
| OR (95% CI) | OR (95% CI) | OR (95% CI) | ||||
| Women | 1 | 1 | 1 | |||
| Men | 3.74 (3.51–3.98) | <0.001 | 3.68 (3.40–3.97) | <0.001 | 3.59 (3.34–3.84) | <0.001 |
| <30 years | 1 | 1 | 1 | |||
| 30–39 years | 1.84 (1.63–2.05) | <0.001 | 1.60 (1.38–1.83) | <0.001 | 1.65 (1.43–1.87) | <0.001 |
| 40–49 years | 3.92 (3.47–4.37) | <0.001 | 3.34 (2.89–3.80) | <0.001 | 2.82 (2.46–3.19) | <0.001 |
| 50–59 years | 5.32 (4.68–5.97) | <0.001 | 4.49 (3.84–5.15) | <0.001 | 4.30 (3.71–4.90) | <0.001 |
| 60–69 years | 11.73 (9.95–13.52) | <0.001 | 12.26 (9.79–14.74) | <0.001 | 9.54 (7.83–11.25) | <0.001 |
| Physicians | 1 | 1 | 1 | |||
| Nurses | 1.11 (1.08–1.14) | <0.001 | 1.61 (1.46–1.76) | <0.001 | 1.31 (1.18–1.44) | <0.001 |
| Health technicians | 1.32 (1.21–1.43) | <0.001 | 1.80 (1.60–2.00) | <0.001 | 1.76 (1.61–1.92) | <0.001 |
| Nursing assistants or orderlies | 1.99 (1.82–2.16) | <0.001 | 4.16 (3.68–4.63) | <0.001 | 4.08 (3.65–4.51) | <0.001 |
| Non-smokers | 1 | 1 | 1 | |||
| Smokers | 1.52 (1.41–1.63) | <0.001 | 1.19 (1.14–1.24) | <0.001 | 1.22 (1.15–1.30) | <0.001 |
| Physical activity | 1 | 1 | 1 | |||
| No physical activity | 1.64 (1.53–1.74) | <0.001 | 3.54 (3.23–3.85) | <0.001 | 3.12 (2.87–3.38) | <0.001 |
| Mediterranean diet | 1 | 1 | 1 | |||
| Non-Mediterranean diet | 1.48 (1.39–1.58) | <0.001 | 2.60 (2.29–2.90) | <0.001 | 2.30 (2.02–2.58) | <0.001 |
| Pearson | TyG Index | SPISE-IR | METS-IR |
|---|---|---|---|
| TyG index | 1 | 0.681 | 0.621 |
| SPISE-IR | 1 | 0.986 | |
| METS-IR | 1 | ||
| kappa Cohen | TyG index high | SPISE-IR high | METS-IR high |
| TyG index high | 1 | 0.485 | 0.402 |
| SPISE-IR high | 1 | 0.849 | |
| METS-IR high | 1 |
| TyG Index High | SPISE-IR High | METS-IR High | ||||||||
|---|---|---|---|---|---|---|---|---|---|---|
| Men | n | %Pre-Post | Difference % | p-Value | %Pre-Post | Difference % | p-Value | %Pre-Post | Difference % | p-Value |
| <30 years | 2400 | 3.8–4.0 | 4.1 | <0.001 | 4.2–4.4 | 4.4 | <0.001 | 3.9–4.1 | 4.6 | <0.001 |
| 30–39 years | 4200 | 14.7–16.0 | 7.9 | 7.5–8.2 | 8.2 | 8.3–9.1 | 8.6 | |||
| 40–49 years | 4512 | 20.1–22.9 | 12.3 | 12.2–13.5 | 9.3 | 15.5–17.0 | 11.9 | |||
| 50–59 years | 2449 | 23.3–27.4 | 14.9 | 13.8–15.6 | 11.8 | 20.8–24.5 | 15.2 | |||
| 60–69 years | 744 | 31.4–38.7 | 18.9 | 16.5–19.9 | 17.3 | 20.6–25.8 | 20.2 | |||
| Physicians | 5064 | 15.8–16.6 | 4.7 | <0.001 | 5.3–5.5 | 4.1 | <0.001 | 8.9–9.5 | 5.8 | <0.001 |
| Nurses | 4008 | 17.5–18.6 | 5.9 | 6.5–6.8 | 4.7 | 11.7–12.6 | 7.5 | |||
| Health technicians | 1728 | 17.4–19.4 | 10.3 | 9.9–10.8 | 8.2 | 12.1–13.9 | 12.9 | |||
| Nursing assistants or orderlies | 3505 | 19.4–23.3 | 16.9 | 16.7–18.9 | 11.5 | 18.9–23.3 | 18.8 | |||
| Non-smokers | 12,001 | 16.3–17.6 | 7.2 | <0.001 | 8.9–9.6 | 7.0 | <0.001 | 12.4–13.6 | 8.9 | <0.001 |
| Smokers | 2304 | 23.6–27.1 | 12.8 | 11.6–12.8 | 9.1 | 15.6–17.7 | 11.6 | |||
| No physical activity | 7512 | 19.8–24.0 | 17.3 | <0.001 | 15.6–18.6 | 16.3 | <0.001 | 16.3–20.4 | 19.9 | <0.001 |
| Physical activity | 6793 | 13.3–13.8 | 3.8 | 4.1–4.3 | 4.4 | 7.0–7.4 | 5.6 | |||
| Non-Mediterranean diet | 7771 | 19.0–22.7 | 16.5 | <0.001 | 14.3–16.9 | 15.1 | <0.001 | 15.4–18.8 | 18.1 | <0.001 |
| Mediterranean diet | 6534 | 14.3–15.0 | 4.6 | 5.2–5.5 | 5.1 | 8.3–8.9 | 6.2 | |||
| Women | n | %pre-post | difference % | p-value | %pre-post | difference % | p-value | %pre-post | difference % | p-value |
| <30 years | 5984 | 3.1–3.2 | 2.9 | <0.001 | 2.7–2.8 | 3.3 | <0.001 | 1.3–1.4 | 4.1 | <0.001 |
| 30–39 years | 8304 | 4.0–4.2 | 5.5 | 3.7–3.9 | 6.1 | 4.5–4.8 | 6.9 | |||
| 40–49 years | 10,128 | 4.6–5.1 | 9.1 | 4.1–4.6 | 10.5 | 5.3–6.0 | 11.5 | |||
| 50–59 years | 5150 | 14.7–16.5 | 11.2 | 8.3–9.6 | 13.9 | 9.5–11.2 | 14.8 | |||
| 60–69 years | 1120 | 19.6–22.9 | 14.6 | 11.8–14.3 | 17.3 | 12.9–15.7 | 17.9 | |||
| Physicians | 5024 | 2.4–2.5 | 3.6 | <0.001 | 2.5–2.6 | 5.2 | <0.001 | 1.8–1.9 | 6.3 | <0.001 |
| Nurses | 12,752 | 3.7–3.9 | 4.9 | 2.9–3.1 | 6.8 | 3.2–3.5 | 7.9 | |||
| Health technicians | 4128 | 10.6–11.6 | 8.9 | 6.4–7.1 | 10.2 | 8.3–9.3 | 10.8 | |||
| Nursing assistants or orderlies | 8782 | 10.4–12.0 | 13.3 | 7.8–9.1 | 13.8 | 9.4–11.1 | 14.9 | |||
| Non-smokers | 26,094 | 6.1–6.4 | 5.9 | <0.001 | 4.3–4.7 | 7.9 | <0.001 | 5.0–5.5 | 8.8 | <0.001 |
| Smokers | 4592 | 9.8–10.8 | 9.1 | 5.2–5.9 | 11.3 | 7.7–8.7 | 11.2 | |||
| No physical activity | 18,744 | 6.8–8.2 | 16.5 | <0.001 | 5.4–6.6 | 17.8 | <0.001 | 6.6–8.1 | 18.2 | <0.001 |
| Physical activity | 11,942 | 4.9–5.2 | 5.3 | 2.0–2.1 | 5.9 | 2.5–2.7 | 6.3 | |||
| Non-Mediterranean diet | 19,213 | 6.6–7.8 | 15.9 | <0.001 | 5.0–6.0 | 16.8 | <0.001 | 6.5–7.5 | 17.5 | <0.001 |
| Mediterranean diet | 11,413 | 5.5–5.9 | 6.3 | 2.5–2.7 | 6.6 | 3.1–3.4 | 7.4 | |||
| Total | n | %pre-post | difference % | p-value | %pre-post | difference % | p-value | %pre-post | difference % | p-value |
| <30 years | 8384 | 3.4–3.5 | 3.4 | <0.001 | 3.4–3.5 | 3.6 | <0.001 | 2.8–2.9 | 3.9 | <0.001 |
| 30–39 years | 12,504 | 7.6–8.1 | 6.2 | 5.4–5.8 | 6.4 | 4.8–5.2 | 6.7 | |||
| 40–49 years | 14,640 | 9.4–10.6 | 10.8 | 8.0–8.9 | 10.3 | 7.9–8.9 | 10.9 | |||
| 50–59 years | 7599 | 16.4–18.9 | 12.9 | 10.2–11.8 | 13.3 | 11.0–12.9 | 14.1 | |||
| 60–69 years | 1864 | 23.9–28.6 | 16.2 | 14.7–17.8 | 17.1 | 15.3–18.7 | 17.9 | |||
| Physicians | 10,088 | 9.1–9.5 | 4.0 | <0.001 | 3.9–4.1 | 4.2 | <0.001 | 5.5–5.8 | 4.5 | <0.001 |
| Nurses | 16,760 | 9.6–10.2 | 5.2 | 4.7–5.0 | 5.5 | 6.5–6.9 | 5.8 | |||
| Health technicians | 5856 | 12.6–14.0 | 9.4 | 8.0–8.9 | 9.9 | 9.6–10.8 | 10.9 | |||
| Nursing assistants or orderlies | 12,287 | 5.5–6.5 | 14.2 | 12.2–14.4 | 15.0 | 12.7–15.3 | 16.7 | |||
| Non-smokers | 38,095 | 8.7–9.3 | 6.3 | <0.001 | 6.6–7.1 | 6.5 | <0.001 | 6.6–7.1 | 6.7 | <0.001 |
| Smokers | 6896 | 13.9–15.6 | 10.5 | 9.0–10.1 | 10.9 | 9.6–10.8 | 11.0 | |||
| No physical activity | 26,256 | 12.4–14.9 | 16.8 | <0.001 | 9.7–11.8 | 17.6 | <0.001 | 10.0–12.2 | 18.1 | <0.001 |
| Physical activity | 18,735 | 6.7–7.1 | 4.8 | 3.7–3.9 | 5.1 | 6.4–6.8 | 5.5 | |||
| Non-Mediterranean diet | 27,014 | 11.7–14.0 | 16.2 | <0.001 | 9.1–11.0 | 16.9 | <0.001 | 9.7–11.8 | 17.3 | <0.001 |
| Mediterranean diet | 17,977 | 7.3–7.7 | 5.4 | 4.8–5.1 | 5.8 | 6.7–7.2 | 6.2 | |||
Disclaimer/Publisher’s Note: The statements, opinions and data contained in all publications are solely those of the individual author(s) and contributor(s) and not of MDPI and/or the editor(s). MDPI and/or the editor(s) disclaim responsibility for any injury to people or property resulting from any ideas, methods, instructions or products referred to in the content. |
© 2025 by the authors. Licensee MDPI, Basel, Switzerland. This article is an open access article distributed under the terms and conditions of the Creative Commons Attribution (CC BY) license (https://creativecommons.org/licenses/by/4.0/).
Share and Cite
Tárraga Marcos, P.J.; López-González, Á.A.; Martínez-Almoyna Rifá, E.; Paublini Oliveira, H.; Martorell Sánchez, C.; Tárraga López, P.J.; Ramírez-Manent, J.I. Risk of Insulin Resistance in 44,939 Spanish Healthcare Workers: Association with Sociodemographic Variables and Healthy Habits. Diseases 2025, 13, 33. https://doi.org/10.3390/diseases13020033
Tárraga Marcos PJ, López-González ÁA, Martínez-Almoyna Rifá E, Paublini Oliveira H, Martorell Sánchez C, Tárraga López PJ, Ramírez-Manent JI. Risk of Insulin Resistance in 44,939 Spanish Healthcare Workers: Association with Sociodemographic Variables and Healthy Habits. Diseases. 2025; 13(2):33. https://doi.org/10.3390/diseases13020033
Chicago/Turabian StyleTárraga Marcos, Pedro Javier, Ángel Arturo López-González, Emilio Martínez-Almoyna Rifá, Hernán Paublini Oliveira, Cristina Martorell Sánchez, Pedro Juan Tárraga López, and José Ignacio Ramírez-Manent. 2025. "Risk of Insulin Resistance in 44,939 Spanish Healthcare Workers: Association with Sociodemographic Variables and Healthy Habits" Diseases 13, no. 2: 33. https://doi.org/10.3390/diseases13020033
APA StyleTárraga Marcos, P. J., López-González, Á. A., Martínez-Almoyna Rifá, E., Paublini Oliveira, H., Martorell Sánchez, C., Tárraga López, P. J., & Ramírez-Manent, J. I. (2025). Risk of Insulin Resistance in 44,939 Spanish Healthcare Workers: Association with Sociodemographic Variables and Healthy Habits. Diseases, 13(2), 33. https://doi.org/10.3390/diseases13020033