Article

Modified Analytical Technique for Multi-Objective Optimal Placement of High-Level Renewable Energy Penetration Connected to Egyptian Power System

by
Mahmoud Aref
1,2,*,
Vladislav Oboskalov
1,
Adel El-Shahat
3,* and
Almoataz Y. Abdelaziz
4
1
Ural Power Engineering Institute, Ural Federal University Yekaterinburg, 620002 Yekaterinburg, Russia
2
Electrical Engineering Department, Assiut University, Assiut 71515, Egypt
3
Energy Technology Program, School of Engineering Technology, Purdue University, West Lafayette, IN 47907, USA
4
Faculty of Engineering and Technology, Future University in Egypt, Cairo 11835, Egypt
*
Authors to whom correspondence should be addressed.
Mathematics 2023, 11(4), 958; https://doi.org/10.3390/math11040958
Submission received: 5 January 2023 / Revised: 25 January 2023 / Accepted: 12 February 2023 / Published: 13 February 2023
(This article belongs to the Special Issue Modeling and Simulation for the Electrical Power System)

Abstract

:
The 2022 United Nations Climate Change Conference (COP27) recommended that Egypt be converted to green energy, in addition to increasing the demand for annual energy consumption, which will lead to an increase in the use of renewable energy sources (RES) in Egypt. The Egyptian Ministry of Energy and Electricity plans to build RES (photovoltaic systems and wind farms) connected to the Egyptian power system (EPS). It is a defect to choose the position and size of the RES based on only power calculations because the RES is an intermittent source. This paper presents a modified analytical energy technique for locating RES in IEEE 33-bus and 69-bus distribution networks and a realistic 25-bus 500 kV EPS. An analytical multi-objective function has been developed to determine the optimal locations of DGs or RESs based on power losses and annual energy loss calculations of the system depending on weather conditions. The efficiency and feasibility of the proposed algorithm based on the IEEE 33-bus and 69-bus distribution networks and the realistic 25-bus 500 kV EPS have been tested and compared with PSO and GA. The impact of RESs on the performance of the 25-bus 500 kV EPS has been investigated based on annual energy losses and operation stability depending on weather conditions. The results showed that the proposed technique used these effective values to obtain optimal weather-adjusted locations. The optimal locations of PV systems or wind systems based on energy calculation improved the voltage profile better than power calculation by about 2%, and the annual energy losses decreased by about 7%. The performance of the 25-bus 500 kV EPS, due to the addition of RES, resulted in a decrease in the annual energy losses of 47% and an improvement in the voltage profile and system stability.
MSC:
90C26; 68W50; 90C29; 90C31; 90C47

1. Introduction

1.1. Motivation

The most crucial component of modern living is energy. Any nation’s rapid development is reliant on its ability to meet its energy demands, which rise sharply because of the energy demands of its growing industrial, commercial, and social sectors. Thus, the availability of energy resources is a major worry for everyone. It is difficult to provide the necessary power efficiently and cost-effectively. Also, the primary goals of sustainable progress are to ensure that everyone has access to clean, sustainable energy and water. Nevertheless, the need for water and energy is rising every year along with the expansion of agriculture, civilization, the economy, and population growth. In many nations, the integration of renewable energy into distribution networks has recently received widespread support to limit the use of fossil fuels, which increase greenhouse gas emissions. In any debate on climate change, renewable energy is typically at the top of the list of suggested worldwide advancements to fend off the worst effects of rising temperatures. Renewable energy sources do not produce any greenhouse gases that contribute to global warming, including carbon dioxide. According to the most recent data on renewable energy deployment, 85% of all power generation in 2050 will come from renewable sources, with the remaining 15% coming from non-renewable sources.
Sustainable development goals (SDGs) are being attained by the world. SDG seven is one of the most well-known SDGs because it focuses on access to clean energy. To achieve the climate change targets outlined in the 2016 Paris Agreement, the entire globe is anticipating 100% sustainable energy. Since then, many nations have developed plans to use only renewable energy; these are positive and major developments. A region in Egypt has developed renewable energy generators, primarily hydroelectric and photovoltaic systems. By 2035, Egypt similarly wants to generate 42% of its electricity from renewable sources, which raises the ambition to achieve the goal of not increasing the Earth’s temperature by more than 1.5 degrees, which is in line with the Paris Climate Agreement goals, while at the same time securing the basic needs of food, water, and shelter
Sharm el-Sheikh hosted the 2022 United Nations Climate Change Conference (COP 27), where Egypt was one of the countries working to solve climate problems. Between 80 and 100% of the population in Egypt’s 14 major cities is subject to at least one significant climatic danger, which includes floods, heat waves, pollution, desertification, and increasing sea levels. As the population grows, the sea level rises, and the Nile River’s water volume declines, the situation will only get worse if things continue in this direction. Even though Egypt only contributes a very small proportion to global emissions, the nation’s carbon dioxide output continues to be closely correlated with economic expansion, with the industrial and energy sectors accounting for about three-quarters of emissions. Egypt starts a project to assist developing nations with climate change adaptation. By investing billions of dollars in those nations, COP27 hopes to safeguard the almost 4 billion people who reside in the communities most impacted by climate change and increase their resilience to its effects by the year 2030. The Egyptian strategy aims to reduce carbon emissions, adapt to and confront climate change, define roles and responsibilities for climate governance, and build the infrastructure for climate finance. Egypt has already started building this infrastructure by working to integrate the climate dimension into the state’s general budget, greening the budget, and announcing green bonds to fund environmental projects. It endeavors to accomplish feasible advancement in carrying out Egypt’s Vision 2030 by saving the climate.
New RES projects will be built in Egypt in cooperation with other countries. The 545 MW Zafarana wind farm is currently the largest in the country. The permission to build a 10 GW wind farm in Egypt was endorsed by Saudi ACWA Power, the Egyptian New and Sustainable Power Authority, and the Egyptian Power Transmission Organization. After the 20 GW-fit Gansu project in China, it will be the second-biggest wind farm. The yearly perfect energy yield from this wind farm will be near 48,000 GWh, staying away from 23.8 million tons of carbon dioxide emissions. A Norwegian company called SCATEC is also attempting to build 5 GW worth of new wind farms in Egypt. In contrast, a company named Taqa PV Solar would receive a USD 5.5 million loan from the European Bank for Reconstruction and Development to develop and run a 7 MW PV system in Minya. Under a 25-year power purchase agreement, the PV system will supply electricity to Citadel Capital’s carbonate and chemical production company, Ascom, meeting around 16% of the business’s annual electricity requirements.
The excess power produced by the wind farm can be utilized to produce hydrogen gas (H2) by electrolysis of water in an electrolyzer, which can be stored in H2 tanks and used to generate electricity when it is needed. Egypt is anticipated to export the equivalent of 8% of the hydrogen produced globally, making it one of the major exporters of green hydrogen. By emphasizing the connection between energy, food, and water as well as the aim to expand the amount of renewable energy, the Egyptian government has prioritized the implementation of green projects. Egypt has begun an ambitious program to add 10 GW of renewable energy sources and benefit from them to enhance the agricultural sector by choosing new types of crops capable of adapting to harsh climatic conditions and using them to provide a source of water through desalination. A 100 MW green hydrogen plant in Sokhna’s initial phase of construction has begun operating. The declaration was made in front of Prime Minister Jonas Gahr Store of Norway and President Abdel Fattah El-Sisi at the COP27 climate summit. The project will generate around 15,000 tons of green hydrogen and receive 260 MW of solar and wind energy
Based on the above, the study of renewable energy production in Egypt is increasing every year, which increases the importance of this study of the use of high-level penetration solar energy emitted by the sun as well as wind energy in places with high wind speeds. This paper aims to study the use of high-level penetration solar energy and wind energy in Egypt based on available areas such as Zafarana and the Gulf of Suez with high wind speeds, as well as the eastern and western deserts and the eastern and western Nile.

1.2. Related Work

Power losses and voltage instability are major problems in power systems. Since the 1920s, power system stability has been acknowledged as a significant issue for secure system operation. The significance of this phenomenon has been demonstrated by several significant blackouts brought on by power system instability. Voltage collapse is a harmful occurrence brought on by voltage instability and is frequently accompanied by weak or stressed systems, long lines, radial networks, faults, and/or reactive power shortages. The high-performance power system must be at constant voltage and capable of withstanding variations of no more than 10% of the rated voltage on each bus, depending on the grid code, such as the 5% voltage limit in the Egyptian grid code. The issue of voltage instability in power systems is connected to the system’s overall stability and to how close it is to a voltage collapse condition. The use of combined therapeutic procedures, especially during peak hours, is a necessary solution in most cases. The cheapest method is to use conventional capacitors to add reactive power to get a constant voltage. It is known that optimization of voltage levels in the power system reduces losses [1].
Grid reconfiguration, including RESs, can mitigate power losses and voltage instability problems. In this regard, the optimal placement and size of the RES are crucial. The location and size of RES in the network are very important, and the optimal choice can reduce the variability of the voltage profile and power losses in the system and increase the reliability indices. Weather affects how effectively renewable energy sources (solar and wind energy) produce electricity. As a result, it can be challenging to predict with precision how much electricity renewable sources will provide in the future. The PV system’s output power is zero if there is no irradiation (during the night), and the wind turbine rotor will not turn if the wind speed is too low (less than the cut-in speed) on any given day. Because of this, renewable energy is not always able to generate electricity during periods of high demand. These sources produce power that is equivalent to the minimum required design power level. As a result, it is incorrect to determine the ideal size and location of wind farms and PV systems using the rated power of renewable energy sources. This paper uses a multi-objective function to determine the placement of wind farms and PV systems connected to the Egyptian power grid to reduce total annual energy loss and the voltage profile of the system.
The Egyptian power system suffers from many problems due to the presence of two types of overhead lines: 500 kV and 220 kV. Many articles that have studied these issues lack data on the Egyptian energy system. One of the most important of these challenges currently is to connect high-penetration renewable energy sources, such as PV systems and wind farms, to the Egyptian power system at optimal locations. Different methods have been used to get an optimum location in different parts of the Egyptian power system and other distribution networks, especially IEE 33-bus and IEEE 69-bus. These methods are focused on minimizing power losses and improving the voltage profile or voltage stability based on power calculations. The results showed that the optimal locations of RESs are 6, 14, and 30 for IEEE 33-bus, and 61, 17, and 49 for IEEE 69-bus distribution systems. Previous studies on the Egyptian Power System developed a conceptual design model of a sustainable renewable hybrid stand-alone power system (HRSES) to meet the power needs of a large-scale reverse osmosis desalination plant in Baltim, Egypt. The model explored the feasibility of various HRSES alternatives and developed a fuzzy-based multi-criteria decision model to accurately select the optimal energy solution with optimal energy-economic and environmental analysis to determine their applicability and component scope for nine HRSES alternatives using HOMER [2]. For various IEEE 33-bus, 69-bus, and 85-bus systems, a Manta Ray forging optimization method has been developed that is optimized to reduce power losses depending on the size and position of RES connected to distribution networks [3].
A series of combinations of open points (SOPs) are investigated to create various network structures and are used as part of the optimization to determine possible solutions with minimal power loss under normal network conditions. A mathematical optimization approach is used to maximize hosting capacity through sequential network reconfiguration followed by the installation of SOPs possible solutions with minimal power loss under normal network conditions. A mathematical optimization approach is used to maximize hosting capacity through sequential network reconfiguration followed by the installation of SOPs. In addition, the distribution index SOPs were developed for the IEEE 33-bus, IEEE 69-bus, and 59-bus Egyptian distribution networks and the 135-bus Brazilian distribution network to adjust individual distribution coefficients and reduce the computational burden placed on the optimization approach [4,5]. Utilizing an equilibrium optimizer algorithm to determine the optimal hub height for some wind turbines to maximize wind power at the lowest total cost, the feasibility of using wind resources and the economic valuation of four sites in Egypt—Ras El-Hekma, Farafra, Nuweiba, and Aswan—were studied in two stages. The energy cost of these turbines was calculated and compared with the global and Egyptian economies [6].
Digital simulation and electrical network computation were used to simulate the Delta Egypt electrical network (66, 11, 6.6, and 0.4 kV) to improve the voltage profile and achieve voltage quality [7]. The Whale Optimization Algorithm, Sine Cosine Algorithm, and Multi-Verse Optimization Algorithm have been developed as multi-objective optimization methods for identifying the optimal mix sizing and positioning RES integrated into IEEE 33-bus and 118-bus test systems, as well as a realistic portion of the Egyptian distribution network [8]. The digital model was developed using the DIgSILENT power system calculation package to simulate the Egyptian power system at 500 kV and 220 kV levels to conduct power system studies such as load flow, short circuit, fault, and stability to evaluate performance and ensure compliance with grid code technical requirements [9].
The application of a sequential algorithm for determining the location and size of RES was studied on a realistic Egyptian distribution network of 47 buses located south of the city of Cairo using the ETAP program and genetic algorithms (GA). A financial study including the cost of energy and the price of capacity was also presented with a real example [10]. A hybrid wind energy and proton exchange membrane fuel cell system (WE/PEMFC) is being developed for Mersi-Matrouh City, a portion of the Egyptian distribution network, to reliably supply the city’s anticipated load demand until the year 2022. The sensitivity analysis using three sensitivity factors is used to select the candidate buses for locating the hybrid system and the binary Crow search algorithm, discrete Jaya algorithm, and binary particle Swarm optimization techniques are used to present the optimal allocation for inserting this hybrid system in the Egyptian distribution system of Meri-Matrouh City [11]. The best critical global integration of RES into the distribution network is provided by a robust methodology-based Political Optimizer and Objective Function Approach [12]. A second-order cone programming (SOCP) formulation has been studied that directly gives upper limits on voltage stability margin without the need to specify a configuration [13]. For cases like the 59-bus in Cairo and the 83-bus in Taiwan, a probabilistic bilevel multi-objective nonlinear programming optimization problem is formulated to maximize the penetration of RES via distribution network reconfiguration without taking into account its intermittent nature [14].
The ability of wind turbine generators to continue running rather than stop during disruptions was investigated in order to properly stabilize grid-connected large-scale SCIG and DFIG in Zafarana, the Suez Gulf area, and Egypt with fault ride-through parameter settings based on the Egyptian grid code [15]. A multi-objective optimization problem was formulated to achieve optimal penetration of RES and SOP in the distribution network of 59 buses in Egypt [16]. The system collapse phenomenon was often tested, which often leads to a partial or complete collapse of the system, which greatly impairs the socio-economic development of the country and the industrialization of the interconnected Egyptian power system [17]. The slime mold algorithm in nature oscillation mode was used to estimate the optimal location and size of PV power generation as well as DSTATCOM in the real distribution network East Delta Network [18]. The best location for solar PV is selected using a weighted multi-objective method followed by the PSO algorithm [19]. For DigSILENT, the PowerFactory simulation package was used to simulate a coronavirus algorithm for optimal operation of the Egyptian grid model with maximum renewable energy production, minimum voltage deviation, and minimum power losses [20], and the Egyptian national power system for 500 kV extra high voltage and 220 kV high voltage is evaluated with real data [21].
The position and size of the RES in the tested IEEE 33-bus and 69-bus systems were tested to reduce total active power loss using meta-inference based on the Firefly algorithm [22], three optimization algorithms: GWO, WOA, and PSO based on the vector method, voltage deviation, and voltage stability indices [23], maximum sensitivity to power loss and a modified plant growth simulation algorithm [24], considering how likely it is that RES is under stress to increase the margin of voltage stability [25], a chaotic artificial bee colony algorithm [26], strategy based on the voltage stability index and enhanced loss minimization formulas [27], an analytical metric [28], a novel power loss sensitivity, power stability, and voltage stability indices techniques [29], multi-objective PSO technique [30], average daily load demand strategy at various load levels [31] and an analytical algorithm [32,33]. On 12-bus, modified 12-bus, and 69-bus radial distribution networks, an analytical approach is used to visualize the impact of RES on system losses, voltage profile, and voltage stability [34]. A single P-type DG’s impact on an IEEE 33-bus system is examined analytically using a fixed DG step size of 500 kW to 4500 kW, taking system power loss and the voltage profile into account [35].
Other algorithms have been used to reconfigure distribution systems to obtain the optimal location of DG based on minimizing active power losses and improving voltage profiles, such as the equilibrium optimizer [36], binary particle swarm optimization and shuffled frog leap [37], the modified analytical method for PV-DG [38], the honey badger [39], and self-adaptive levy flight [40]. A hybrid optimization approach that combines GA and the improved PSO algorithm to find the ideal location for the DG on the IEEE 30 bus while minimizing active power loss and preserving the voltage magnitude at roughly 1 p.u. [41]. A simulated annealing optimization approach was proposed in Reference [42] to determine the ideal location of DG on a medium-voltage 14-bus radial feeder. The ideal location of DG based on transmission network loss reduction on a real transmission network in India has been determined by a grid parameter-oriented harmony search algorithm [43].

1.3. Contributions

The Location of the RES is selected based on only the calculation of power, which means that the active and reactive powers of the RES are constant. This is a defect because RES sources operate intermittently. This paper presents a modified energy-based analytical technique to select the optimal location of RES in the IEEE 33-bus and 69-bus distribution systems and the realistic 25-bus 500 kV EPS. To connect the RES to 500 kV EPS (high voltage), the inverter output is amplified by a power transformer, which normally has a high input impedance. In this paper, a multi-objective optimization function has been developed to determine the optimal location of connection buses of RESs to the IEEE 33-bus and 69-bus distribution systems and the realistic 25-bus 500 kV EPS based on the minimum annual energy losses of the system depending on weather conditions. The impact of RES projects announced by the Electricity and Renewable Energy Ministry on the EPS performance has been investigated. The calculation of the maximum load is taken into account when connecting the RES to the EPS. Accordingly, this study contributes to the literature as:
  • Develop a modified analytical technique based on energy calculation to select the optimal location of high-level penetration RES in the IEEE 33-bus and 69-bus distribution systems and the realistic 25-bus 500 kV EPS, taking into account maximum load capacity. The GA method based on power calculation has been developed to select the optimal location of high-level penetration RES in the realistic 25-bus 500 kV EPS.
  • Development of a multi-objective energy-based algorithm to select the optimal location of PV systems, as well as wind farms, to reduce annual total energy losses and improve the voltage profile.
  • A fair comparison of the proposed algorithm based on power and energy calculations with previous works, which used the PSO and GA algorithms, was performed to demonstrate the efficiency and feasibility of the proposed algorithm for the IEEE 33-bus and IEEE 69-bus distribution systems. For the realistic 25-bus 500 kV EPS, the optimal locations of RES obtained by the proposed algorithm based on power and energy calculations are compared with those obtained by the GA algorithm.
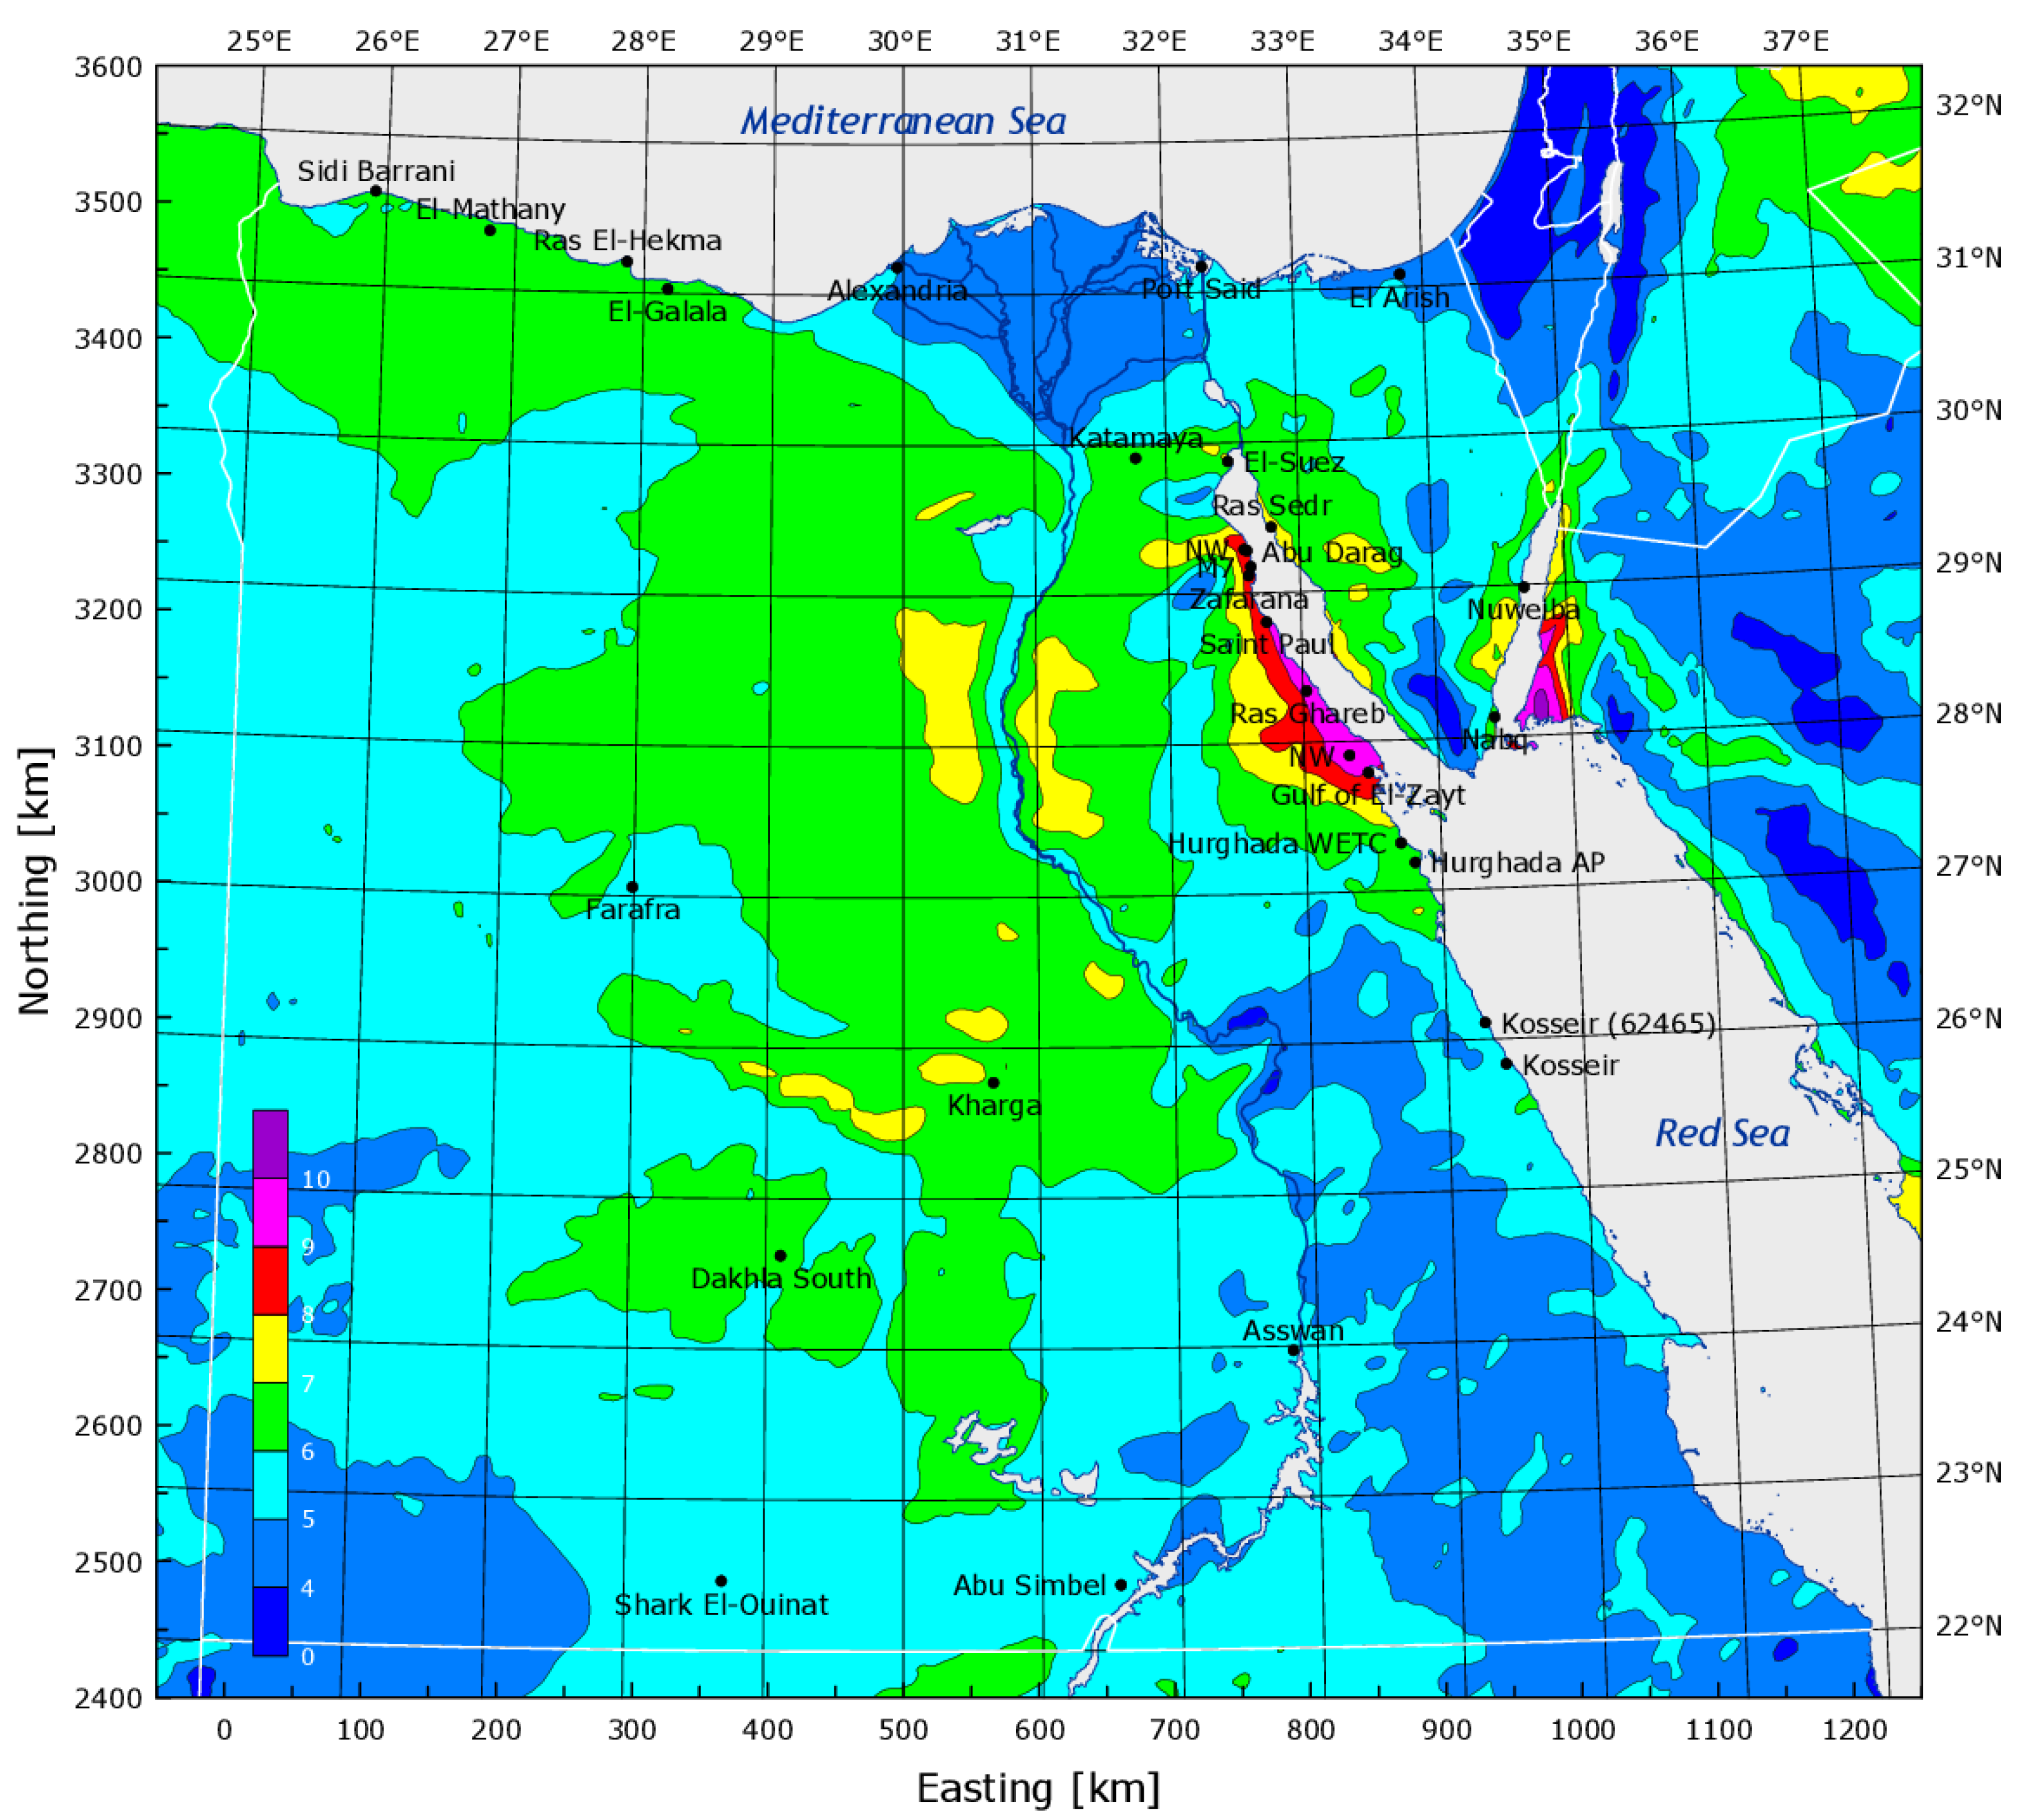
  • Examine the effect of the RES connection on the performance of the 500 kV Egyptian Power system, taking into account weather data for solar radiation and wind speed. This data was obtained from the NASA website for the period 1 January 2021 to 31 December 2021.
  • This paper has been organized as follows: Section 2 describes the proposed method and the research method for calculating the optimal location of RES based on the power flow of the power system consisting of the PV system or the wind system; Section 3 contains the description of the test systems and the PV and wind projects in Egypt, the results of optimization applied to the tested power systems, and the discussion of the results; while Section 4 concludes the highlights of this research.

2. Research Method

Determining the optimal location of RES requires a method that minimizes energy losses in the 25-bus 500 kV EPS, considering the voltage profile and stability index improvements. To determine a suitable and optimal location for RES, two stability indices are presented in this paper to assess voltage stability and minimize active energy losses. From a mathematical point of view, the stability indices for assessing voltage stability are obtained by considering the characteristics of voltage collapse in the power system and can provide a comprehensive assessment of the state of voltage stability of the network.

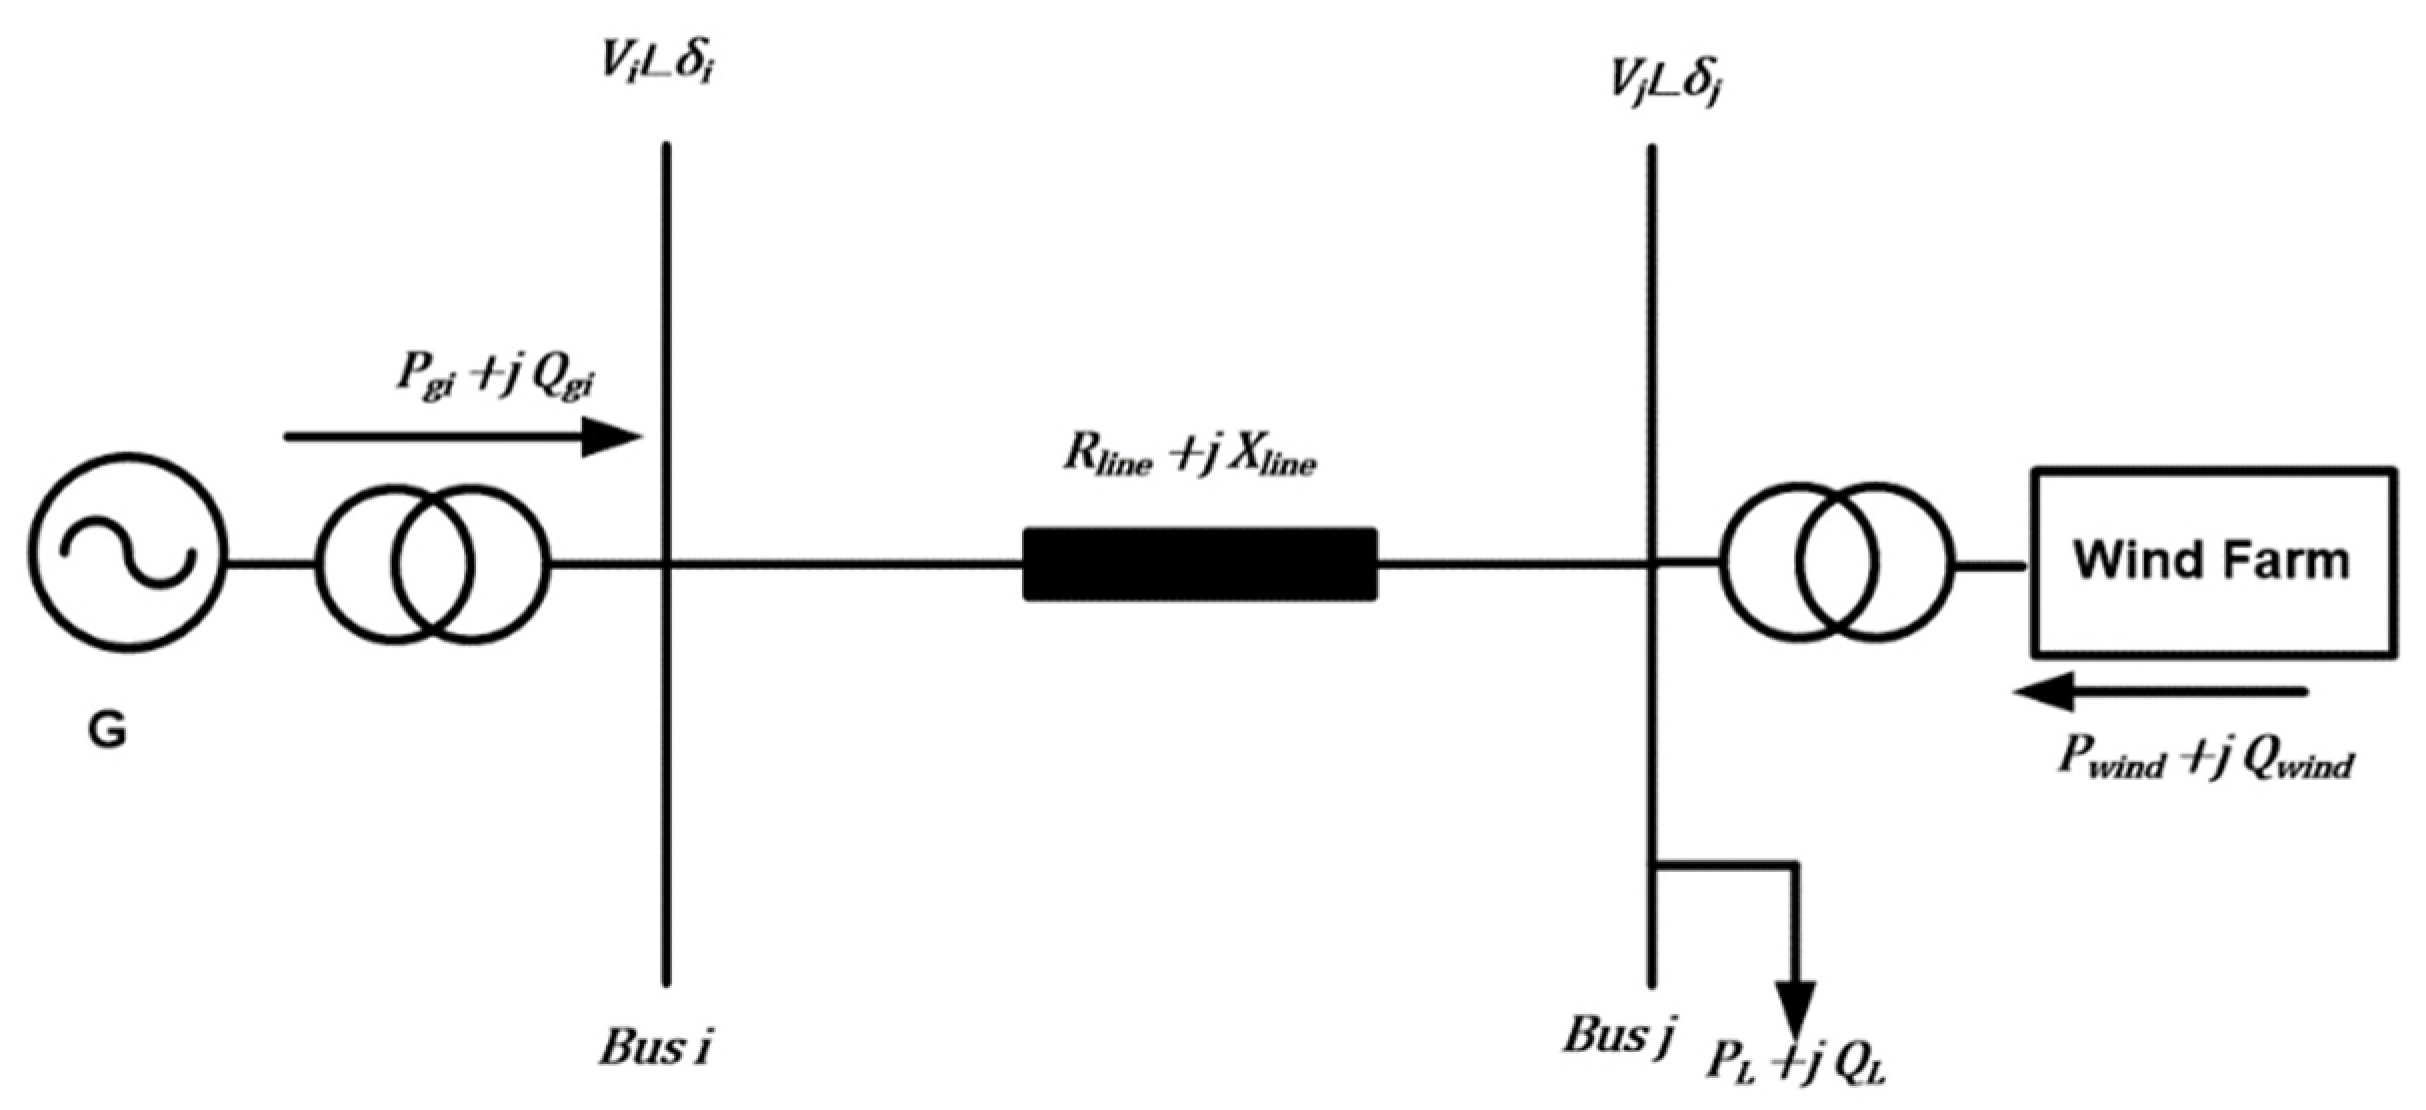
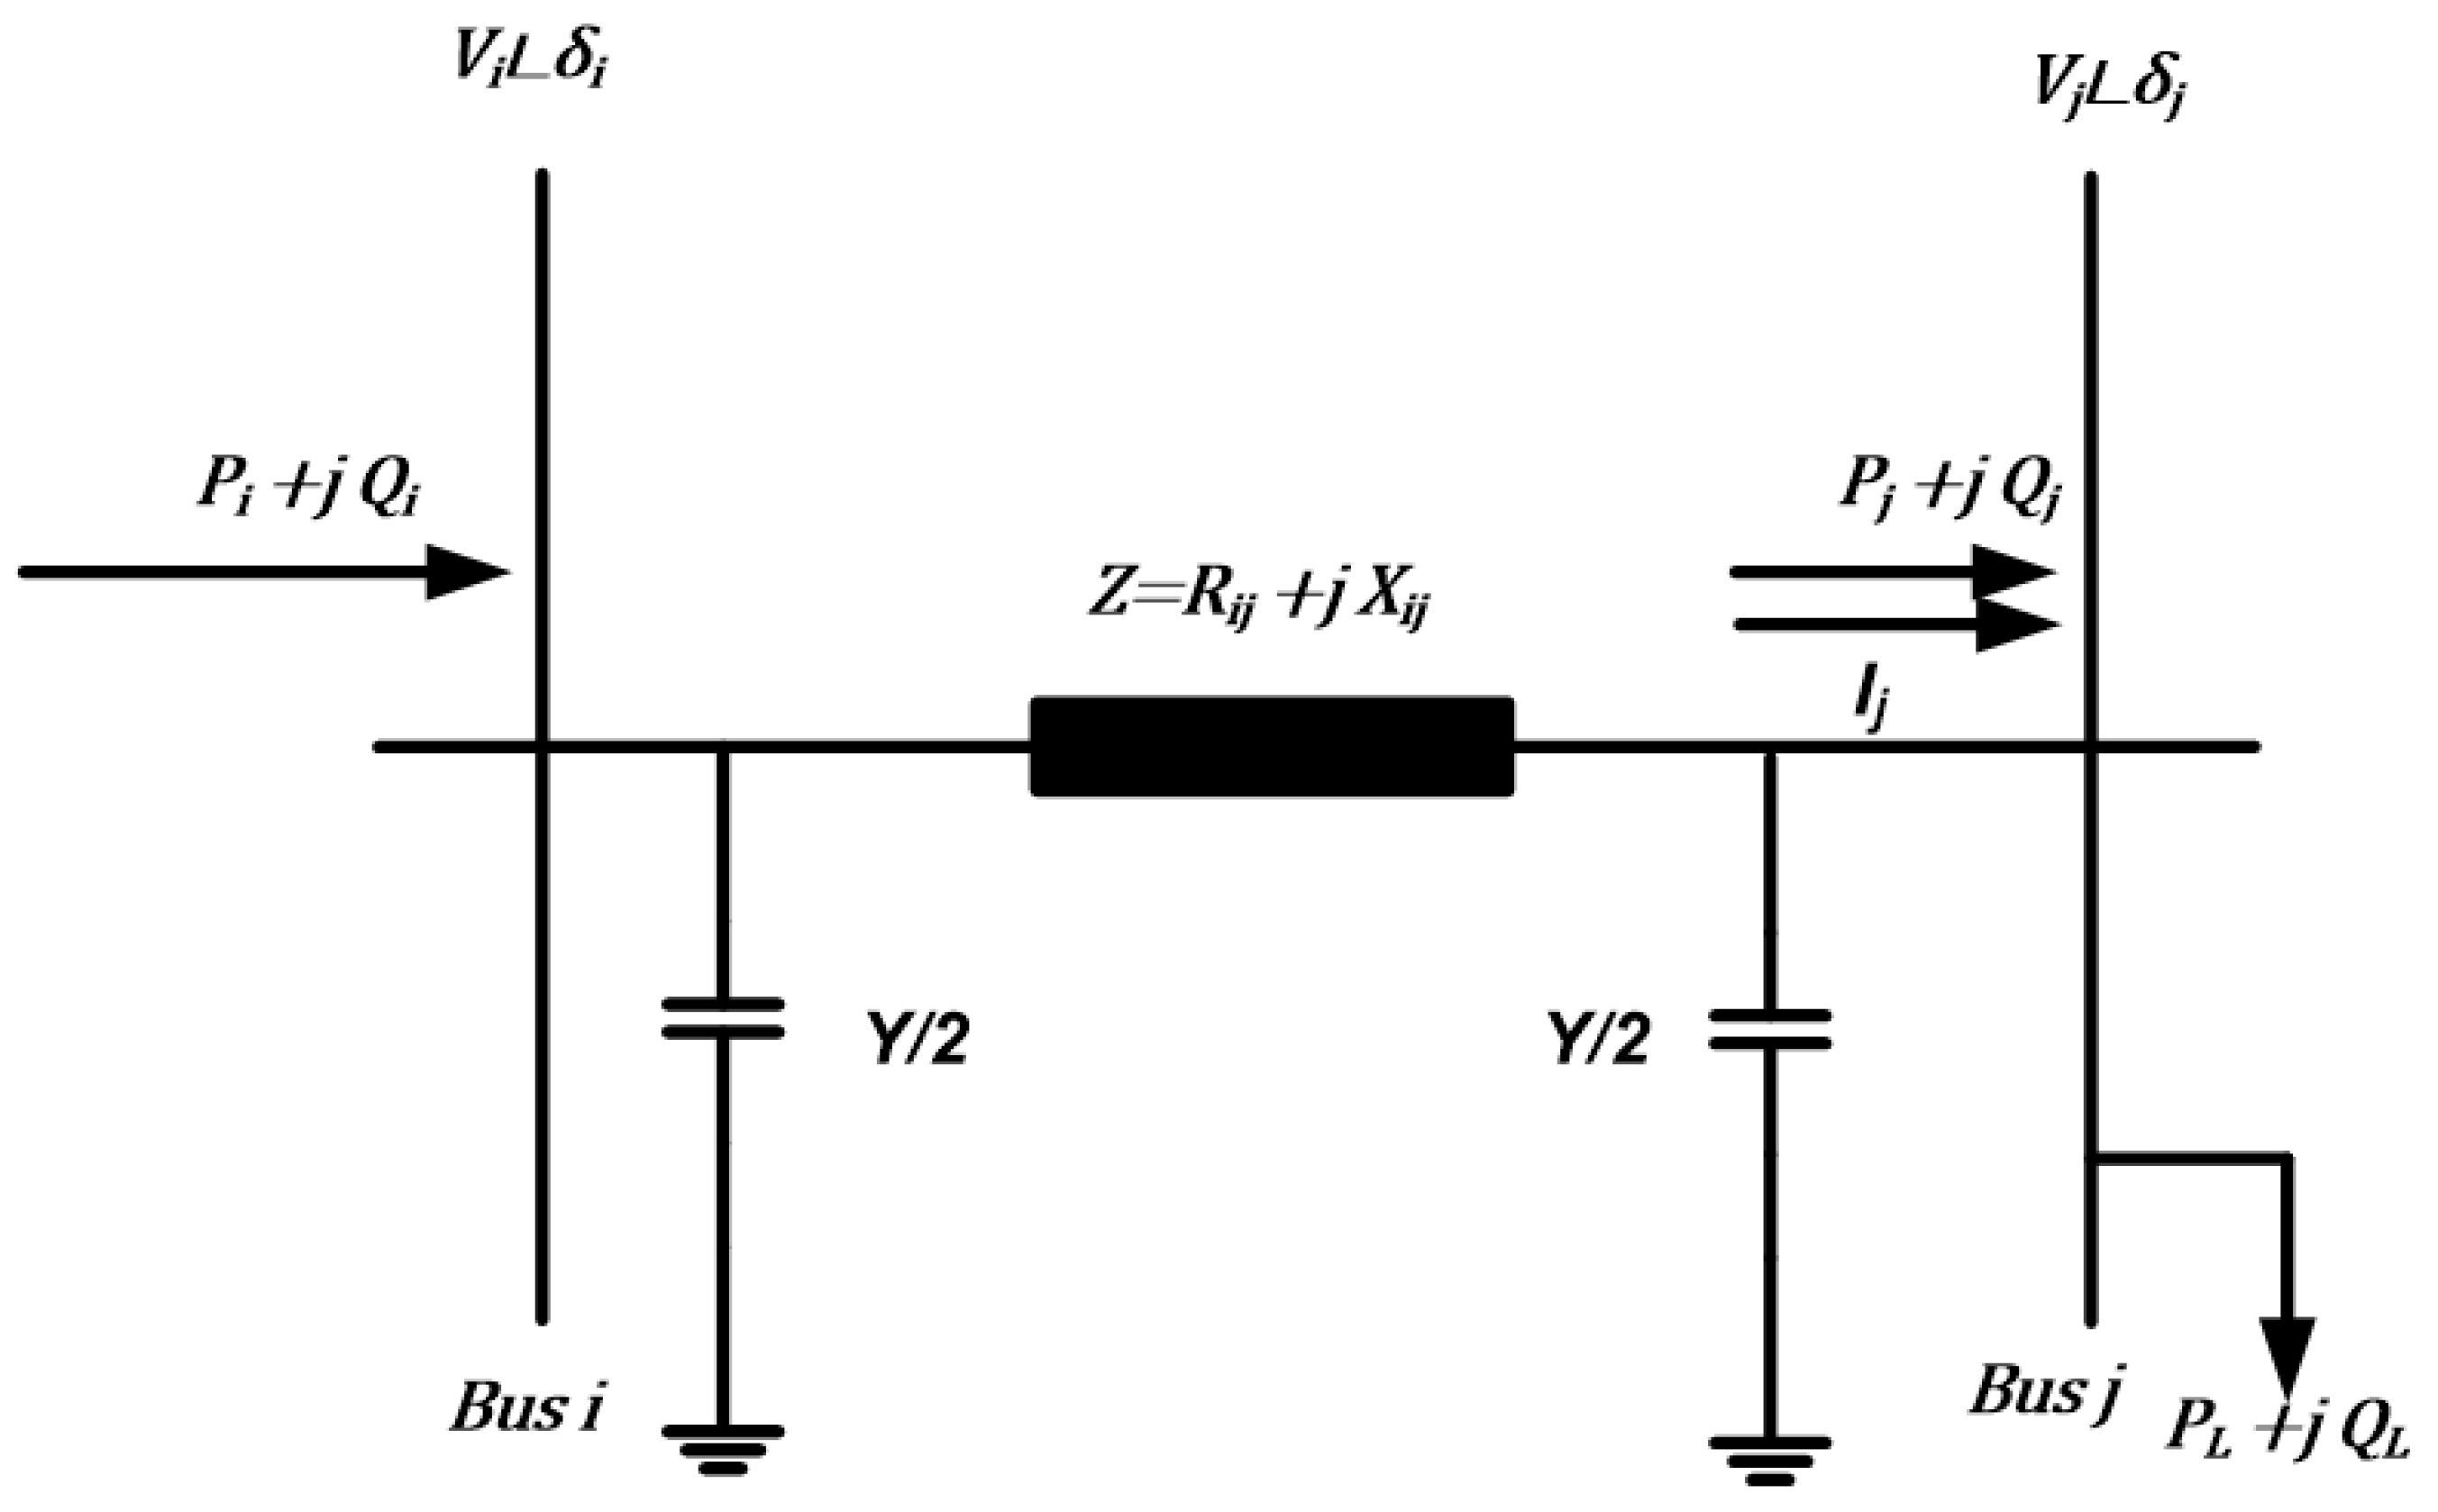
2.1. Power Flow of Grid-Connected RES

The RES model of the power flow program differs from typical synchronous generators, the PV model, and the PQ model. To connect the RES to high voltage, the output of the inverter is raised by a power transformer, which normally has the high input impedance. These models are used in conjunction with conventional power flow approaches like Newton-Raphson methods or backward/forward sweep. In this paper, the power flow is analyzed using the Newton-Raphson method for grid-connected systems. The active or reactive power is set to its rated value of RES depending on the weather conditions (irradiation intensity for the PV system and wind speed for WF). The power flow analysis is constructed depending on the pertinent grid, load, and generation data, and the power flow model of the power system is constructed. The voltages on the various buses, the power flow of the power system’s lines, and the system losses are all included in the power flow model’s output.
The calculation of total energy losses and the operation of stability using power flow is based on the calculation of the active and reactive power of the RES. The power generated for RES can be calculated using the irradiation intensity of the PV system and the wind speed of the wind farm. The power flow program will run every day and calculate the average power and system stability. When high-level penetration of renewable energy can be used for the available areas in Egypt, stability performance will be analyzed by the impact of RES on EPS and selecting buses for RES connection to EPS.

2.1.1. PV System Model in Power Flow

PV power generation installations mainly include PV arrays, controllers, inverters, and other parts. When analyzing the directional effect when modeling a PV power generator, it is not necessary to take into account the dynamic characteristics of the control system tuning process, but only the steady-state result should be taken into account. The characteristics of the transformer and its configuration determine the appropriate sequence for the output of electrical power. Figure 1 shows a high-penetration PV system connected to the grid [32].
The equality constraints are active/reactive power flow equations as [32]:
P PVj = P Lj + V j · i = 1 nbus V i · Y ij · cos ( θ ij + δ i δ j )
Q PVj = Q Lj + V j · i = 1 nbus V i · Y ij · sin ( θ ij + δ i δ j )
i = 1 , ,   nbus
where P PVj and Q PVj are generated active and reactive powers of PV system bus j, P Lj and Q Lj are load active and reactive powers bus j, V i and V j are the magnitude of the voltage at buses i and j, Y ij   and   θ ij are the magnitude of admittance magnitude and the angle of the line between bus i and j. The active and reactive powers of the PV system P PVj and Q PVj depend on the weather conditions (irradiation and temperature). The actual power output P PV extracted from the PV system can be written as:
P PV = n = 1 nPV P gPV
P PV G
where G is the irradiation value (W/m2). The standard value of irradiation of PV systems in Egypt is 1000 W/m2. The output power of PV at the different values of irradiation can be calculated by:
P PV = P PVr G 1000
where P PVr is the rated output power of the PV system at the irradiation value of 1000 W/m2. The output reactive power Q PV can be calculated by:
Q PV = mP PV
where m is the factor depending on the power factor (pf) of the PV system and can be adjusted using pf of the PV system, m = 0.44 for pf = 0.9.

2.1.2. Wind Farm Model in Power Flow

Wind power generation as the PV power generator includes wind turbines, controllers, inverters (depending on the type of wind turbine generator), and other parts. When analyzing the directional effect in modeling a wind power generation plant, it is not necessary to consider the dynamic characteristics of the control system tuning process, but only the steady-state output result needs to be taken into account. The characteristics and configuration of the transformer determine the appropriate sequence for the output of electrical power. Figure 2 shows the high-penetration wind farm system connected to the power system [32].
The equality constraints are active/reactive power flow equations as:
P WFj = P Lj + V j · i = 1 nbus V i · Y ij · cos ( θ ij + δ i δ j )
Q WFj = Q Lj + V j · i = 1 nbus V i · Y ij · sin ( θ ij + δ i δ j )
i = 1 , ,   nbus
where P WFj and Q WFj are generated active and reactive powers of the wind farm at bus j, P Lj and Q Lj are load active and reactive powers bus j, V i and V j are the magnitude of the voltage at buses i and j. Y ij   and   θ ij are the admittance magnitude and angle of the line between bus i and j. The active and reactive powers of the wind farm system P WFj and Q WFj depend on the weather conditions (wind speed). The actual power output P WF extracted from the wind farm can be written as:
P WF = n = 1 nwind P gwind
P WF V w 3
where V W is the wind speed in (m/s). The standard value wind speed of the wind turbine in Egypt is 12 m/s. The output power of the wind farm at the different values of wind speed can be calculated by:
P WF = P WFr ( V w 12 ) 3
where P WFr is the rated output power of the wind farm at the wind speed of 12 m/s. The output reactive power Q WF can be calculated by:
Q WF = mP WF
where m is the factor depending on the pf of the wind farm and can be adjusted using pf of the PV system, m = 0.44 for pf = 0.9.

2.2. Objective Function

Therefore, the objective function is calculated using the following equation:
OF = min f ( x ) = min { f 1 ( x ) , f 2 ( x ) , f 3 ( x ) }
Subject   to   h ( x ) = 0   and   g ( x ) 1
x S
where x is the solution vector, S is the solution space, f i ( x ) is the objective function, h ( x ) is equality constraint and g ( x ) is the inequality constraint.
OF = min f ( E Loss ,   VD   ) = min ( E Loss ,   VD )
The objective function is subject to the main limitations in the optimization process, namely, power limitations, voltage limitations, active power loss limitation, and RES’s rate limitation.
For power limiting, the algebraic sum of all received power is equal to the sum of all transmit power plus line losses across the entire power system and the power generated by the RES.
P ss = i = 2 nbus P Li + j = 1 nline P lossj m = 1 nRES P RESm
Q ss = i = 2 nbus Q Li + j = 1 nline Q lossj m = 1 nRES Q RESm
where P ss and Q ss active and reactive power of the system, P Li and Q Li active and reactive power of load at bus i, P lossj and Q lossj active and reactive power losses of line j, P RESm and Q RESm active and reactive power of RES, nbus is the number of buses, nline is the number of lines and nRES is the number of RESs.
In the case of voltage limits, the voltage value must remain within the limits specified in each bus:
V min V i V max
where V min is the minimum limit of bus voltage and V max is the maximum limit of bus voltage. Concerning the Egyptian grid code: 0.95 V i 1.05 .
The generation of active and reactive power from RES is regulated by its lower and upper limits as follows:
P RESmin P RES P RESmax
Q RESmin Q RES Q RESmax

2.2.1. Active Energy Loss

The optimum locations of RES units in the 25-bus 500 kV EPS are formulated as an optimization problem to reduce the total active energy losses. The power flow is calculated as the output power of the PV system and WF every day during the year. Figure 3 shows the two-bus system.
[ V i I i ] = [ 1 + YZ 2 Z Y ( 1 + YZ 2 ) 1 + YZ 2 ]   [ V j I j ]
I j = P j jQ j V j δ j
P Loss = 3 I j 2 R ij
E Lossi ( d ) = P Lossi ( d = 1 ) + P Lossi ( d = 2 ) + + P Lossi ( d = 365 ) = d = 1 n = 365 P Lossi ( d )
E tloss = i = 1 nline E Lossi
E tloss = d = 1 365 i = 1 nline E Lossi ( d )
where P Loss is the line active power losses, I j is line current, R ij is line resistance, P j   and   Q j are active and reactive powers at bus j, V i and V j are the magnitude of the voltage at buses i and j, E Lossi is annual energy loss of line i, P Lossi ( d = 1 ) ,   P Lossi ( d = 2 )   and   P Lossi ( d = 365 ) are daily active power losses, d is the day and E tloss is total energy loss of the system.

2.2.2. Voltage Deviation

Calculation of the bus voltage deviation (VD) of two buses system which is an important stability index, as follows:
VD = j = 1 nbus | V i V j | | V i |
where V i is the nominal voltage at bus i and V j is the calculated voltage at bus j.

2.2.3. The Maximum Load Ability of the System

The maximum load capacity is achieved with very gradual load changes, and the dynamics that govern the behavior of the system are still the load flow equation. For an electrical load that exceeds the maximum load capacity, the load flow equations are not accurate, and the load flow program will not converge. Therefore, the maximum load capacity can be obtained by increasing the load on all buses in the network using the following approach and checking the convergence of the load flow equations:
P Li ( m ) + jQ Li ( m ) = ( 1 + Δ L · m ) ( P Li ( m 1 ) + jQ Li ( m 1 ) )
where P Li ( m )   and   Q Li ( m ) are active and reactive power at bus i at step m, Δ L load change per step considering 1% and i = 1 , , nbus .

2.3. The Proposed Algorithm

The proposed algorithm is divided into three sections: calculation of the 25-bus 500 kV EPS performance without and with Egyptian RES projects (in operation and under construction), selection of the optimal locations of RESs to connect to the IEEE 33-bus and 69-bus distribution systems, and the realistic 25-bus 500 kV EPS that provide the minimum annual total power and improve the voltage profile considering the maximum load capacity of 25-bus 500 kV EPS.

2.3.1. Selection of the Best Locations of Full Captured Power RESs

To select the RES connection buses in the IEEE 33-bus and 69-bus distribution systems, as well as the realistic 25-bus 500 kV EPS, providing the lowest annual energy losses based on a multi-objective function by selecting the number of RESs as one, two, three, or four, proceed as follows:
  • Select the number of RES: one (PV system or wind farm).
  • Choose RES connected to bus No. 1 of IEEE 33-bus and 69-bus distribution systems, and realistic 25-bus 500 kV EPS.
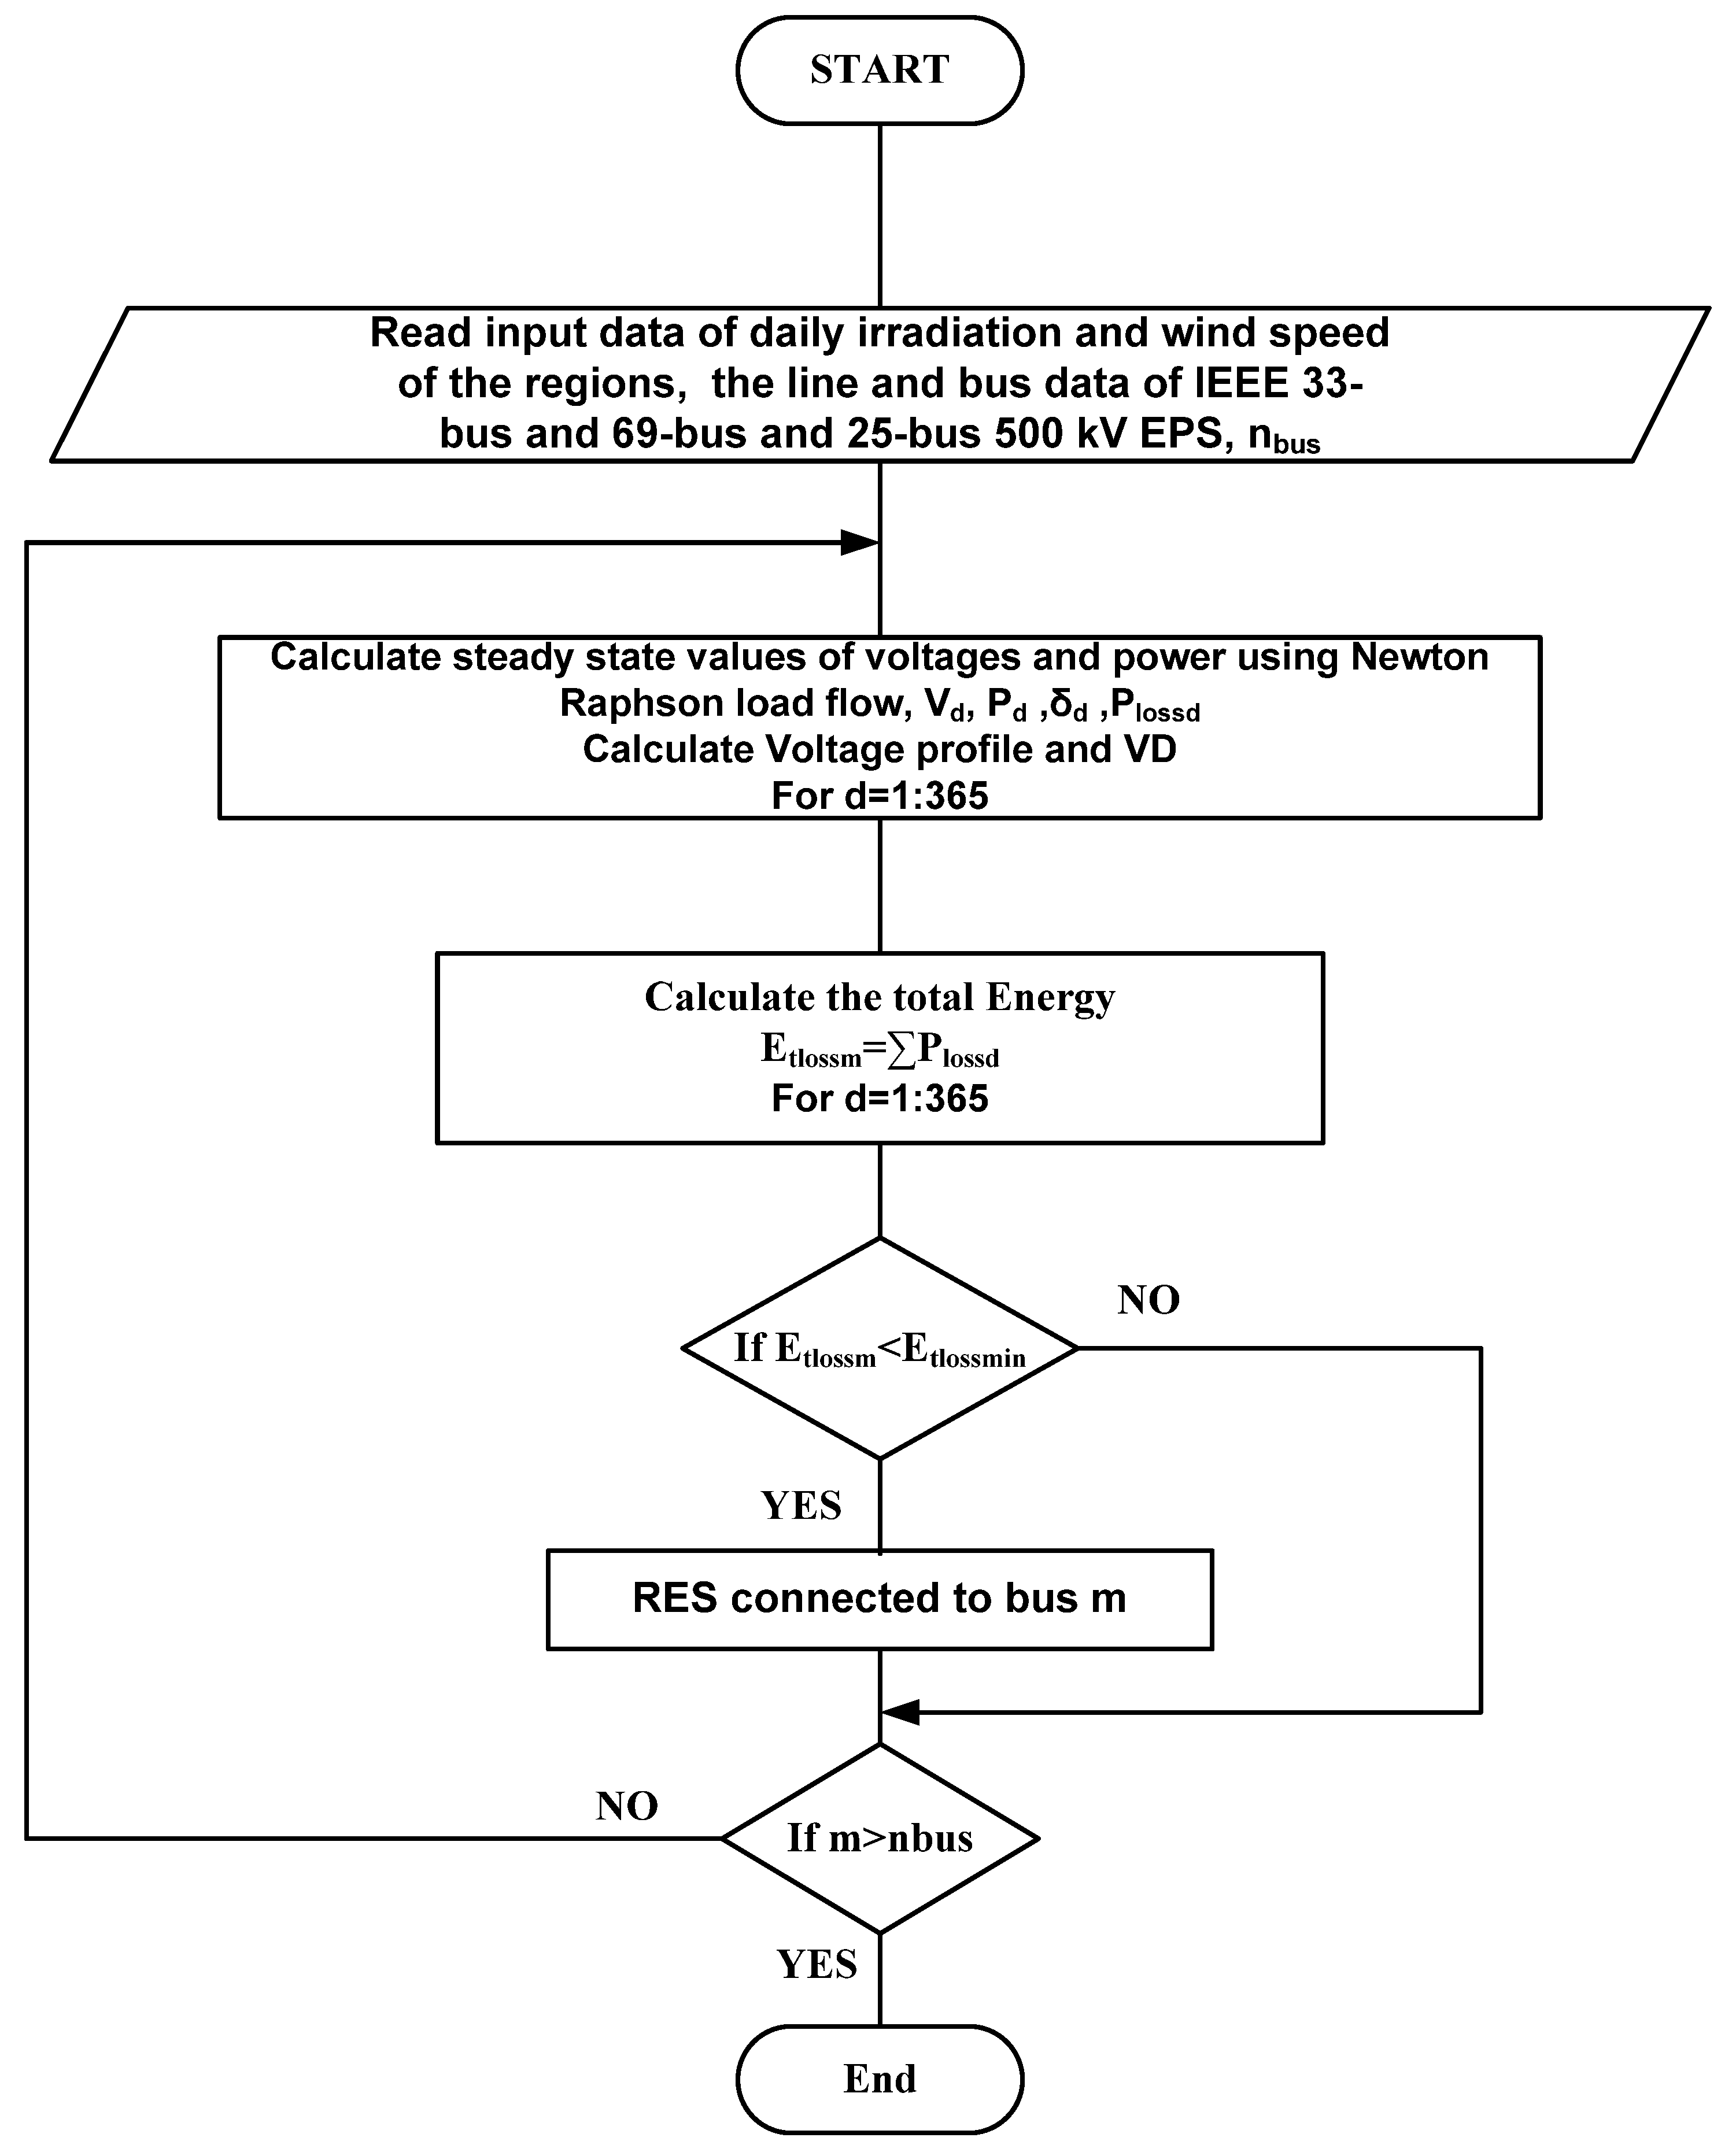
  • Start calculating the active and reactive power of RES depending on the weather condition, solar irradiation for the PV system, and wind speed for the wind farm.
    P PV = P PVr G bus   1 ( d ) 1000
    P WF = P WFr ( v wbus   1 ( d ) 12 ) 3
    where G bus   1 and v wbus   1 are irradiation intensity and wind speed at bus 1. Their values were obtained from the NASA website for the period 1 January 2021 to 31 December 2021.
  • Calculate the power flow of the 25-bus 500 kV EPS with RES
  • Calculate P loss , voltage profile.
  • Repeat steps 4 and 5 for d = 2 , ,   365 in a year
  • Calculate E tloss and minimum voltage deviation.
  • Repeat steps 3–7 with the RES bus connected to bus No. 2 to nbus.
  • Choose a bus with which RES can be connected, achieving the minimum annual total energy and voltage deviation. Figure 4 shows the flowchart for selecting the bus of RES.
  • When selecting the bus of one RES, it can be used for the number of RESs: two, three, or four. The steps from 2 to 8 are repeated to select the second bus for the second RES, increasing the number of buses in the IEEE 33-bus and 69-bus distribution systems and the realistic 25-bus 500 kV EPS by one (nbus + 1).
  • When selecting the bus for the second RES, it can be used for three or four RES. Steps 2 through 8 are repeated to select the third bus for the third RES, increasing the number of buses in the IEEE 33-bus and 69-bus distribution systems and the realistic 25-bus 500 kV EPS by two (nbus + 2).
  • When selecting the bus of the third RES, it can also be used for the bus of the fourth RES. Steps 2 through 8 are repeated to select the fourth bus for the fourth RES, increasing the number of buses in the IEEE 33-bus and 69-bus distribution systems and the realistic 25-bus 500 kV EPS by three (nbus + 3).

2.3.2. The Maximum Load Capacity of 500 kV EPS with RESs

Using the maximum amount of energy generated by PV systems and wind farms in the power system increases the generated energy, which increases the extra energy. This extra generated energy can be used to power various applications, such as hydrogen production and industrial loads. The load demand is also increasing every year due to the development in different regions of Egypt. The maximum load that can be fed from the EPS using RES can be calculated in the following steps:
  • Increase the load by 1% as Equation (27)
  • Calculate the power flow of EPS with RESs
  • Calculate P loss , and voltage profile.
  • Repeat steps 4 and 5 for d = 1 , 2 , ,   365 in a year
  • Detect the convergence of the power flow of the system

2.3.3. Performance of 500 kV EPS without and with RES Projects

To measure the performance of the system, the power flow is measured during the year by taking the average power of RES per day by following these steps:
  • Run power flow for 500 kV EPS without RESs, 500 kV EPS with RESs (in operation), and 500 kV EPS with RESs (in operation and under construction).
  • Calculate RES power per day using the weather data (obtained from the NASA website).
    PV   system :   P PV = P PVr G bus   ( d ) 1000
    WF :   P WF = P WFr ( V wbus   ( d ) 12 ) 3
  • Calculate the power flow of EPS with RES
  • Calculate P loss , voltage profile, and voltage deviation
  • Repeat steps 4 and 5 for d = 2 , ,   365 in a year
Calculate E tloss and minimum stability indices.

2.4. Particle Swarm Optimization [44]

PSO is an optimization method based on swarm behavior and intelligence. The system model structure of a fundamental creature that causes a group to have a purpose, such as looking for food, is called a particle swarm. It is crucial to uniting the majority of the public around a common activity. The collective activity of the species is demonstrated by bee swarms, fish schools, and flocks of birds, for example. PSO is made up of a swarm of particles that move throughout the search space in search of the best answer. The velocity v with length n advances each particle, indicating its position, and the current position is updated using the change in the velocity value. This allows each particle to adapt its flight in accordance with both its own and other particles’ flying experiences. The coordination of each particle was recorded in a chain solution that was constrained by the best solution reached by that particle. This value is known as “personal best” (abbreviated as “pbest”). The best value so far attained by any particle in that particle’s immediate vicinity is another best value that the PSO keeps track of. The name of this value is gbest. The parameters of the PSO algorithm are listed in Table A1 in Appendix A.

2.5. Genetic Algorithm [45]

To discover the ideal position, the genetic algorithm (GA) is used to do global optimization. By simulating the mechanism of evolution as it occurs in natural processes, the GA is a method of problem-solving. They evolve a variety of solutions in the direction of the “best” one using the concepts of selection, recombination, and mutation. The GA, which can find the best optimal option for DG positioning, solves the optimization problem. The fitness function evaluates each solution, the majority of which are picked at random. Each answer is described as a chromosome that indicates where the DG is in the power system. In GA, the starting population is initially formed at random, and each chromosome’s fitness value is then assessed using the objective function. Some solutions, known as infeasible solutions, do not satisfy the restrictions of the system. The genetic algorithm optimizes a single organism, eliminating impractical solutions, creating a new population using mutation and crossover operators, and repeating this process until the best solution is obtained. the exercise component. The parameters of the GA algorithm are listed in Table A1 in Appendix A.

3. Results and Analysis

3.1. Systems under Study

For this analysis, IEEE 33-bus and 69-bus distribution systems and the realistic 25-bus 500 kV EPS are taken into account. The IEEE 33-bus and 69-bus distribution systems and the 25-bus 500 kV EPS are shown in Figure 5, Figure 6 and Figure 7. As shown in Figure 5 and Figure 6, the IEEE 33-bus and 69-bus distribution systems are divided into regions, and each region has an irradiation and wind speed value. The average daily values of irradiation and wind speed per year for regions are shown in Figure 8 and Figure 9. As shown in Figure 7, 25 single-circuit 500 kV transmission lines make up the fictitious 500 kV Egyptian grid in black, RES projects already in operation in blue, and new RES projects (under construction) in red. Based on statistics from 2022, the power stations mentioned in Table 1 provide the Egyptian transmission grid. The data in Table 1 is collected from the annual report of the Ministry of Electricity and Renewable Energy in 2021. The generation and load power at each bus are the sum of the generation stations and loads near the bus. The 500 kV Egyptian power grid uses the ACSR conductor type. The Ministry of Electricity and Renewable Energy posts information about the transmission line’s length and technical details on its website. In this study, the Egyptian 500 kV power system is considered the original multi-source power system, and power plants fall into one of three categories: gas turbines and multiple steam power plants are examples of non-reheat power plants. Thermal and combined heat and power plants are examples of reheat power plants. Hydraulic power plants such as the Aswan High Dam are examples of non-reheating power plants. Recently, several RESs have been integrated into EPS, including solar PV, concentrated solar power (CSP), and wind farms.

3.1.1. New Renewable Energy Projects in Egypt

Egypt aims to make the most of the solar and wind energies that can be obtained from weather conditions to increase green energy generation. The maximum RES capacity is 90 GW, which can be captured in available areas in Egypt. This value was announced by the Egyptian Ministry of Energy and Electricity. To get the most benefit from this, the Egyptian Ministry of Electricity and Energy has drawn up a project plan for new renewable energy plants at the republican level. Some of these projects have already been completed and are in operation, while others are under construction. These are both government and private projects. The government projects help EPS serve a large segment of the population. As for private projects that serve a certain part of the services, such as factories or others. Figure 10 shows Egypt’s plan for RES projects.

3.1.2. PV Projects

As one of the best-suited countries in the Sun Belt region for solar energy projects, Egypt has abundant renewable energy resources. The results of the Atlas of Egypt, based on averages over the past twenty years, show that on average solar radiation ranges from 2000 to 3200 kWh/m2 and daily hours of sunshine vary from Egypt to Egypt. This creates favorable opportunities for investment in various areas of solar energy. Figure 11 shows the global horizontal radiation over the state of Egypt. On a global scale, Egypt is one of the most appropriate regions for exploiting solar energy both for electricity generation and thermal heating applications. Since the early 1980s, solar PV systems have been demonstrated in Egypt for different applications, including pumping, lighting, advertising, cold storage, and desalination. Table 2 shows the new PV projects in Egypt.

3.1.3. Wind Energy Projects

Wind energy resources are rich in Egypt, especially in the Gulf of Suez region, according to the Wind Atlas for Egypt Measurement and Modeling (1991–2005). Due to its high, consistent wind speeds, which reach an average of 8 to 10 m/s at a height of 100 m, as well as the availability of huge, deserted desert expanses, this is one of the best places in the world for capturing wind energy. Additionally, in the Beni Suef and Menya Governorates as well as El Kharga Oasis in the New Valley Governorate, potential new areas have been found east and west of the Nile River as well as some of Sinai, experiencing 7 to 8 m/s of yearly wind speed on average. They provide wind speeds that range from 5 to 8 m/s, which are appropriate for wind-powered electricity generation as well as other uses like water pumping. Figure 12 shows the new wind atlas, measured at a resolution of 1 km and a height of 200 m and released in 2016 on IRENA’s Global Atlas platform. Due to its renewable nature, abundance, cleanliness, and minimal land use, wind energy is regarded as one of Egypt’s most promising sources of renewable energy. One of Egypt Vision 2030’s goals is to increase the share of domestic wind energy production. In 2018, the Ministry of Electricity and Renewable Energy successfully established wind farms with 30 percent local content.
The Red Sea and the Gulf of Suez are the most notable high wind areas. It was estimated that 20 GW of wind farms could be housed in the Gulf of Suez area. Other candidate areas for wind farm construction are located at Faiyoum, Beni Sweif, Minya, and Kharga oasis. Egypt is also constructing new wind farm stations:
  • A wind power plant project with a capacity of 250 MW in the private sector (Lakela Company) is under construction, and many BOO (“Build, own, and operate”) projects have a capacity of 750 MW.
  • Ras Ghareb Wind Farm (262 MW); A wind project is being developed near the Gulf of Suez, approximately 30 km northwest of Ras Ghareb, Egypt.
  • A wind power plant in West Nile (200 MW).

3.2. Results and Discussion

The study validates the calculation of annual energy losses, voltage profile for IEEE 33-bus and 69-bus distribution systems, and 25-bus 500 kV EPS to get the best locations for high-level penetration of PV systems and wind farms connected to the IEEE 33-bus and 69-bus distribution systems and 25-bus 500 kV EPS by selecting the optimal location buses that provide the lowest annual energy losses and voltage profile based on the proposed algorithm. The high-level penetration of RES is chosen at 9 GW for the realistic Egyptian power system.

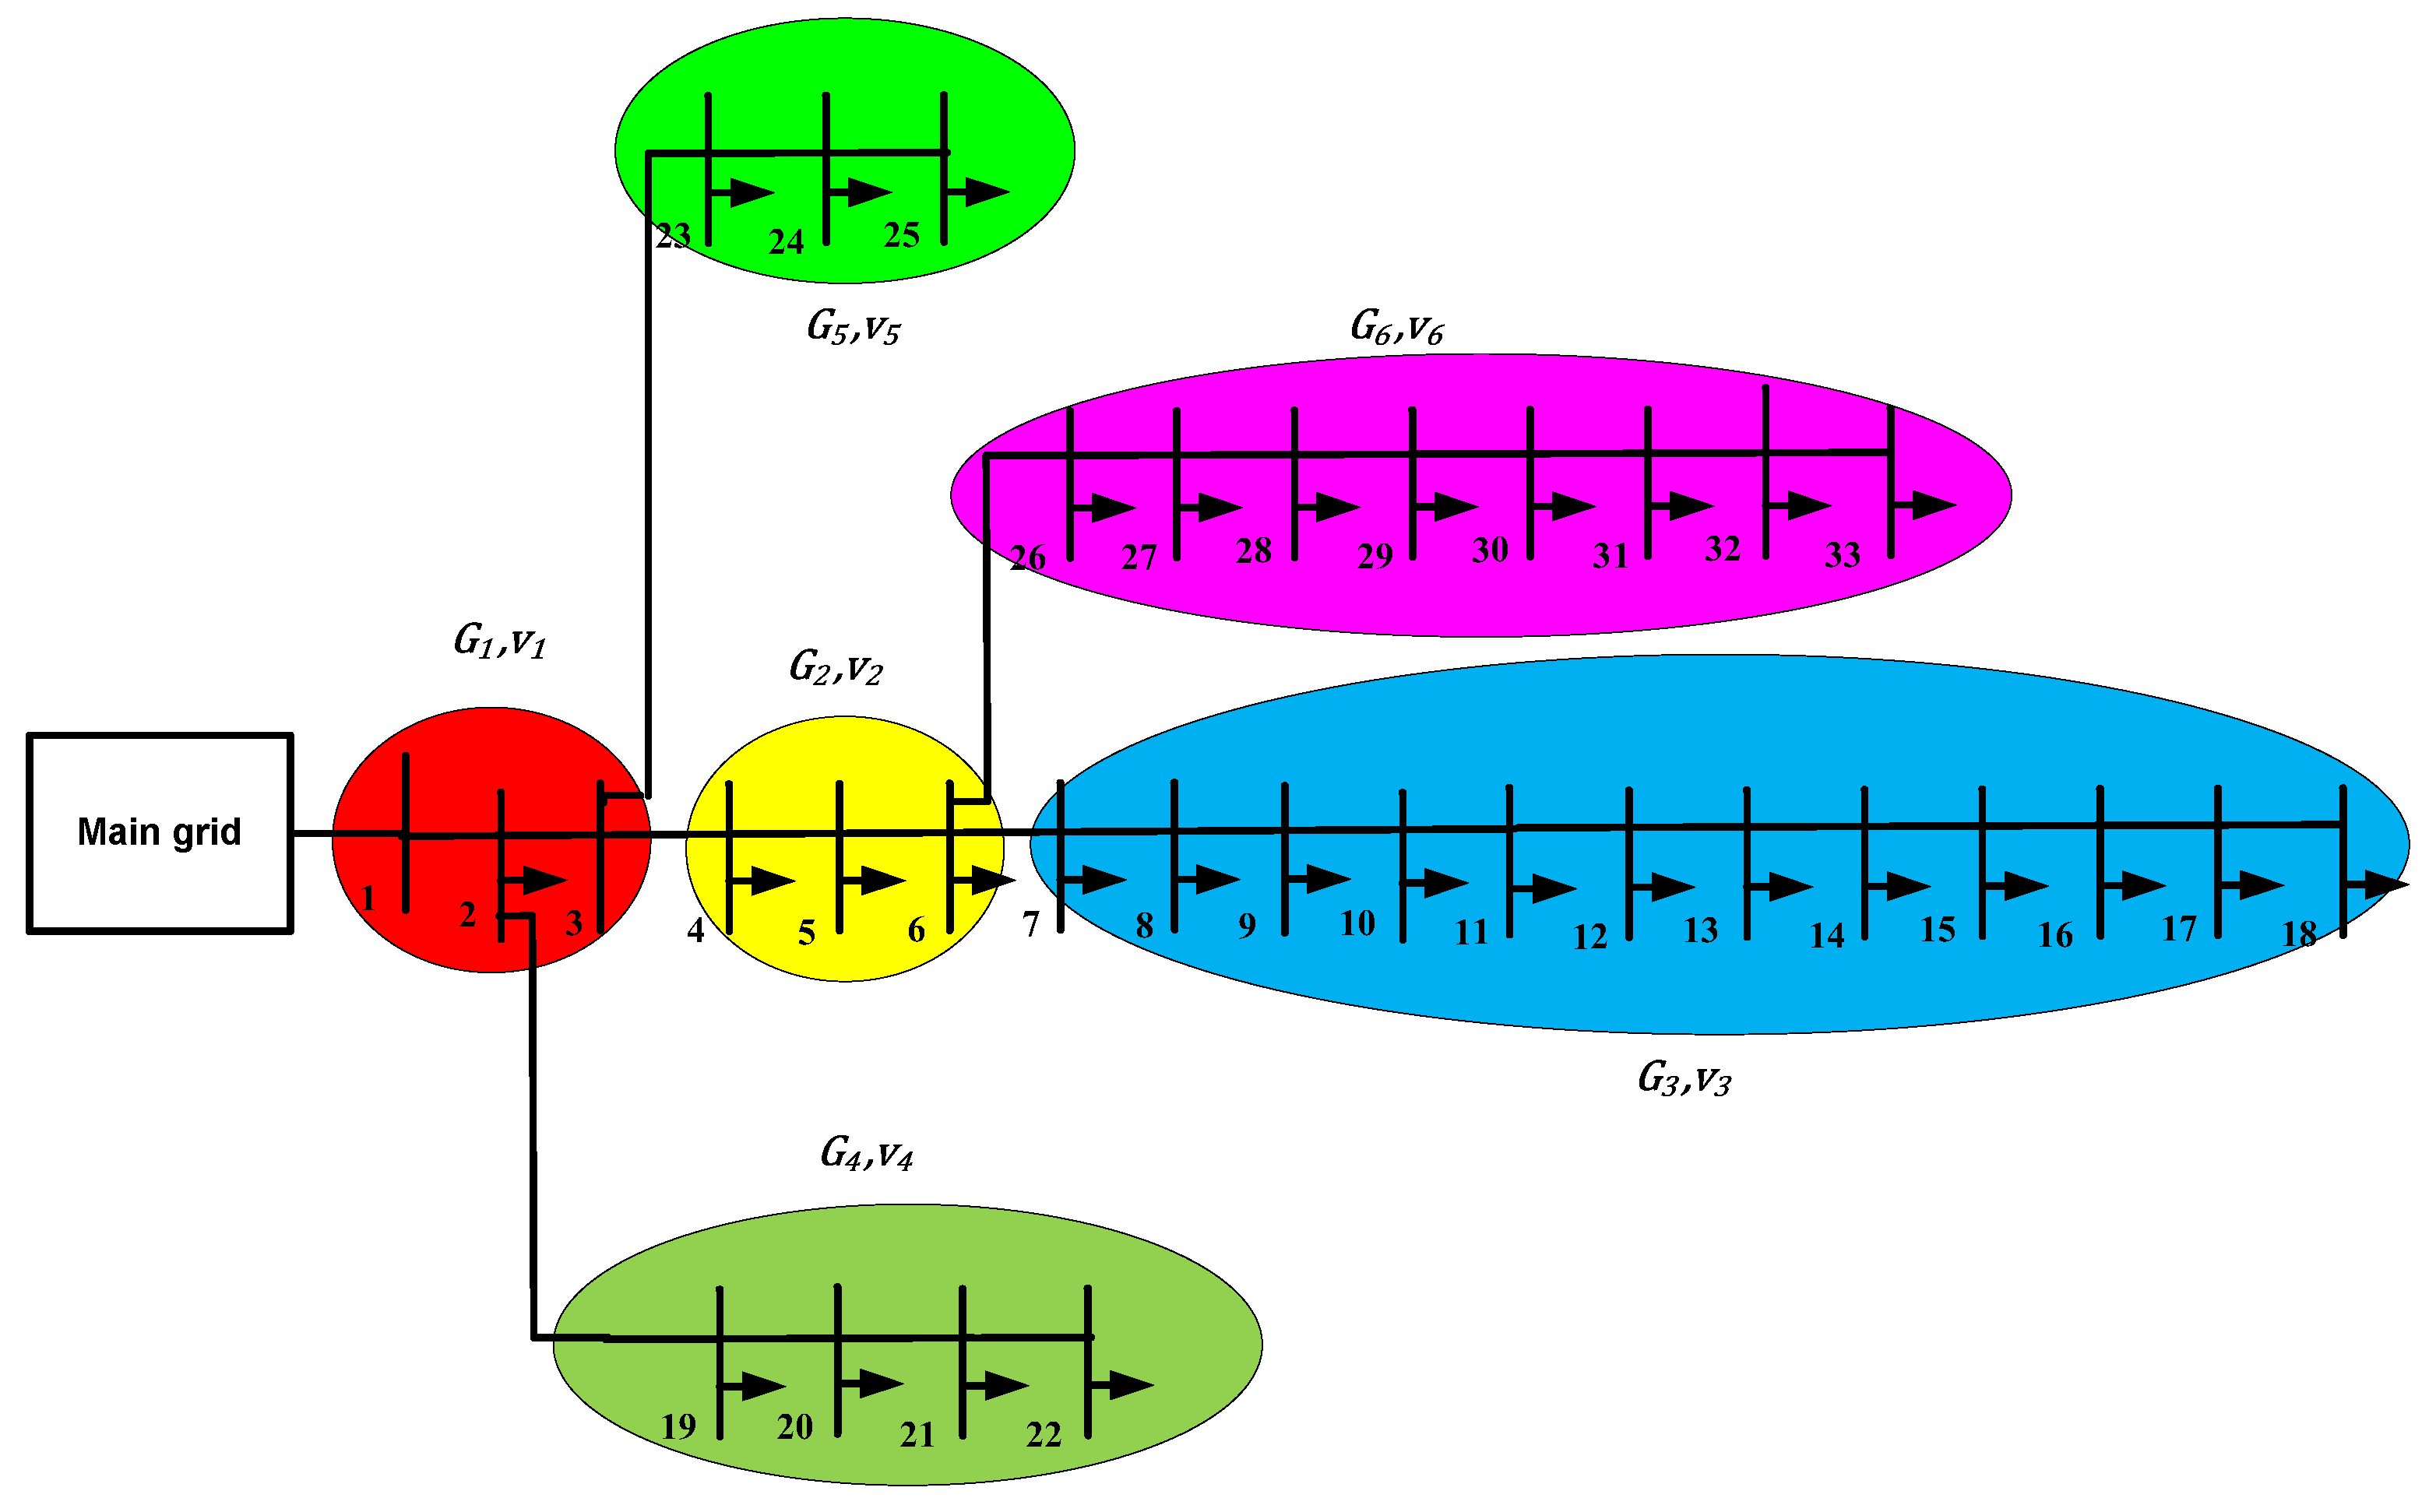
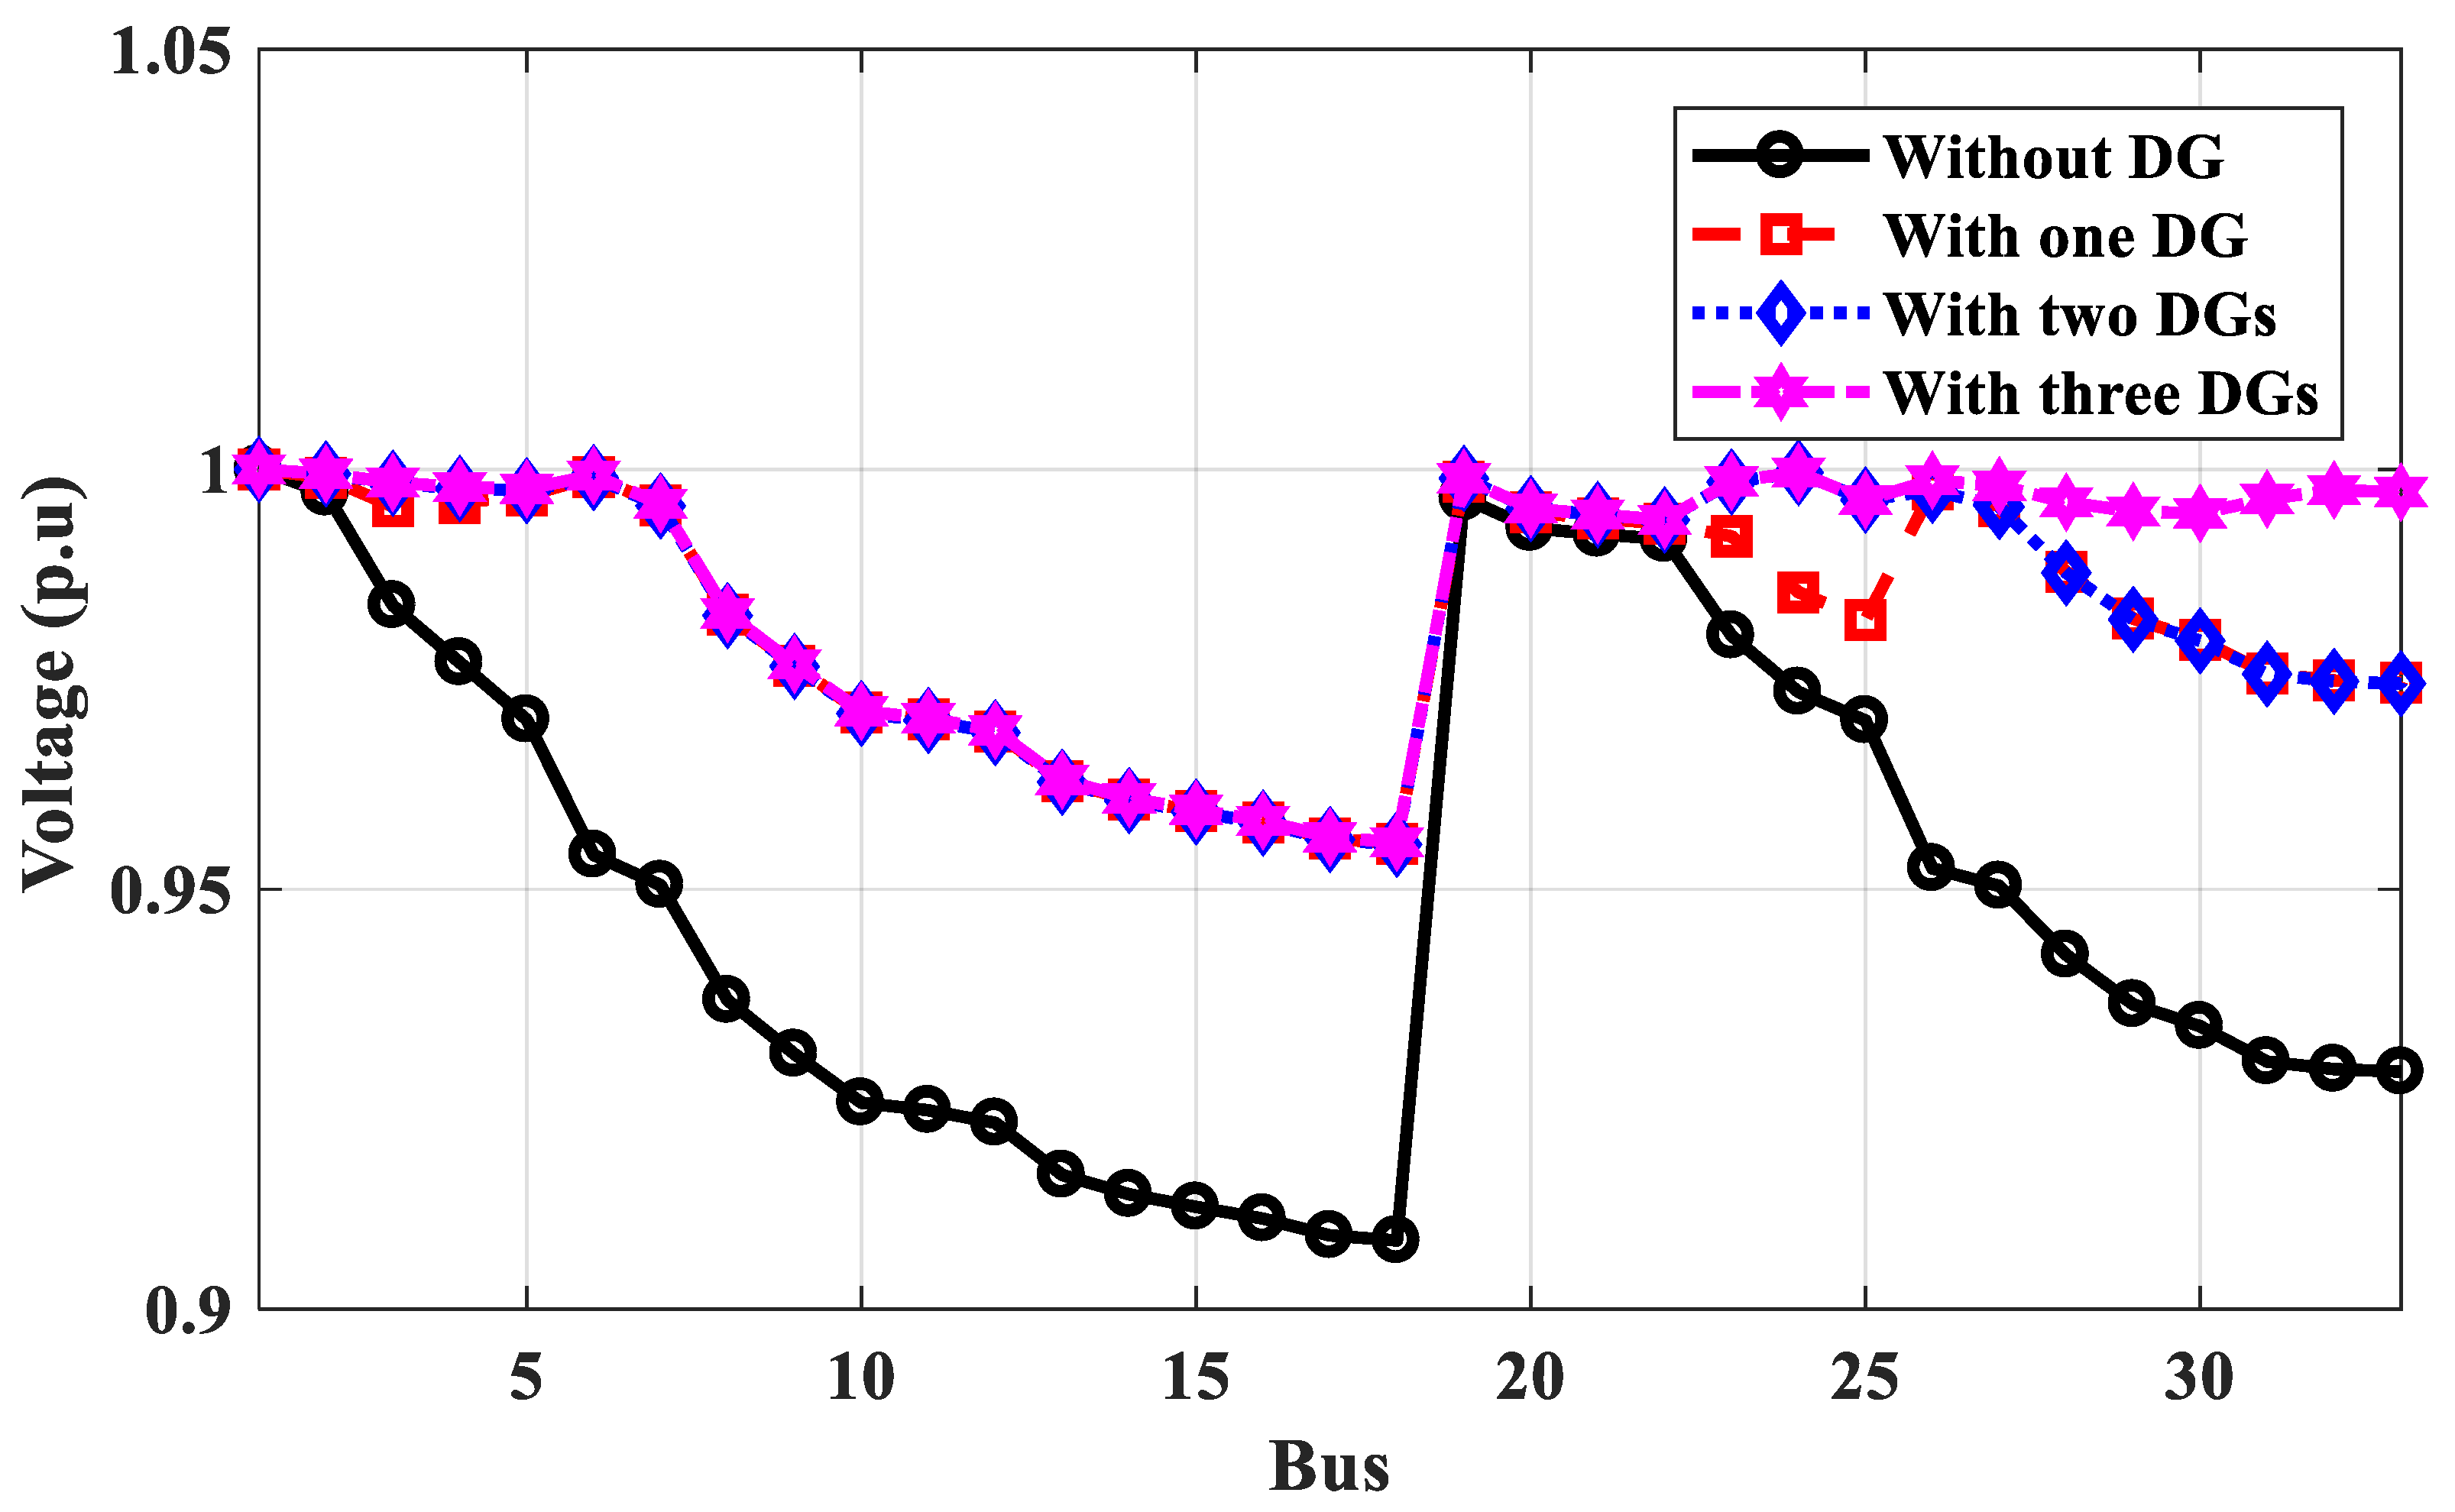
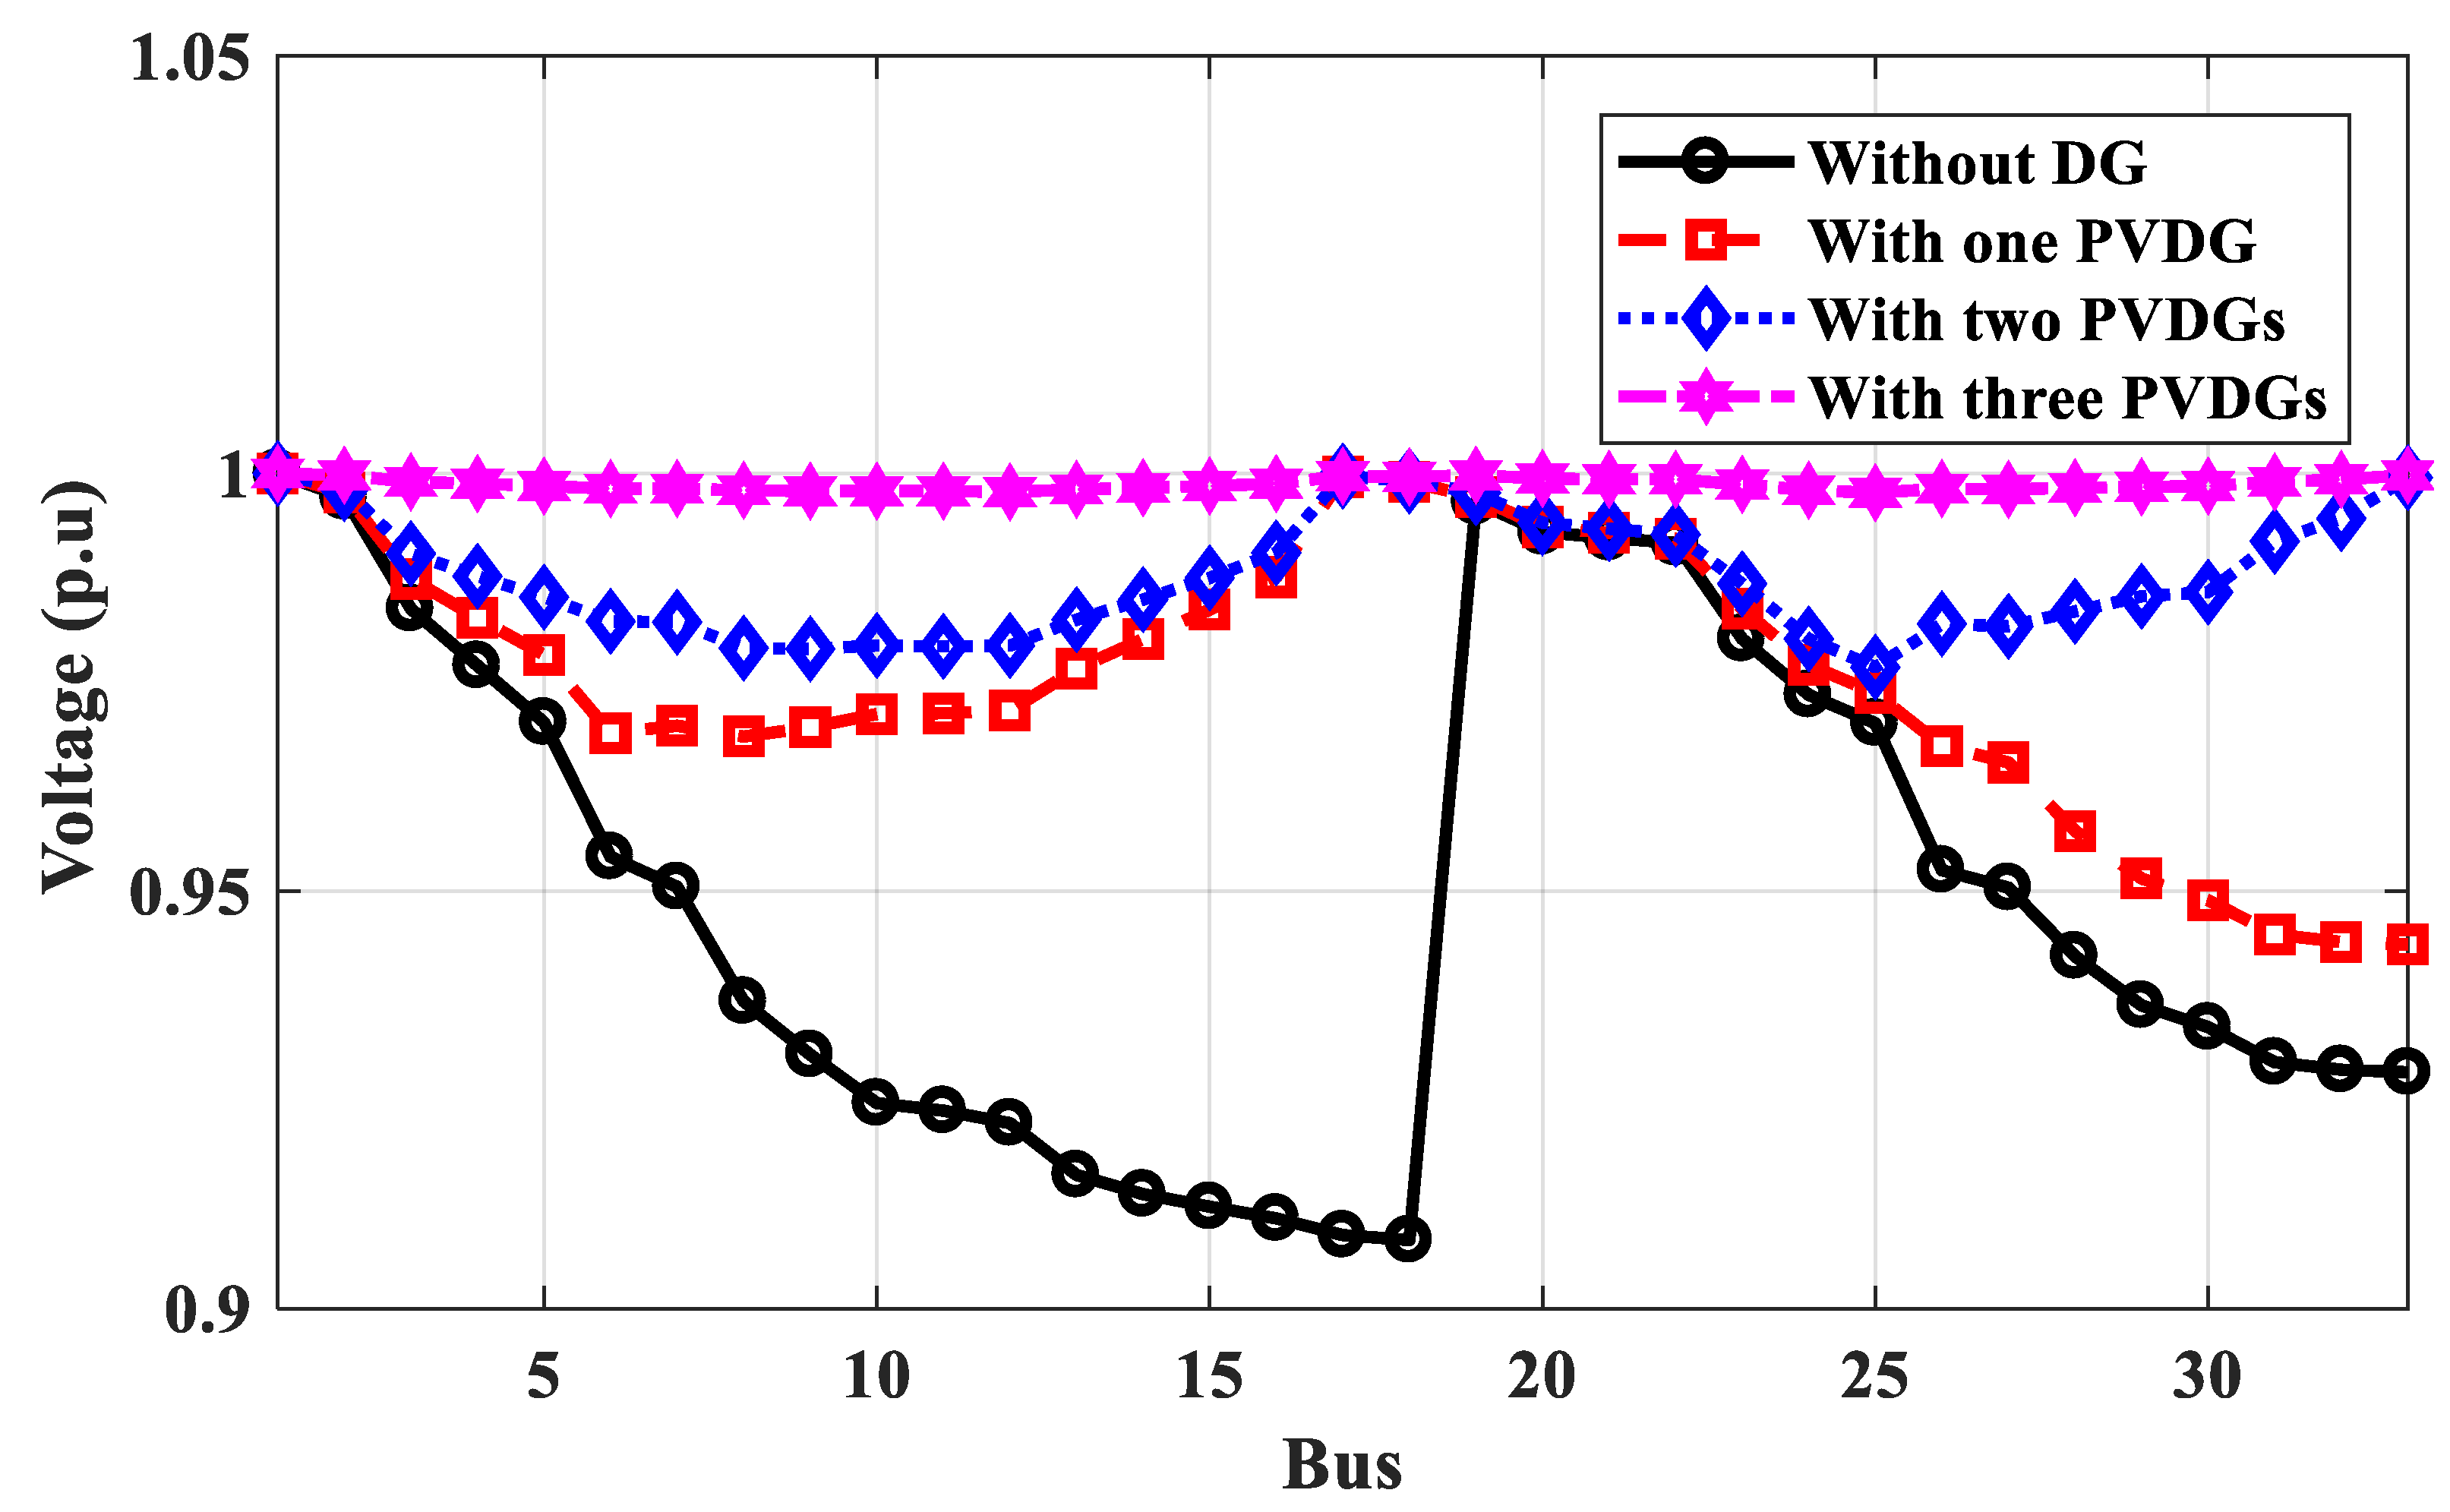
3.2.1. Case 1: IEEE 33-Bus Performance

Matlab code is used to calculate the power flow of the IEEE 33-bus distribution system to test the system’s performance and choose the optimal location of DGs with one, two, or three DGs for two criteria: power loss and annual energy loss depending on weather conditions. a fair comparison between the proposed method and previous work (PSO and GA). Table 3 shows the results of the proposed algorithm and compares it with previous work. Figure 13 shows the voltage profile of the IEEE 33-bus without and with DGs for power loss calculation. Figure 14 depicts the voltage profile of an IEEE 33-bus without and with PV system DGs for calculating annual energy loss. Figure 15 shows the voltage profile of the IEEE 33-bus without and with wind farm DGs for the annual energy loss calculation.
According to Table 3, the optimal locations of one, two, or three DGs for the proposed technique based on power calculation are 6, 6, 24, and 6, 24, 19, respectively, compared to 6, 12, 30, and 9, 24, 30 for the PSO method and 6, 6, 15, and 14, 24, 28 for the GA method based on power calculation. The power loss of the IEEE 33-bus system calculated by the proposed method is less than the values obtained using PSO and GA. As shown in Figure 13, the voltage profile has been improved with more DGs, and the minimum voltage at bus No. 8 has been improved to 0.9556 p.u. On the other hand, the optimal locations for DG based on energy calculations differ from those based on power calculations and depend on the type of DG PV system or wind system. The optimal locations of PV system DGs are 17, 33, and 22 compared to 14, 7, and 33 for wind system DGs using the proposed method. Table 3 shows that the effective value of the output power of DG is different than its rate, which depends on the weather conditions. The effective output power of DGs is lower than their rating. The proposed technique used these effective values to get the optimal locations considering the weather conditions. The optimal locations of DGs for PV systems or wind systems based on energy calculations are made to improve the voltage profile better than the locations based on power calculations, as shown in Figure 14 and Figure 15, respectively. The voltage at bus No. 8 is optimized to 1 p.u and the minimum voltage is 0.9798 at bus No. 25.

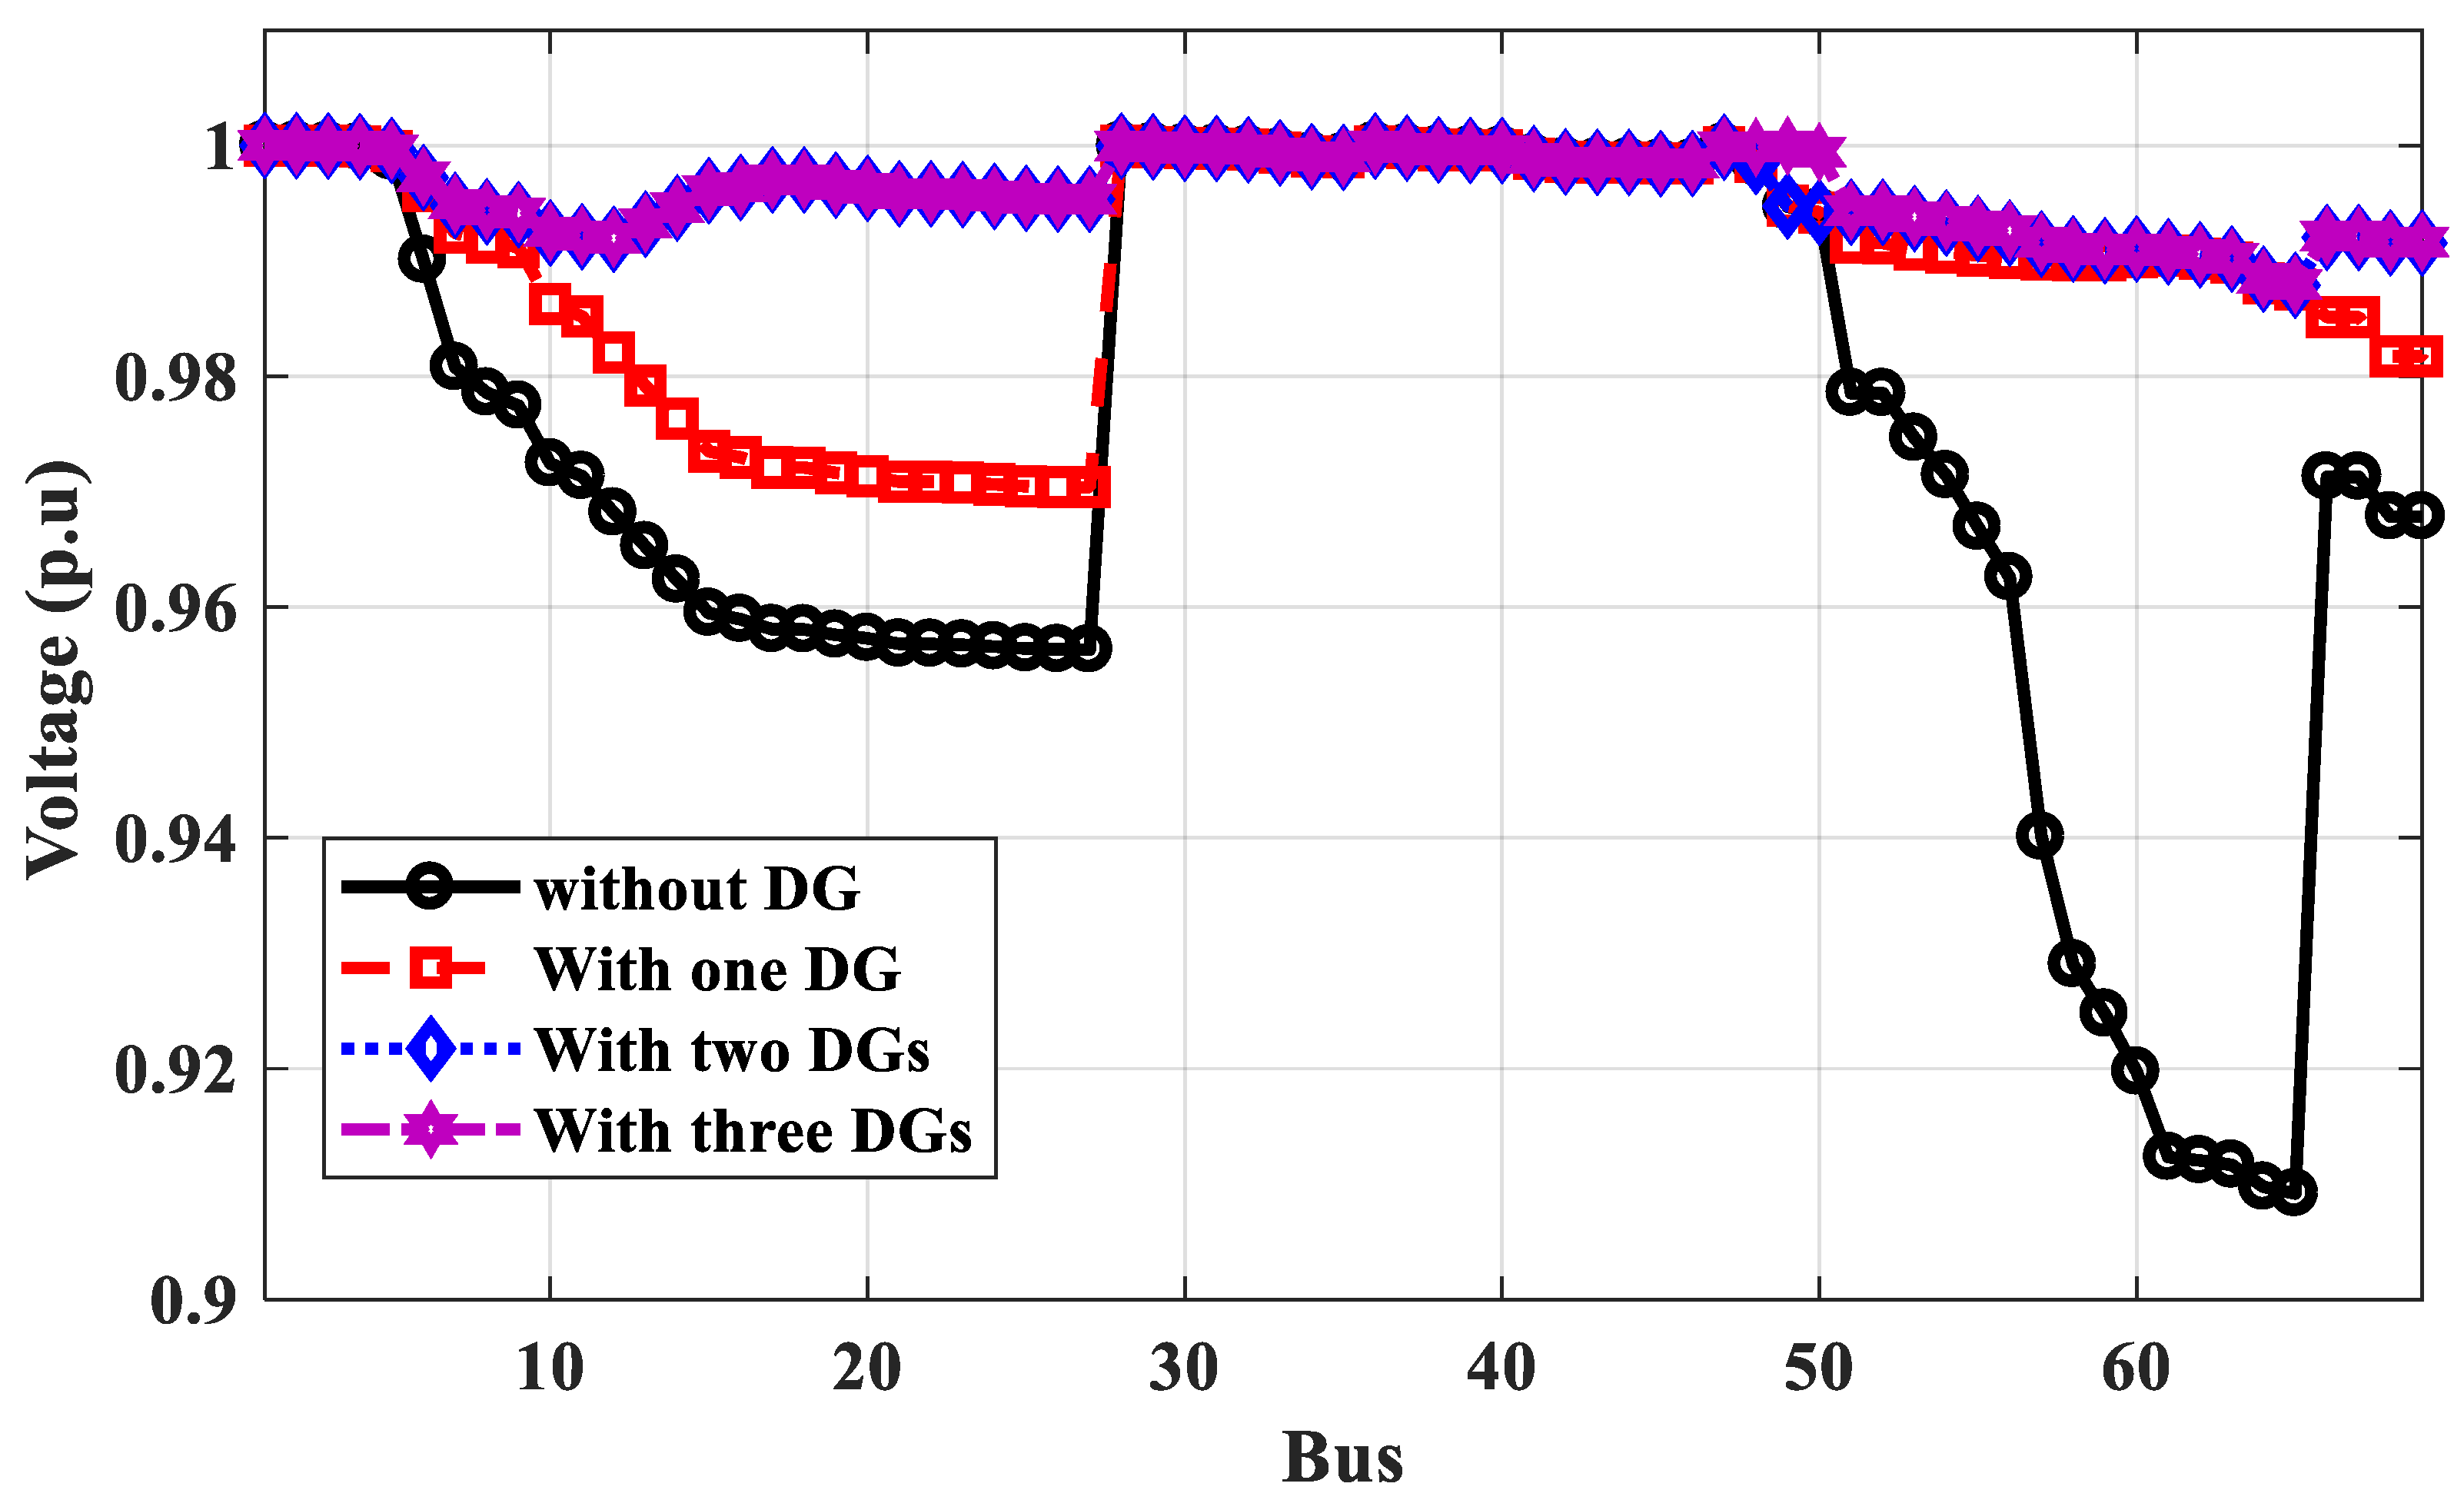
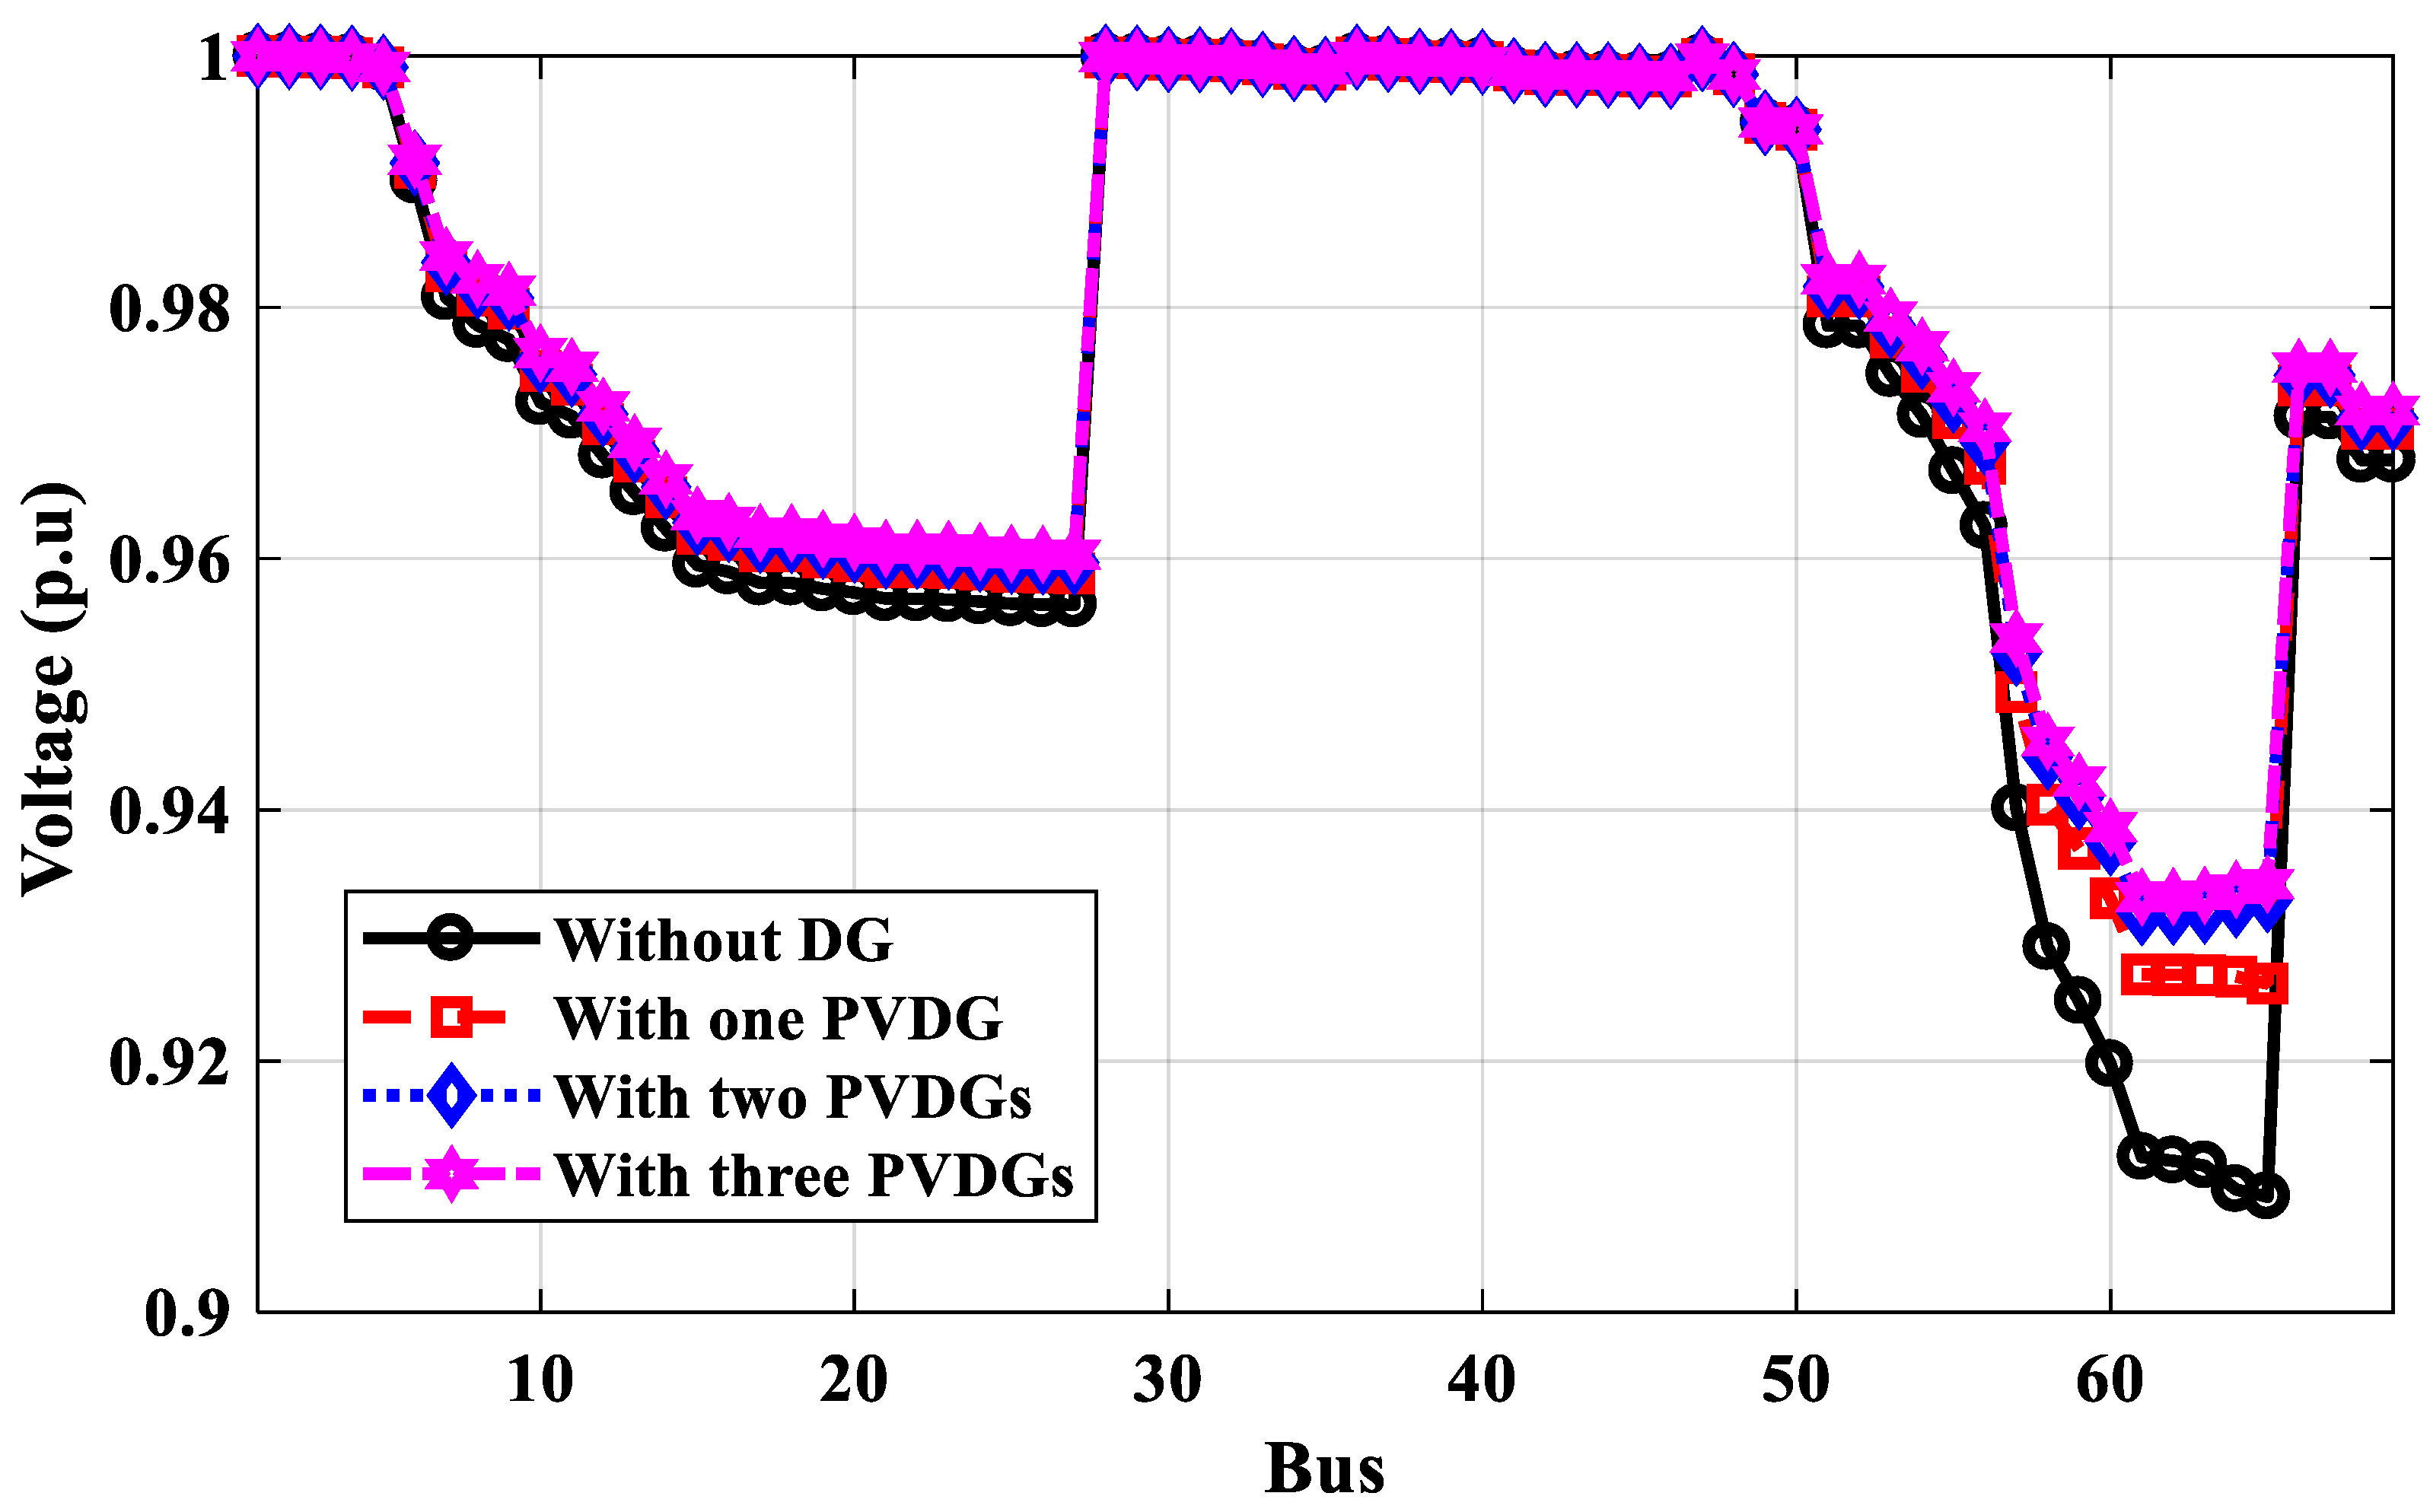
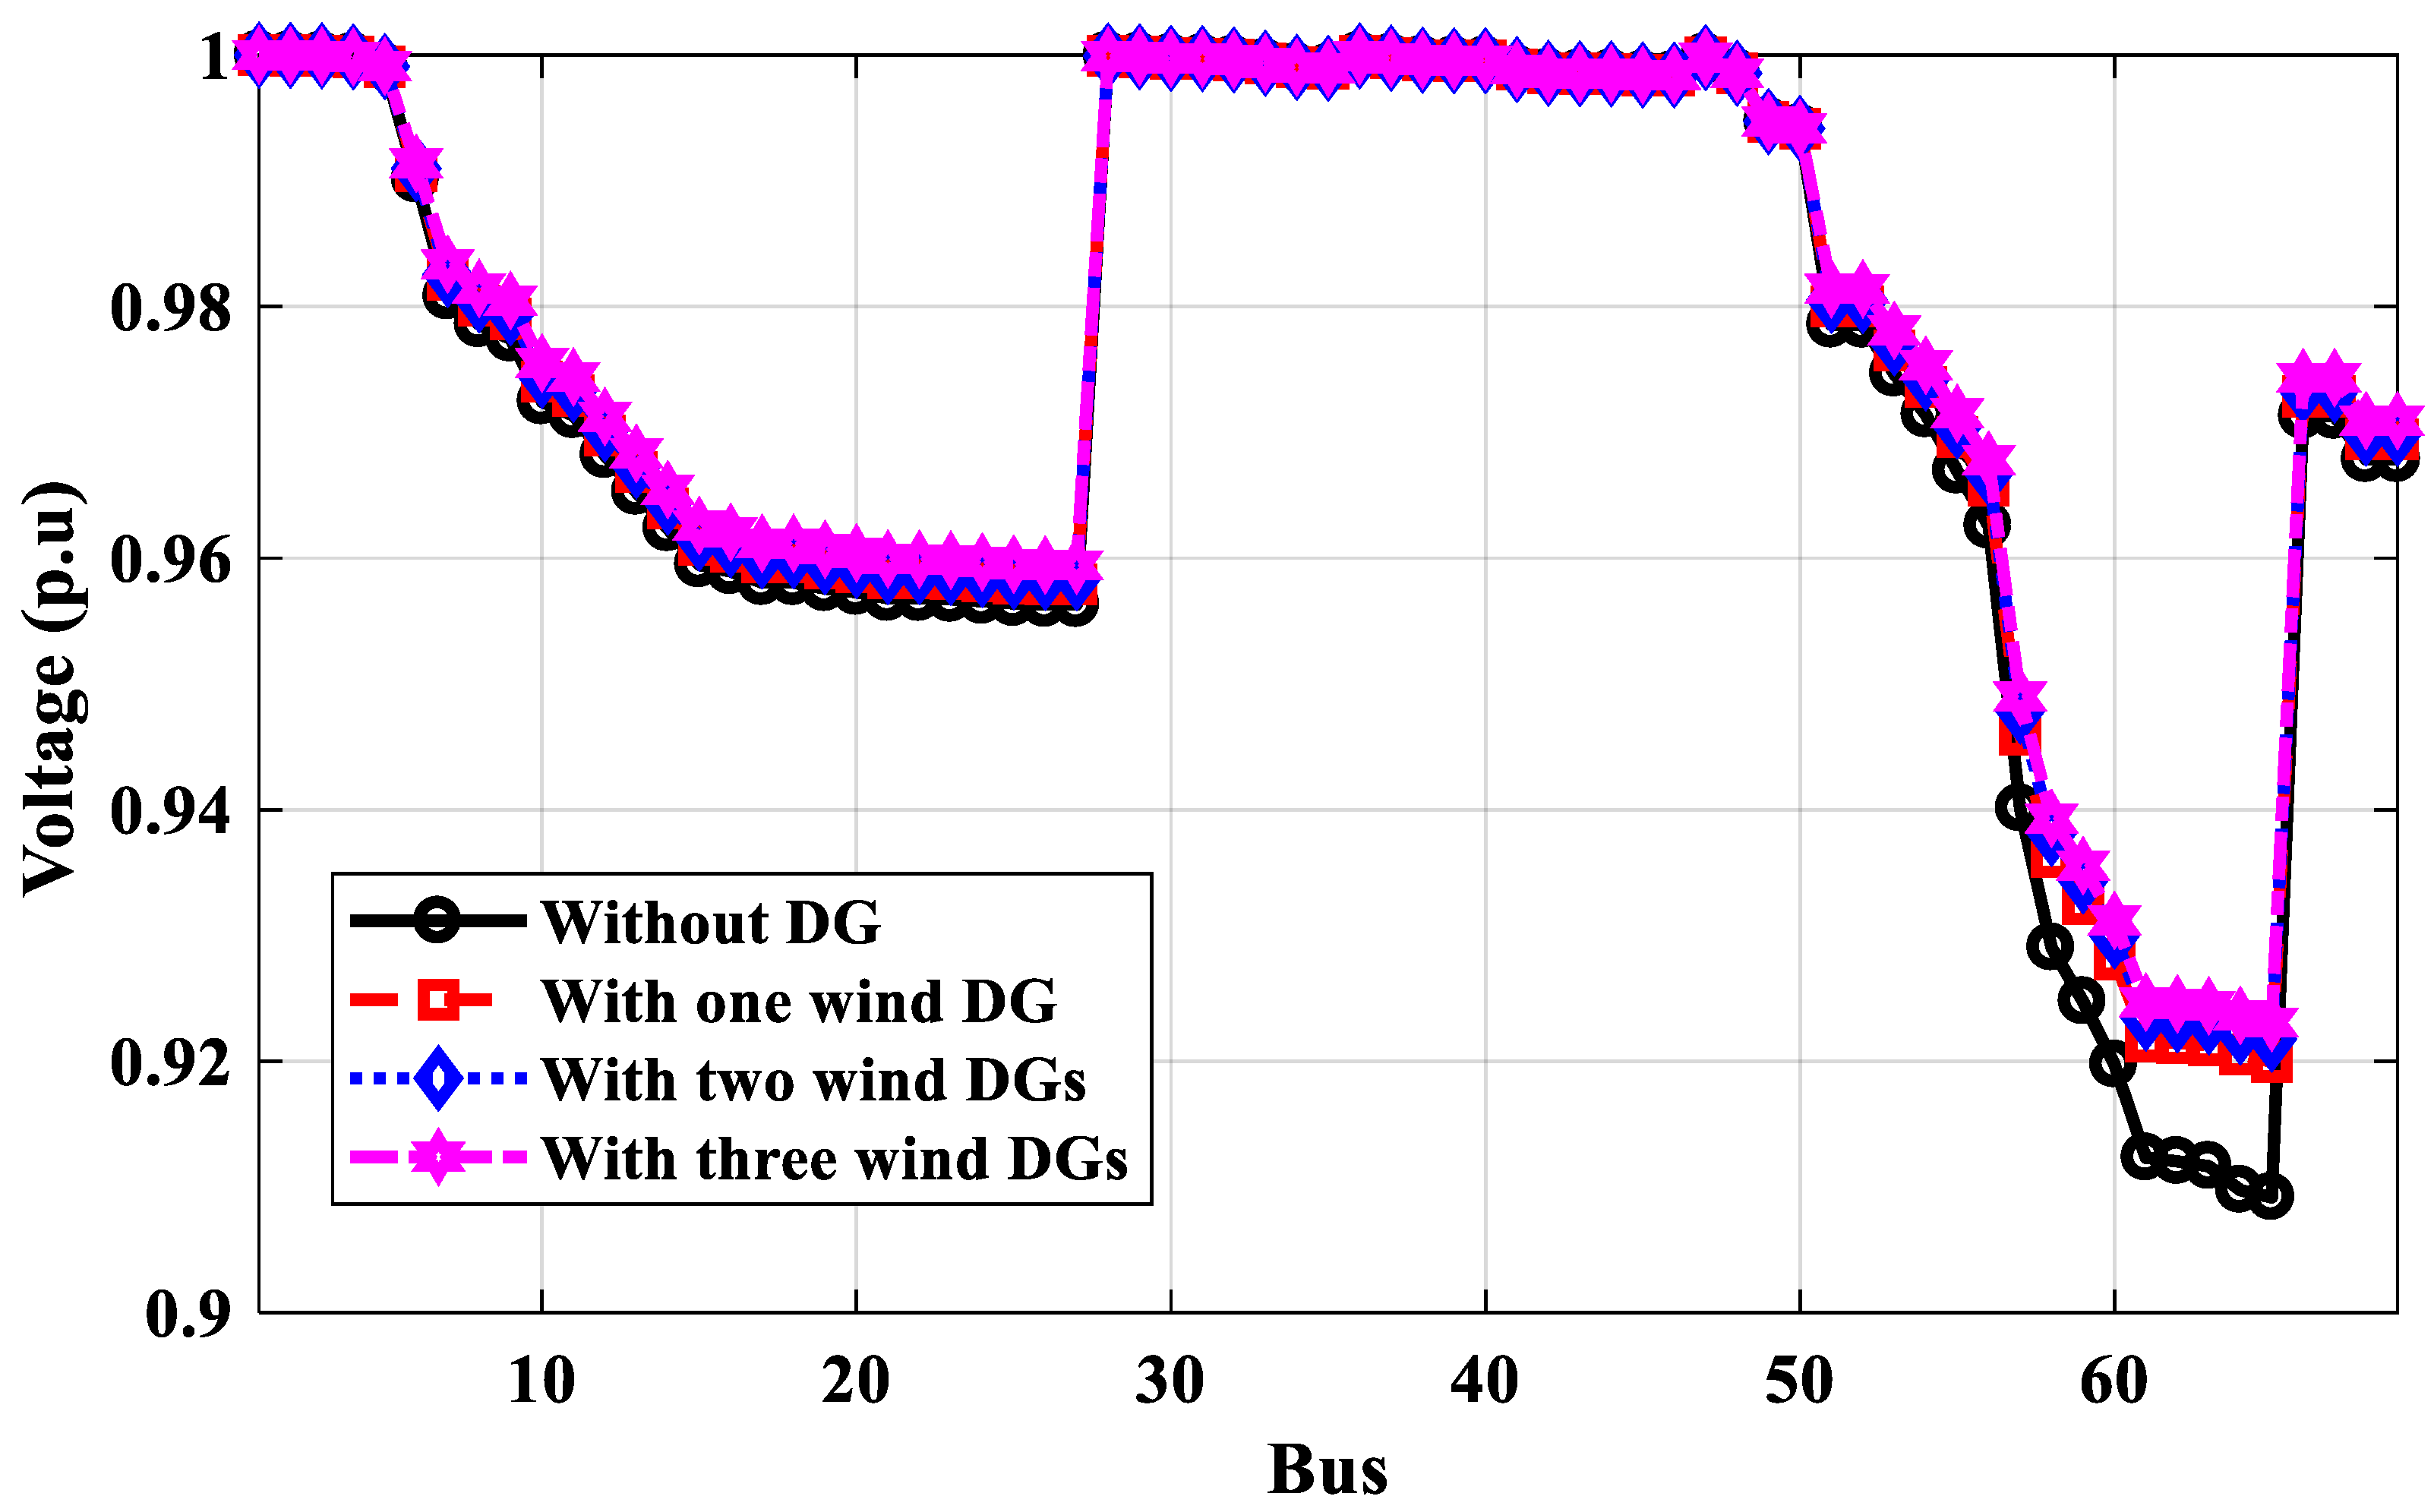
3.2.2. Case 2: IEEE 69-Bus Performance

Matlab code is used to calculate the power flow of the IEEE 69-bus distribution system to test the performance of the system and select the best location of DGs with the number of DGs of one, two, or three for two criteria: power loss and annual energy loss depending on weather conditions. A fair comparison between the proposed method and the previous method. Table 4 shows the results of the proposed algorithm and compares it with previous work. Figure 16 shows the voltage profile of the IEEE 69-bus without and with DGs for power loss calculation. Figure 17 shows the voltage profile of IEEE 69-bus without and with PV system DGs for annual energy loss calculation. Figure 18 shows the voltage profile of IEEE 69-bus without and with wind farm DGs for annual energy loss calculation.
According to Table 4, the optimal locations of one, two, or three DGs for the proposed technique based on power calculation are 61, 61, 17, and 61, 17, 49, respectively, compared to 62, 62, 17, and 61, 17, 9 for the PSO method and 61, 61, 17, and 61, 18, 49 for the GA method based on power calculation. The power loss of the IEEE 69-bus distribution system calculated by the proposed method is less than those values using PSO and GA. As shown in Figure 16, the voltage profile has been improved with more DGs, and the minimum voltage at bus No. 65 is optimized to 0.9879 p.u. The optimal locations of DGs under IEEE 69-bus based on energy calculations are different than the locations based on power calculations and depend on the type of DG PV system or wind system. The optimal locations of PV system DGs are 64, 65, and 56, compared to 64, 57, and 9 for wind system DGs using the proposed method. Table 4 shows that the effective value of the output power of DGs is different than their rates, which depend on the weather conditions. The effective output power of DGs is less than their rates. The proposed technique used these effective values to get the optimal locations considering the weather conditions. The optimal locations of DGs of PV systems or wind systems based on energy calculations are made to improve the voltage profile lower than the voltage profile of their optimal locations based on power calculations because the effective output power is small, as shown in Figure 17 and Figure 18, respectively. The voltage at bus No. 65 has been improved to 0.9231 p.u and the minimum voltage is 0.933 at bus No. 61 for PV system DGs.

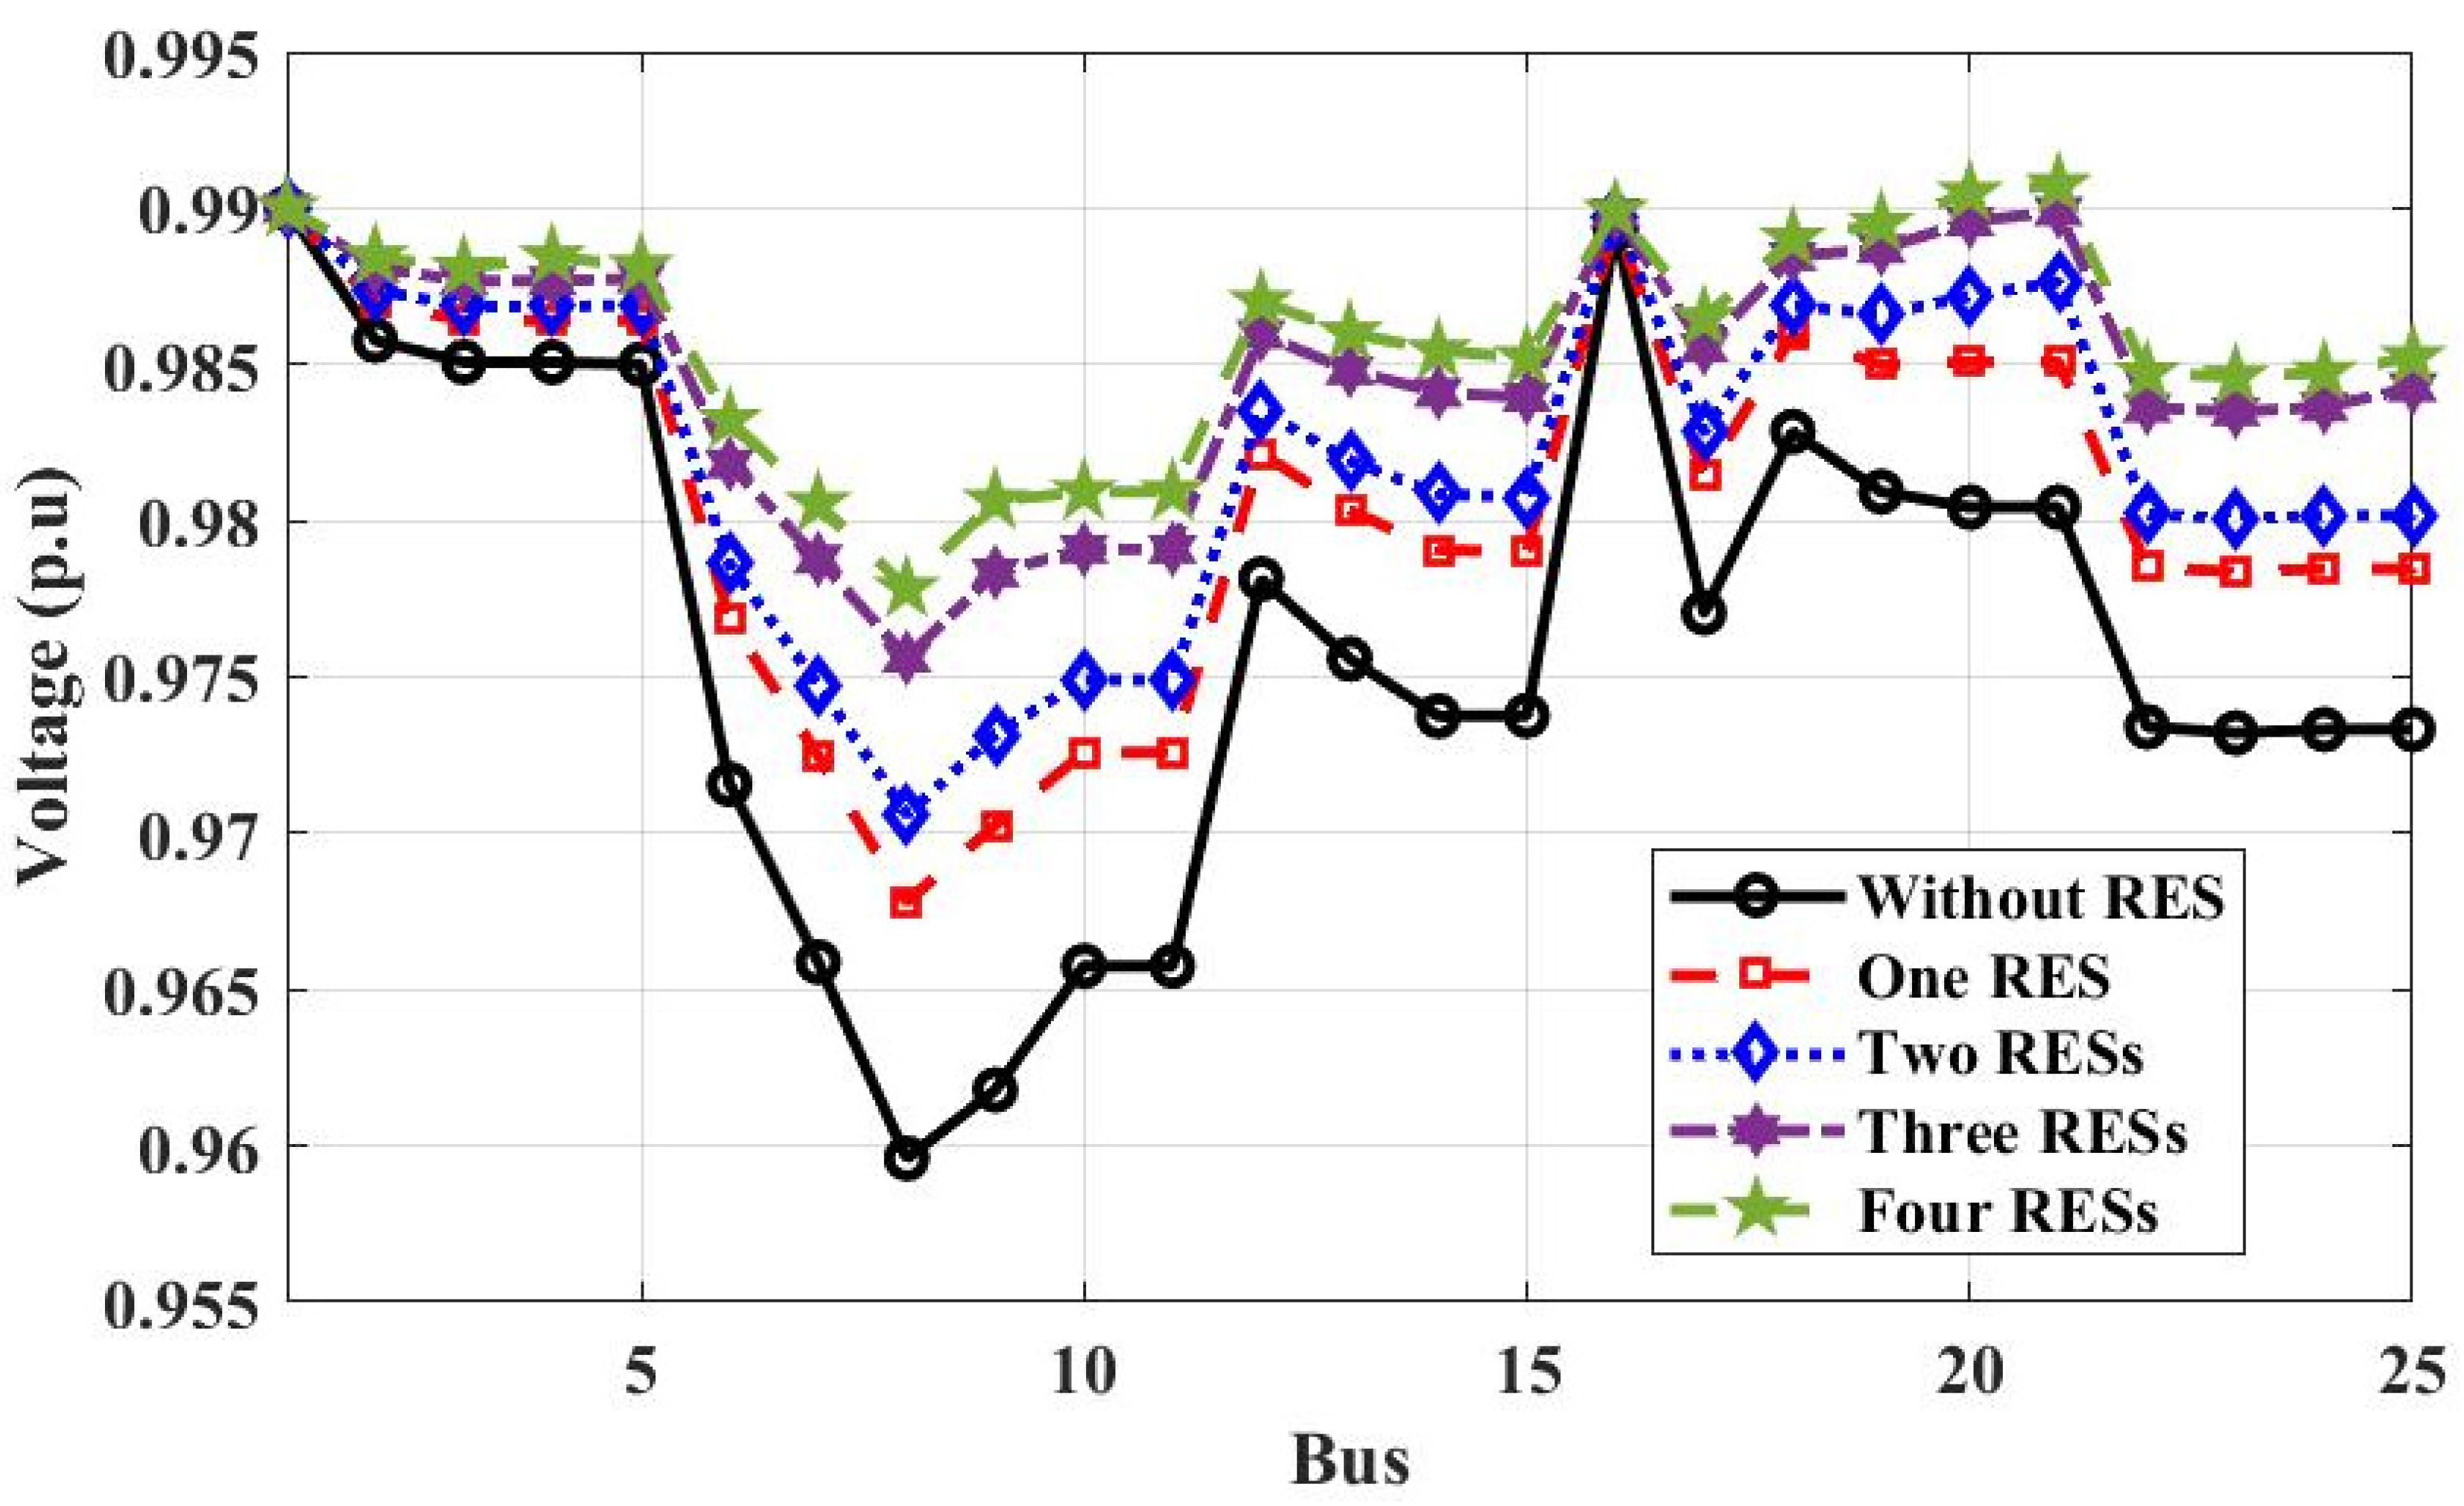
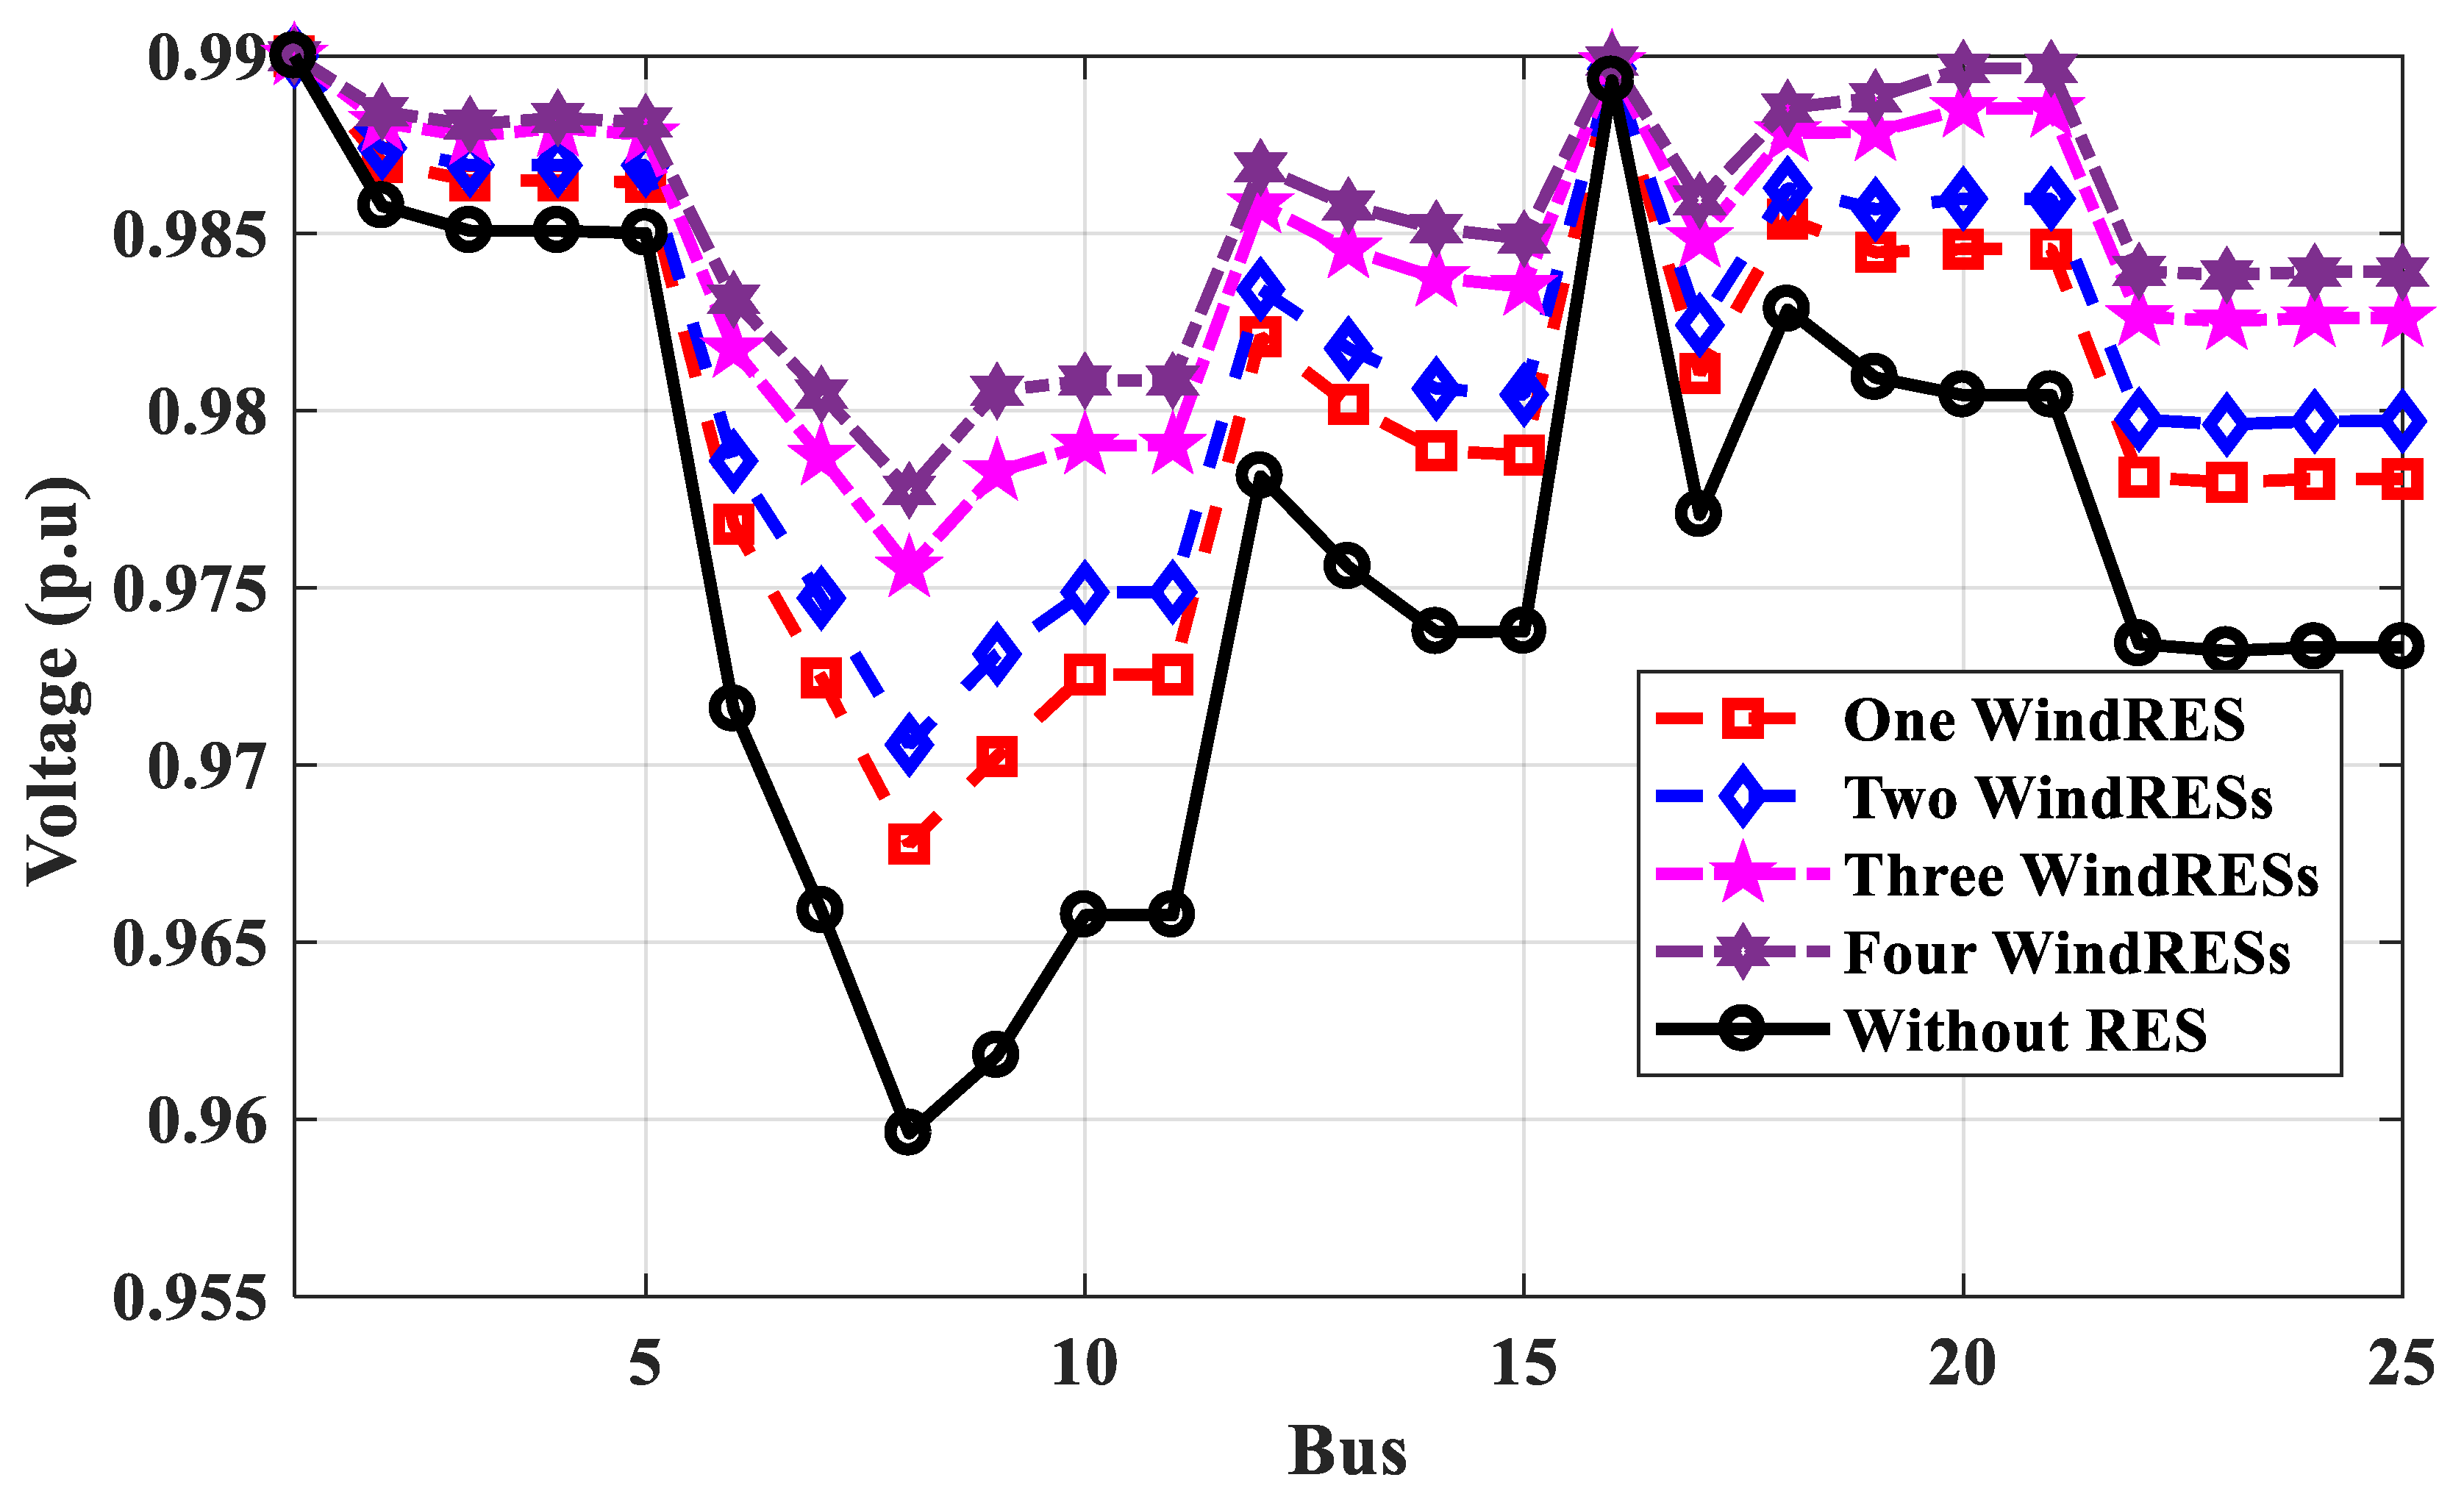
3.2.3. Case 3: The Performance of the Egyptian Power System with Maximum Penetration RES

Matlab code is used to test the stability of the Egyptian power system connected to the number of RESs one, two, three, or four with increasing load to maximum capacity. The load can be increased to 20 years, assuming an annual increase of 7%. The RESs are PV systems or wind farms, and the best buses can be connected. The total rate of RESs is 9 GW. The proposed technique and GA method are used to select the optimal locations of RES based on power calculations. Table 5 depicts the bus connections between PV systems and wind farms. Figure 19 shows the voltage profile of 25-bus 500 kV EPS without and with RESs for power loss calculation. Figure 20 shows the voltage profile of 25-bus 500 kV EPS without and with PV systems for the annual energy loss calculation. Figure 21 shows the voltage profile of 25-bus 500 kV EPS without and with wind systems for the annual energy loss calculation.
Table 5 shows that the optimal locations of RESs are 18, 21, 25, and 4 using the GA method, compared to 2, 16, 5, and 3 using the proposed technique based on power calculation. The power loss of the system calculated by the GA method is less than that calculated using the proposed method. The minimum voltage has been improved to 0.9778 p.u at bus No. 8 for the proposed and GA methods, as shown in Figure 19. The optimal locations of RESs of PV systems or wind farms connected to 25-bus 500 kV EPS based on energy calculation are different from the optimal locations of PV systems and wind farms based on power calculation due to the value of irradiation and wind speed. The optimal locations of PV systems are 16, 3, 2, and 5 distributed on the west and east Nile, eastern desert, and west desert in Egypt, but wind farms are 3, 2, 4, and 16 distributed on the west and east Nile and Suez gulf in Egypt. From Figure 20 and Figure 21, the voltage profile of 25-bus 500 kV EPS is improved, and the minimum voltage at bus No. 8 is 0.9777 p.u.

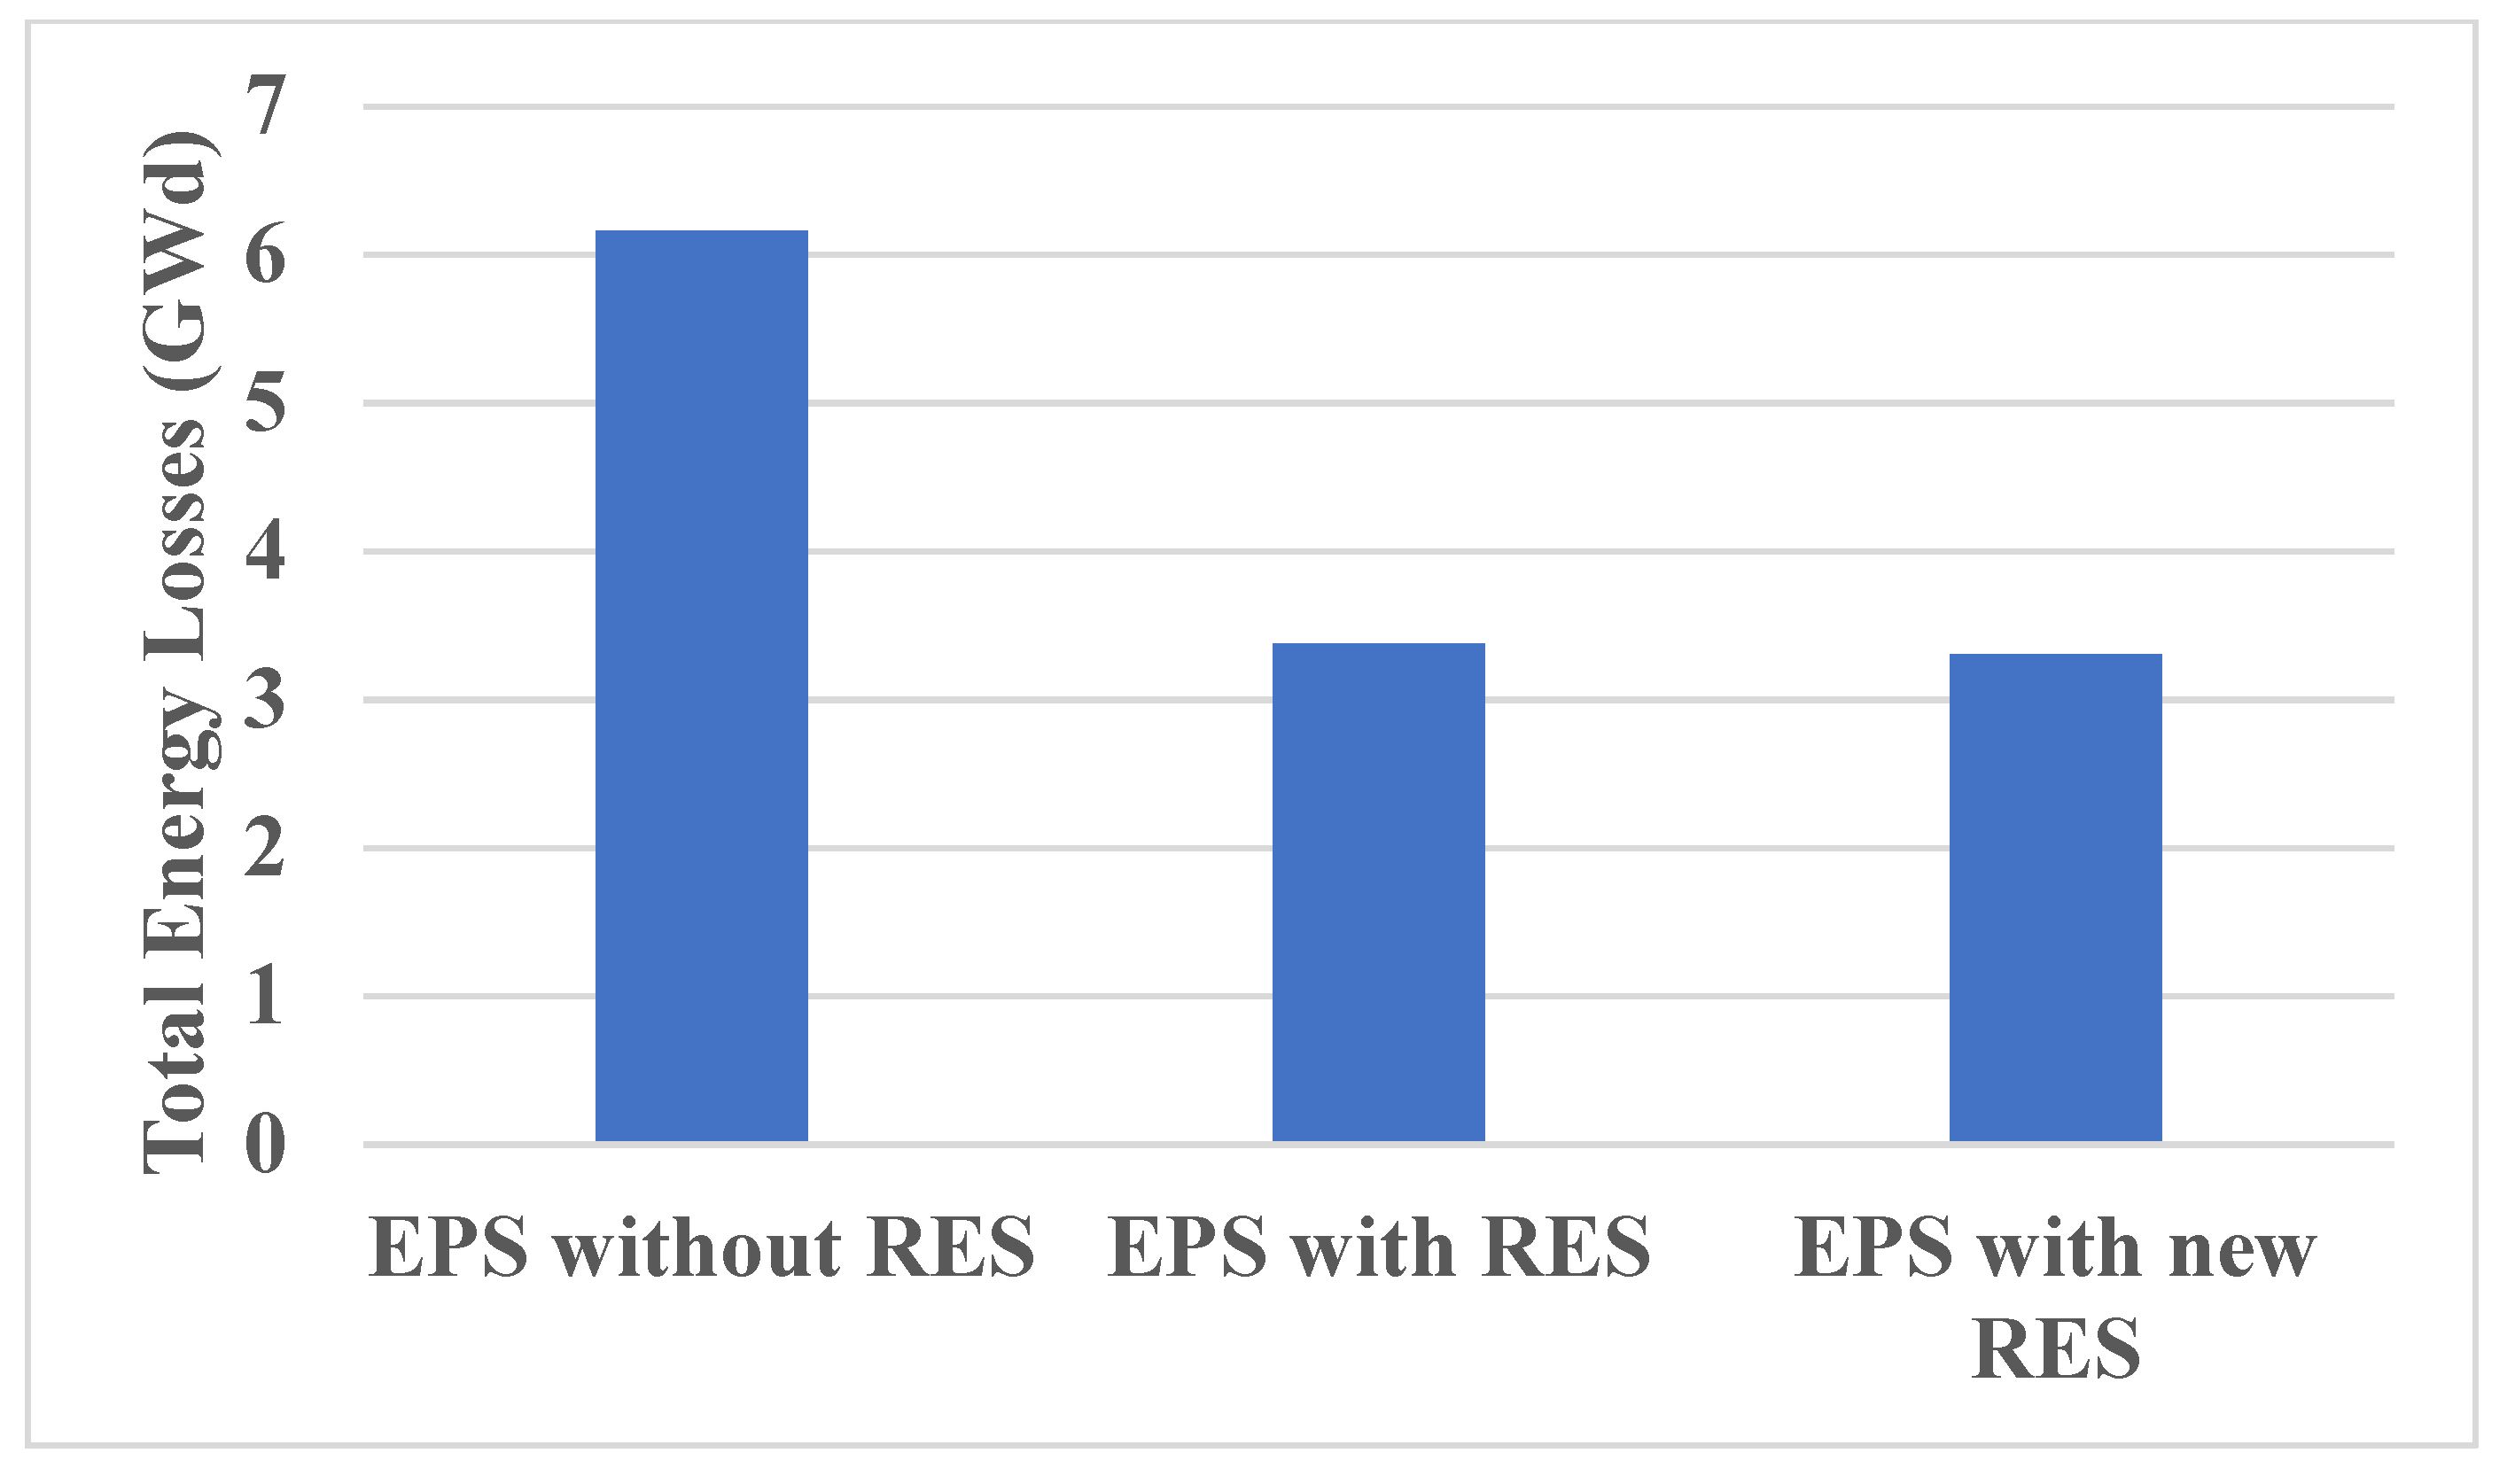
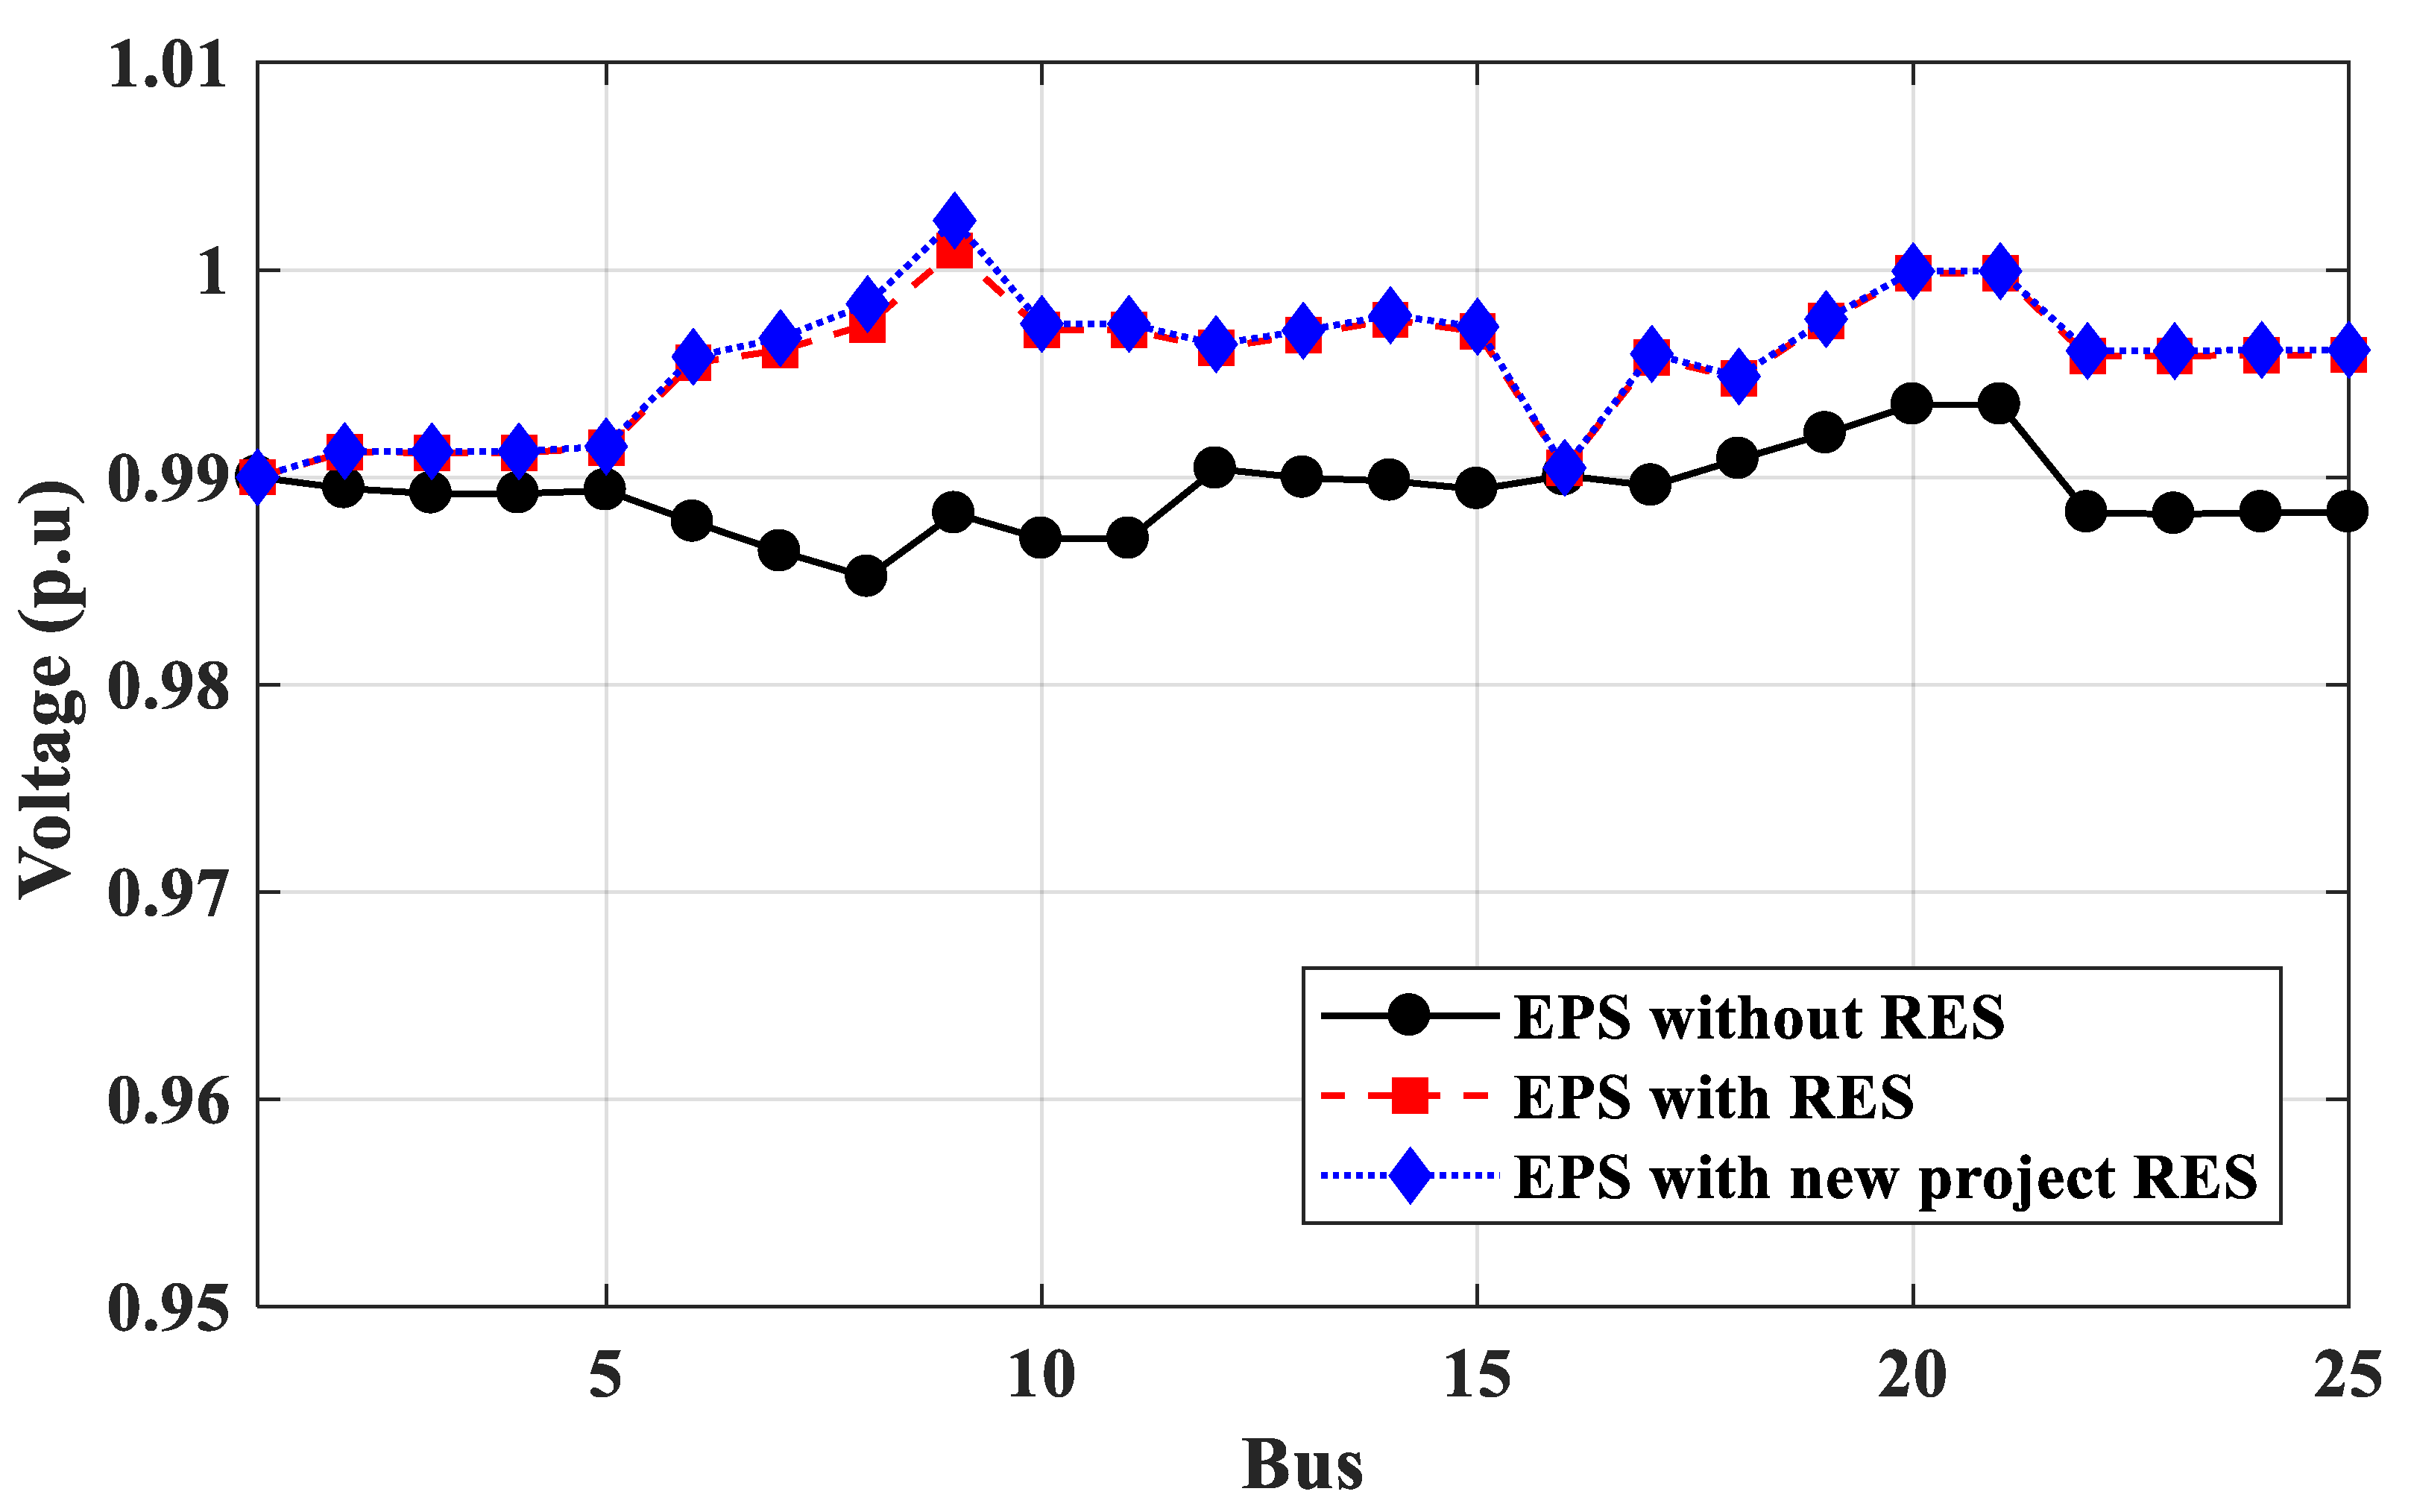
3.2.4. Case 4: Performance of Egyptian Power System with and without RES Projects

Matlab code is used to calculate the power flow of 25-bus 500 kV EPS with and without RES projects. The total annual energy losses and voltage profile are calculated based on the results of electricity consumption. Depending on the 25-bus 500 kV EPS data shown in Table 1, the total average load capacity per day is 32,345.3 MW, and the total average generated capacity per day in 2022 will be 35,652 MW. The results of comparing 25-bus 500 kV EPS without RES, EPS with RES (in operation), and EPS with RES (in operation and under construction) are shown in Figure 22 (total annual energy losses) and Figure 23 (voltage profile). From the results, the performance of 25-bus 500 kV EPS was improved by adding RES since the total energy loss per year when connecting RES to 25-bus 500 kV EPS is reduced by about 47% and the voltage buses improved for the EPS by 0.1 p.u.

4. Conclusions

In this study, the selection of the optimal locations for RESs in the IEEE 33-bus and 69-bus distribution systems, and the realistic 25-bus 500 kV EPS have been investigated using the modified analytical multi-objective technique based on power loss and energy loss calculations and operation stability depending on weather conditions. In conclusion, the results are as follows:
  • The modified multi-objective function was developed for determining the optimal locations of RES buses in IEEE 33-bus and 69-bus distribution systems, as well as the realistic 25-bus 500 kV EPS based on minimum power losses or annual energy losses and the operation stability of the system depending on weather conditions. The proposed technique obtained the optimal locations of the weather-adjusted RES, such as PV systems or wind systems, based on energy calculations, which improved the voltage profile better than those locations based on power calculations, where the effective values of output power have been used to obtain optimal weather-adjusted locations.
  • The proposed technique obtained the optimal locations of the weather-adjusted RES, such as PV systems or wind systems, based on energy calculations, which improved the voltage profile better than those locations based on power calculations by about 2%. Additionally, the annual energy losses decrease by about 7% for one RES to 4% for four RESs, where the effective values of output power have been used to obtain optimal weather-adjusted locations.
  • The optimal locations of DGs selected by the proposed technique are better than those selected by PSO and GA, and the power loss of the system calculated by the proposed method is better than its values using PSO and GA for tested IEEE 33-bus and 69-bus systems. The voltage profile has been improved by about 2% for each bus, and the power losses have decreased from 174 to 45.4 kW for the IEEE 33-bus system and from 225 to 57 kW for the IEEE 69-bus system.
  • The optimal locations of DGs based on energy calculations differ from those based on power calculations and depend on the type of DG (the PV system or the wind system). The effective value of the output power of DG, depending on the weather conditions, differs from its nominal value. The proposed technique used these effective values to obtain the optimal weather-adjusted locations.
  • The performance of 25-bus 500 kV EPS was improved by adding RES; the total energy loss per year has been reduced by about 47%, and the voltage buses of 25-bus 500 kV EPS have been improved by 0.1 p.u.
  • With an increase in the number of PV system projects, the overall energy loss will be decreased by increasing the voltage profile and operation stability of 25-bus 500 kV EPS. However, increasing the number of wind farm projects does not always give good system stability because some regions are characterized by low wind speeds throughout the year.
  • The maximum load capacity obtained using the load ability algorithm can be fed from the 25-bus 500 kV EPS with 9 GW of RESs depending on weather conditions and available areas for the construction of new PV systems and wind farm projects in Egypt. The hydrogen production and industrial loads, as well as the increasing load demand every year due to the development in different regions of Egypt, can be fed.

Author Contributions

Conceptualization, M.A. and V.O.; methodology, M.A., A.E.-S. and A.Y.A.; software, M.A. and V.O.; validation, M.A. and V.O.; formal analysis, M.A.; investigation, M.A., V.O., A.E.-S. and A.Y.A.; resources, M.A., V.O. and A.Y.A. data curation, M.A., V.O. and A.E.-S.; writing—original draft preparation, M.A., V.O., A.E.-S. and A.Y.A.; writing—review and editing, M.A., V.O., A.E.-S. and A.Y.A.; visualization, M.A. and A.Y.A.; supervision, V.O.; project administration, M.A.; funding acquisition, A.E.-S. All authors have read and agreed to the published version of the manuscript.

Funding

This research received no external funding.

Data Availability Statement

Not applicable.

Conflicts of Interest

The authors declare no conflict of interest.

Appendix A

Table A1. Parameters of GA and PSO.
GAPSO
population = 10 and number of iterations = 100population = 50, ω = 1, c1 = 2, c2 = 2 and number of iterations = 100

References

  1. Abdel-Gawad, N.M.; Hamza, A.S.H.; Hassanin, H.M.; Mahmoud, S.A.; El-Debeiky, S. Improving Voltage Profile in the Egyptian National Power System (Enps) Using Simultaneously Three Specific Remedial Actions for Reactive Power Com-pensation. Online J. Power Energy Eng. 2017, 2, 177–187. [Google Scholar]
  2. Kotb, K.M.; Elkadeem, M.R.; Khalil, A.; Imam, S.M.; Hamada, M.A.; Sharshir, S.W.; Dan, A. A fuzzy decision-making model for optimal design of solar, wind, diesel-based RO desalination integrating flow-battery and pumped-hydro storage: Case study in Baltim, Egypt. Energy Convers. Manag. 2021, 235, 113962. [Google Scholar] [CrossRef]
  3. Hemeida, M.G.; Ibrahim, A.A.; Mohamed, A.-A.A.; Alkhalaf, S.; El-Dine, A.M.B. Optimal allocation of distributed generators DG based Manta Ray Foraging Optimization algorithm (MRFO). Ain Shams Eng. J. 2021, 12, 609–619. [Google Scholar] [CrossRef]
  4. Ali, Z.M.; Diaaeldin, I.M.; El-Rafei, A.; Hasanien, H.M.; Aleem, S.H.A.; Abdelaziz, A.Y. A novel distributed generation planning algorithm via graphically-based network reconfiguration and soft open points placement using Archimedes optimization algorithm. Ain Shams Eng. J. 2021, 12, 1923–1941. [Google Scholar] [CrossRef]
  5. Karunarathne, E.; Pasupuleti, J.; Ekanayake, J.; Almeida, D. The Optimal Placement and Sizing of Distributed Generation in an Active Distribution Network with Several Soft Open Points. Energies 2021, 14, 1084. [Google Scholar] [CrossRef]
  6. Alham, M.; Gad, M.F.; Ibrahim, D.K. Potential of wind energy and economic assessment in Egypt considering optimal hub height by equilibrium optimizer. Ain Shams Eng. J. 2023, 14, 101816. [Google Scholar] [CrossRef]
  7. Omara, M.A.; Nassar, I.A. Voltage quality in delta Egypt network and its impact in oil industry. Energy Rep. 2019, 5, 29–36. [Google Scholar] [CrossRef]
  8. Hassan, A.S.; Othman, E.A.; Bendary, F.M.; Ebrahim, M.A. Distribution systems techno-economic performance optimization through renewable energy resources integration. Array 2021, 9, 100050. [Google Scholar] [CrossRef]
  9. Abdalla, O.H.; Abdel Ghany, A.M.; Fayek, H.H. Development of a Digital Model of the Egyptian Power Grid for Steady-State and Transient Studies. In Proceedings of the 11th International Conference on Electrical Engineering ICEENG 2018, Cairo, Egypt, 3–5 April 2018; pp. 1–15. [Google Scholar]
  10. Hassan, A.S.; Younes, A.H.H.; El Saad, M.M.A.; Bendary, F.M. Technical and Economic As-sessment of Integrating DG Resources into a Realistic Egyptian Distribution Network. In Proceedings of the 23rd International Conference on Electricity Distribution Lyon, Lyon, France, 15–18 June 2015; pp. 1–5. [Google Scholar]
  11. El-Ela, A.A.A.; Allam, S.M.; Shehata, N.K. Optimal Allocation of a Hybrid Wind Energy-Fuel Cell System Using Different Optimization Techniques in the Egyptian Distribution Network. Energy Power Eng. 2021, 13, 17–40. [Google Scholar] [CrossRef]
  12. Elsayed, A.M.; Mishref, M.M.; Farrag, S.M. Distribution system performance enhancement (Egyptian distribution system real case study). Int. Trans. Electr. Energy Syst. 2018, 28, e2545. [Google Scholar] [CrossRef]
  13. Molzahn, D.K.; Hiskens, I.A.; Lesieutre, B.C. Calculation of Voltage Stability Margins and Certification of Power Flow Insolvability Using Second-Order Cone Programming. In Proceedings of the 2016 49th Hawaii International Conference on System Sciences (HICSS), Koloa, HI, USA, 5–8 January 2016; pp. 1–10. [Google Scholar] [CrossRef]
  14. Ali, Z.M.; Diaaeldin, I.M.; Aleem, S.H.E.A.; El-Rafei, A.; Abdelaziz, A.Y.; Jurado, F. Scenario-Based Network Reconfiguration and Renewable Energy Resources Integration in Large-Scale Distribution Systems Considering Parameters Uncertainty. Mathematics 2021, 9, 26. [Google Scholar] [CrossRef]
  15. Salem, A.A.; Eldesouky, A.A.; Farahat, A.A.; Abdelsalam, A.A. New Analysis Framework of Lyapunov-Based Stability for Hybrid Wind Farm Equipped With FRT: A Case Study of Egyptian Grid Code. IEEE Access 2021, 9, 80320–80339. [Google Scholar] [CrossRef]
  16. Diaaeldin, I.M.; Aleem, S.H.E.A.; El-Rafei, A.; Abdelaziz, A.Y.; Ćalasan, M. Op-timal Soft Open Points Operation and Distributed Generations Penetration in a Reconfigured Egyptian Distribution Network. In Proceedings of the 25th International Conference on Information Technology (IT), Montenegro, Zabljak, 16–20 February 2021; pp. 1–6. [Google Scholar]
  17. Mobarak, Y.A. Voltage Collapse Prediction for Egyptian Interconnected Electrical Grid EIEG. Int. J. Electr. Eng. Inform. 2015, 7, 79–88. [Google Scholar] [CrossRef]
  18. El Hamed, A.M.A.; Ebeed, M.; Refai, A.; El Sattar, M.A.; Elbaset, A.A.; Ahmed, T.A. Application Of Slime Mould Algorithm For Optimal Allocation Of Datacom And Pv System In Real Egyptian Radial Network. Sohag Eng. J. 2021, 1, 16–24. [Google Scholar] [CrossRef]
  19. Parihar, S.S.; Malik, N. Analysing the impact of optimally allocated solar PV-based DG in harmonics polluted distribution network. Sustain. Energy Technol. Assess. 2022, 49, 101784. [Google Scholar] [CrossRef]
  20. Fayek, H.H.; Abdalla, O.H. Operation of the Egyptian Power Grid with Maximum Penetration Level of Renewable Energies Using Corona Virus Optimization Algorithm. Smart Cities 2022, 5, 34–53. [Google Scholar] [CrossRef]
  21. Sultan, H.M.; Kuznetsov, O.N.; Diab, A.A.Z. Modelling and Performance Evaluation of the Egyptian National Utility Grid Based on Real Data. In Proceedings of the 2018 IEEE Conference of Russian Young Researchers in Electrical and Electronic Engineering (EIConRus), Moscow and St. Petersburg, Russia, 29 January–1 February 2018; pp. 1–6. [Google Scholar]
  22. Remha, S.; Chettih, S.; Arif, S. Optimal DG location and sizing for minimum active power loss in radial distribution system using firefly algorithm. Int. J. Energetica 2017, 2, 6–10. [Google Scholar] [CrossRef]
  23. M’hamdi, B.; Teguar, M.; Tahar, B. Optimal DG Unit Placement and Sizing in Radial Distribution Network for Power Loss Minimization and Voltage Stability Enhancement. Period. Polytech. Electr. Eng. Comput. Sci. 2020, 64, 157–169. [Google Scholar] [CrossRef]
  24. Abd, M.K.; Cheng, S.J.; Sun, H.S. Optimal DG Placement and Sizing for Power Loss Reduction in a Radial Distribution System using MPGSA and Sensitivity Index Method. In Proceedings of the 2016 IEEE 11th Conference on Industrial Electronics and Applications (ICIEA), Hefei, China, 5–7 June 2016; pp. 1579–1585. [Google Scholar]
  25. Al Abri, R.S.; El-Saadany, E.F.; Atwa, Y.M. Optimal Placement and Sizing Method to Improve the Voltage Stability Margin in a Distribution System Using Distributed Generation. IEEE Trans. Power Syst. 2013, 28, 326–334. [Google Scholar] [CrossRef]
  26. Natarajan, M.; Balamurugan, R.; Lakshminarasimman, L. Optimal Placement and Sizing of DGs in the Distribution System for Loss Minimization and Voltage Stability Improvement using CABC. Int. J. Electr. Eng. Inform. 2015, 7, 679–690. [Google Scholar] [CrossRef]
  27. Kazmi, S.A.A.; Shin, D.R. DG Placement in Loop Distribution Network with New Voltage Stability Index and Loss Minimization Condition Based Planning Approach under Load Growth. Energies 2017, 10, 1203. [Google Scholar] [CrossRef]
  28. Memarzadeh, G.; Keynia, F. A newindex-basedmethod for optimalDGplacement in distribution networks. Eng. Rep. 2020, 2, e12243. [Google Scholar] [CrossRef]
  29. Murty, V.; Kumar, A. Optimal placement of DG in radial distribution systems based on new voltage stability index under load growth. Int. J. Electr. Power Energy Syst. 2015, 69, 246–256. [Google Scholar] [CrossRef]
  30. Haider, W.; Hassan, S.; Mehdi, A.; Hussain, A.; Adjayeng, G.; Kim, C.-H. Voltage Profile Enhancement and Loss Minimization Using Optimal Placement and Sizing of Distributed Generation in Reconfigured Network. Machines 2021, 9, 20. [Google Scholar] [CrossRef]
  31. Aryanfar, M. Optimal Dispatchable DG Location and Sizing with an Analytical Method, based on a New Voltage Stability Index. Int. J. Res. Technol. Electr. Ind. 2022, 1, 95–104. [Google Scholar] [CrossRef]
  32. Azad, S.; Amiri, M.M.; Heris, M.N.; Mosallanejad, A.; Ameli, M.T. A Novel Analytical Approach for Optimal Placement and Sizing of Distributed Generations in Radial Electrical Energy Distribution Systems. Sustainability 2021, 13, 10224. [Google Scholar] [CrossRef]
  33. Prakash, P.; Meena, D.C.; Malik, H.; Alotaibi, M.A.; Khan, I.A. A Novel Analytical Approach for Optimal Integration of Renewable Energy Sources in Distribution Systems. Energies 2022, 15, 1341. [Google Scholar] [CrossRef]
  34. Aman, M.; Jasmon, G.; Mokhlis, H.; Bakar, A. Optimal placement and sizing of a DG based on a new power stability index and line losses. Int. J. Electr. Power Energy Syst. 2012, 43, 1296–1304. [Google Scholar] [CrossRef]
  35. Seet, C.C.; Pasupuleti, J.; Khan, M.R.B. Optimal Placement and Sizing of Distributed Generation in Distribution System using Analytical Method. Int. J. Recent Technol. Eng. 2019, 8, 6357–6363. [Google Scholar] [CrossRef]
  36. Shaik, M.A.; Mareddy, P.L.; Visali, N. Enhancement of Voltage Profile in the Distribution system by Reconfiguring with DG placement using Equilibrium Optimizer. Alex. Eng. J. 2022, 61, 4081–4093. [Google Scholar] [CrossRef]
  37. Hassan, A.S.; Sun, Y.; Wang, Z. Multi-objective for optimal placement and sizing DG units in reducing loss of power and enhancing voltage profile using BPSO-SLFA. Energy Rep. 2020, 6, 1581–1589. [Google Scholar] [CrossRef]
  38. Adewuyi, O.B.; Adeagbo, A.P.; Adebayo, I.G.; Howlader, H.O.R.; Sun, Y. Modified Analytical Approach for PV-DGs Integration into a Radial Distribution Network Considering Loss Sensitivity and Voltage Stability. Energies 2021, 14, 7775. [Google Scholar] [CrossRef]
  39. Mohamed, A.E.; Salah, K.; Hussein, A.; Ehab, E.E. A Novel Approach Based on Honey Badger Algorithm for Optimal Allocation of Multiple DG and Capacitor in Radial Distribution Networks Considering Power Loss Sensitivity. Mathematics 2022, 10, 2081. [Google Scholar] [CrossRef]
  40. Lakshmi, G.V.N.; Laxmi, A.J.; Veeramsetty, V.; Salkuti, S.R. Optimal Placement of Distributed Generation Based on Power Quality Improvement Using Self-Adaptive Lévy Flight Jaya Algorithm. Clean Technol. 2022, 4, 1242–1254. [Google Scholar] [CrossRef]
  41. Ntombela, M.; Musasa, K.; Leoaneka, M.C. Power Loss Minimization and Voltage Profile Improvement by System Reconfiguration, DG Sizing, and Placement. Computation 2022, 10, 180. [Google Scholar] [CrossRef]
  42. Lekhuleni, T.; Twala, B. Distributed Optimal Placement Generators in a Medium Voltage Redial Feeder. Symmetry 2022, 14, 1729. [Google Scholar] [CrossRef]
  43. Kumar, P.; Swarnkar, N.K.; Ali, A.; Mahela, O.P.; Khan, B.; Anand, D.; Ballester, J.B. Transmission Network Loss Reduction and Voltage Profile Improvement Using Network Restructuring and Optimal DG Placement. Sustainability 2023, 15, 976. [Google Scholar] [CrossRef]
  44. Bhumkittipich, K.; Phuangpornpitak, W. Optimal Placement and Sizing of Distributed Generation for Power Loss Reduction Using Particle Swarm Optimization. Energy Procedia 2013, 34, 307–317. [Google Scholar] [CrossRef]
  45. Chandel, A.; Chauhan, D.; Singh, D. Enriched Technique for DG Placement and Sizing by GA Optimization. Am. Eurasian J. Sci. Res. 2017, 12, 260–270. [Google Scholar] [CrossRef]
  46. Sellami, R.; Sher, F.; Neji, R. An improved MOPSO algorithm for optimal sizing & placement of distributed generation: A case study of the Tunisian offshore distribution network (ASHTART). Energy Rep. 2022, 8, 6960–6975. [Google Scholar] [CrossRef]
  47. Duong, M.Q.; Pham, T.D.; Nguyen, T.T.; Doan, A.T.; Van Tran, H. Determination of Optimal Location and Sizing of Solar Photovoltaic Distribution Generation Units in Radial Distribution Systems. Energies 2019, 12, 174. [Google Scholar] [CrossRef]
Figure 1. High-penetration PV system connected to the Power system.
Mathematics 11 00958 g001
Figure 2. High-penetration wind farm system connected to Power system.
Mathematics 11 00958 g002
Figure 3. Two-bus system.
Mathematics 11 00958 g003
Figure 4. The flowchart of selecting the bus of RES.
Mathematics 11 00958 g004
Figure 5. IEEE 33-bus distribution system.
Mathematics 11 00958 g005
Figure 6. IEEE 69-bus distribution system.
Mathematics 11 00958 g006
Figure 7. Single line diagram of the 25-bus 500 kV Egyptian power system.
Mathematics 11 00958 g007
Figure 8. Daily irradiation value per year.
Mathematics 11 00958 g008
Figure 9. Daily wind speed value per year.
Mathematics 11 00958 g009
Figure 10. The plan of installed, under construction & under-development solar and wind projects.
Mathematics 11 00958 g010
Figure 11. The global horizontal irradiation over the country of Egypt.
Mathematics 11 00958 g011
Figure 12. Wind Atlas of Egypt.
Mathematics 11 00958 g012
Figure 13. Voltage profile of IEEE 33-bus without and with DGs for power loss calculation.
Mathematics 11 00958 g013
Figure 14. Voltage profile of IEEE 33-bus without and with PV system DGs for annual energy loss calculation.
Mathematics 11 00958 g014
Figure 15. Voltage profile of IEEE 33-bus without and with wind farm DGs for annual energy loss calculation.
Mathematics 11 00958 g015
Figure 16. Voltage profile of IEEE 69-bus without and with DGs for power loss calculation.
Mathematics 11 00958 g016
Figure 17. Voltage profile of IEEE 69-bus without and with PV system DGs for annual energy loss calculation.
Mathematics 11 00958 g017
Figure 18. Voltage profile of IEEE 69-bus without and with wind farm DGs for annual energy loss calculation.
Mathematics 11 00958 g018
Figure 19. Voltage profile of 25-bus 500 kV EPS without and with RESs for power loss calculation.
Mathematics 11 00958 g019
Figure 20. Voltage profile of 25-bus 500 kV EPS without and with PV systems for annual energy loss calculation.
Mathematics 11 00958 g020
Figure 21. Voltage profile of 25-bus 500 kV EPS without and with wind systems for annual energy loss calculation.
Mathematics 11 00958 g021
Figure 22. Total annual energy losses.
Mathematics 11 00958 g022
Figure 23. Voltage profile of EPS.
Mathematics 11 00958 g023
Table 1. The 500 kV Egyptian power system data in 2022.
No.NamePgQgPLQL
1West Cairo56162718380.8184.4
2Cairo17208321853.3897.4
3Nobaria20489914038.31955.3
4S krir0000
5Giza393119034038.31955.3
6Samalout00699.4338.6
7Assiut314138440213
8Nag-hammady0021621046.8
9High damn1720832431.8209.1
10Beniswif393119035310.62571.4
11Magaga0000
12Kurimat39311903772.5374
13Tebeen00541.7262.3
14Assemaa393119033841.31860
15Sokhna10655151810.7876.7
16Bassos0039.419.1
17Abo zabaal00101.849.3
18K zaiat122959500
19Abo kir12295951329.7643.8
20Borolos393119032462.41192.3
21ETAY0000
22Suez00515.4249.6
23Suez th5322571165.5564.3
24Ein Mousa524254410.4198.7
25Taba0000
Total35,65217,24232,345.315,661.6
Table 2. New PV projects in Egypt.
ProjectSizeContract
Kom Ombo200 MWBOO SCHEME
West Nile600 MWSky power and EETC
BOO
West Nile200 MWEETC
BOO
West Nile600 MWBOO scheme
FIT50 MWEETC
PPA
FIT1415 MWEETC
PPA
Hurghada20 MWNREA-JICA
EPC scheme
Zaafarana50 MWNREA-AFD
EPC scheme
Kom ombo26 MWNREA-AFD
EPC scheme
Kom ombo50 MWNREA-AFD
EPC scheme
Table 3. The results of the proposed algorithm and compared with previous work.
CaseProposed MethodPrevious Work
Based on PowerBased on EnergyBased on Power
Buses
No.
DG Size (MW)Losses
(kW)
Min VoltageBuses
No.
DG SizeLossesMin
Voltage
Ref. [46]Ref. [47]
Without DG--1740.9082@18----PSOGA
One PVDG62.558.20.9555@1817Prate = 2.5
Pavg = 0.6765
E = 49,275 (kWd)
Pavg = 135 kW/d
0.9436@3366
Two PVDGs6, 241.8, 0.9500.9553@1817, 33Prate: 1.8, 0.9
Pav: 0.6224, 0.4010
E = 47,815
P = 131
0.9768@2512, 306, 15
Three PVDGs6, 24, 191.15, 0.9, 0.545.40.9556@1817, 33, 22Prate: 1.1, 1.09, 0.5
Pav: 0.2977, 0.2914, 0.0802
E = 20,075
P = 55
0.9977@259, 24, 3014, 24, 28
One wind DG 14Prate = 2.5
Pav = 1.2936
E = 46,720
Pav = 128 kW/d
0.9462@33
Two wind DGs 14, 7Prate: 1.8, 0.9
Pav: 1.3634, 0.6817
E = 38,325
Pav = 105
0.9654@33
Three wind DGs 14, 7, 33Prate:1.1, 1.05, 0.5
Pav: 0.8332, 0.8256, 0.3488
E = 34,675
Pav = 95
0.9798@25
Table 4. The results of the proposed algorithm and compared with previous work.
CaseProposed MethodPrevious Work
Based on PowerBased on EnergyRef. [46]Ref. [47]
Buses
No.
DG Size (MW)Losses
(kW)
Min VoltageBuses
No.
DG SizeLossesMin Voltage
Without DG--2250.9092@65----PSOGA
One PVDG611.861000.9704@2764Prate: 1.86
Pav: 0.4957
E = 65,700
Pav = 180
0.9262@656261
Two PVDGs61, 171.8, 0.7680.9879@6564, 65Prate: 1.8, 0.7
Pav: 0.4797, 0.1866
E = 57,670
Pav = 158
0.9318@61 62, 1761, 17
Three PVDGs61, 17, 491.8, 0.7, 0.5570.9879@6564, 65, 56Prate: 1.8, 0.7, 0.5
Pav: 0.4797, 0.1866, 0.1333
E = 55,845
Pav = 153
0.9330@6161, 17, 961, 18, 49
One wind DG 64Prate: 1.86
Pav: 0.6142
E = 69,350
Pav = 190
0.9200@65
Two wind DGs 64, 57Prate: 1.8, 0.7
Pav: 0.6142, 0.2311
E = 66,795
Pav = 183
0.9218@65
Three wind DGs 64, 57, 9Prate: 1.8, 0.7, 0.5
Pav: 0.6142, 0.2311, 0.3787
E = 64,605
Pav = 177
0.9231@65
Table 5. PV systems and wind farms buses connection.
CaseProposed MethodGA
Based on PowerBased on Energy
Buses
No.
RES Size (MW)Losses
(MW)
Min VoltageBuses
No.
RES SizeLossesMin VoltageBuses
No.
Losses
(MW)
Min Voltage
Without RES--195.510.9596@8-----195.510.9596@8
One PVRES29000127.50.9678@816Pr: 9000
Pav: 2435.5
E = 42,969
Pav = 118
0.9677@818123.80.9678@8
Two PVRESs2, 164500, 450099.10.9706@816, 3Pr: 4500, 4500
Pav: 1218, 1248
E = 34,022
Pav = 93
0.9705@818
21
95.10.9706@8
Three PVRESs2, 16, 53000, 3000, 300061.50.9756@816, 3, 2Pr: 3000, 3000, 3000
Pav: 812, 832, 832
E = 21,530
Pav = 59
0.9755@818
21
25
580.9756@8
Four PVRESs2, 16, 5, 32250,
2250,
2250,
2250
470.9778@816, 3, 2, 5Pr: 2250, 2250, 2250, 2250
Pav: 609, 624, 624, 624
E = 16,874
Pav = 46
0.9777@84
25
18
21
450.9778@8
one wind RES 3Pr: 9000
Pav: 3501
E = 42,410
Pav = 116
0.9678@8
Two wind RESs 3, 2Pr: 4500, 4500
Pav: 1751, 1751
E = 33,706
Pav = 92
0.9706@8
Three wind RESs 3, 2, 4Pr: 3000, 3000, 3000
Pav:1167, 1167, 1167
E = 21,414
Pav = 59
0.9755@8
Four wind RESs 3, 2, 4, 16Pr: 2250, 2250, 2250, 2250
Pav: 875, 875, 875, 1704
E = 17,171
Pav = 47
0.9777@8
Disclaimer/Publisher’s Note: The statements, opinions and data contained in all publications are solely those of the individual author(s) and contributor(s) and not of MDPI and/or the editor(s). MDPI and/or the editor(s) disclaim responsibility for any injury to people or property resulting from any ideas, methods, instructions or products referred to in the content.

