Abstract
This study investigates the effectiveness of six of the key international indices in estimating Saudi financial market (TADAWUL) index (TASI) movement. To investigate the relationship between TASI and other variables, six equations were built using two independent variables of time and international index, while TASI was the dependent variable. Linear, logarithmic, quadratic, cubic, power, and exponential equations were separately used to achieve the targeted results. The results reveal that power equation is the best equation for forecasting the TASI index with a low error rate and high determination coefficient. Additionally, findings of the AutoRegressive Integrated Moving Average (ARIMA) model represent the most important variables to use in order to build a prediction model that can estimate the TASI index. The ARIMA model (with Expert Modeler) coefficients are described as ARIMA (0,1,14). The results show that the SP500, NIKKEI, CAC40, and HSI indices are the most suitable variables for estimating TASI with an R2 and RMSE equal to 0.993 and 113, respectively. This relationship can be used on the previous day to estimate the opening price of TASI based on the closing prices of international indices.
Keywords:
stock market index; regression model; linear; power; logarithmic; cubic and quadratic; ARIMA; TASI 1. Introduction
In recent decades, innovation expression has taken special importance in all fields. Innovations facilitate the emergence of globalized markets, where every participant has the advantage of being connected regardless of distance, and the world comes together in a way commonly described as a small village. This contemporary village requires its participants to acquire the innovation and competitive advantages once they have both the ability and desire to converge distances between them; otherwise, survival could be imaginary. Hereafter, innovation has a concentrated share of organizational structure, company existence, and sustainability [1].
According to Chesbrough [2], the open innovation (OI) concept can be defined as exchanging ideas, knowledge, expertise, and technologies through inflows and outflows of communications that will shape a competitive advantage and lead to high performance. Adapting an open innovation technique may positively affect sales, cost reductions, and market advantages [3] as well as firm stock values [4]. Additionally, Huang and Chou [5] used Tobin’s Q to measure the effect of open innovation (OI) on the performance of technological manufacturing firms. Moreover, Szutowski [6] covered 398 open innovation announcements, released by European service companies, and found significant positive effects of OI disclosure on enterprise market values.
The circulation of OI, complex adaptive systems, and evolutionary change dynamics all together give the definition of OI based on a micro level [7]. On the other hand, closed, opened, and social open innovations are the main components of OI once macrodynamics are taken into consideration [8,9]. Strengthening OI macrodynamics enhances the performance of entrepreneurs worldwide, which will support any coming industrial revolution [10]. Yun and Liu [1] found that the interaction of both knowledge sharing and resources may come with realizable sustainability that will last for the long run with a positive effect on the economy, the environment, and society, and this is the ultimate goal of applying macro- and microdynamics of OI with the quadruple helix model (QH) model.
The quadruple helix model (QH) comes as an improvement and extension to the triple helix model by adding the dimension of civil society, in which it is the interaction between governments, industries, and universities that bring about a more sustainable and creative climate [11]. OI and social innovation become widely globalized at the economy level, letting leading companies lock down traditional innovation and move quickly toward open innovation, in which new markets have been pursued. While the triple helix serves developed countries efficiently, adding the fourth dimension of the link to society would work for both developed and emerging countries [1]. As all real and financial markets are interrelated, the idea of estimating one financial market index using other financial market indices can be logically accepted.
It is not an easy mission to make a proper estimate of stock indices. The reasons are that the interactions of multi-factors walk in line and across each other, which makes the goal of reaching a proper estimate truly challenging. Market economic factors, interaction between stock markets, and international variables are some instances of these concerned factors [12]. Unsurprisingly, specific movements of market indices may influence investors to buy, sell, or hold, especially if these occurrences take place at the right time. Therefore, an accurate estimation of the coming index movement may help investors to perform better while taking the right investment decision [13,14,15,16,17,18].
Several researchers have focused on using different input variables (i.e., day, month, year, trading volume, etc.) to study their power of estimation on the stock market index [19,20,21,22,23,24,25]. Other scholars have investigated the effect of different parameters on market indices and stock returns. Ryu [26], who found strong evidence that the product market competition has a negative effect on a stock returns, had taken into consideration the US–Korea Free trade agreement. Additionally, some academics studied the effect of specific events on market returns, such as Dichtl and Drobetz [27], who found that Halloween has no effect on stock market movements of different countries (i.e., United States, Europe, Germany, France, and the United Kingdom).
Fang, Gozgor, Lau, et al. [28] argued that investor sentiments (such as the Baidu index) could enhance stock market forecasting in China. Others focused on the role of publicly disclosed information, such as Heston and Sinha [29], who used a neural network for 900,000 news stories to investigate their effects on predicting stock index returns. The results found that daily news could be used to predict up to a maximum of 2 days ahead, where weekly news can hold a periodic prediction power. Moreover, social media information could affect the stock market index, as shown in [30,31].
Authors have demonstrated the ability of using social media tweets to affect stock market index movements. It is important to mention that Hirshleifer and Shumway [32] and Corby, Machado, and Fox [33] took the climate factor under consideration to estimate the stock market index and found a strong relationship between weather conditions (i.e., sunny, windy, or raining) and stock market index prediction. Few scholars were successful in examining the relationship between one index and other indices and then forecasting the movement of this index [34]. Other researchers have tried to estimate the relationship between a group of indices, such as Kapar, Olmo, and Ghalayini [35], who investigated the financial integration between three stock indices (i.e., Dubai, Abu Dhabi, and the FTSE NASDAQ Dubai UAE 20 index) among the United Arab Emirates stock markets by using a vector error correction and permanent–transitory decomposition. The results revealed that UAE stock markets are integrated, so any shock to any market would have a strong effect on the other considered markets.
While the majority of the previously concerned published papers depend on macroeconomic factors (i.e., time, weather, etc.). However, few studies have discussed the relationship between international indices and the national stock market index [34,36]. Thus, the goal of this paper is to enrich the field of estimating Saudi stock market index based on specific international indices.
Dai and Zhou [37] developed a new stock returns prediction model by combining sum-of-the-parts (SOP) method and three economic constraint methods, namely non-negative economic constraint strategy, momentum of return prediction strategy, and three-sigma strategy. The results showed that the model is robust and efficient. Moreover, to add realistic assumptions to the current stock, such as transaction costs, liquidity issues, and bid and spread basis, Meng and Khushi [38] suggested using a reinforcement learning model in financial markets to enhance the current models in the field. Moreover, optimization algorithms are used with artificial intelligent prediction models to improve the efficiency of the predications in addition to enhancing the computation complexity [39,40]. Moreover, many methods in the literature suggested using different models to improve the prediction model of financial markets, namely neural network [41] and Markov chain [42] in addition to evaluating different machine learning models as discussed in [43].
To the authors’ best knowledge, this is the first article to estimate the movement of the Saudi financial market (TADAWUL) index, commonly known as (TASI), by investigating the movements of selected key international indices. The main contributions of this paper are (i) an investigation of the relationship between six international stock indices (i.e., CAC40, DAX, NASDAQ, SP 500, NIKKEI 225, and HSI) and (TASI); (ii) determination of the effect of each international index on (TASI) using linear, logarithmic, quadratic, cubic, power, and exponential equations; and (iii) selection of the optimal equation that can efficiently describe the estimation of the Tadawul index (TASI).
The remainder of the paper is structured as follows. Section 2 describes the International Stock Indices. Section 3 discusses data collection and analysis. The research methodology of equation estimation models is shown in Section 4 whereas the results that go along with analysis are explained in Section 5. Finally, Section 6 discusses the conclusions.
2. Innovations of Tadawul and International Markets
Saudi Arabia is taking important and clear steps in developing outstanding innovation techniques. Innovation capacity and competitiveness could be easily built among Saudi different sectors regardless of the many surrounding obstacles they may face. Accessing Search Results
Web result with site links World Trade Organization (WTO) in 2005 placed Saudi Arabia positively in the global competition for getting into new markets [44].
National innovation ecosystems come as a necessity for Saudi Arabia to present a unique competitive advantage while competing with other post-industrial countries such as India and UAE. Achieving its near vision of leading science and technology, Saudi Arabia has taken serious steps in launching a full setup that will positively support people and equipment in addition to strategies and organizations in order to profoundly grow in the long run [44].
In comparison to the developed part of the world, Saudi organizations show worthy practices that are expected to shape the way for new innovations. In 2017, the capital market authority (CMA) announced the establishment of the financial tech experimental permit (FinTech ExPermit) which will provide new financing methods for investors through creating an equity crowd funding platform. In addition, Tadawul and NASDAQ have officially signed an agreement to transfer the technology of post-trading infrastructure, which is expected to take place in the second half of 2020. Moreover, e-voting and crowdfunding systems are going to be used in several financial markets all over the world and will deploy block chain innovation.
3. Tadawul Index (TASI) and International Indices
The Saudi stock exchange or Tadawul was established in March 2007 as the sole entity authorized in Kingdom of Saudi Arabia for stock trading. The Tadawul All Share Index (TASI) is the major stock market index which tracks the performance of all companies traded on Tadawul.
In fact, few scholars have discussed how to predict the Tadawul index (TASI) using some specific factors [12,45,46,47]. Alsufyani and Sarmidi [48] found there is no relation between commodity energy price and TASI volatility. Some researchers have investigated other indices in the prediction of TASI, and Mohammed, Abdalhafid, and Ahmed [34] studied the relationship between TASI and US stock market indices (S&P500 and Dow Jones) and found a relationship between Tadawul Market and US markets over the long run. In addition, Tissaoui and Azibi [36] studied the predictability of Tadawul index and international indices and found that US volatility risk indices are dominant in forecasting the Saudi stock exchange. Moreover, researchers investigated the relationship between international indices and different variables, including the clean energy index [49] and skew phenomenon [50].
Moving to international indices, different countries have different general indices based on the strength of the market, for example, USA has three most popular stock indices including Dow Jones, S&P 500, and NASDAQ Composite. The stock market indices can be classified into many types based on the used criteria, whether global (i.e., S&P Global 100, MSCI World, etc.) or local (i.e., Tadawul index, Amman Exchange index, etc.). All global stock indices shared the same characteristics, for example, market indices describe a portfolio of investment holdings and follow the movement of the market segments. All stock market indices share the same methodology for constructing individual indices, since all calculations are considered based on weighted average mathematics.
In this study, only the most important indices from different countries, namely France, Germany, USA, Japan, Hong Kong, and Saudi Arabia, are taken into consideration. These indices will be employed to investigate the ability of estimating the movement of TASI in addition to using year, month, and day variables to show if the estimation of TASI index is possible or not. The selected indices used in this research are shown in Table 1.

Table 1.
The description of international stock market indices used.
4. Research Methodology
This section is dedicated to presenting the paper’s methodology and is divided into three main parts. The first describes data samples. The second defines the equations used and the third presents the methodology used to estimate Tadawul index (TASI) movement.
4.1. Data Collection and Analysis
In this study, the trading of the international indices (i.e., NASDAQ, SP500, NIKKEI, CAC40, DAX, and HSI) were collected from Yahoo Finance, while Tadawul index (TASI) information was collected from investing.com. After collecting the concerned data, a merging process has been applied on daily, monthly, and yearly basis. This merging ensures that the index values have been matched by day criterion since different countries have different working days (i.e., Saudi Arabia working days start on Sundays). After that, the statistical descriptions have been calculated as shown in Table 2. As presented in Table 2, a statistical description for the international indices covers the period from 2008 to 2019 to ensure that the relationship between TASI index and international stock indices (if any) does not occur by chance.
Table 2.
Statistical description of international stock market indices.
These indices are adopted in this research after considering the main stocks that have an effect on TASI. According to Saudi trade balance, the top export destinations of Saudi Arabia are China (HSI considered as one of financial markets that is linked to China in a way or another), Japan, USA, Germany, and France.
4.2. Equations
As mentioned earlier, different equations have been explored to estimate Tadawul index (TASI) (i.e., linear, logarithmic, quadratic, cubic, power, and exponential equations). These equations represent the most common equations in different field of studies, including mathematics, chemistry, statistic, engineering, and so forth. To simplify our statistical analysis, we will start with a brief description of each formula used in this section.
4.2.1. Linear Equation
A linear equation can be defined as an algebraic equation. Each term has a coefficient to show the weight of each variable in the linear model. The output graph of linear model is a straight line. The equation of a linear model can be termed as
where international index is one of NASDAQ, SP500, NIKKEI, CAC40, DAX, and HSI; b1 and c are constants. To calculate b1 and c, different methods and techniques have been used [51].
4.2.2. Quadratic Equation
The name of the quadratic equation derived from quad, which results in squaring the input variable.
The formula of quadratic equation is
where b1, b2, and c are coefficient of the squared variable, coefficient of variable, and constant, respectively. To determine the coefficients and the constant, different methods can be used [52].
4.2.3. Power Equation
This function is defined as a constant power of the independent variables noted hereunder:
where b1 is the constant of the power equation calculated by creating a power relationship between independent and dependent variables.
4.2.4. Cubic Equation
Is the special case of the polynomial function in which the maximum power is 3. To write a cubic equation, the following equation takes place:
where b1, b2, b3, and c are coefficients of the cubic equation and can be calculated using different methods [53].
4.2.5. Exponential Equation
The exponential equation has a special form as bx, where b > 0 and b ≠ 1. The b is called the base of the equation and x is the exponent (dependent variable). The general formula of exponential equation written as
where c and b1 are the constants of the exponential equation. The exponential equation can be calculated using different methods [54].
4.2.6. Logarithmic Equation
There are many methods to define a logarithmic equation. In this paper, the equation is defined as
where b1 and c are constant and log is the natural logarithm [55].
4.3. Estimate Methodology of Tadawul Index (TASI)
The estimation of the Tadawul index is carried out in four steps, with the first being to present the correlation matrix between all variables and to test the significance of each correlation coefficient, while the second is to estimate TASI by implementing each type of previously mentioned function (Section 3) on TASI as dependent variables, while time and each of the international indices are taken as independent variables. The third step is to specify the best model in estimating TASI among all models and to evaluate the performance of different equations, for which three performance metrics are employed (i.e., determination coefficient (), error, and F-values). The following formulas present the calculations of metrics performance:
where , , and are the measured TASI stock index, the estimated TASI stock index, and the mean of TASI stock index, respectively. In addition, N and i are the number of samples and the index of the data in the dataset, respectively. The fourth step is to export the data to the ARIMA model in order to combine different indices together to estimate TASI using different international indices.
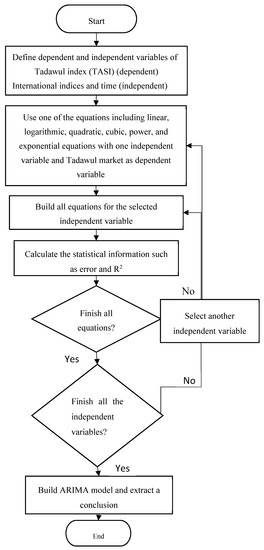
Figure 1.
Flowchart of the proposed methodology.
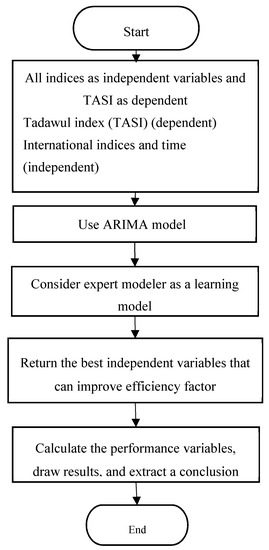
Figure 2.
ARIMA model flowchart.
4.4. ARIMA model and Open Innovation
Autoregressive integrated moving average, widely known as ARIMA, combines three concepts together: autoregression, moving average, and integration. ARIMA has been developed in 1970 by Box and Jenkin. ARIMA is one of the best fit models for short-term forecasts [56] and is an active predictor that relates past and current with future estimates [57]. Many separated micro and macrodynamics have been tested using the ARIMA model. One of the important studies that combined both ARIMA model and innovation was implemented by Somboonsak, who used ARIMA model to predict the expected number of people with specific types of fever based on location distribution through using a smartphone application with fever GPS to plan, control, and warn people from risky areas [58]. Jiang and Zhang employed a hybrid model combining ARIMA with artificial neural network (ARIMA–ANN model) in order to improve the stock price prediction of highly developed capital markets [59]. A statistical and computational approach engaging ARIMA with disruptive formula has been adapted by Arifin and Habibie in order to have more accurate mobile data traffic prediction in a world full of disruptive technologies [56]. Moreover, ARIMA plays a key role in predicting the outputs of technologies, society, industry studies, and behavioral finance, particularly once it is upgraded as a hybrid model. In addition, ARIMA model is a key player in the field of challenging financial instruments such as cryptocurrency [60].
5. Results, Analysis and Discussion
To clarify the relationship between each independent variable (i.e., day, month, year, and international indices) and TASI stock index, we plot a graph for each variable Figure 3 and Figure 4. “Day” and “month” variables show that there are no linear relationships between these variables and the TASI index, where the “year” variable exhibits an incremental increase in the index until 2014, then a decrease for two years up to 2016 and return to increasing after 2016. The date pillar outputs express a limited relationship with day, month, and year standing apart from each other. However, unifying these three variables within the “time variable” could improve the estimation model.
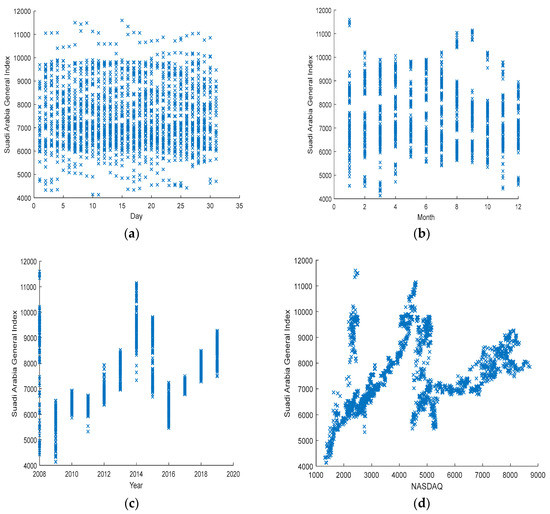
Figure 3.
The relationship between Tadawul index (TASI) and (a) Day, (b) Month, (c) Year, and (d) NASDQ.
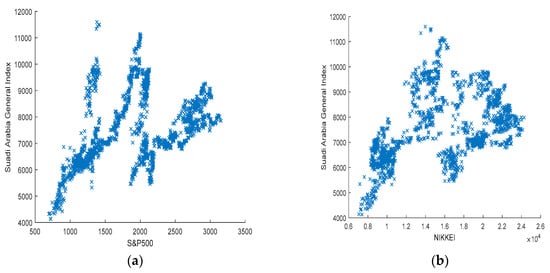
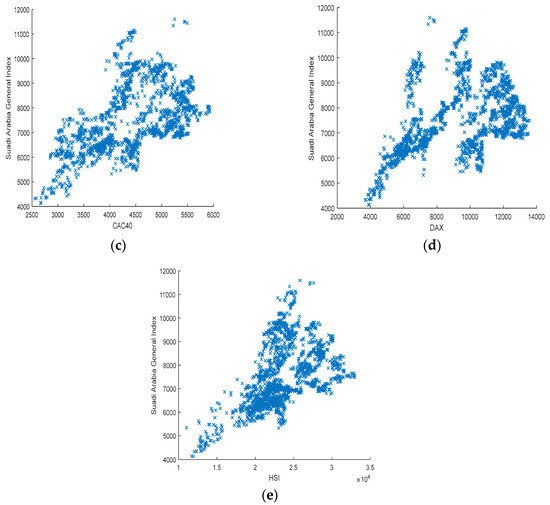
Figure 4.
The relationship between the Tadawul index (TASI) and (a) S&P500, (b) NIKKEI, (c) CAC40, and the (d) DAX and (e) HSI stock market indices.
Supporting the previously mentioned graphs results, a correlation test in Table 3 is used to demonstrate the relations’ degree of the linearity model. This table presents high positive significant correlation coefficients among the concerned international indices. Day variable is not significant, month variable is insignificant except for a weak correlation with both TASI (negative direction) and NASDAQ (positive direction). Nevertheless, the year variable is positively correlated with all indices and with a high degree. This may indicate that all international indices demonstrate an additive effect on a year-to-year basis. In addition, as shown in Table 3, all international indices (i.e., NASDAQ, SP500, NIKKEI, DAX, CAC40, and HSI) have a significant correlation with TASI, with correlation coefficients close to 0.5. Moreover, CAC40 and HSI express stronger correlations with the rest of indices compared to other variables. According to what has been mentioned, the results point out that international stock indices are proper estimators to forecast the movement style of the TASI index.
Table 3.
The correlation matrix of International indices and TASI.
The relationship between TASI and international indices show that all indices have a linear relationship with TASI index (Figure 3 and Figure 4). In order to estimate the movement of TASI, the following steps have been applied: first, use day, month, and year variables together as the “time” variable. Second, each index of international indices with different estimating equations (Section 3) was used separately in order to evaluate their performance on TASI (Table 4). Third, the optimal model was selected as that with the best R2, error, and F-values.
Table 4.
Estimating the TASI using linear, logarithmic, quadratic, cubic, power, and exponential equations.
As shown above (Table 4), the results reveal that the results of all deployed equations are significant according to R2, error, and F-values. Hence, equations with different international indices and time variables are efficient and will possibly estimate TASI’s behavior. The overall top model is the power equation, in which the best R2, error, and F-values have been obtained. In addition, time variable shows the highest performance, where the power equation is used to forecast TASI values. In Table 4, the best model is HSI power equation as it has the best R2, error, and F-values with 1, 0, and 358,601, respectively. This indicates that international indices are able to give an initial description of TASI’s expected movement; any changes in these indices due, e.g., to global variations, will in turn affect TASI.
ARIMA Model
After constructing equations that aim to estimate TASI using only one of the international indices as shown in Table 4, we go in depth to investigate more complicated linear models by using the ARIMA model with the concerned international indices in addition, to day, month, and year variables. The study uses ARIMA model with Expert Modeler to choose the most significant variables that could be used to build a prediction model that can estimate TASI index. The results reveal that the best ARIMA model can be formulized as ARIMA (0,1,14).
According to Table 5 and Table 6, ARIMA results show that SP500, NIKKEI, CAC40, and HSI indices are the most appropriate variables to estimate TASI with R2 and RMSE equal to 0.993 and 113, respectively. All these four indices have a positive effect on estimating TASI. SP500 has the strongest effect on forecasting TASI with an estimate coefficient of 0.366, followed by CAC40 then HSI and, finally, NIKKEI with 0.05. The relationship between estimated and observed model using ARIMA is shown in Figure 4. In addition, the Ljung–Box test showed that the model is not significant with a p-value equal to 0.407, which indicates that there would not be any remaining residual structures in the ARIMA model that uses four predictors. In addition, the proposed model did not include NASDQ index, since Expert Modeler choses the index that is highly correlated with TASI and is less correlated with other independent variables.
Table 5.
Ljung–Box test for ARIMA model.
Table 6.
Estimation of parameters for ARIMA (0,1,14).
Figure 5 shows that the observed and estimated lines are almost similar, which support the idea of using ARIMA to estimate TASI. The findings of this study demonstrate that TASI relates to international indices and any events happening within the scope of these indices can have a huge impact on the TASI index. This relationship can be used to understand the opening price of TASI based on the closing prices of these international indices. Therefore, investors who are interested in TASI’s stocks investments initially have to keep their eyes open on international indices, as they can estimate TASI movement with more accuracy and may apparently achieve more gains.
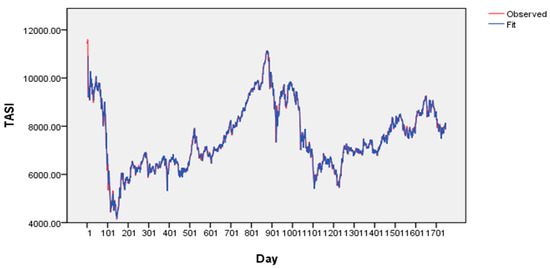
Figure 5.
Estimating TASI using ARIMA (0,1,14) with the explorer method.
Therefore, investors can predict the opening price of TASI using the closing prices of international stock indices, which would help many investors to sell and buy stocks based on international trends, especially in a case of crisis of international indices. Finally, today’s performance of SP500, NIKKEI, CAC40, and HSI, will be tomorrow’s performance of TASI. As a result, we are advising those who are investing or contemplating investing in Tadawul to benefit from predicting this expected performance to achieve an abnormal gain over their investments.
6. Conclusions
Globalization can convert the whole world into small village. Everything is connected to each other in both internal and external markets, which makes the existence or sustainability of companies complicated. On this point, innovation will make the difference as it creates competitive advantage for each company, as all markets are interrelated to each other [2]. Saudi organizations showed worthy practices that are expected to shape the way for new innovations. In 2017, the capital market authority, CMA, announced the establishment of the financial tech experimental permit (FinTech ExPermit), which will provide new financing methods for investors through creating equity crowd funding platform. In addition, Tadawul and NASDAQ have officially signed an agreement to transfer the technology of post-trading infrastructure which is expected to take place in the second half of 2020. Moreover, e-voting and crowdfunding systems are going to be used in several financial markets all over the world and will deploy block chain innovation. Due to these forthcoming open innovation techniques, the Saudi market will have a high probability of joining the global open innovation zone soon. Hence, authors have attempted to estimate the Tadawul index (TASI) using key international indices and open innovation.
Several researchers have focused on using different input variables (i.e., day, month, year, trading volume, etc.) to study the power of estimation on stock market index [19,20,21,22,23,24,25]. Heston and Sinha [29] used neural network to investigate their effect on predicting stock index returns. Few scholars were successful in examining the relationship between one index and other indices, then to forecast the movement of this index [34]. Other researchers tried to estimate the relationship between a group of indices, like Kapar, Olmo, and Ghalayini [35], who investigated the financial integration between three stock indices (i.e., Dubai, Abu Dhabi, and the FTSE NASDAQ Dubai UAE 20 index) among the United Arab Emirates Stock Markets by using a vector error correction and permanent–transitory decomposition. The results revealed that the UAE stock markets are integrated, so any shock to any market would have a strong effect on the other considered markets. Mohammed, Abdalhafid, and Ahmed [34] studied the relationship between TASI and US stock market indices (S&P500 and Dow Jones) and found a relationship between Tadawul Market and the US markets in the long run. In addition, Tissaoui and Azibi [36] studied the predictability of Tadawul index and international indices and found that US volatility risk indices are dominant in forecasting the Saudi stock exchange.
This paper has studied different international indices including CAC40, DAX, NASDAQ, SP 500, NIKKEI 225, and HSI in order to estimate the movement of Tadawul index (TASI). The paper deploys a time series of 12 years from 2008 until 2019 to ensure that the results do not happen accidently or arbitrarily, besides to ensure the reliability of all employed equations. The statistical analysis has been made within two parallel stages; in the first stage, different equations (i.e., linear, logarithmic, quadratic, cubic, power, and exponential equations) are run and then the best model is selected among all of them. On the other hand, the ARIMA model is used to specify the most critical indices among all of them that can estimate TASI more accurately. The results reveal that the power equation with different independent variables besides the time variable is most able to estimate TASI. This provides strong evidence that prediction models can be used to estimate TASI’s behavior. The ARIMA model (with Expert Modeler) coefficients are described as ARIMA (0,1,14). The results demonstrate that SP500, NIKKEI, CAC40, and HSI indices are the most appropriate variables to estimate TASI with R2 and RMSE equal to 0.993 and 113, respectively.
7. Limitations and Further Studies
Limitations exist, and in order to profoundly generalize additional results, there is a plan to adapt more complicated forecasting models (i.e., neural network and artificial intelligence) in the near future. These models will be operated to investigate the ability to predict TASI’s performance with different criteria. Moreover, authors may consider employing further studies adapting other financial indices, including precious metals and oil.
8. Practical Implications
This paper paved the path for investors in the Saudi financial market to predict the opening price of TASI (the Tadawul Saudi index) based on previous closing prices of selected international indices. Hence, it shapes the opportunity for both existing and potential investors to predict the movement of TASI and accordingly gain excess return over their investments. Thus, regulatory bodies may take advantage of predicting TASI movement as an early indicator of any extraordinary fluctuations in the market, which will facilitate the surveillance actions of these regulatory bodies on all firms listed in Tadawul, that all will enhance the soundness of the market and the stability of the economy.
Author Contributions
Conception: All authors conceived and designed the research; Data Collection and processing: H.A.-N. and N.A.-R.; Analysis and Interpretation: D.A.-N. and H.A.-N.; Literature Review: All authors; Critical Review: H.F.A. All authors have read and agreed to the published version of the manuscript.
Funding
This research received no external funding.
Acknowledgments
The authors thank the administrative and technical support of J. Open Innov. Technol. Mark. Complex for allowing the quick publication of this article.
Conflicts of Interest
The authors declare no conflicts of interest.
References
- Yun, J.J.; Liu, Z. Micro-and Macro-Dynamics of Open Innovation with a Quadruple-Helix Model. Sustainability 2019, 11, 3301. [Google Scholar] [CrossRef]
- Chesbrough, H. Managing open innovation. Res.-Technol. Manag. 2004, 47, 23–26. [Google Scholar] [CrossRef]
- Noh, Y. Financial effects of open innovation in the manufacturing industry. Manag. Decis. 2015, 53, 1527–1544. [Google Scholar] [CrossRef]
- Ballestra, L.; Fontana, S.; Scuotto, V.; Solimene, S. A multidisciplinary approach for assessing open innovation model impact on stock return dynamics. Manag. Decis. 2018, 56, 1430–1444. [Google Scholar] [CrossRef]
- Hung, K.P.; Chou, C. The impact of open innovation on firm performance: The moderating effects of internal R&D and environmental turbulence. Technovation 2013, 33, 368–380. [Google Scholar]
- Szutowski, D. Market reaction to open innovation announcements. Eur. J. Innov. Manag. 2018, 21, 368–380. [Google Scholar] [CrossRef]
- Yun, J.J.; Won, D.; Park, K. Dynamics from open innovation to evolutionary change. J. Open Innov. Technol. Mark. Complex 2016, 2, 7. [Google Scholar] [CrossRef]
- Yun, J.J. How do we conquer the growth limits of capitalism? Schumpeterian Dynamics of Open Innovation. J. Open Innov. Technol. Mark. Complex 2015, 1, 17. [Google Scholar] [CrossRef]
- Yun, J.J.; Won, D.; Park, K. Entrepreneurial cyclical dynamics of open innovation. J. Evol. Econ. 2018, 28, 1151–1174. [Google Scholar] [CrossRef]
- Cooke, P. World Turned Upside Down: Entrepreneurial Decline, Its Reluctant Myths and Troubling Realities. J. Open Innov. Technol. Mark. Complex. 2019, 5, 22. [Google Scholar] [CrossRef]
- Carayannis, E.G.; Campbell, D.F.J. Open Innovation Diplomacy and a 21st Century Fractal Research, Education and Innovation (FREIE) Ecosystem: Building on the Quadruple and Quintuple Helix Innovation Concepts and the “Mode 3” Knowledge Production System. J. Knowl. Econ. 2011, 2, 327. [Google Scholar] [CrossRef]
- AlAmro, R.; McCarren, A.; Al-Rasheed, A. Predicting Saudi Stock Market Index by Incorporating GDELT Using Multivariate Time Series Modelling. In International Conference on Computing; Springer: Cham, Switzerland, 2019; pp. 317–328. [Google Scholar]
- Hauser, S.; Kamara, A.; Shurki, I. The effects of randomizing the opening time on the performance of a stock market under stress. J. Financial Mark. 2012, 15, 392–415. [Google Scholar] [CrossRef]
- Gholamiangonabadi, D.; Taheri, S.D.M.; Mohammadi, A.; Menhaj, M.B. Investigating the performance of technical indicators in electrical industry in Tehran’s Stock Exchange using hybrid methods of SRA, PCA and Neural Networks. In Proceedings of the 2014 5th Conference on Thermal Power Plants (CTPP), Tehran, Iran, 10–11 June 2014; IEEE: Piscataway, NJ, USA, 2015; pp. 75–82. [Google Scholar]
- Qiu, M.; Song, Y. Predicting the direction of stock market index movement using an optimized artificial neural network model. PLoS ONE 2016, 11, e0155133. [Google Scholar] [CrossRef] [PubMed]
- Hollstein, F.; Prokopczuk, M.; Simen, C.W. Estimating beta: Forecast adjustments and the impact of stock characteristics for a broad cross-section. J. Financ. Mark. 2019, 44, 91–118. [Google Scholar] [CrossRef]
- Chen, X.; Shangguan, W.; Liu, Y.; Wang, S. Can Network Structure Predict Cross-Sectional Stock Returns? Evidence from Co-attention Networks in Chin. Finance Res. Lett. 2019. [Google Scholar] [CrossRef]
- Sutthichaimethee, P.; Chatchorfa, A.; Suyaprom, S. A Forecasting Model for Economic Growth and CO2 Emission Based on Industry 4.0 Political Policy under the Government Power: Adapting a Second-Order Autoregressive-SEM. J. Open Innov. Technol. Mark. Complex. 2019, 5, 69. [Google Scholar] [CrossRef]
- Moghaddam, A.H.; Moghaddam, M.H.; Esfandyari, M. Stock market index prediction using artificial neural network. J. Econ. Finance Adm. Sci. 2016, 21, 89–93. [Google Scholar] [CrossRef]
- Selvamuthu, D.; Kumar, V.; Mishra, A. Indian stock market prediction using artificial neural networks on tick data. Financial Innov. 2019, 5, 16. [Google Scholar] [CrossRef]
- Khan, M.A.; Hernandez, J.A.; Shahzad, S.J.H. Time and frequency relationship between household investors’ sentiment index and US industry stock returns. Finance Res. Lett. 2019, 101318. [Google Scholar] [CrossRef]
- Jiang, M.; Liu, J.; Zhang, L.; Liu, C. An improved Stacking framework for stock index prediction by leveraging tree-based ensemble models and deep learning algorithms. Phys. A: Stat. Mech. its Appl. 2020, 541, 122272. [Google Scholar] [CrossRef]
- Anik, M.M.; Arefin, M.S.; Dewan, M.A.A. An Intelligent Technique for Stock Market Prediction. In Proceedings of the International Joint Conference on Computational Intelligence, Vienna, Australia, 17–19 September 2019; Springer: Singapore, 2020; pp. 721–733. [Google Scholar]
- Chandrasekara, V.; Tilakaratne, C.; Mammadov, M. An Improved Probabilistic Neural Network Model for Directional Prediction of a Stock Market Index. Appl. Sci. 2019, 9, 5334. [Google Scholar] [CrossRef]
- Tsai, M.-C.; Cheng, C.-H.; Tsai, M.-I. A Multifactor Fuzzy Time-Series Fitting Model for Forecasting the Stock Index. Symmetry 2019, 11, 1474. [Google Scholar] [CrossRef]
- Ryu, D. The US–Korea free trade agreement as a shock to product market competition: Evidence from the Korean stock market. Finance Res. Lett. 2019. [Google Scholar] [CrossRef]
- Dichtl, H.; Drobetz, W. Are stock markets really so inefficient? The case of the “Halloween Indicator”. Finance Res. Lett. 2014, 11, 112–121. [Google Scholar] [CrossRef]
- Fang, J.; Gozgor, G.; Lau, C.K.M.; Lu, Z. The impact of Baidu Index sentiment on the volatility of China’s stock markets. Finance Res. Lett. 2019, 32, 101099. [Google Scholar] [CrossRef]
- Heston, S.L.; Sinha, N.R. News vs. Sentiment: Predicting Stock Returns from News Stories. Financial Anal. J. 2017, 73, 67–83. [Google Scholar] [CrossRef]
- Zhang, X.; Fuehres, H.; Gloor, P. Predicting stock market indicators through twitter “I hope it is not as bad as I fear”. Procedia-Soc. Behav. Sci. 2011, 26, 55–62. [Google Scholar] [CrossRef]
- Bollen, J.; Mao, H.; Zeng, X.-J. Twitter mood predicts the stock market. J. Comput. Sci. 2011, 2, 1–8. [Google Scholar] [CrossRef]
- Hirshleifer, D.; Shumway, T. Good Day Sunshine: Stock Returns and the Weather. J. Finance 2003, 58, 1009–1032. [Google Scholar] [CrossRef]
- Corby, P.; Machado, R.; Fox, F. U.S. Patent Application No. 11/159,252; USPTO: Alexandria, VA, USA, 2006.
- Mohammed, S.; Abdalhafid, M.; Ahmed, B. Examining Causal Relationship between Saudi Stock Market (TASI) and US Stock Markets Indices. Asian J. Econ. Finance Manag. 2020, 2, 1–9. [Google Scholar]
- Kapar, B.; Olmo, J.; Ghalayini, R. Financial Integration in the United Arab Emirates Stock Markets. Finance Res. Lett. 2019. [Google Scholar] [CrossRef]
- Tissaoui, K.; Azibi, J. International implied volatility risk indexes and Saudi stock return-volatility predictabilities. N. Am. J. Econ. Finance 2019, 47, 65–84. [Google Scholar] [CrossRef]
- Dai, Z.; Zhou, H. Prediction of Stock Returns: Sum-of-the-Parts Method and Economic Constraint Method. Sustainability 2020, 12, 541. [Google Scholar] [CrossRef]
- Meng, T.L.; Khushi, M. Reinforcement Learning in Financial Markets. Data 2019, 4, 110. [Google Scholar] [CrossRef]
- Chung, H.; Shin, K.-S. Genetic Algorithm-Optimized Long Short-Term Memory Network for Stock Market Prediction. Sustainability 2018, 10, 3765. [Google Scholar] [CrossRef]
- Shah, H.; Tairan, N.; Garg, H.; Ghazali, R. A Quick Gbest Guided Artificial Bee Colony Algorithm for Stock Market Prices Prediction. Symmetry 2018, 10, 292. [Google Scholar] [CrossRef]
- Dinh, T.A.; Kwon, Y.K. An empirical study on importance of modeling parameters and trading volume-based features in daily stock trading using neural networks. Informatics 2018, 5, 36. [Google Scholar] [CrossRef]
- Rundo, F.; Trenta, F.; Di Stallo, A.L.; Battiato, S. Advanced Markov-Based Machine Learning Framework for Making Adaptive Trading System. Computation 2019, 7, 4. [Google Scholar] [CrossRef]
- Shah, D.; Isah, H.; Zulkernine, F. Stock Market Analysis: A Review and Taxonomy of Prediction Techniques. Int. J. Financial Stud. 2019, 7, 26. [Google Scholar] [CrossRef]
- Khorsheed, M.S. Saudi Arabia: From Oil Kingdom to Knowledge-Based Economy. Middle East Policy 2015, 22, 147–157. [Google Scholar] [CrossRef]
- Al Rahahleh, N.; Kao, R. Forecasting Volatility: Evidence from the Saudi Stock Market. J. Risk Financial Manag. 2018, 11, 84. [Google Scholar] [CrossRef]
- Kumar, A. A Statistical Analysis of the Stochastic Drift between MICEX and TASI-an in-Depth Study. Asian J. Manag. 2018, 9, 413. [Google Scholar] [CrossRef]
- Jarrah, M.; Salim, N. A Recurrent Neural Network and a Discrete Wavelet Transform to Predict the Saudi Stock Price Trends. Int. J. Adv. Comput. Sci. Appl. 2019, 10, 155–162. [Google Scholar] [CrossRef]
- Alsufyani, M.; Sarmidi, T. The Inter-Relationship Between Commodity Energy Prices and Stock Market Volatility in Saudi-Arabia. J. Nusant. Stud. (JONUS) 2020, 5, 270–293. [Google Scholar] [CrossRef]
- Ferreira, P.; Loures, L. An Econophysics Study of the S&P Global Clean Energy Index. Sustainability 2020, 12, 662. [Google Scholar]
- Bai, Y.; Guo, A. An Empirical Investigation to the “Skew” Phenomenon in Stock Index Markets: Evidence from the Nikkei 225 and Others. Sustainability 2019, 11, 7219. [Google Scholar] [CrossRef]
- Goode, S.W.; Annin, S.A. Differential Equations and Linear Algebra; Pearson Higher Ed.: London, UK, 2007. [Google Scholar]
- Sterling, M.J. Algebra I Workbook For Dummies; John Wiley & Sons: Hoboken, NJ, USA, 2017. [Google Scholar]
- Stroud, A.H. Numerical Quadrature and Solution of Ordinary Differential Equations: A Textbook for A Beginning Course in Numerical Analysis; Springer Science & Business Media: New York, NY, USA, 1974; Volume 10. [Google Scholar]
- Croucher, J. Mathematics Toolbox 300589: Introductory Mathematics and Statistics for Business; McGraw Hill: New York, NY, USA, 2009. [Google Scholar]
- Dempsey, R. Determining the Alignment of Math 105-Intermediate Algebra at the University of Wisconsin--Milwaukee to the Goals of the Common Core State Standards. Master’s Thesis, University of Wisconsin, Madison, WI, USA, 2013. [Google Scholar]
- Arifin, A.S.; Habibie, M.I. The prediction of mobile data traffic based on the ARIMA model and disruptive formula in industry 4.0: A case study in Jakarta, Indonesia. Telkomnika 2020, 18, 907–918. [Google Scholar] [CrossRef]
- Kim, S.; Heo, J.-M. Time series regression-based pairs trading in the Korean equities market. J. Exp. Theor. Artif. Intell. 2017, 29, 755–768. [Google Scholar] [CrossRef]
- Somboonsak, P. Development Innovation to Predict Dengue Affected Area and Alert People with Smartphones. Int. J. Online Biomed. Eng. (iJOE) 2020, 16, 62–79. [Google Scholar] [CrossRef]
- Jiang, X.-Q.; Zhang, L.-C. Stock price fluctuation prediction method based on time series analysis. Discret. Contin. Dyn. Syst.-S 2019, 12, 915–927. [Google Scholar] [CrossRef]
- Abu Bakar, S.R.N. Autoregressive Integrated Moving Average (ARIMA) Model for Forecasting Cryptocurrency Exchange Rate in High Volatility Environment: A New Insight of Bitcoin Transaction. Int. J. Adv. Eng. Res. Sci. 2017, 4, 130–137. [Google Scholar] [CrossRef]


© 2020 by the authors. Licensee MDPI, Basel, Switzerland. This article is an open access article distributed under the terms and conditions of the Creative Commons Attribution (CC BY) license (http://creativecommons.org/licenses/by/4.0/).