Article

Evaluation of Technological Knowledge Transfer between Silicon Fen Firms and University of Cambridge Based on Patents Analysis

1
Faculty of Business and Law, School of Management, Angelia Ruskin University, Cambridge CB1 1PT, UK
2
Energy and Environmental Materials Research Centre (E2MC), Northeastern University, Shenyang 110819, China
*
Author to whom correspondence should be addressed.
J. Open Innov. Technol. Mark. Complex. 2022, 8(4), 216; https://doi.org/10.3390/joitmc8040216
Submission received: 21 November 2022 / Revised: 6 December 2022 / Accepted: 7 December 2022 / Published: 11 December 2022

Abstract

:
Silicon Fen (SF) is a cluster of high-tech firms located around the University of Cambridge (UoC) in the UK. This article, for the first time, investigates the technological bonds between SF firms and UoC based on patent analysis covering the period of 1999–2021. We provide a short history of SF, highlighting its early formation and growth, and the role of spin-off firms on its evolution. We employ joint patents generated by UoC and various business sectors of SF to calculate the values of technological collaboration strength (TCS). It is found that the majority of joint patents (61%) are generated by the Pharma/Biotech sector of SF with the highest value of TCS (16.45 × 10⁻³). Moreover, the patent’s economic values across various business disciplines in SF are calculated based on the total counts of citations. Our observations suggest that senior university academics making spin-off firms in a business cluster around their university can effectively facilitate university–firm technological collaboration. Furthermore, the relatively strong technological bond between UoC and the Pharma/Biotech sector of SF is confirmed to be influenced by the collaboration of the university with its own spin-off firms rather than large independent firms in SF. The outcomes of this research contribute to the knowledge of the collaboration between a main research university and a cluster of firms located in its geographical proximity.

1. Cluster of High-Tech Firms and Gap in the Literature

Commercial clusters can be categorised into three dimensions based on their supplier/customer chains, competition/cooperation domains and geographical territory of existence/operation [1,2,3]. In particular, the geographical agglomeration of firms is considered a key factor enabling their long-term competitiveness in specialised industries in the current increasingly competitive global economy [4,5]. As such, the clustering of firms is a widely used approach for designing regional development policies [6] since the geographical clusters often provide environments enabling the stimulation of the productivity and innovativeness of firms and the formation of new businesses [7,8]. The geographical closeness of companies can also generate other mutual benefits in accessing a pool of specialised talents or human capital that meets the needs of industries. Furthermore, companies within clusters may utilise localised technology innovations and infrastructures, benefiting from the flow of ideas or information, which could easily be exchanged when companies are located in close proximity. Moreover, companies in a particular competing field can cooperate within clusters [8].
There are various factors involved in the formation of clusters, such as access to natural resources, closeness to trading routes, the drive of regional leaders, and the presence of research institutes for anchoring business spin-offs and attracting investment [9,10]. In particular, a key aspect of technology-based clusters is the role of universities that support the development of firms by providing experts in various fields [11] and forming a source of knowledge that can be accessed or shared, through university–industry collaboration [12], contributing to the technological development and innovation [13]. The role of universities in forming and/or developing clusters of firms has received attention in the literature. For instance, Lee [14] proposed that a technology-oriented research university can increase employment through the formation of new firms closely related to that university’s innovative strengths.
There are a number of successful company clusters around the world, including Silicon Valley (US) [15], Kista Science City (Sweden) [16], Cleantech (Denmark) [17], the Blue Maritime Cluster (Norway) [18], the Media Park (Netherlands) [19], and Aerospace Valley (France) [20]. Such clusters, particularly Silicon Valley, have been the subject of numerous studies. In contrast, Silicon Fen (SF), a cluster of high-tech firms in the vicinity of the world-famous University of Cambridge (UoC) in the UK, has received much less attention in the literature. This article, for the first time, is aimed at investigating the technological bonds between UoC and SF firms using patent analysis. To this end, in the next section, a brief introduction to SF and its historical connection to UoC is provided. Then, the situation of the pharma and biotech industry in the Cambridge area is highlighted, and patent analysis is discussed as an efficient method of investigating the technological connection between SF and UoC, followed by the development of the research hypothesis.
The outcomes of this research would be of interest to researchers and policymakers who are looking at the development of local economies based on promoting knowledge-based firms and those who are concerned with local university–industry technological collaboration. This article also provides an overview of the role of UoC on the development of SF, thus contributing to the theory of clustering of high-tech firms around main universities; based on the evidence from SF. In these contexts, understanding the technological influence of UoC on various business sectors of SF is essential. Similar cases in the literature include the relationship between Silicon Valley and the University of Stanford [21], the Spanish textile cluster and Universitat Politècnica de València [22], and local industries in Ulsan (Korea) and the Ulsan National Institute of Science and Technology [14].

2. Silicon Fen and Its Connection to the University of Cambridge

SF (also called Cambridge Cluster or Cambridge Phenomenon) is a cluster of innovative high-tech small-, medium- and large-sized companies mainly located in several science parks around the University of Cambridge. The development of science parks in the UK initiated in the 1970s can be considered a direct consequence of two main events: The reduction of financial dependency of universities on traditional governmental sources; and the policy of improving the technological dynamism within the British industrial sector. Thus, the formation of science parks was suggested as a tool to improve industrial performance through the better exploitation of scientific and technological resources [23,24,25,26]. In this context, placing firms and universities in the same geographical area was considered a way of providing a closer linkage between the industry and knowledge sources [27,28]. Based on this background, the formation of SF and its relation to the University of Cambridge can be explained as follows.
The term ‘Silicon Fen’ is basically a reflection of the Silicon Valley located in California (US) with geographical characteristics of the wetland area around Cambridge, which is called the Fens locally. As such, SF has been considered Europe’s Silicon Valley [29]. Historically, the early formation of SF can be traced back to the formation of start-ups by ex-employees of UoC. One such company was Cambridge Scientific Instruments, founded in 1881 in order to manufacture scientific instruments accessible by the university [30,31]. Another example is the Pye Group, founded in 1896 to serve both the teaching and research demands of UoC [32]. These companies grew over the years to become leaders in their field. Despite this natural formation of the SF, 1969 may be pointed to as a key date when a report generated by UoC recommended the establishment of a science park in order to locate science-based industries accessible to the university. The recommended science park was established in 1970 and led by Trinity College, which was the wealthiest college within UoC at the time [33]. Later in 1979, the Barclays Bank provided financial support for Cambridge Computer Group of SF and a number of small start-ups [34,35].
Apart from the role of start-ups mentioned above, further expansion of SF has been related to the formation of spin-offs from existing companies in the area, causing a significant movement of people between these companies and the university [36], forming a flow of high-quality knowledge transfer that could attract investment from a number of US companies including Microsoft, establishing their own research labs in SF. The number of firms in SF gradually increased from 50 in the mid-1960s to more than 1200 firms employing 36,000 workers by 2000. During the 1990s, high-tech firms in Cambridge had a combined turnover in excess of GBP 3.5 billion, with a large number of acquisitions fuelling investment in entrepreneurship and new technology formation [37,38]. More recently, Kirk and Cotton [39] have identified a large number of technology and biotechnology companies located in SF. According to [40], the turnover of SF exceeded GBP 47 billion in 2020, highlighting the economic importance of SF. Considering the brief history mentioned above, it is straightforward to assume that there is a technological connection between UoC and SF. However, this possible connection has not been studied in the prior literature so far. This article concerns the technological bonds between UoC and SF using patent analysis, as discussed in the next sections.

3. Pharma and Biotechnological Science and Industry in Cambridge

Since the beginning of the 20th century, the Nobel Prize has been awarded annually to recognise revolutionary scientific/technological advancements. So far, 121 affiliates of the University of Cambridge have been awarded the Nobel Prize, including 27 Nobel Prizes on medicine/biomedicine providing some of the most significant achievements in the field, such as Gregory Winter (2018) for the phage display of peptides and antibodies [41]; Richard Henderson and Joachim Frank (2017) for developing cryo-electron microscopy for the high-resolution structure determination of biomolecules [42]; Venki Ramakrishnan (2009) for studies on the structure and function of the ribosome [43]; Tim Hunt (2001) for discoveries of key regulators of the cell cycle [44]; Maurice Wilkins, Francis Crick and James Watson (1962) for determining the structure of DNA [45]; and Ernst Chain and Howard Florey (1945) for the discovery of penicillin [46]. Due to such significant discoveries obtained at UoC in medical/biomedical sciences, it is not surprising that SF has observed a considerable growth of innovative biotechnology companies, including AstraZeneca, along with leading research institutes, including the Wellcome Sanger Institute and Addenbrookes research hospital. In 2012, the Biotechnology and Biosciences Research Council in the UK announced the establishment of the Babraham research institute as an open innovation campus in collaboration with AstraZeneca, introducing Cambridge as a major biotech and pharma hub in the UK. Therefore, it can be assumed that the technological bond between UoC and the Pharma/Biotech sector of SF is greater than that of other disciplines. This assumption is explored in this article using patent analysis.

4. Study of Technological Bond Using Patent Analysis

Patenting is the standard way of protecting firms’ inventions. Patents are also considered the standard source of technological and commercial knowledge, providing information about technical innovations and competitive dimensions of a technological field [47,48]. Therefore, patent analysis can be highly informative to illustrate the technological performances of high-tech firms, such as those located in SF. In this study, patent analysis is employed to explore the technological bonds between UoC and SF in different technology sectors. The bibliometric evaluation of patents provides an effective tool to investigate trends in technological advancements based on various parameters, including the applicants, inventors and specific invention categories. For example, Petruzzelli [49] studied R&D collaborations between various universities and firms based on their geographical distance, employing university–industry joint patents as the evaluation measure. In another work, patent data from a specific period of time were used to provide a comprehensive analysis of the formal university–industry collaborations in China [50], where the geographical distance was found to be an important factor in achieving an effective collaboration. Such quantitative patent analysis can provide a perspective, indicating the technological changes across different sectors and geographical locations, allowing firms to understand the current scenarios and react accordingly so as to maintain their competitive advantage [51,52]. In the current research, we employ the joint patents between SF firms and UoC to answer the research hypothesis highlighted in the next session.

5. Hypothesis

SF is a cluster of high-tech firms around UoC, and therefore, the study of their technological bonds is of specific importance. UoC has actively been engaged in science and technology creation, with a rich portfolio including 27 Nobel Prizes in medicine and medical sciences since 1904. The formation of spin-off firms originated from UoC has been a method of expansion of SF. Furthermore, Cambridge is known as a major pharma/biotech hub in the UK [53,54]. Basically, due to their close proximity and their historical connection, UoC can potentially contribute to the growth of the SF cluster by providing solutions to their business problems, leading to the generation of joint patents. Therefore, analysis of joint patents can be used to investigate the collaborative behaviour of UoC and SF firms in various technology sectors. Furthermore, UoC has invested in spin-off firms through the years, such as GBP 5.6 million in 26 spin-offs in 2021 [55]. As such, understanding the technological influence of UoC on SF firms with respect to the status of the firms can also be an interesting topic to be investigated. The argument here is whether the technological collaboration between UoC and SF firms is affected by the rich background of SF in medical and biotechnological sciences and whether spin-off firms play a significant role in overall technological collaboration, in contrast with large independent firms in the region. This study proposes the following two hypotheses: Technological collaboration between UoC and the biotech sector of SF is greater than other sectors of SF (H1); spin-off firms originating from UoC provide a significant role in technological knowledge transfer between UoC and SF firms (H2).

6. Research Methodology

In this study, the technological bonds between SF firms and UoC were studied based on patent analysis. To this end, sampling of high-tech firms in SF and patents were performed as described below.

6.1. Sampling of Patents

A sampling of granted patents and patent applications (herein called patent) in the period of 1999–2021 was conducted using Derwent innovation index (DII) and Lens.org. We considered a period of 22 years for our bibliographic study since it provides a sufficiently long time period to indicate the collaborative and entrepreneurial behaviour of firms [56,57,58]. Apart from patents owned by SF firms or UoC, joint patents were also sampled. Joint patents are defined as patents that are co-owned by both UoC and at least a firm within SF. As part of the UoC, Cambridge Enterprise (CE) is an organisation responsible for supporting academics in achieving knowledge transfer and research impact. CE, and its subsidiary called Cambridge University Technical Service (CUTS), are also in charge of patenting the technologies created within the university. To obtain a comprehensive patent sampling, the terms “Cambridge Enterprise” and “Cambridge University Technical Services” were also considered as alternative names for University of Cambridge as applicant/owner/co-owner of patents. Classification of patents into different technical fields was performed based on the Cooperative Patent Classification (CPC), which has jointly been developed by the European Patent Office (EPO) and the United States Patent and Trademark Office (USPTO) to indicate the technical fields of patents. The data were further confirmed using international patent classification (IPC) codes developed by the World Intellectual Property Organization (WIPO) [59], providing the opportunity for identifying technical fields [60].
The bibliometric sampling was performed to extract the joint patents between firms located in SF and UoC. In this sampling, the criterion for the selection of joint patents is based on the co-presence of at least one firm located in SF, as well as UoC, as co-applicants or co-owners of the patents. Patent samples were collected from EPO-Espacenet and Dervint Innovation Index in Web of Science (DII-WOS) database, and patent citing was recorded using Lens.org database. The above-mentioned databases were employed as complementary sources to either obtain or confirm information about patents. For the sampling of patents and co-inventors, the search was run based on the patent assignee names to identify the specific company and institution in DII under the “Assignee” section in period of 1999–2021. The assumption of patent sampling is that each patent family is considered as one patent. Accordingly, 1140 patents were downloaded and analysed.

6.2. Sampling of Firms within Silicon Fen

In this research, a geographical border was defined for SF in order to limit the discussions to those companies located in the defined area. In order to serve the purpose of this study, the companies with the postcode starting with CB in the UK are considered to be located in SF. Therefore, several districts, namely CB1, CB2, CB3, CB4, CB5, CB6, CB7, CB8, CB9, CB10, CB11, CB21, CB22, CB23, CB24 and CB25 within five post towns are considered as the geographical location of the Silicon Fen. After selecting high-tech companies located in SF, the sampling was limited to those companies that have collaborated with UoC, and this collaboration has led to the generation of joint patents based on the non-random purposive sampling approach. Sector of firms within SF was determined using classifications provided by Standard Industrial Classification (SIC) used by the UK Companies House [61] and the Financial Analysis Made Easy FAME [62]. Accordingly, high-tech firms in SF are divided into 10 different sectors comprising Aerospace and Transport, Communications, Computing, Creative Content, High-Tech Financial Services, IT Services, Medical devices, Tech Consultancy, Pharma/Biotech and Software. Table 1 exhibits a list of abbreviations used in this study.

6.3. Patent Analysis

In this study, number of patents, number of joint patents and citations to patents are considered to evaluate the technological collaboration between SF firms and UoC. Moreover, the technological collaboration strength (TCS) is adapted based on the Salton measure of collaboration [12,63,64] to evaluate the technological bonds between UoC and SF firms:
T C S U o C f i r m = J P U o C f i r m P U o C × P f i r m  
In Equation (1), TCS is the technological collaboration strength, and JP refers to the number of joint patents generated in collaboration between UoC and SF firm. PUoC and Pfirm are the total number of patents generated by UoC and the SF firm, respectively.

7. Results

In this study, the technological bonds between SF firms and UoC are investigated based on patent analysis in order to evaluate the hypotheses of the research. Since there is currently no clear description of the geographical border of SF, we first deal with this issue in the following section.

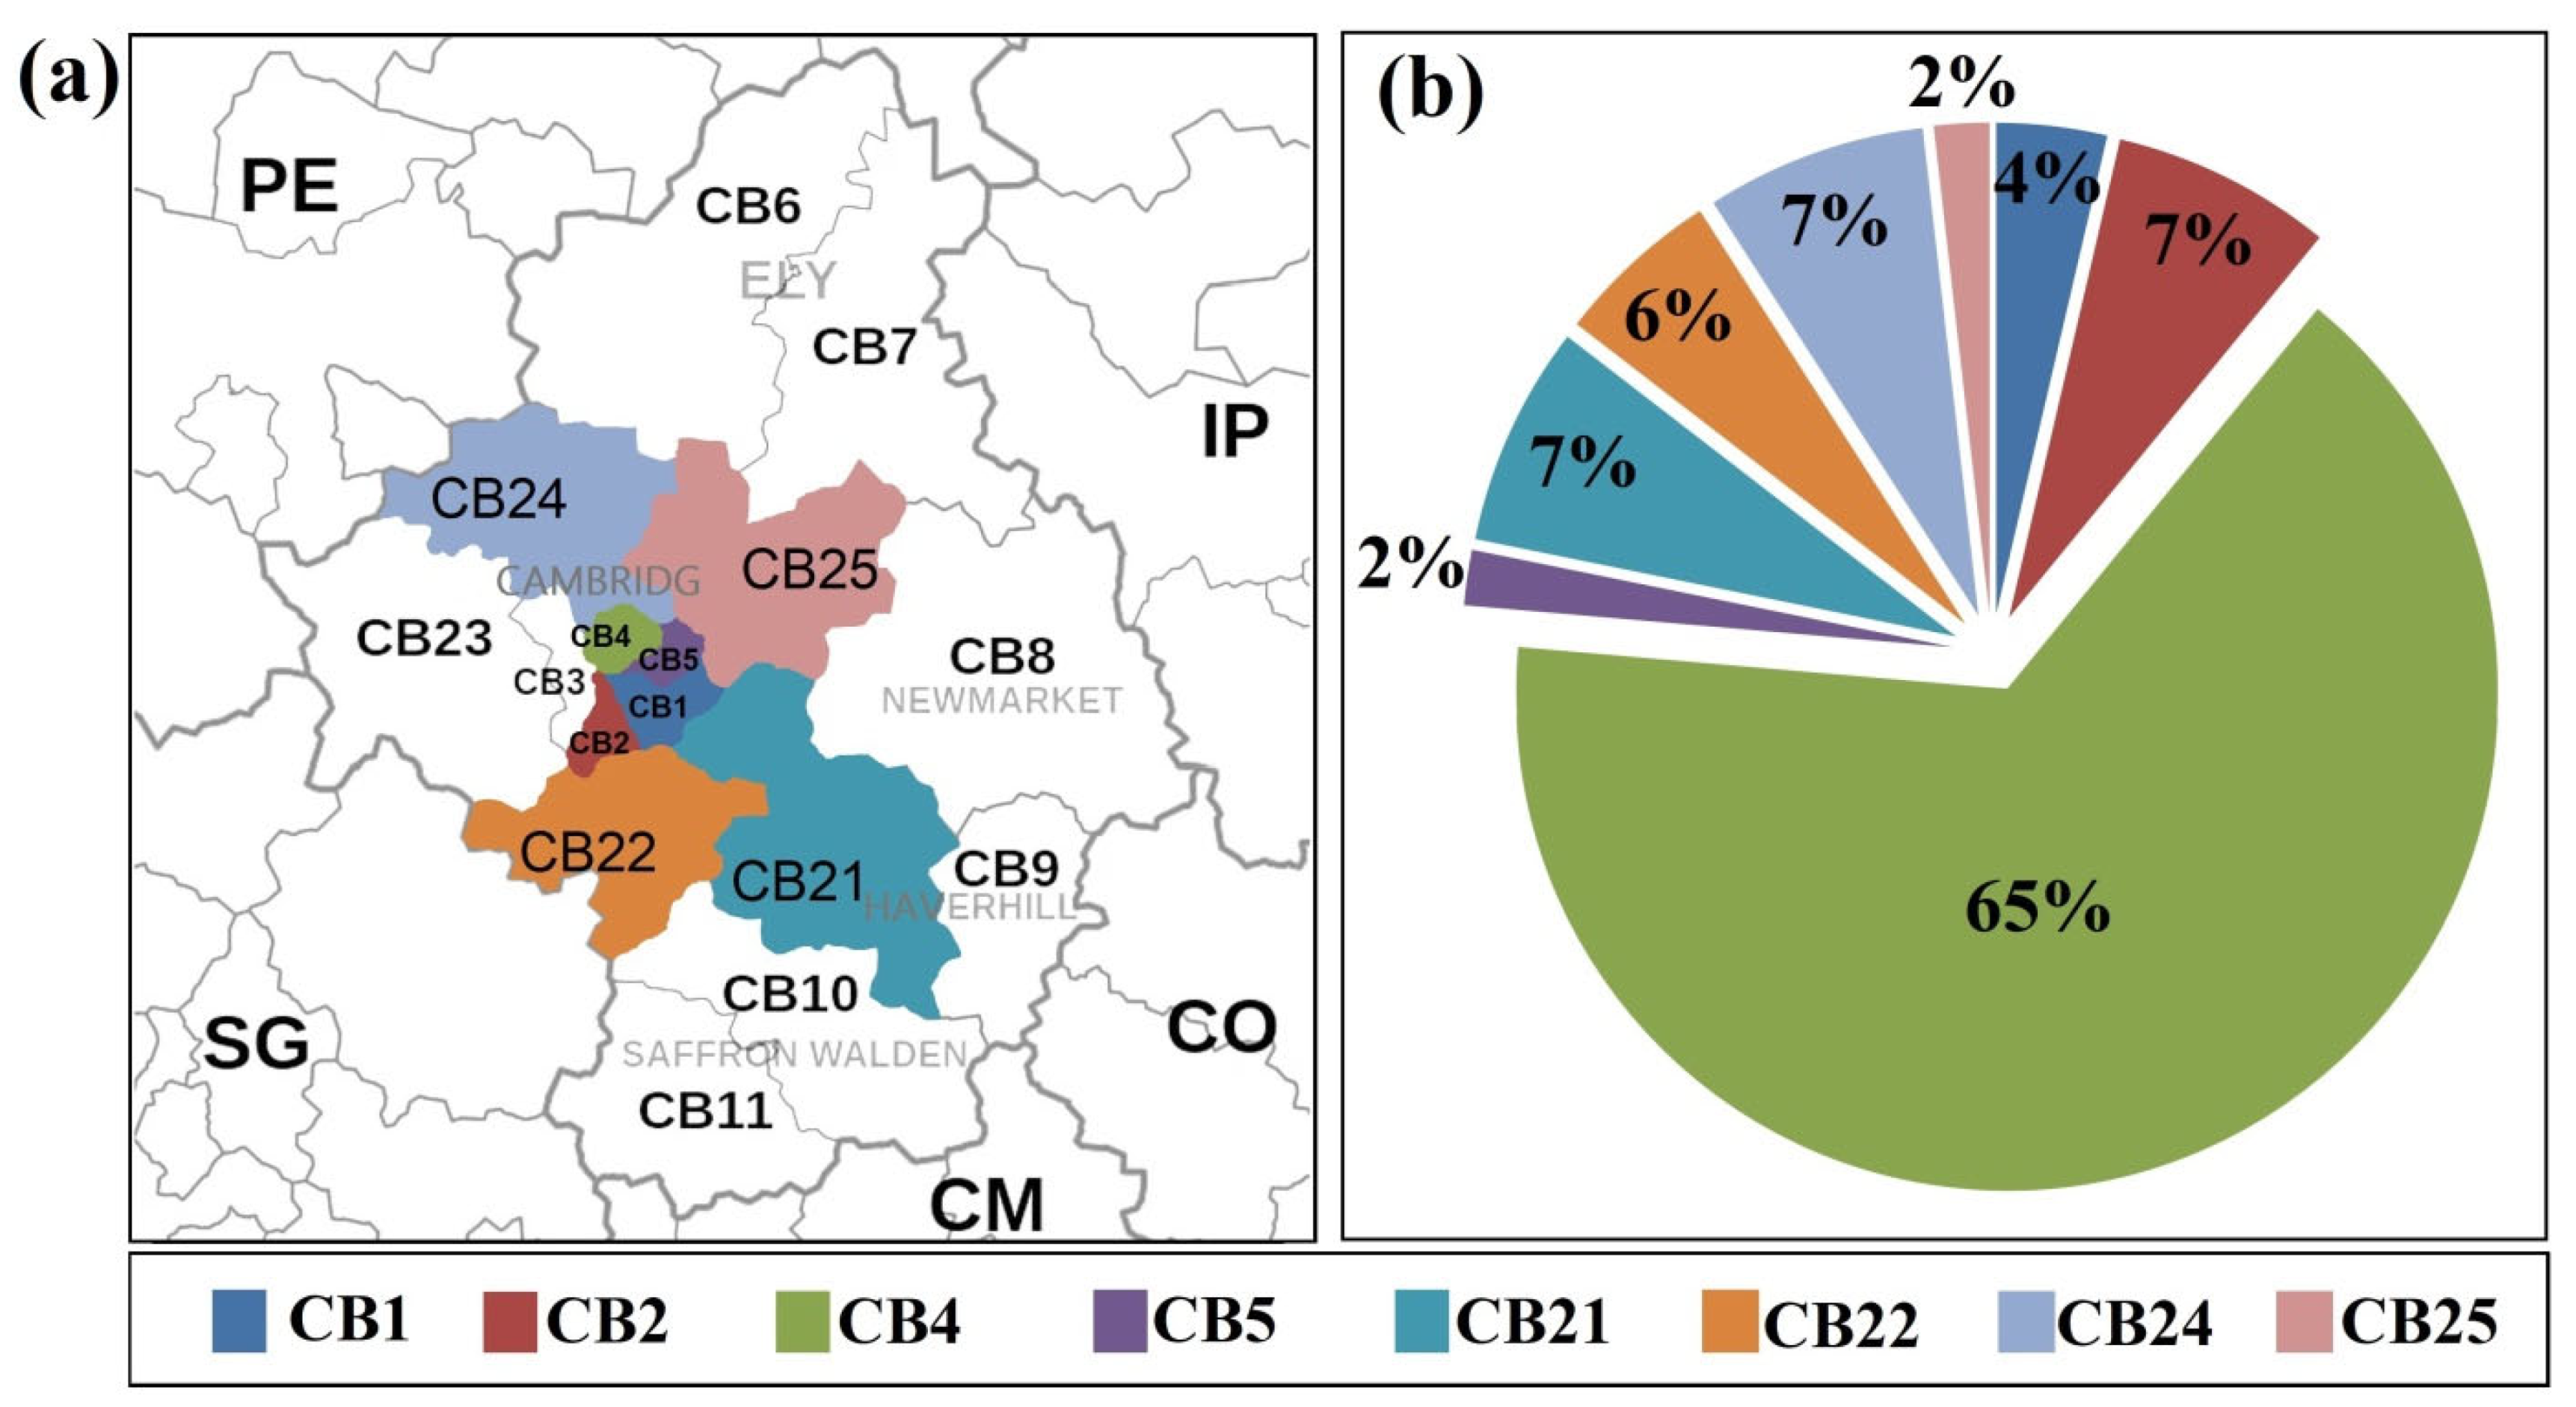
7.1. Geographical Prospective of Silicon Fen

Geographical location is an important issue influencing the competitive position of firms in the global market [65,66]. In this context, clusters are defined as geographic concentrations of interconnected companies, providing a driving force for regional economic growth [67,68]. In order to analyse the technological bond between UoC and SF firms, it is important to determine the geographical boundaries of SF. In the prior literature, SF is described as a ‘cluster of creativity’ [29] since companies located in this cluster are often Knowledge-based firms. For instance, through in-depth interviews with executives of software companies located in SF, Rose et al. [28] concluded that the most significant innovation drivers in these firms are based on knowledge and innovation management. However, such literature does not provide any specific geographical border for SF. In the current study, we define a border for SF in order to limit the evaluations to those companies located in the defined area.
Silicon Fen, which is often referred to as an area bounded by Ely, Newmarket, Saffron Walden, Royston and Huntingdon, all around the University of Cambridge, accommodates around 1400 high-technology companies, employing around 50,000 employees [69]. In this study, Silicon Fen is considered the area in the UK with a postcode starting with CB, containing 15 districts. This region includes Cambridge and surrounding areas. The expansion of SF beyond the city of Cambridge could largely be influenced by the high costs associated with lands and buildings within the city. Therefore, most of the companies are based in science parks/research centres that ring the city, including Granta Park, Cambridge Business Park, Melbourn Science Park, Cambourne Business Park, Colworth Park, Evolut Business, Park, Cromelea Business Park, St John’s Innovation Centre, and the Babraham Bio-incubator [9,70,71,72,73,74,75,76,77]. The presence of SF firms in Science Parks around Cambridge provides evidence for the contribution of such firms in the regional developments, including the generation of jobs, new technologies and the revitalisation of the local economy as suggested by the United Kingdom Science Park Association (UKSPA). While the role of universities in the performance of science parks has been studied in several cases [25], the role of UoC in SF performance has received little to no attention in the literature. This study aims to shed light on this less-studied issue by evaluating the technological closeness between these two sectors, as described in the next sections.

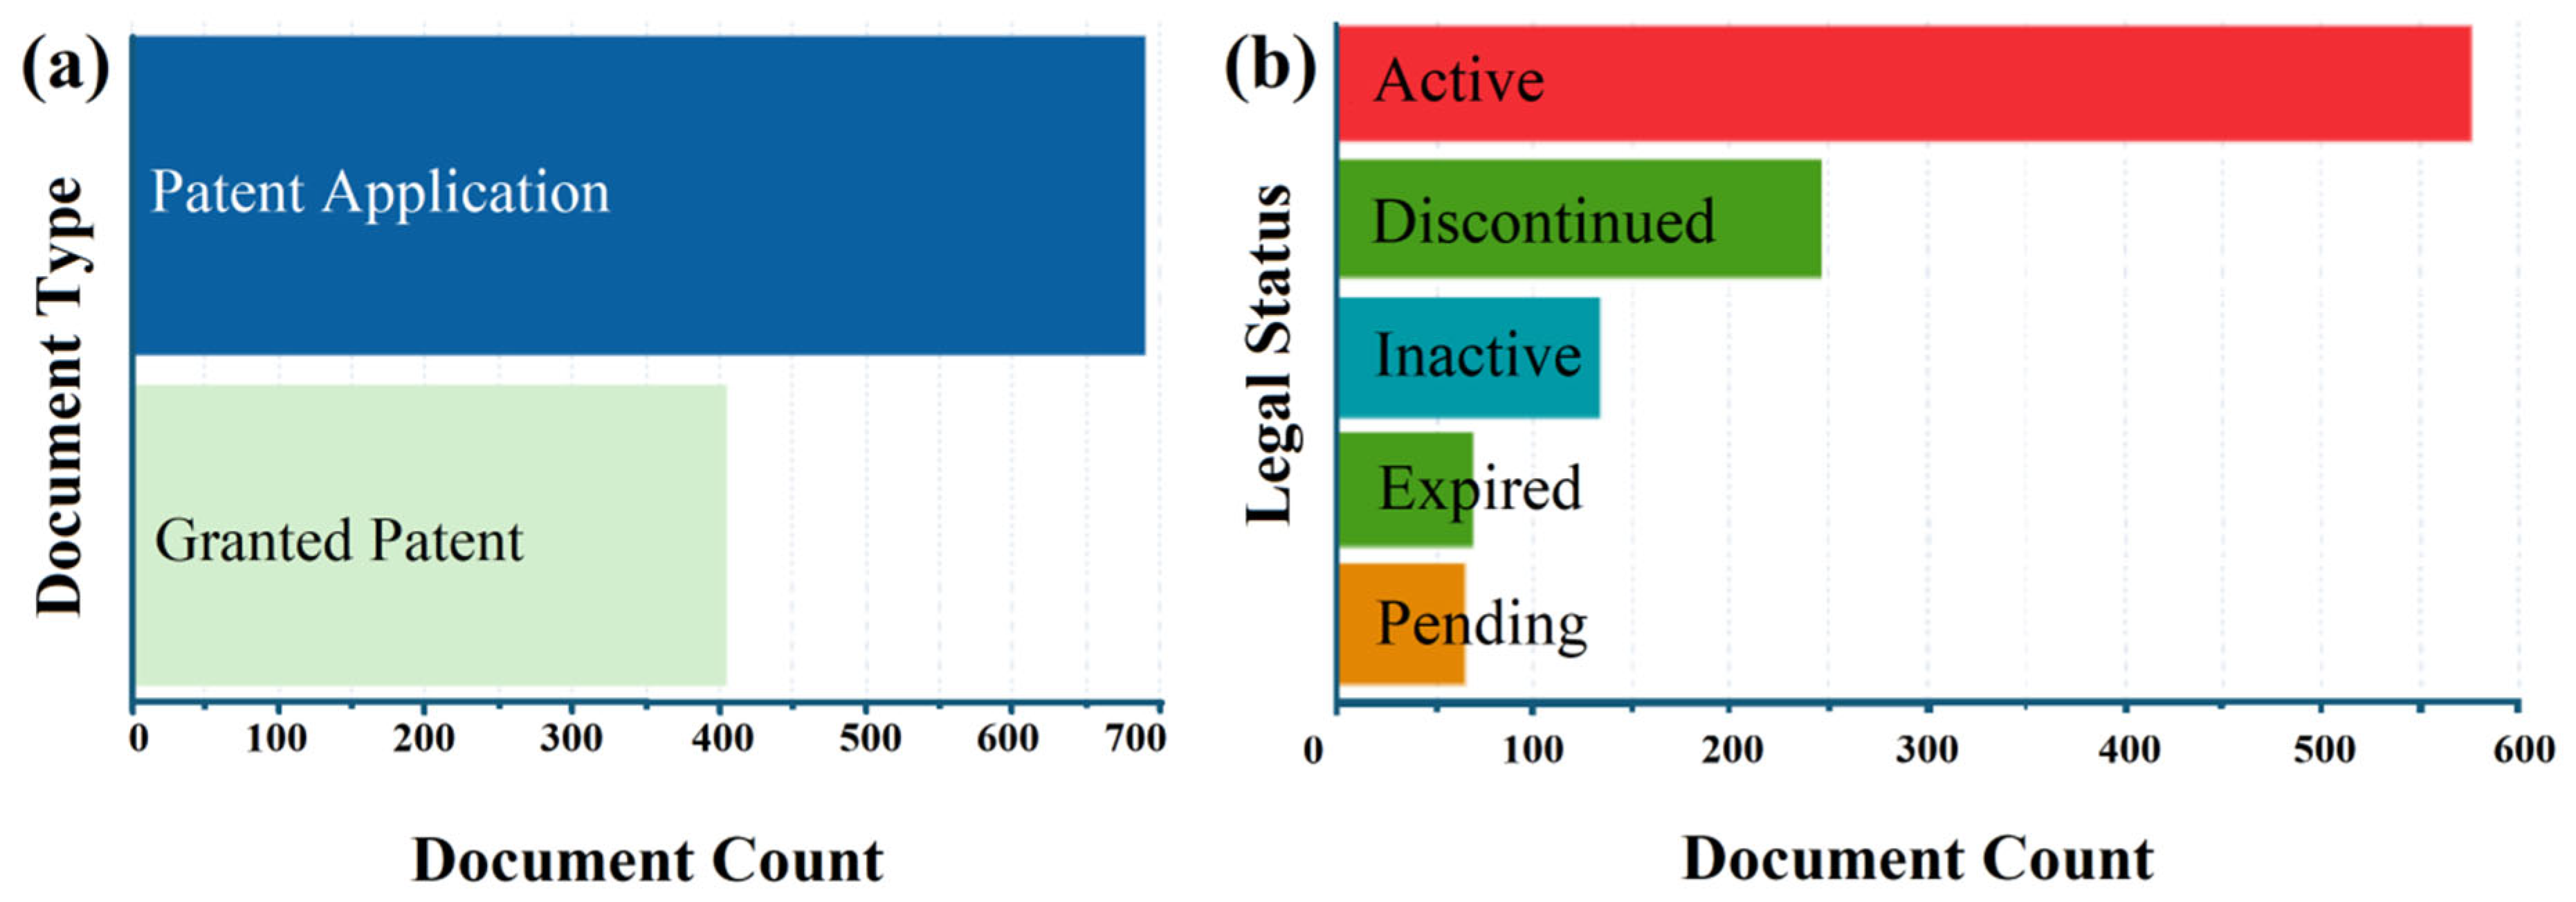
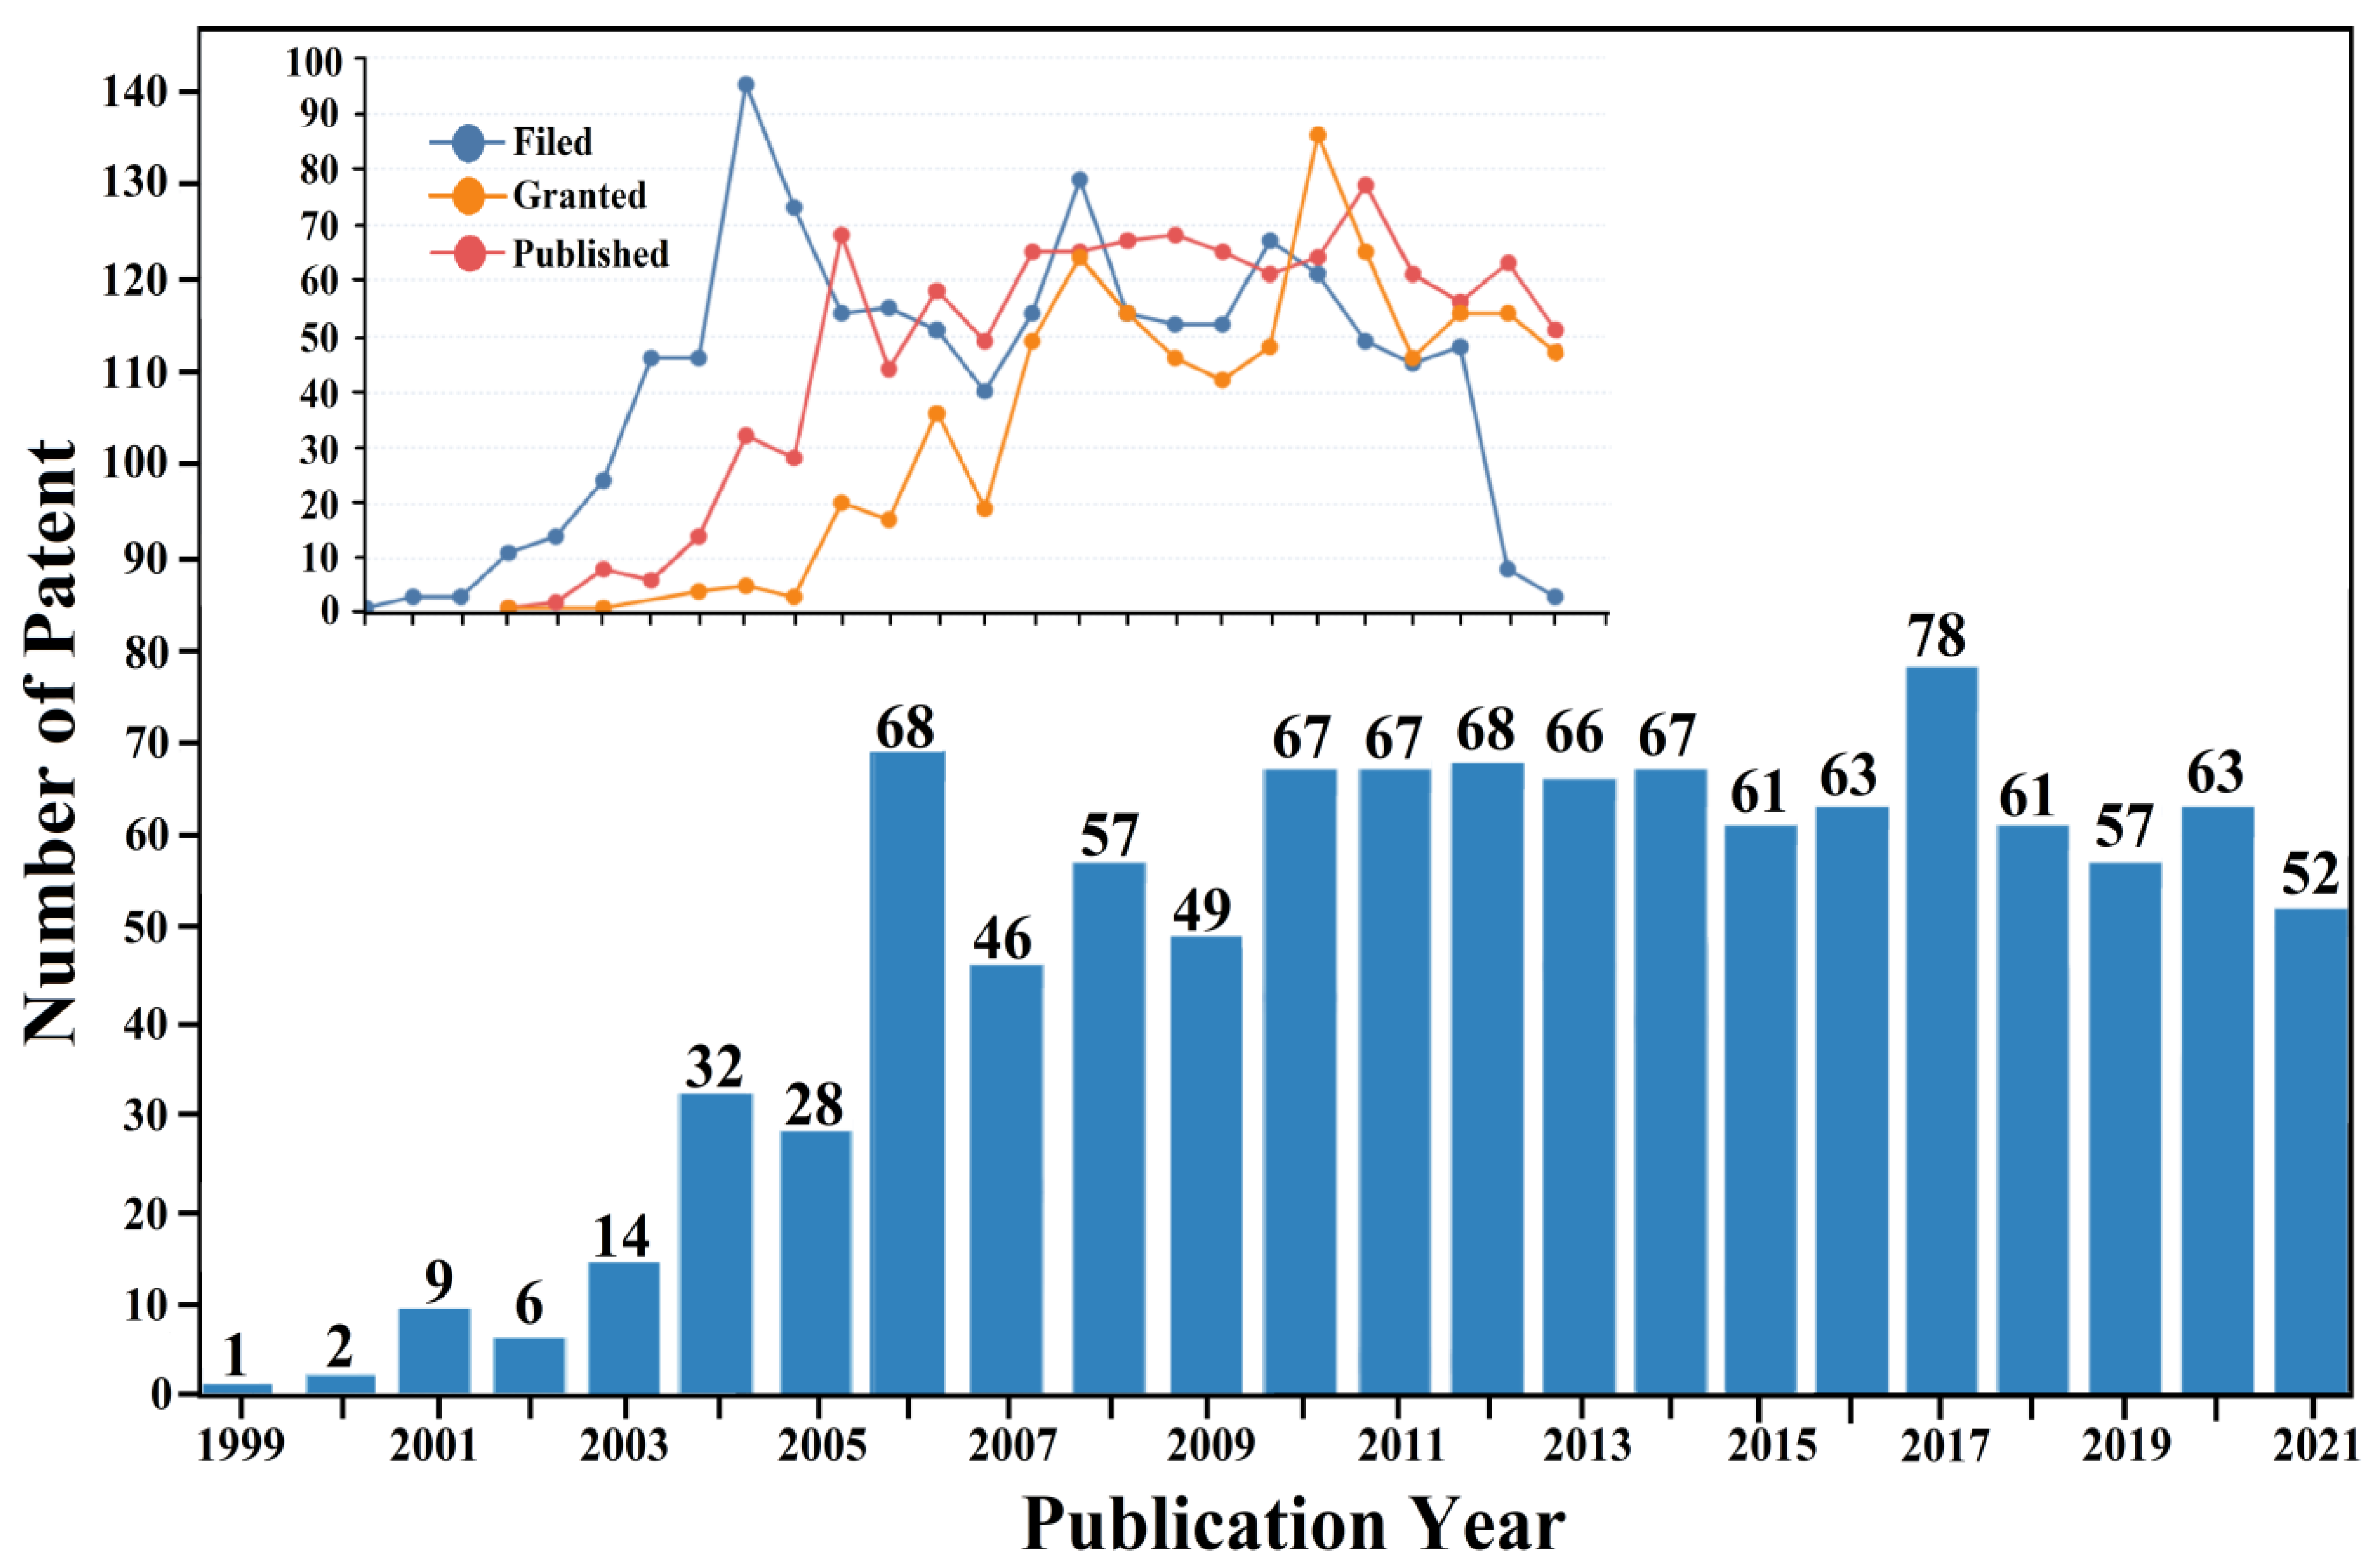
7.2. Overview of Patents Generated by UoC

Figure 1a shows the number of patents (comprising patent applications and granted patents) owned by UoC published in the period 1999–2021. As can be seen, a total number of 1097 patent documents were generated by UoC during this period, including 520 simple and 507 extended patent families. This indicates the high inventive performance of UoC. A large number of these inventions (48%) are still active (Figure 1b), which demonstrates the high practicality of the generated inventions.
Figure 2 shows the number of patents in each year in this period. It is evident that the overall number of patents has risen from only 1 in 1999 to 67 in 2010. Then, the number of patents obtained each year is almost constant, with 63 patents in 2020. There is a slight decline in the number of patents in 2021 (52), which could be due to the outbreak of the COVID-19 pandemic that restricted research and development in the UK. The maximum number of patents was obtained in 2017, with a total of 78. The inset of Figure 2 shows the number of filed, granted and published patents. According to this figure, the number of filed patents substantially reduced from 48 in 2019 to 8 in 2020 and only 4 in 2021. This observation strongly confirms the limitation in academic discovery caused by the pandemic.

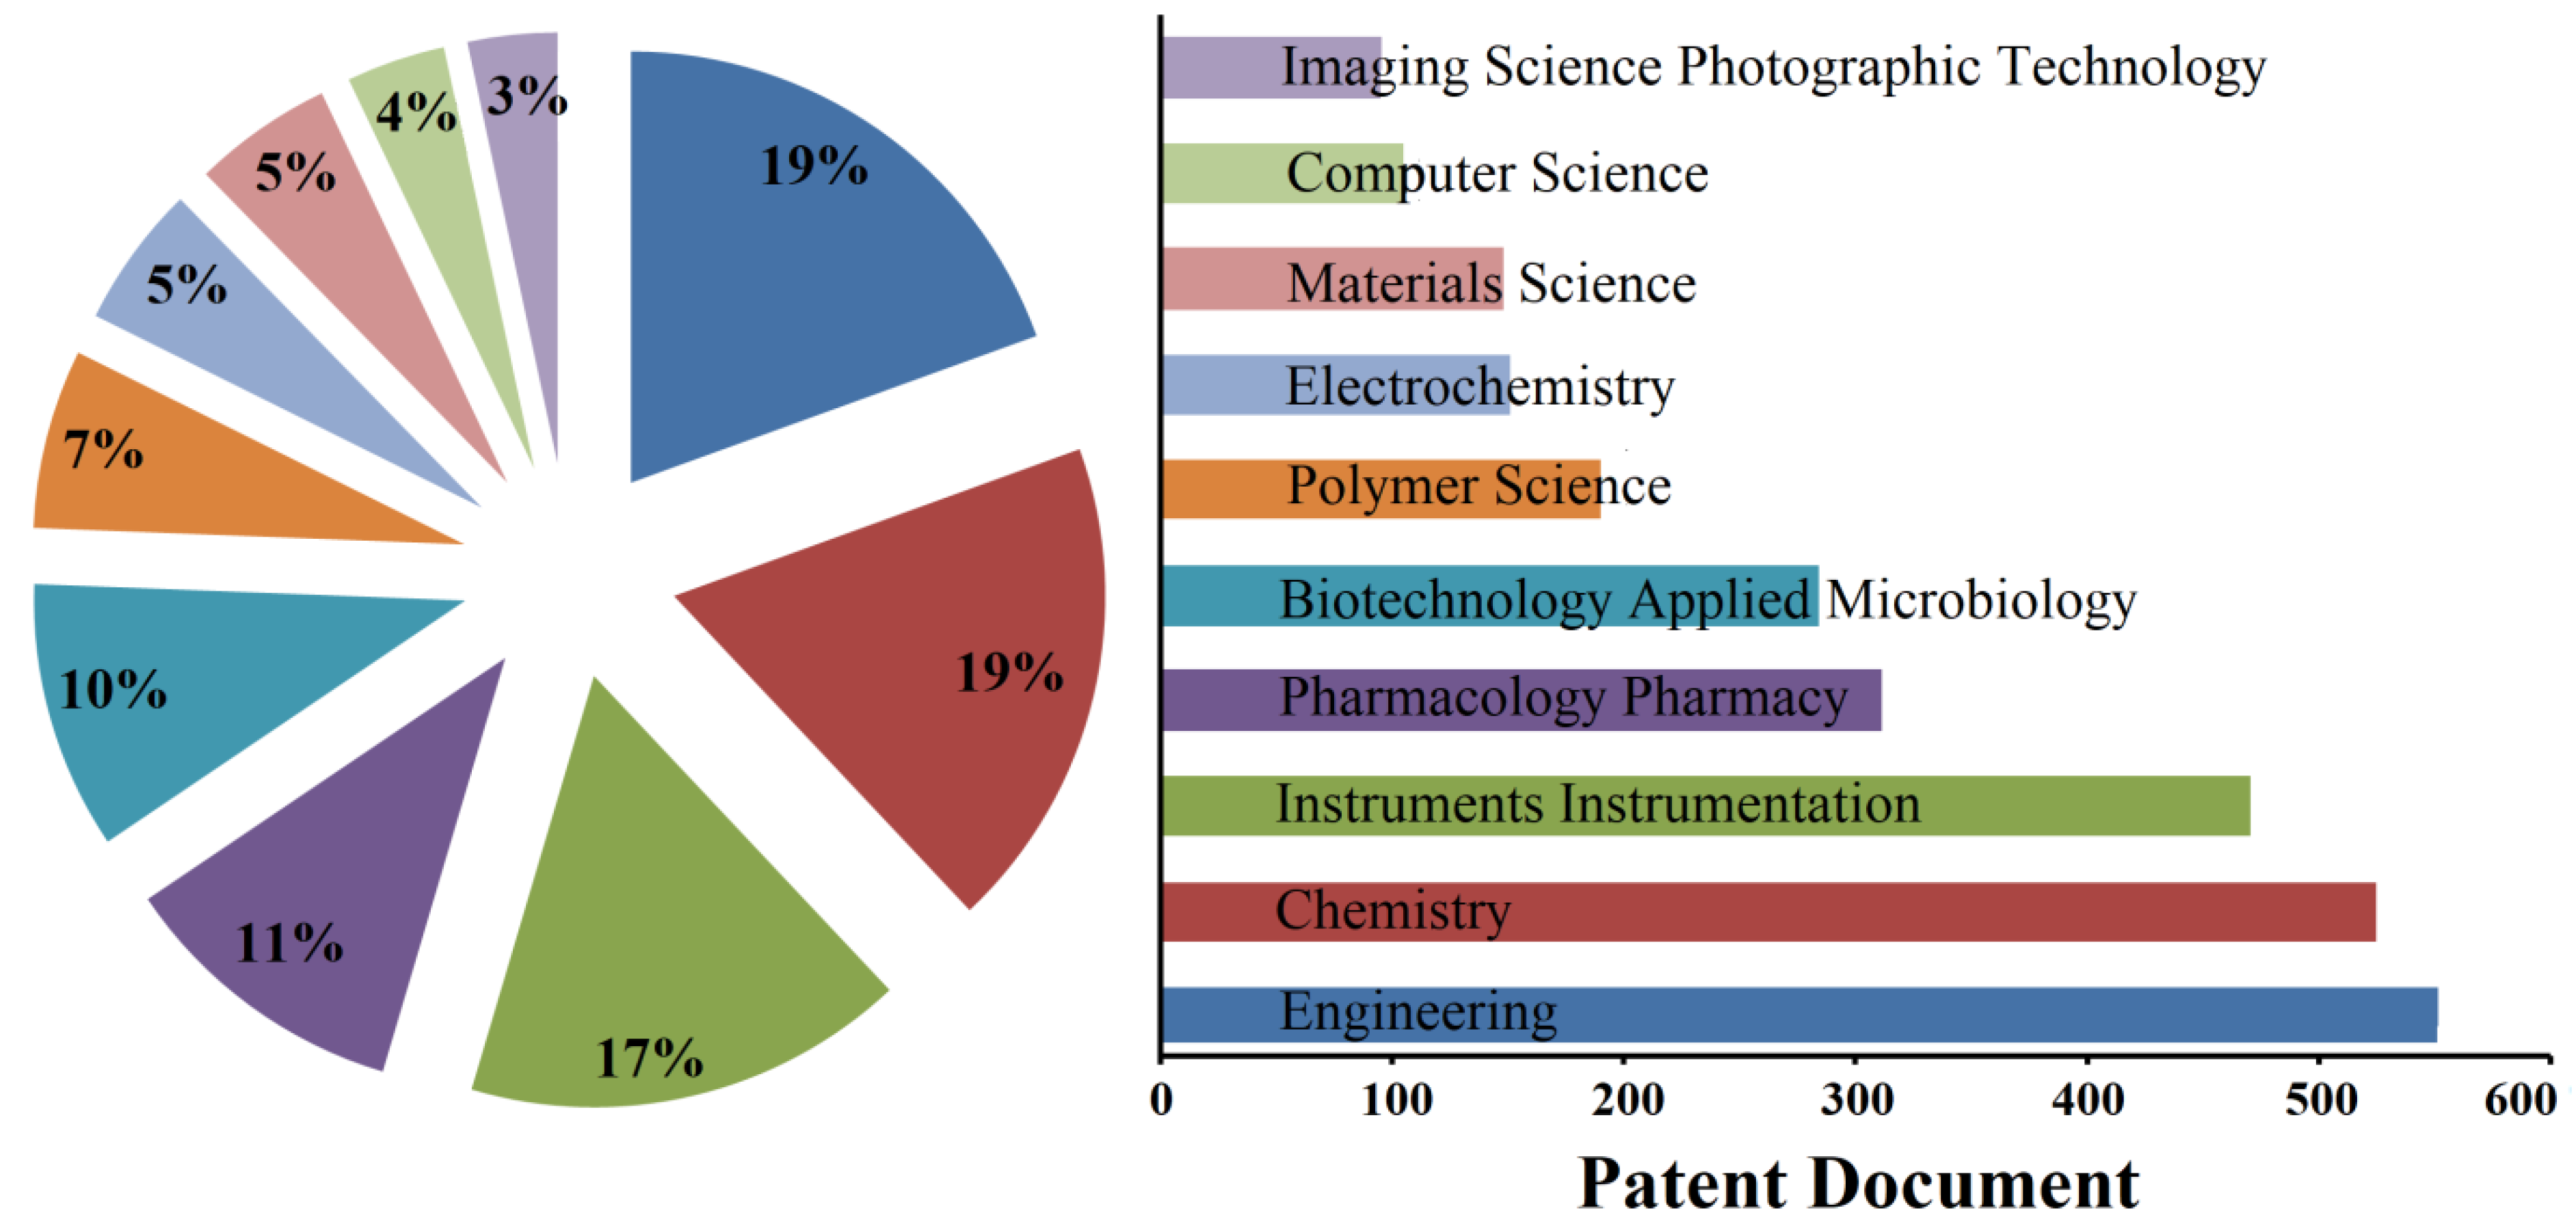
7.3. Technological Field of Patents

The field of invention highlights the corresponding technological sector. Therefore, the analysis of patent fields can provide a powerful tool for tracking technological developments [78]. Figure 3 shows the invention fields of all patents/patent applications generated by UoC in the time period 1999–2021. There are 23 invention fields in the Derwent Innovation index, and for simplicity, only the top ten invention areas are presented, covering the vast majority of the patents/patent applications owned by UoC. These fields include Engineering (550 documents), Chemistry (524 documents), Instruments/Instrumentation (469 documents), Pharmacology/Pharmacy (310 Documents), Biotechnology/Applied Microbiology (285 documents), Polymers Science (190 documents), Electrochemistry (151 documents), Materials Science (148), Computer Science (105) and Imaging Science/Photographic Technology (95). It should be noted that a patent might involve more than one invention area, which justifies the total number of documents per area of the sector to be higher than the number of total documents.

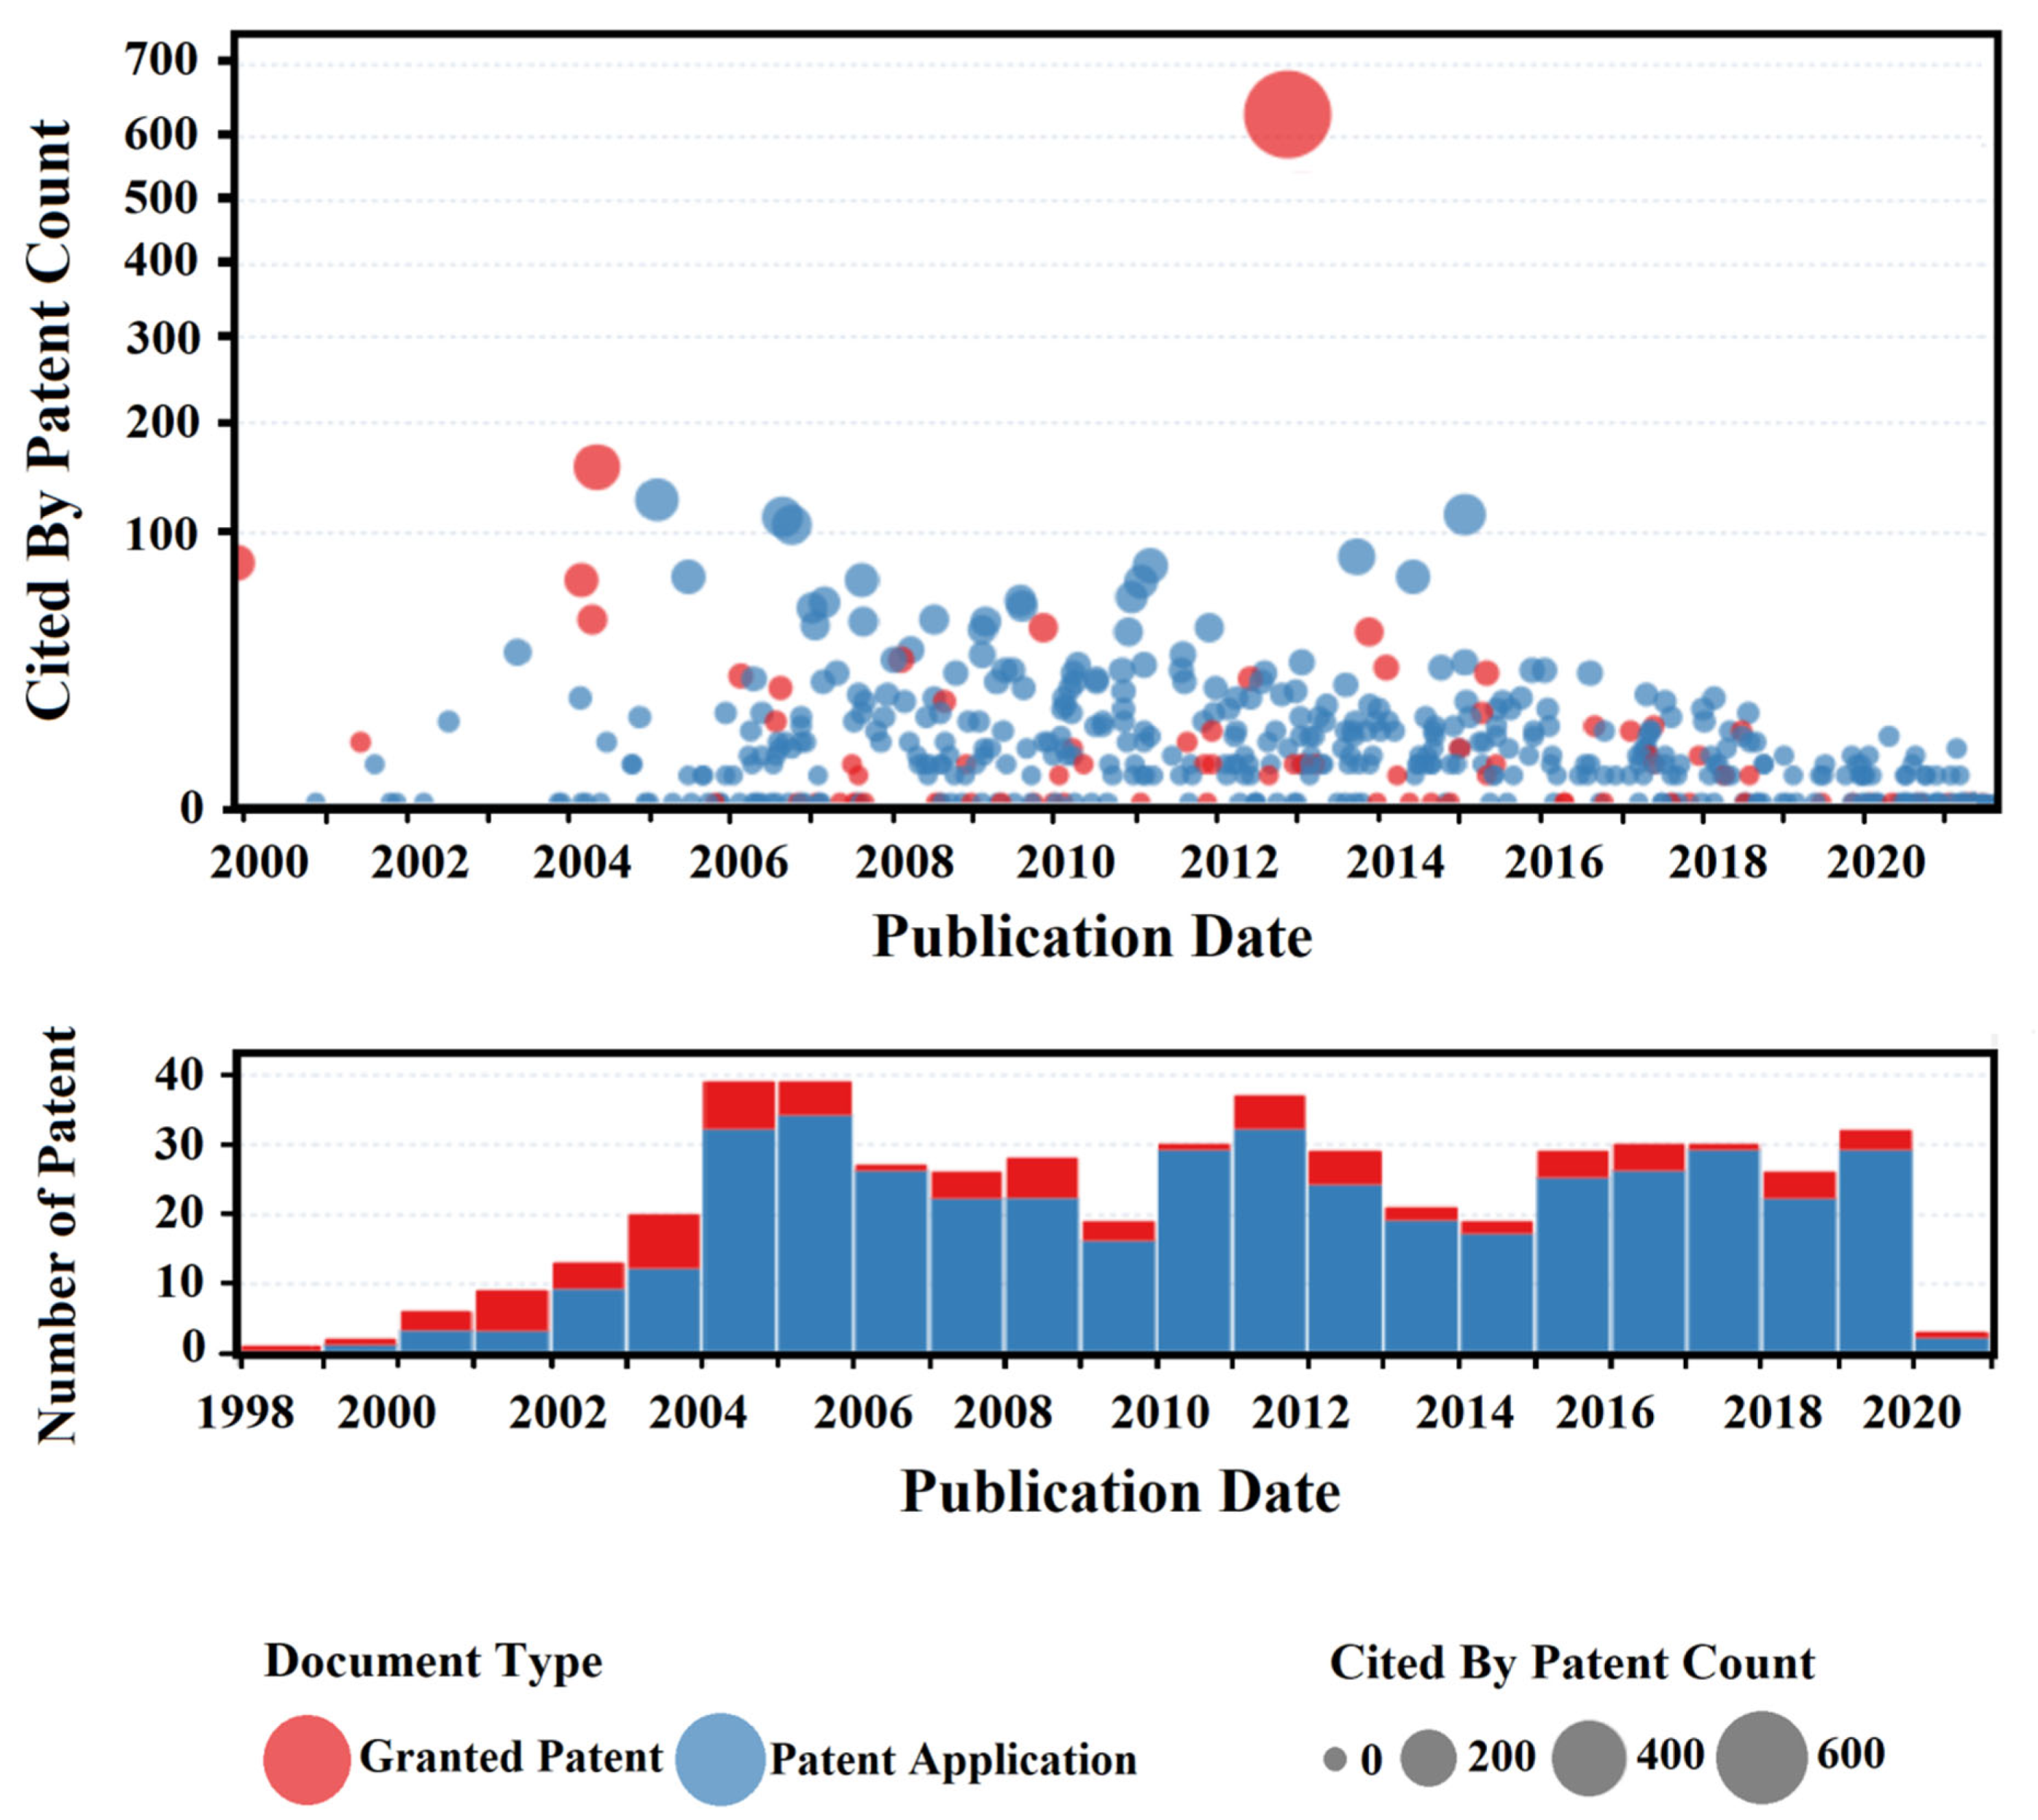
7.4. Patent Citations

On-going research developments often pave the way for future advancements while taking a clue from past research developments [79]. The latter can be found as citations that appeared in the subsequent related patents. Such citations are an indication of the influence of prior art in the field on the following inventions. As such, patent citations relate new developments to the previous works upon which these developments are built. These citations provide a measure to identify the influential value of the cited patent. Patents that receive a greater number of citations are considered to possess greater commercial value [80,81]. Table 2 shows the list of the top 10 most cited UoC patents, cited by other patents. The related Cooperative Patent Classification (CPC) can also be seen in the table. According to Figure 4, a total of 1097 patents generated by UoC (granted and application) have received 5824 citations by other patents. Table 2 shows the top-ten-granted patents/patent applications generated by UoC with the highest number of patent citations, as well as the CPC of each patent.
As can be seen from Figure 4 and Table 2, six patents have received more than 100 patent citations. These patents belong to five technical sectors as Material Science (49%), Parma/Biotech (24%), Computing and Advanced Electronics (15%), Software (7%) and Engineering Design (5%). Among them, the patent titled “Nanomomaterial polymer compositions and uses thereof, GP-43914807” in the field of “Material Science” has the most citations with a total of 629, and is owned solely by UoC. Interestingly, the second most cited patent shown in Table 2, titled “Aligned polymers for an organic TFT, GP-1842502” in the field of CAE, is co-owned by UoC as well as two companies, namely ETV Capital SA and Flexenable Ltd. The headquarters of these companies are located in Luxemburg, and Silicon Fen, respectively. This result is interesting and shows the positive impact brought about by the geographical proximity of the collaborative university and firm. In the quest to find the possible reason behind this possible impact, we found out that two inventors of this highly cited patent have been employees of the University of Cambridge; namely, Henning Sirringhaus, who has been the Hitachi Professor of Electron Device Physics at the Cavendish Laboratory, and Fellow of Churchill College at UoC. He is also a Board member and Director at Flexenable Ltd. The other inventor of this highly cited patent is Richard Henry, who was a Professor of Physics at the Cavendish Lab of the University of Cambridge from 1995 until 2020. This result indicates the influence of an additional parameter which has not been reported before: In a business cluster formed around a research university, the academics from the university can be directors of the companies located in the cluster, facilitating the knowledge transfer from university to industry. In our case, this enhancement could be detected by the creation of a highly-cited patent co-own by the University and an SF firm. The other patents listed in Table 2 are owned either by UoC or co-owned by UoC and institutes located in the UK, USA and Korea in the field of CAE and P/B, none of which with SF firms.

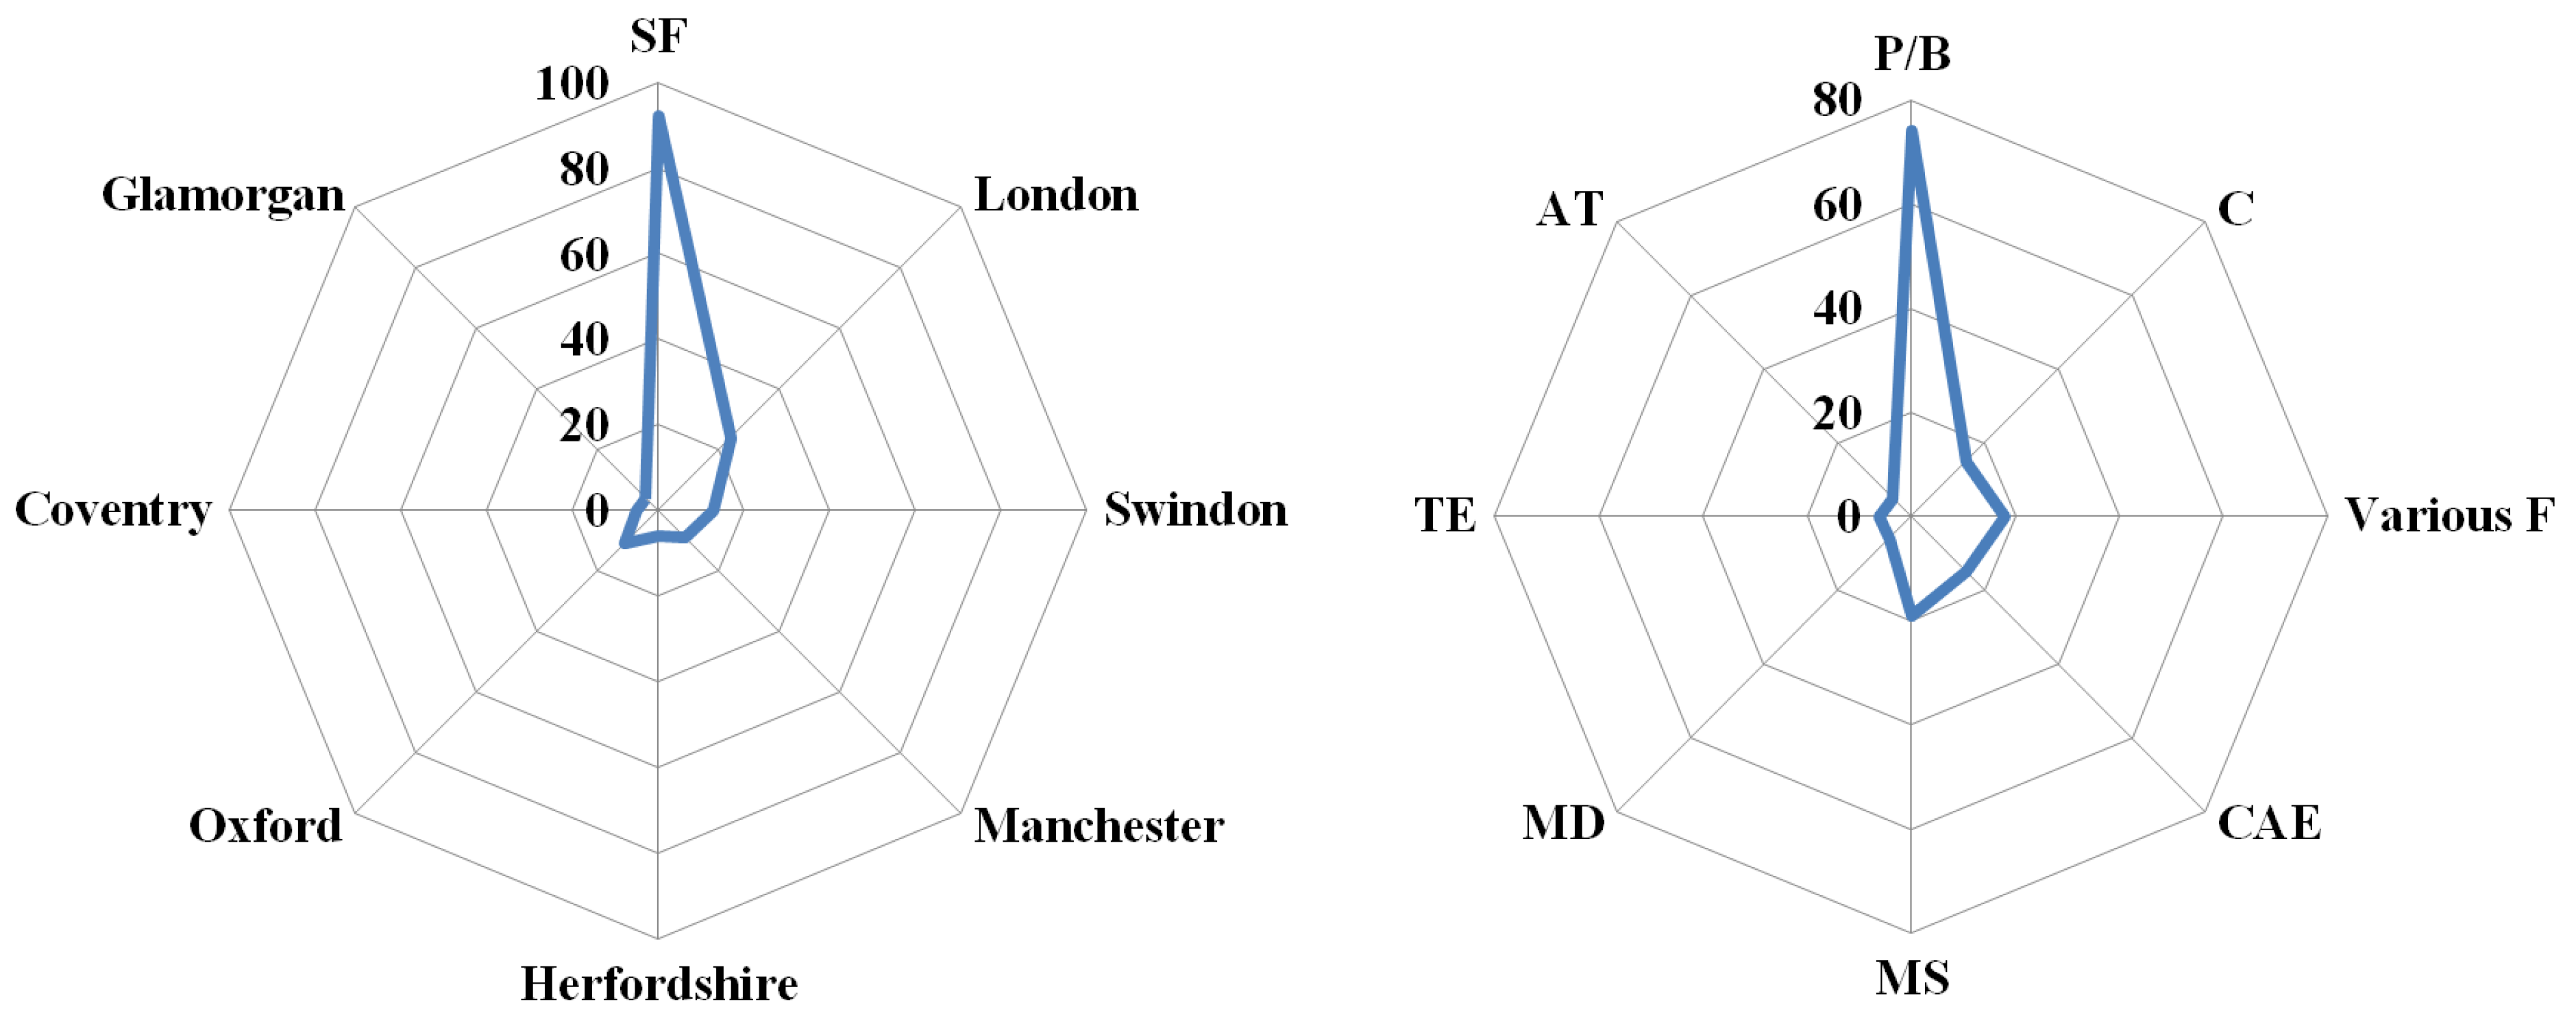
7.5. Joint Patents and Geographical Proximity

Table 3 and Figure 5 show the top eighteen UK public/non-public institutions and firms that co-own patents/patent applications with UoC. The location of firms, the number of joint patents and the invention field can also be observed. As can be observed, 84 joint patents, representing 49 per cent of all the joint patents, are made through the collaboration between UoC and companies located in SF, highlighting the importance of co-location in promoting the knowledge transfer between university and industry. Furthermore, it can be observed that 57 per cent of all collaborative firms located in SF are active in the field of Pharm/Biotech, while this value is 35 per cent, counting the entire collaborative companies across the UK. This observation suggests a higher percentage of collaborative Pharm/Biotech firms in SF.

7.6. Patents Co-Owned by UoC and SF Firms

In this section, the patents co-owned by SF firms and UoC are analysed. As mentioned before in this article, Silicon Fen is considered an area in the UK with a postcode starting with CB. The geographical location of this area is shown in Figure 6a, comprising 15 districts with the postcodes CB 1 (10,408 companies), CB2 (6902 companies), CB3 (2618 companies), CB4 (7430 companies), CB5 (3290 companies), CB6 (3887 companies), CB7 (4406 companies), CB8(5497 companies), CB9 (3358 companies), CB10(8216 companies), CB11(2661 companies), CB21 (1941 companies), CB22 (5322, companies), CB23 (4139 companies), CB24 (5073 companies) and CB25 (3725 companies), indicating the presence of 78,873 companies in SF.
A total number of 55 UoC-SF joint patents could be extracted, dating from 2000 to 2021. Figure 6a illustrates the areas in which companies with at least one joint patent with UoC are located. The proportion of the joint patents in each district is shown in Figure 6b. As can be seen, the majority of these joint patents belong to companies located in the CB4 area (65%). This area, which is the smallest district, is the home of Cambridge Science Park, with 7430 companies. This follows by CB2 (7%), CB21 (7%), CB24 (7%), CB22 (6%), CB1 (4%), CB5 (2%) and CB25 (2%). In particular, Flexenable Ltd. (sector: CAE), which is the co-owner of the second-most-cited joint patent with UoC, is located in the CB4 postcode. This result shows the importance of science parks located in the vicinity of major universities in promoting the university-industry knowledge transfer. Other companies that have joint patents with UoC located in CB4 comprise of Huawei Technologies Co Ltd. (sector: COM), Nyobolt Ltd. (sector: P/B), Plastic Logic (sector: CAE) and Psynova Neurotech Ltd. (sector: P/B).

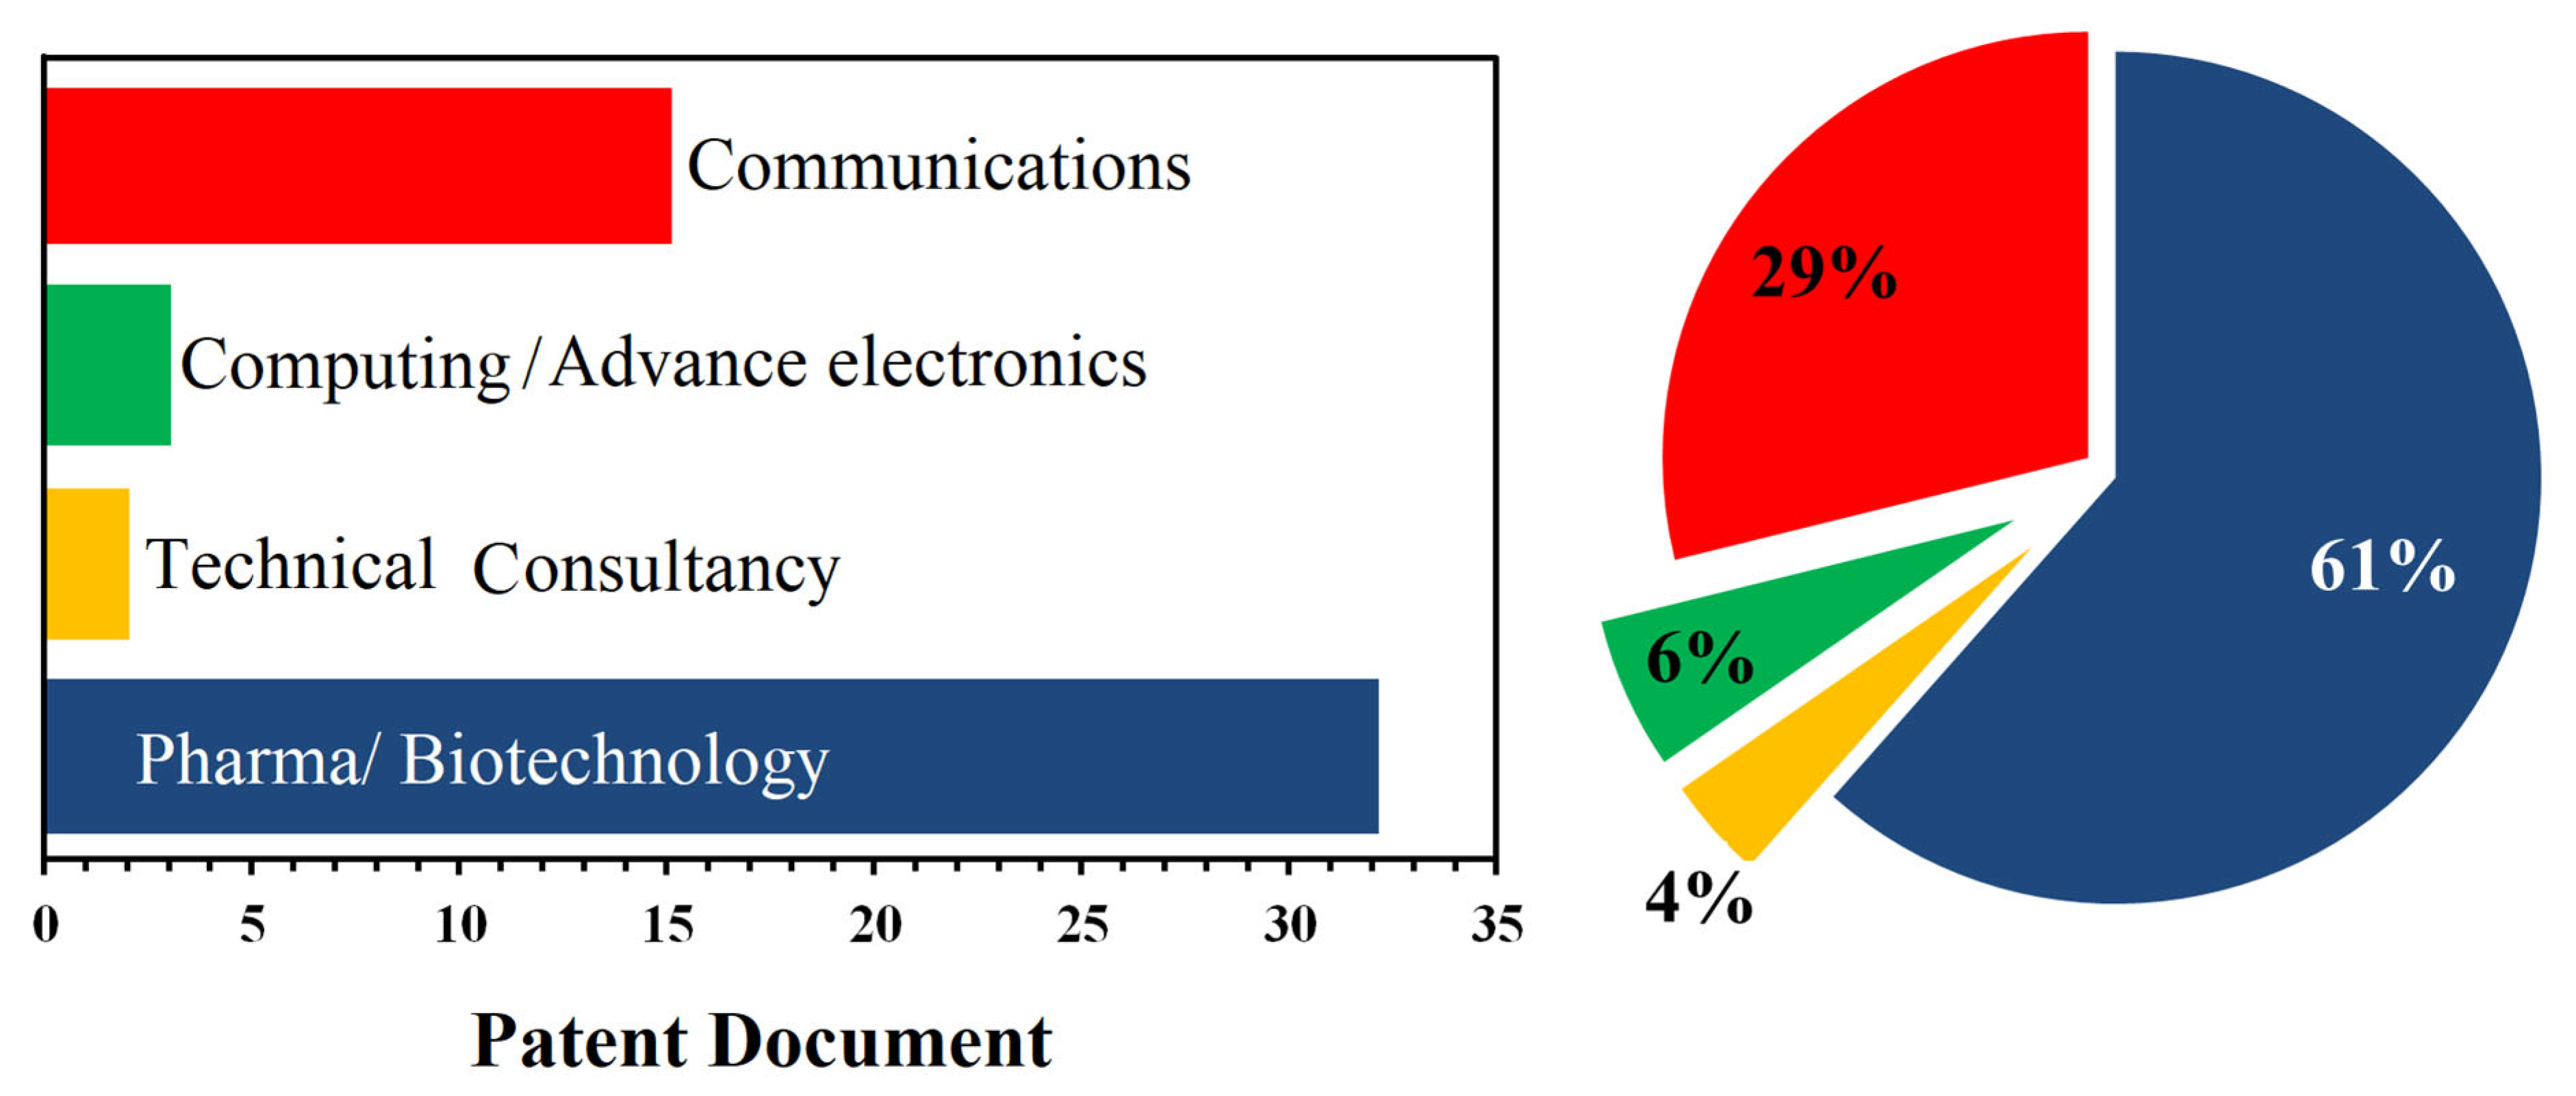
7.7. Business Sector and Number of Joint Patents

In this study, SF firms are categorised into different sectors based on the Standard Industrial Classification (SIC). SIC was first introduced in the UK in 1948 for the classification of companies based on the economic activity in which they engage. This classification provides the means for the analysis of information related to business activities and for classifying industrial activities. The current SIC system was introduced in 2007, published by the Office for National Statistics (ONS), which is the UK’s producer of official statistics, and widely used to classify the research and development sectors in the UK [82]. These sectors comprise of Aerospace and Transport, Communications, Computing and Advanced Electronics, Creative Content, High Tech Financial Services, IT Services, Medical Devices, Tech. Consultancy, Pharma/Biotech and Software.
Figure 7 shows the number of joint patents published by UoC and SF companies, based on the sector of the companies. As can be seen, during the time period from 1999 to 2021, the majority of joint patents (61%) belonged to the Pharma/Biotech sector of SF, while the Communications sector accommodates only 29% of the total joint patents. Then, there is a sharp gap, where Computing and Advance Electronics and Tech Consultancy Services accommodate only six and four per cent of the total joint patents, respectively. Therefore, we can draw the conclusion that UoC-SF collaboration has led to the generation of joint patents, and the majority of such joint patents are made in collaboration with the Pharma/Biotech sector of SF, followed by Communications, Computing and Advance Electronics, and Tech Consultancy Services sectors at considerably less extent. With this in mind, we examined the technical collaboration strength between UoC and the SF firms in order to identify any meaningful relationship between the number of joint articles and the technological bonds between UoC and the firms.

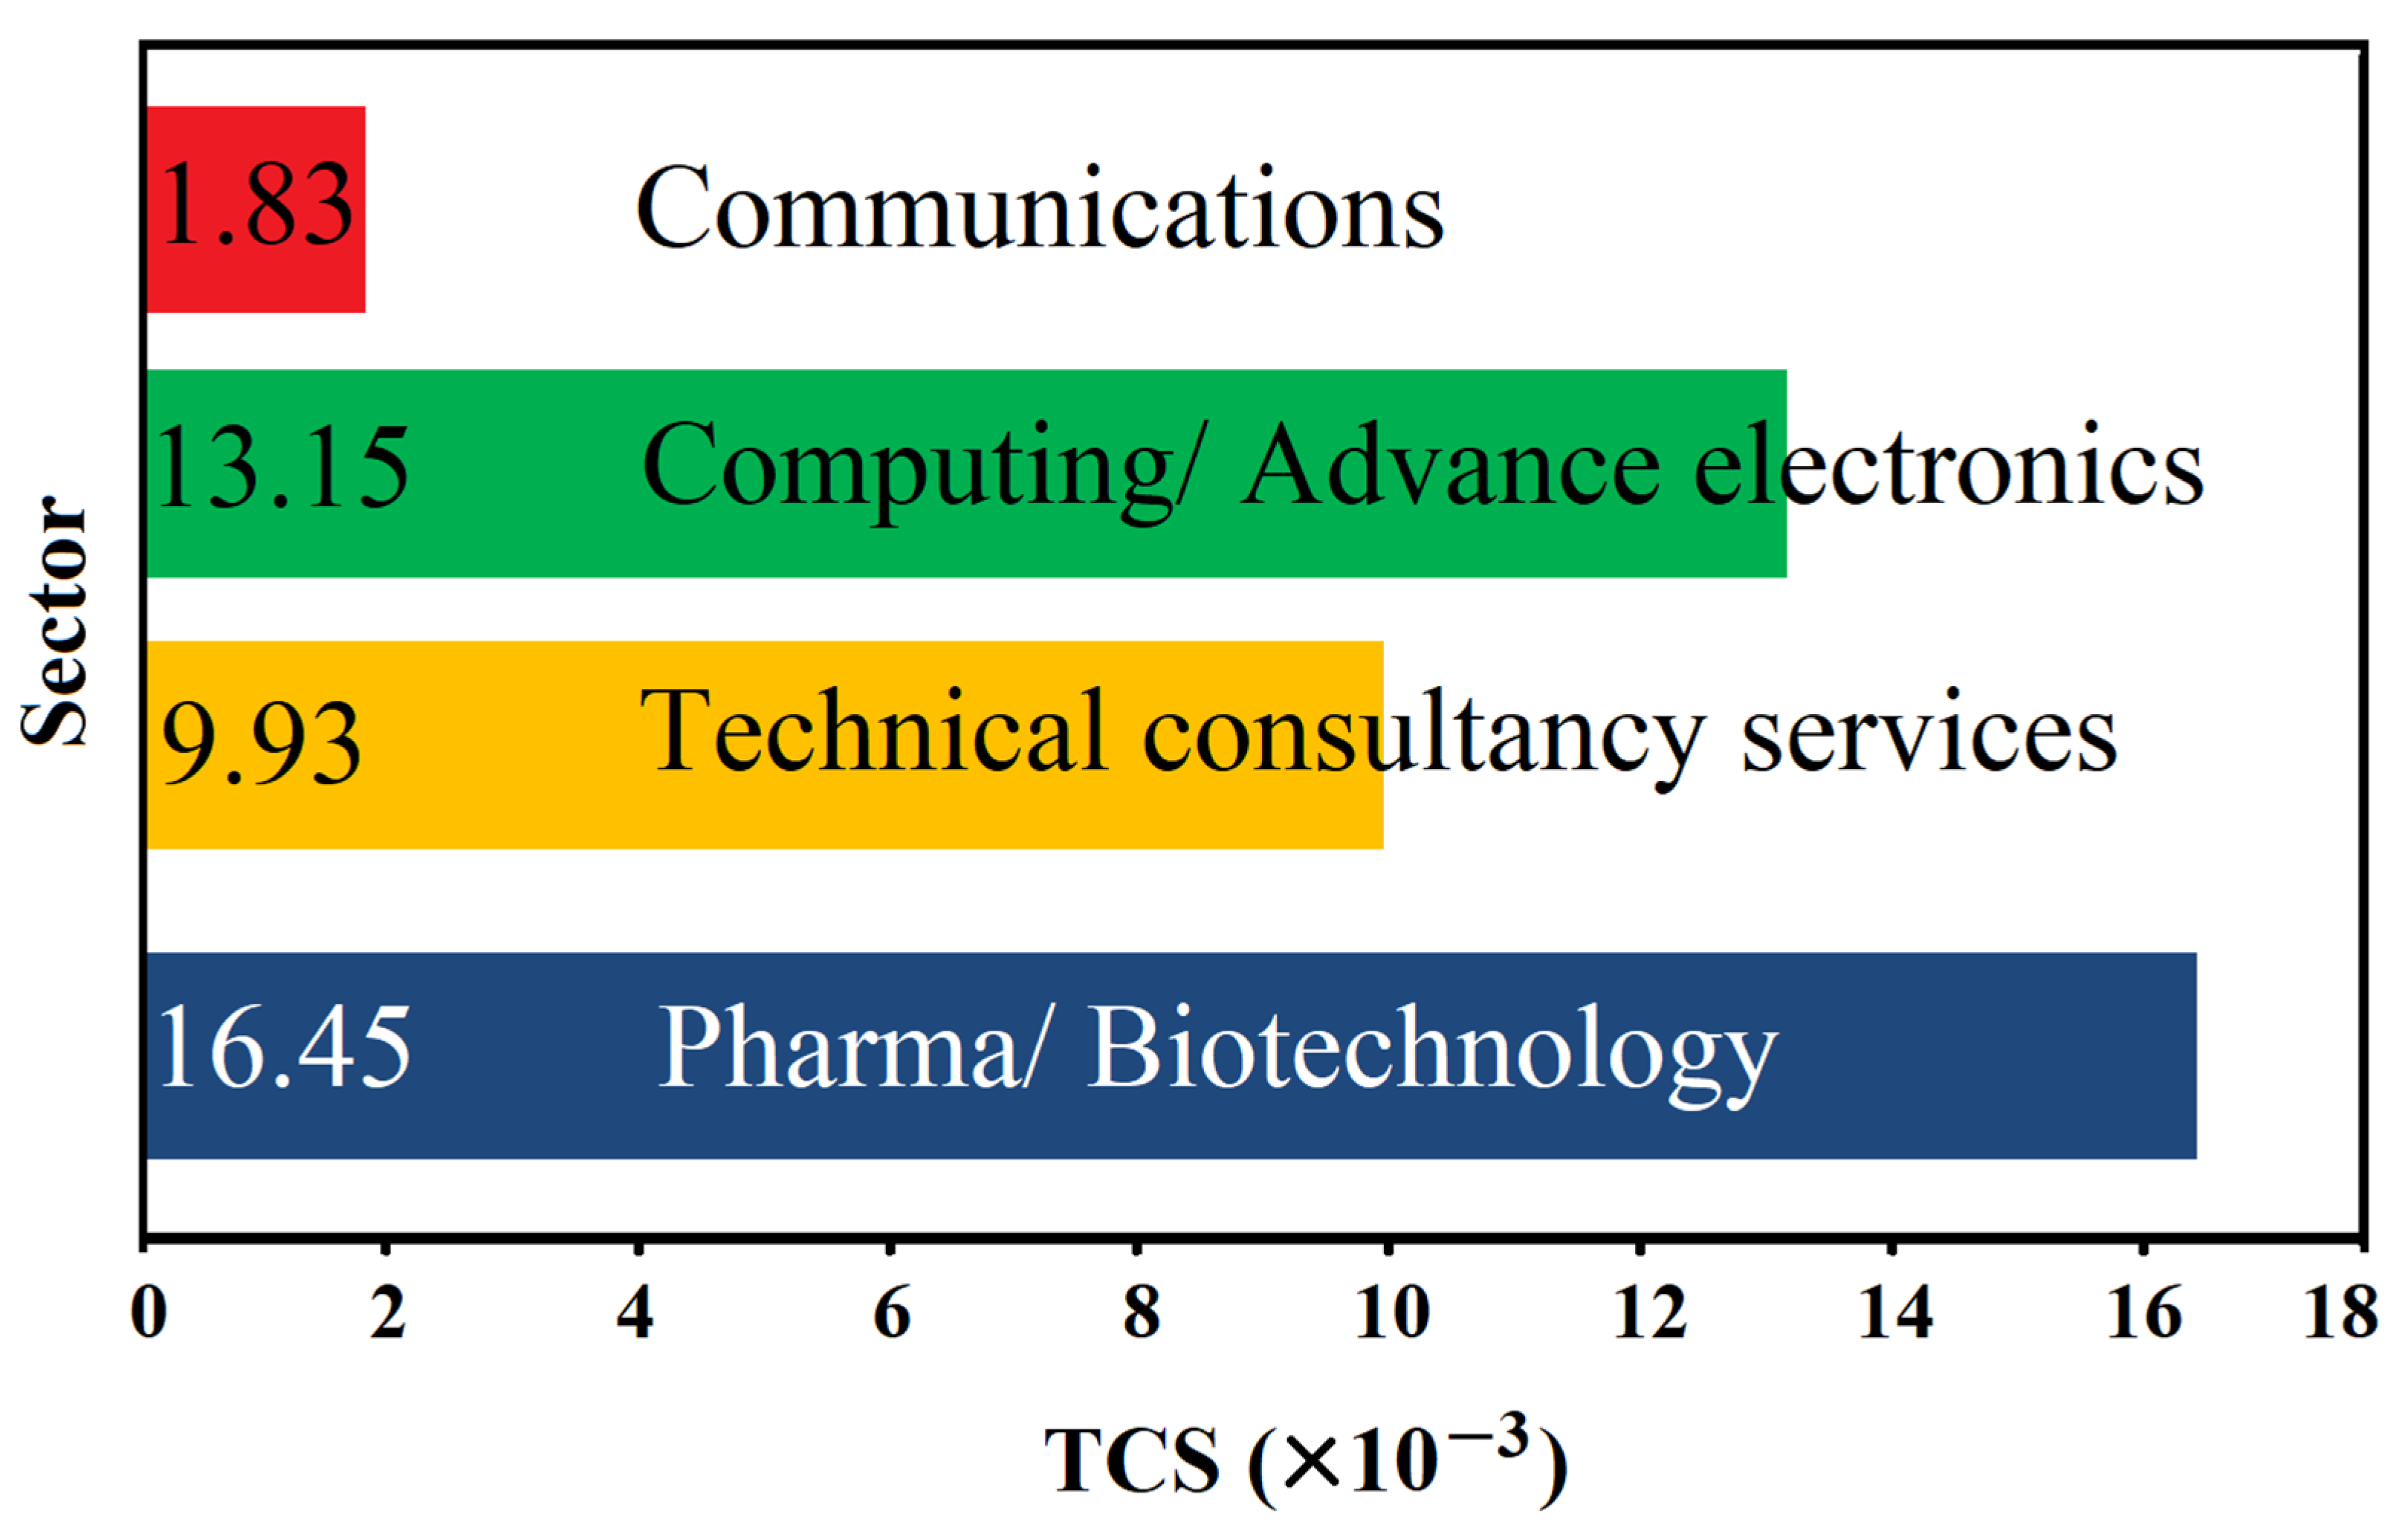
7.8. Technological Collaboration Strength

In this study, the technological collaboration strength (TCS) between UoC and SF firms was measured using Equation (1) as the function of the number of joint patents as well as the total number of patents generated by each party in the period between 1999 to 2021. TCS shows the relative strength of the bond between collaborating parties involved in innovation and intellectual property generation. Values of TCS associated with the collaboration between UoC and SF firms based on the sector of firms are presented in Figure 8. As can be seen, the Pharma/Biotech sector has the highest TCS value of 16.45 × 10⁻³, followed by Computing and Advance Electronics (9.93 × 10⁻³) and Tech Consultancy Service (9.93 × 10⁻³). Furthermore, it is clear that TCS associated with UoC and the Communications sector of SF has the least value among all sectors (1.83 × 10⁻³).

8. Discussion

Patents often reflect innovative works contributing to the creation of technical knowledge. Consequently, co-patenting is an important outcome of the university–industry collaboration, leading to technological developments. As such, the analysis of joint patent data enhances the understanding of transnational knowledge flows [83,84,85]. Therefore, the analysis of patents generated jointly by academia and university can objectively evaluate the technological collaboration between enterprises and academia. The University of Cambridge is a major global research university located in the Cambridge area, the same location as SF. The latter is the main cluster of high-tech companies. This work examines the technological bonds between various sectors of SF and UoC by means of patent analysis. First, we discuss the patent generation performance of UoC.

8.1. Patenting and Co-Patenting Performance of UoC

From Figure 2, it is evident that the overall number of patents generated by UoC has risen from only 1 in 1999 to 67 in 2010. Then, the number of patents obtained each year is almost constant, with 63 patents in 2020. This event can be explained based on the “Third Mission” policy adopted by the British Government to promote the economic and social role of universities and their corresponding contribution to communities and territories [86]. In the UK, the governmental policies were revised in the 1980s to support the Third Mission role, requiring that universities take on a more commercial approach [87]. Therefore, the British Government has increasingly been calling upon universities to play a more direct role in supporting economic development based on the society—Government’s Third Mission, considering more efficient evaluation measures [88]. Therefore, intellectual property, and specifically patents, have become increasingly important as indicators of the commercialisation activities of research institutes in the knowledge-based economy of the UK. In this context, patents can be considered as the indicator of fulfilling the Third Mission activities of universities, contributing to their accountability towards public funds received, where the number of patents/patent applications is often the only indicator used for the short-term evaluation of the university knowledge transfer and patenting activity [89]. The increase in the number of patents generated by UoC is a clear indication of the high performance of the university towards the Third Mission goals. These patents in the time period 1999–2021 are mainly in specific fields such as Engineering, Chemistry, Instruments/Instrumentation, Pharmacology/Pharmacy, Biotechnology/Applied Microbiology, and Parma/Biotech, as shown in Figure 3. As exhibited in Table 2, joint patents of UoC are dominantly obtained by Pharma/Biotech firms (47%), followed by those active in Materials Science (15%).

8.2. Economic Value of Collaborative Patents

As observed from Figure 4 and Table 2, the second most cited patent of UoC, titled “Aligned polymers for an organic TFT”, with 155 patent citations, is, in fact, a joint patent with an SF firm, namely Flexenable Ltd. This is a rather important observation and should be discussed from two angles. First, it is known that the total counts of patent citations received by a specific patent can be used as a reliable measure to estimate the economic value of that patent by comparing the citation count across samples of patents [90,91]. This is based on the assumption that patents with relatively higher values tend to receive more citations than relatively less commercially valuable patents since more valuable patented technologies will further encourage new innovations, and this increases the number of citations to the prior patented technology [92,93].
Therefore, from Table 2, it can be concluded that the collaboration between UoC and SF has led to the generation of a patent possessing the second position in terms of economic values based on the patent citation counts within all patents generated by UoC. To further investigate the reasons behind such a successful collaboration, the track of the co-inventor’s position within the firm and UoC could provide valuable information. It was found that one inventor of this highly cited patent (Henning Sirringhaus) has been the Professor of Electron Device Physics at the University of Cambridge and the Director of Flexenable Ltd. Moreover, the company was found to be a spin-off firm that originated from the University of Cambridge in the year 2000. This observation can be discussed based on the theory of clustering of firms and associated advantages, including adaptive learning and innovation [94,95]. Three complementary drivers of creative industry clusters are known to be the agglomeration economies, the institutional environment, and spin-off formation [96]. In other words, creative industries can cluster thanks to the mechanisms of spin-off formation and institutional support. According to the literature, the ‘spin-off’ phenomenon takes place where there is an existing organisation, called the parent organisation, within which one or several individuals function and eventually leave to create a new organisation [97]. As key sources of technology, related knowledge and talented experts, universities can promote the diffusion of local entrepreneurial culture, leading to the creation and/or the development of innovation ecosystems [98,99], within which innovative spin-offs can be formed. In this context, a study performed on New York’s fashion cluster manifested that art schools in the city serve not only as a venue for design training but also as a conduit for establishing social networks, through which strong school–industry links form, facilitated by internships or by having industry leaders serve as visiting instructors or critics [96].
Our results in this study can further contribute to this theory. According to our findings, a university professor can act as the director of a spin-off firm located in a business cluster in the vicinity of the University, supporting the successful knowledge transfer between the firm and the University. Such dual roles (firm director and university professor) have been found to be an effective way of promoting collaboration between two organisations. In the case of UoC-SF, such collaboration led to the formation of the second most cited patent of UoC.
It is known that highly productive university scientists may largely contribute to scientific discoveries, particularly by generating scientific publications and patents [100,101]. Such academic scientists may involve in the collaboration between university and industry, which is known to be an effective way of knowledge transfer, contributing to regional economic success [9]. Therefore, academic scientists who create specific technologies in their scientific lab are considered key drivers for technological developments at the early stages of development [102,103]. Such academic scientists may form spin-offs to commercialise their discoveries [104]. Here, these scientists can signal the quality of research based on their reputation, facilitating the attraction of resources towards their science-based spin-offs [105]. Our observation further contributes to this theory by providing evidence that academic professors making spin-off firms in a business cluster around his/her university can effectively facilitate the collaboration between the firm and the university. This was demonstrated in this article by pointing at the second top UoC patent (based on patent citations), developed by a university spin-off for which the university professor (co-inventor of the patent) acts as director.
As can be seen from Figure 6b, the majority of joint patents (65%) have been generated with collaboration with firms located in the smallest district of SF, namelyCB4 area, which is the home for Cambridge Science Park with 7430 companies, confirming the role of science parks in facilitating the knowledge transfer between University and Industry. In particular, the spin-off firm Flexenable Ltd. (the co-owner of the second most cited patent of UoC, Table 2) is located in this area.

8.3. Sector Dependency of Technological Collaboration between UoC and SF Firms

Figure 7 shows the number of joint patents generated by UoC and SF companies based on the sector of companies. It can be seen that during the time period from 1999 to 2021, the majority of joint patents (61%) belong to the Pharma/Biotech sector of SF, while the Communications sector accommodates only 29% of the total joint patents. Values of TCS associated with the technological collaboration between UoC and SF firms, as the function of the sector of firms, are presented in Figure 8. As can be seen, the Pharma/Biotech sector of SF has the highest TCS value of 16.45 × 10⁻³, followed by Computing/Advance Electronics (13.5 × 10⁻³). From the results obtained, the H1 hypothesis of this study is confirmed, based on which the Pharma/Biotech sector of SF has the greatest technological collaboration strength with UoC.
Table 4 shows SF firms with joint patents with UoC together with their status in terms of whether being the UoC spin-off, postcode, sector and the value of technological collaboration strength. As observed, 33% (Technical Consultancy), 55% (Pharma/Biotech) and 100% (Computing/Advanced Electronics) of collaborating companies with joint patents with UoC are spin-offs of UoC. Among them, the Pharma/Biotech firm called Psynova Neurotech, which is a spin-off firm, processes the maximum TCS value of 1.307, highlighting the promoted collaboration between the university and its spin-off firms. The other issue that deserves attention is that, in contrast with spin-off firms, large firms have very limited collaboration with UoC. For instance, AstraZeneca is a science-led British-Swedish multinational biopharmaceutical company operating in more than 100 countries with headquarters in SF, and a substantial research budget (around USD 10.6 bn in the period 2018–2020, for instance) [12]. Despite its substantial research budget, AstraZeneca has only one joint patent with UoC out of its large number of patents (3604).
According to Table 4, the accumulative TCS value corresponding to the technological collaboration between the Pharma/Biotech sector of SF and UoC has the maximum value of 16.45 × 10⁻³ compared to those of other sectors. This correspondence can be related to the fact that SF is very active in this field, characterised by the presence of a large number of biotechnology companies. This strength is in agreement with the strength of UoC in this field, considering that around 20% of the world’s Nobel Prize winners in medicine/chemistry are from Cambridge University [41]. However, the relatively high closeness of UoC with the Pharma/Biotech sector of SF is influenced by the collaboration of the university with its spin-off firms rather than large independent firms. These observations confirm the second hypothesis of the research (H2), confirming that spin-off firms originating from UoC provide a significant role in technological knowledge transfer between UoC and SF firms.

9. Conclusions

Collaboration between universities and local high-tech firms can create an enabling innovation ecosystem essential for sustainable economic development. In this context, the development of high-tech business clusters and their interaction with the university as the fundamental provider of experts, ideas and technology has become an important factor in local and national business developments. Silicon Fen is a cluster of high-tech firms with a combined turnover of more than GBP 47 billion (2020), scattered around the world-famous University of Cambridge, which is the affiliation of around 20% of the world’s Nobel Prize winners in medicine/chemistry. Despite their significant importance, the technological influence of UoC on SF firms has not been paid attention to in the available literature. The question here was whether the technological collaboration between these two sectors is affected by the rich background of the SF area in medical and biotechnological sciences and whether spin-off firms play a significant role in overall technological collaboration in comparison with large independent firms in the region. To this end, an overview was provided on the formation of SF and its historical connection with UoC. Then, the technological collaboration between UoC and SF firms was studied based on patent analysis in the period 1999–2021. For this, we defined the geographical border of SF to cover areas in the UK with postcodes starting with CB and identified 78,873 firms within this area. The overall number of patents generated by UoC rose from only 1 in 1999 to 67 in 2010. Then, the number of patents obtained each year was found to be almost constant, with 63 patents in 2020, explained based on the Third Mission strategy of the university. It was found that the collaboration between UoC and SF has led to the generation of a patent possessing the second position in terms of economic values based on the patent citation counts within all patents generated by UoC. This observation was explained based on the dual roles of university professors acting as the director of spin-off firms located in business clusters in the vicinity of the university, supporting the successful knowledge transfer between the firm and the university. The majority of UoC-SF joint patents (65%) have been generated through the collaboration of UoC with firms located in the smallest district of SF (CB4), which is the home of Cambridge Science Park, confirming the role of science parks in facilitating the knowledge transfer between university and industry. We introduced the technological collaboration strength (TCS) to evaluate the technological bond between UoC and SF firms based on the number of joint patents as well as the total number of patents generated by each party. The Pharma/Biotech sector of SF was found to have the highest TCS value of 16.45 × 10⁻³, which was mainly influenced by the collaboration between UoC and its spin-off firms. We have confirmed two hypotheses of the research: (H1) Technological bond between UoC and the biotech sector of SF is greater than other sectors of SF; and (H2) Spin-off firms originating from UoC provide a significant role in technological knowledge transfer between UoC and SF firms. In contrast with the technological bond studied here, future works can focus on the evaluation of the scientific bond between UoC and various business sectors of SF in order to provide possible collaboration patterns.

Author Contributions

Conceptualization, A.R. and A.R.K.; methodology, A.R. and A.R.K.; software, A.R.; validation, A.R. and A.R.K.; formal analysis, A.R.; investigation, A.R. and A.R.K.; resources, A.R. and A.R.K.; data curation, A.R.; writing—original draft preparation, A.R.; writing—review and editing, A.R.K.; visualization, A.R.; supervision, A.R.K.; project administration, A.R. and A.R.K.; funding acquisition, A.R.K. All authors have read and agreed to the published version of the manuscript.

Funding

This research was funded by Fundamental Research Funds for the Central Universities, grant number [N2025001] and National Natural Science Foundation of China, grant number [52250610222]. The APC was funded by Ali R. Kamali.

Institutional Review Board Statement

Not applicable.

Informed Consent Statement

Not applicable.

Data Availability Statement

This research uses secondary data from various sources, submitted to quantitative data analysis methods. See the Section 6: Research Methodology, for details.

Conflicts of Interest

The authors declare no conflict of interest.

References

  1. Rosenfeld, S.A. Bringing business clusters into the mainstream of economic development. Eur. Plan. Stud. 1997, 5, 3–23. [Google Scholar] [CrossRef]
  2. Davies, A.R. Cleantech clusters: Transformational assemblages for a just, green economy or just business as usual? Glob. Environ. Chang. 2013, 23, 1285–1295. [Google Scholar] [CrossRef]
  3. Geldes, C.; Heredia, J.; Felzensztein, C.; Mora, M. Proximity as determinant of business cooperation for technological and non-technological innovations: A study of an agribusiness cluster. J. Bus. Ind. Mark. 2017, 32, 167–178. [Google Scholar] [CrossRef]
  4. Baillie Gerritsen, V.; Palagi, P.M.; Durinx, C. Bioinformatics on a national scale: An example from Switzerland. Brief. Bioinform. 2019, 20, 361–369. [Google Scholar] [CrossRef] [Green Version]
  5. Ebbekink, M.; Lagendijk, A. What’s next in researching cluster policy: Place-based governance for effective cluster policy. Eur. Plan. Stud. 2013, 21, 735–753. [Google Scholar] [CrossRef]
  6. Delgado, M.; Porter, M.E.; Stern, S. Clusters and entrepreneurship. J. Econ. Geogr. 2010, 10, 495–518. [Google Scholar] [CrossRef]
  7. Higuchi, A.; Maehara, R. A factor-cluster analysis profile of consumers. J. Bus. Res. 2021, 123, 70–78. [Google Scholar] [CrossRef]
  8. Porter, M.E. Location, competition, and economic development: Local clusters in a global economy. Econ. Dev. Q. 2000, 14, 15–34. [Google Scholar] [CrossRef] [Green Version]
  9. Cooke, P. Knowledge Economies: Clusters, Learning and Cooperative Advantage; Routledge: London, UK, 2002. [Google Scholar]
  10. Fotso, R. Evaluating the indirect effects of cluster-based innovation policies: The case of the Technological Research Institutes in France. J. Technol. Transf. 2022, 47, 1070–1114. [Google Scholar] [CrossRef]
  11. Smith, H.L.; Romeo, S. The Biotechnology System in Oxfordshire: A Long History. In Handbook of Research on Global Competitive Advantage through Innovation and Entrepreneurship; IGI Global: Hershey, PA, USA, 2015; pp. 188–201. [Google Scholar]
  12. Rezaei, A.; Kamali, A.R. Analysis of collaboration between AstraZeneca and the higher education sector in the UK. Ind. High. Educ. 2022, 36, 09504222221086520. [Google Scholar] [CrossRef]
  13. Dimos, C.; Fai, F.M.; Tomlinson, P.R. The attractiveness of university and corporate anchor tenants in the conception of a new cluster. Reg. Stud. 2021, 55, 1473–1486. [Google Scholar] [CrossRef]
  14. Lee, J. The Role of a University in Cluster Formation: Evidence from a National Institute of Science and Technology in Korea. Reg. Sci. Urban Econ. 2021, 86, 103617. [Google Scholar] [CrossRef]
  15. Lôa, A.; Geiger, M. Managing internal embeddedness in multinational corporations’ R&D subsidiaries: An evolutionary perspective on the automotive industry in Silicon Valley. Technovation 2022, 113, 102422. [Google Scholar]
  16. Anttiroiko, A.V. The Saga of Kista Science City: The development of the leading Swedish IT hub from a high-tech industrial park to a science city. Int. J. Technol. Policy Manag. 2005, 5, 258–282. [Google Scholar] [CrossRef]
  17. Hansen, T. Substitution or Overlap? The Relations between Geographical and Non-spatial Proximity Dimensions in Collaborative Innovation Projects. Reg. Stud. 2015, 49, 1672–1684. [Google Scholar] [CrossRef] [Green Version]
  18. Koilo, V.; Grytten, O.H. Maritime financial instability and supply chain management effects. Probl. Perspect. Manag. 2019, 17, 62–79. [Google Scholar] [CrossRef] [Green Version]
  19. Borges da Costa, S.I.R.; Lodders, J.W. New hybrid organizations creating bridges through innovative educational solutions: The case of Hilversum Media Campus, the Netherlands. Ind. High. Educ. 2022, 36, 381–397. [Google Scholar] [CrossRef]
  20. Lucena-Piquero, D.; Vicente, J. The visible hand of cluster policy makers: An analysis of Aerospace Valley (2006–2015) using a place-based network methodology. Res. Policy 2019, 48, 830–842. [Google Scholar] [CrossRef] [Green Version]
  21. Adams, S.B.; Chambers, D.; Schultz, M. A moving target: The geographic evolution of Silicon Valley, 1953–1990. Bus. Hist. 2018, 60, 859–883. [Google Scholar] [CrossRef]
  22. Molina-Morales, F.X.; Martínez-Cháfer, L.; Capó-Vicedo, J.; Capó-Vicedo, J. The dynamizing role of universities in industrial clusters. The case of a Spanish textile cluster. J. Text. Inst. 2022, 113, 2318–2327. [Google Scholar] [CrossRef]
  23. Siegel, D.S.; Westhead, P.; Wright, M. Science parks and the performance of new technology-based firms: A review of recent UK evidence and an agenda for future research. Small Bus. Econ. 2003, 20, 177–184. [Google Scholar] [CrossRef]
  24. Minguillo, D.; Thelwall, M. Research excellence and university–industry collaboration in UK science parks. Res. Eval. 2015, 24, 181–196. [Google Scholar] [CrossRef]
  25. Helmers, C. Choose the Neighbor before the House: Agglomeration Externalities in a UK Science Park Get access Arrow. J. Econ. Geogr. 2019, 19, 31–55. [Google Scholar] [CrossRef]
  26. Minguillo, D.; Tijssen, R.; Thelwall, M. Do science parks promote research and technology? A scientometric analysis of the UK. Scientometrics 2015, 102, 701–725. [Google Scholar] [CrossRef]
  27. Massey, D.; Quintas, P. WieldD.High Tech Fantasies: Science Parks in Society, Science and Space; Routledge: London, UK, 1992; p. 268. [Google Scholar]
  28. Rose, J.; Jones, M.; Furenaux, B. An integrated model of innovation drivers for smaller software firms. Inf. Manag. 2016, 53, 307–323. [Google Scholar] [CrossRef] [Green Version]
  29. Koepp, R. Clusters of Creativity: Enduring Lessons on Innovation and Entrepreneurship from Silicon Valley and Europe’s Silicon Fen; John Wiley & Sons: Hoboken, NJ, USA, 2003. [Google Scholar]
  30. Hackmann, W. Darwin, Horace Shop—A History of the Cambridge Scientific Instrument Company 1878–1968. Nature 1987, 326, 652–653. [Google Scholar] [CrossRef]
  31. Snelling, M.A. Microscan to Stereoscan at the Cambridge Instrument Company. Adv. Imaging Electron Phys. 2004, 133, 321–334. [Google Scholar]
  32. Ellis, R.J.G. The television transmission division of Pye. IEE Colloquium. 1997, 106, 4. [Google Scholar]
  33. Beveridge, L. Science Parks as a Force in Employment-Cambridge Science Park. Nature 1994, 368, 170–171. [Google Scholar] [CrossRef]
  34. Marshall, J.N.; Richardson, R. The impact of ‘telemediated’ services on corporate structures: The example of ‘branchless’ retail banking in Britain. Environ. Plann. 1996, 28, 1843–1858. [Google Scholar] [CrossRef]
  35. Kelly, T. The British Computer Industry: Crisis and Development; Routledge: London, UK, 2018. [Google Scholar]
  36. Galati, F.; Bigliardi, B.; Passaro, R.; Quinto, I. Why do academics become entrepreneurs? How do their motivations evolve? Results from an empirical study. Int. J. Entrep. Behav. Res. 2020, 26, 1477–1503. [Google Scholar] [CrossRef]
  37. Garnsey, E.; Heffernan, P. High-technology clustering through spin-out and attraction: The Cambridge case. Reg. Stud. 2005, 39, 1127–1144. [Google Scholar] [CrossRef]
  38. Waters, R.; Lawton Smith, H. Social networks in high technology local economies: The cases of Oxfordshire and Cambridgeshire. Eur. Urban Reg. Stud. 2008, 15, 21–37. [Google Scholar] [CrossRef]
  39. Kirk, K.; Cotton, C. The Cambridge Phenomenon Global Impact, 1st ed.; Third Millennium Publishing: London, UK, 2016. [Google Scholar]
  40. Cambridge Ahead. Available online: https://www.cambridgeahead.co.uk/cambridge-cluster-insights/ (accessed on 18 November 2022).
  41. Winter, G. Harnessing evolution to make medicines (Nobel Lecture). Angew. Chem. Int. Ed. 2019, 58, 14438–14445. [Google Scholar] [CrossRef] [PubMed] [Green Version]
  42. Henderson, R. From electron crystallography to single particle cryoEM (Nobel Lecture). Angew. Chem. Int. Ed. 2018, 57, 10804–10825. [Google Scholar] [CrossRef] [PubMed]
  43. Ramakrishnan, V. Racing for the ribosome. Scientist 2018, 32. Available online: https://www.the-scientist.com/reading-frames/racing-for-the-ribosome-65125 (accessed on 8 November 2022).
  44. Hochegger, H.; Takeda, S.; Hunt, T. Cyclin-dependent kinases and cell-cycle transitions: Does one fit all? Nat. Rev. Mol. Cell Biol. 2008, 9, 910–916. [Google Scholar] [CrossRef]
  45. Nirenberg, M.W.; Khorana, H.G.; Holley, R.W.; Matyshevska, O.P.; Danilova, V.M.; Komisarenko, S.V. Breaking the genetic code—A new revolutionary stage in the development of molecular biology: 1968 Nobel Prize laureates. Ukr. Biochem. J. 2021, 93, 139–152. [Google Scholar]
  46. Sanchez, E.C.; Hoskisson, P.A. New approaches for new antibiotics. Biochemist 2015, 37, 28–31. [Google Scholar] [CrossRef]
  47. Jun, S.; Park, S.S. Examining technological innovation of Apple using patent analysis. Ind. Manag. Data Syst. 2013, 113, 890–907. [Google Scholar] [CrossRef]
  48. Altuntas, S.; Dereli, T.; Kusiak, A. Forecasting technology success based on patent data. Technol. Forecast. Soc. Chang. 2015, 96, 202–214. [Google Scholar] [CrossRef]
  49. Petruzzelli, A.M. The impact of technological relatedness, prior ties, and geographical distance on university–industry collaborations: A joint-patent analysis. Technovation 2011, 31, 309–319. [Google Scholar] [CrossRef]
  50. Hong, W.; Su, Y.S. The effect of institutional proximity in non-local university—Industry collaborations: An analysis based on Chinese patent data. Res. Policy 2013, 42, 454–464. [Google Scholar] [CrossRef]
  51. Liu, K.T.; Chen, C.H. Formulation of research and development strategy by analysing patent portfolios of key players the semiconductor industry according to patent strength and technical function. World Pat. Inf. 2022, 70, 102125. [Google Scholar] [CrossRef]
  52. Fontana, R.; Nuvolari, A.; Shimizu, H.; Vezzulli, A. Reassessing patent propensity: Evidence from a dataset of R&D awards, 1977–2004. Res. Policy 2013, 42, 1780–1792. [Google Scholar]
  53. Agres, T. Biotech counts in Cambridge; Britain’s biotechnology hub concentrates academic and commercial life science power to generate groundbreaking discoveries and high-paying jobs. Scientist 2002, 16, 47–49. [Google Scholar]
  54. Karberg, S. Biotech’s perfect storm. Cell 2009, 138, 413–415. [Google Scholar] [CrossRef]
  55. Cambridge Enterprise. Annual Review 2021: Where ideas thrive; University of Cambridge Enterprise: Cambridge, UK, 2021; Available online: https://annual-review.enterprise.cam.ac.uk/2021 (accessed on 8 November 2022).
  56. Scarlat, C.; Ioanid, A.; Şişu, M. Entrepreneurial behaviour identified among SME members of an international group with sustainability-oriented strategy. Sustainability 2021, 13, 12590. [Google Scholar] [CrossRef]
  57. Hermans, F.; Apeldoorn, M.; Stuiver, K. Kok, Niches and networks: Explaining network evolution through niche formation processes. Res. Policy 2013, 42, 613–623. [Google Scholar] [CrossRef]
  58. Ebersberger, B.; Feit, M.; Mengis, H. International knowledge interactions and catch-up. Evidence from European patent data for Chinese latecomer firms. Int. Bus. Rev. 2021, 101855. [Google Scholar] [CrossRef]
  59. Leydesdorff, L.; Kushnir, D.; Rafols, I. Interactive overlay maps for US patent (USPTO) data based on International Patent Classification (IPC). Scientometrics 2014, 98, 1583–1599. [Google Scholar] [CrossRef] [Green Version]
  60. Wenfeng, Z.; Xin, F.; Hongmei, Y. Research on Technology Opportunity Identification of Small and Medium-sized Vaccine Enterprises Based on Patent Analysis. Asian J. Soc. Pharm. 2020, 15, 97–107. [Google Scholar]
  61. Companies House. Available online: http://www.companieshouse.gov.uk/about/functionsHistory.shtml (accessed on 18 November 2022).
  62. Fame, UK Company Research. Available online: https://fame.bvdinfo.com/version-2022927/fame/1/Companies/Report (accessed on 18 November 2022).
  63. Shashnov, S.; Kotsemir, M. Research landscape of the BRICS countries: Current trends in research output, thematic structures of publications, and the relative influence of partners. Scientometrics 2018, 117, 1115–1155. [Google Scholar] [CrossRef]
  64. Salton, G.; McGill, M.J. Introduction to Modern Information Retrieval; McGraw-Hill: New York, NY, USA, 1986. [Google Scholar]
  65. Canet-Giner, M.T.; Redondo-Cano, A.; Balbastre-Benavent, F.; Escriba-Carda, N.; Revuelto-Taboada, L.; Saorin-Iborra, M. The influence of clustering on HR practices and intrapreneurial behaviour. Compet. Rev. 2020, 32, 35–58. [Google Scholar]
  66. Kitchens, B.; Kumar, A.; Pathak, P. Electronic markets and geographic competition among small, local firms. Inf. Syst. Res. 2018, 29, 928–946. [Google Scholar] [CrossRef] [Green Version]
  67. Aziz, K.A.; Norhashim, M. Cluster-Based Policy Making: Assessing Performance and Sustaining Competitiveness. Rev. Policy Res. 2008, 25, 349–375. [Google Scholar] [CrossRef]
  68. Graf, H.; Broekel, T. A Shot in the Dark? Policy Influence on Cluster Networks. Res. Policy 2020, 49, 103920. [Google Scholar] [CrossRef] [Green Version]
  69. Smith, H.L. Entrepreneurship, Innovation and the Triple Helix Model: Evidence from Oxfordshire and Cambridgeshire; Birkbeck College, University of London: London, UK, 2013; Available online: http://www.bbk.ac.uk/innovation/publications/working-papers-1 (accessed on 18 November 2022).
  70. Haas, J.; Pomoni-Papaioannou, F.; Kostopoulou, V. Comparison of the Late Triassic carbonate platform evolution and Lofer cyclicity in the Transdanubian Range, Hungary and Pelagonian Zone, Greece. Cent. Eur. Geol. 2009, 52, 153–184. [Google Scholar] [CrossRef] [Green Version]
  71. Oxford Royal Academy. 9 Things You Should Know About Silicon Fen. 2018. Available online: https://www.oxford-royale.com/articles/silicon-fen/ (accessed on 17 November 2022).
  72. Allen, A.E.; Martin, E.A.; Greenwood, K.; Grant, C.; Vince, P.; Lucas, R.J.; Redfern, W.S. Effects of a monocarboxylate transport 1 inhibitor, AZD3965, on retinal and visual function in the rat. Br. J. Pharmacol. 2020, 20, 4734–4749. [Google Scholar] [CrossRef]
  73. Tweedy, L.; Thomason, P.A.; Paschke, P.I.; Martin, K.; Machesky, L.M.; Zagnoni, M.; Insall, R.H. Seeing around corners: Cells solve mazes and respond at a distance using attractant breakdown. Science 2020, 369, 1075. [Google Scholar] [CrossRef]
  74. Tang, C.C.; Ang, M.C.Y.; Choo, K.K.; Keerthi, V.; Tan, J.K.; Syafiqah, M.N.; Kugler, T.; Burroughes, J.H.; Png, R.Q.; Chua, L.L.; et al. Doped polymer semiconductors with ultrahigh and ultralow work functions for ohmic contacts. Nature 2016, 539, 536–540. [Google Scholar] [CrossRef] [PubMed]
  75. Goussen, B.; Rendal, C.; Sheffield, D.; Butler, E.; Price, O.R.; Ashauer, R. Bioenergetics modelling to analyse and predict the joint effects of multiple stressors: Meta-analysis and model corroboration. Sci. Total Environ. 2020, 749, 141509. [Google Scholar] [CrossRef] [PubMed]
  76. Hudson, M.; Stuchinskaya, T.; Ramma, S.; Patel, J.; Sievers, C.; Goetz, S.; Hines, S.; Menzies, E.; Russell, D.A. Drug screening using the sweat of a fingerprint: Lateral flow detection of (9)-tetrahydrocannabinol, cocaine, opiates and amphetamine. J. Anal. Toxicol. 2019, 43, 88–95. [Google Scholar] [CrossRef] [PubMed]
  77. Banwait, B.; Fite, F.; Loughran, D. Del Pezzo surfaces over finite fields and their Frobenius traces. Math. Proc. Cambridge Philos. Soc. 2019, 167, 35–60. [Google Scholar] [CrossRef] [Green Version]
  78. Shalaby, W.; Zadrozny, W. Patent retrieval: A literature review. Knowl. Inf. Syst. 2019, 61, 631–660. [Google Scholar] [CrossRef] [Green Version]
  79. Marx, M.; Fuegi, A. Reliance on science: Worldwide front-page patent citations to scientific articles. Strateg. Manag. J. 2020, 41, 1572–1594. [Google Scholar] [CrossRef] [Green Version]
  80. Sonmez, Z. Interregional inventor collaboration and the commercial value of patented inventions: Evidence from the US biotechnology industry. Ann. Reg. Sci 2018, 61, 399–438. [Google Scholar] [CrossRef]
  81. Liu, K. Human Capital, Social Collaboration, and Patent Renewal within U.S. Pharmaceutical Firms. J. Manag. 2014, 40, 616–636. [Google Scholar] [CrossRef]
  82. Office for National Statistics. UK Standard Industrial Classification of Economic Activities 2007 (SIC 2007), High tech industries in Great Britain. Palgrave Macmillan: London, UK, 2018. Available online: https://www.ons.gov.uk/methodology/classificationsandstandards/ukstandardindustrialclassificationofeconomicactivities/uksic2007 (accessed on 8 November 2022).
  83. Hyde, D.; Fu, E. Cross-technology innovation trends and evidence with patent and funding data. World Pat. Inf. 2022, 70, 102129. [Google Scholar] [CrossRef]
  84. Henkel, J. Licensing standard-essential patents in the IoT—A value chain perspective on the markets for technology. Res. Policy 2022, 51, 104600. [Google Scholar] [CrossRef]
  85. Ćudić, B.; Alešnik, P.; Hazemali, D. Factors impacting university–industry collaboration in European countries. J. Innov. Entrep. 2022, 11, 33. [Google Scholar] [CrossRef]
  86. Lambert, R. Review of University–Business Interaction; UK Her Majesty’s Treasury: London, UK, 2003. [Google Scholar]
  87. Kitagawa, F.; Sanchez Barrioluengo, M.; Uyarra, E. Third mission as institutional strategies: Between isomorphic forces and heterogeneous pathways. Sci. Public Policy 2016, 43, 736–750. [Google Scholar] [CrossRef] [Green Version]
  88. Degl’Innocenti, M.; Matousek, R.; Tzeremes, N.G. The interconnections of academic research and universities’ third mission: Evidence from the UK. Res. Policy 2019, 48, 103793. [Google Scholar] [CrossRef]
  89. Meyer, M.; Tang, P. Exploring the value of academic patents: IP management practices in UK universities and their implications for Third-Stream indicators. Scientometrics 2007, 70, 415–440. [Google Scholar] [CrossRef]
  90. Harhoff, D.; Narin, F.; Scherer, F.M.; Vopel, K. Citation frequency and the value of patented inventions. Rev. Econ. Stat. 1999, 81, 511–515. [Google Scholar] [CrossRef]
  91. Kalıp, N.G.; Erzurumlu, Y.Ö; Gün, N.A. Qualitative and quantitative patent valuation methods: A systematic literature review. World Pat. Inf. 2022, 69, 102111. [Google Scholar] [CrossRef]
  92. Hall, B.H.; Jaffe, A.; Trajtenberg, M. Market value and patent citations. Rand J. Econ. 2005, 36, 16–38. [Google Scholar]
  93. Jaffe, A.B.; de Rassenfosse, G. Chapter 2: Patent citation data in social science research: Overview and best practices. In Research Handbook on the Economics of Intellectual Property Law; Edward Elgar Publishing: Cheltenham, UK, 2019; Available online: https://www.elgaronline.com/view/edcoll/9781848445369/97818484 (accessed on 18 November 2022).
  94. Wang, T.; Jiang, W. The learning capability and adaptive behaviors of firms: One rationale for firms’ clustering. J. Adv. Inf. Technol. 2012, 4, 397–403. [Google Scholar]
  95. Brookfield, J. Firm Clustering and Specialization: A Study of Taiwan’s Machine Tool. Small Bus. Econ. 2008, 30, 405–422. [Google Scholar] [CrossRef]
  96. Gong, H.; Hassink, R. Exploring the clustering of creative industries. Eur. Plan. Stud. 2017, 25, 583–600. [Google Scholar] [CrossRef]
  97. Pirnay, F.; Surlemont, B. Toward a typology of university spin-offs. Small Bus. Econ. 2003, 21, 355–369. [Google Scholar] [CrossRef]
  98. Caviggioli, F.; Colombelli, A.; De Marco, A.; Scellato, G.; Ughetto, E. Co-evolution patterns of university patenting and technological specialization in European regions. J. Technol. Transf. 2022, 1–24. [Google Scholar] [CrossRef]
  99. Beaudry, C.; Burger-Helmchen, T.; Cohendet, P. Innovation Policies and Practices within Innovation Ecosystems. Ind. Innov. 2021, 28, 535–544. [Google Scholar] [CrossRef]
  100. Cunningham, J.A.; Dolan, B.; Menter, M.; O’Kane, C.; O’Reilly, P. How principal investigators’ commercial experience influences technology transfer and market impacts. Res. Technol. Manag. 2020, 63, 49–58. [Google Scholar] [CrossRef]
  101. Lawson, C.; Sterzi, V. The role of early-career factors in the formation of serial academic inventors. Sci. Public Policy 2014, 41, 464–479. [Google Scholar] [CrossRef]
  102. Jin, P.; Mangla, S.K.; Song, M. The power of innovation diffusion: How patent transfer affects urban innovation quality. J. Bus. Res. 2022, 45, 414–425. [Google Scholar] [CrossRef]
  103. Perkmann, M.; Tartari, V.; McKelvey, M.; Autio, E.; Broström, A.; D’este, P.; Fini, R.; Geuna, A.; Grimaldi, R.; Hughes, A.; et al. Academic engagement and commercialisation: A review of the literature on university–industry relations. Res. Policy 2013, 42, 423–442. [Google Scholar] [CrossRef]
  104. Ma, Z.; Augustijn, K.; de Esch, I.J.; Bossink, B. Collaborative university–industry R&D practices supporting the pharmaceutical innovation process: Insights from a bibliometric review. Drug Discov. 2022, 27, 2333–2341. [Google Scholar]
  105. Stuart, T.E.; Ding, W.W. When do scientists become entrepreneurs? The social structural antecedents of commercial activity in the academic life sciences. Am. J. Sociol. 2006, 112, 97–144. [Google Scholar] [CrossRef]
Figure 1. (a) Number of patents owned by UoC in the period 1999–2021. (b) Break down of the documents in terms of status.
Joitmc 08 00216 g001
Figure 2. Number of patents generated by UoC in the time period 1999–2021. The inset shows the number of filed, granted and published patents.
Joitmc 08 00216 g002
Figure 3. Invention fields of all patents/patent applications owned by UoC, published in the time period 1999–2021. For simplicity, only top ten subject area indicated in patent documents are presented.
Joitmc 08 00216 g003
Figure 4. Patent scatter plot sorted by forward patent citations, based on the publication date.
Joitmc 08 00216 g004
Figure 5. Illustration of Table 3, showing (left panel) the location, and (right panel) invention field, representing the top twenty UK organisations that co-own patents with UoC.
Joitmc 08 00216 g005
Figure 6. (a) Map of Silicon Fen, indicated by postcodes starting with CB. The coloured section in the figure shows different districts within which there are companies with at least one joint patent with UoC. (b) The percentage of joint patents based on the district.
Joitmc 08 00216 g006
Figure 7. Distribution of joint patents generated by UoC and SF firms, based on business sectors of the firms.
Joitmc 08 00216 g007
Figure 8. Technological collaboration strength (TCS) between various sectors of SF and UoC.
Joitmc 08 00216 g008
Table 1. List of abbreviations used in the study.
TermAbbreviationTermAbbreviation
Aerospace and TransportATMedical DevicesMD
Cambridge University Technical ServiceCUTSOffice for National StatisticsONS
Cambridge EnterpriseCEPatent ApplicationPA
ChemistryChemPharma/BiotechnologyP/B
CommunicationsCommPolymersPol
Computing and Advanced ElectronicsCAESilicon FenSF
Cooperative Patent ClassificationCPCSoftwareSOF
Derwent innovation indexDIITechnical Collaboration StrengthTCS
Engineering DesignEDTechnical Consultancy ServicesTC
European Patent OfficeEPOTechnical EngineeringTE
Financial Analysis Made EasyFAMEUnited States Patent and Trademark OfficeUSPTO
Granted PatentGPUnited Kingdom Science Park AssociationUKSPA
Standard Industrial ClassificationSICUniversity of CambridgeUoC
International Patent ClassificationIPCWeb of ScienceWOS
Materials ScienceMSWorld Intellectual Property OrganizationWIPO
Table 2. List of top 10 mostly cited UoC patents cited by other patents. The co-owner of these documents is UoC and other co-owners are indicated where applicable.
NoPatent No (Year)/TypeCitation by Patent CountFamily SizeCo-OwnerCPC Classification
Fields
143914807 (2012)/GP6294-MS/CH/POL
21842502 (2004)/GP15526Flexenable Ltd., UK
spun-out of UoC
CH/MS/POL
379481004 (2005)/PA12632-MS/CH
4201314371956 (2013)/PA11431Glaxosmithkline Intellectual Property Development Ltd., UK;
Yale University, USA
CH/P/B
551161305 (2006)/PA11211-CAE/ED
637785306 (2006)/PA1068-P/B
7201113643267 (2013)/PA839-ED
881282109 (2011)/PA775University of Birmingham, UK;
King’s College London, UK
P/B
9201313858256 (2014)/PA704Samsung Electronics, Ltd., South KoriaCAE
1049215804 (2005)/PA7026King’s College London, UKP/B
Table 3. Top twenty UK public/non-public institutions and firms that co-own patents/patent applications with UoC, sorted based on the number of joint patents.
NoInstitutionNumber of Joint PatentsLocationPatent Field
1Medical Research Council23SFP/B
2Smart Holograms Ltd.18LondonP/B
3Huawei Technologies Co Ltd.15SFC
4Psynova Neurotech Ltd.14SFP/B
5United Kingdom Research and Innovation13SwindonVarious
6Flexenable Ltd.9SF CAE
7Metalysis Ltd.9ManchesterMS
8Glaxosmithkline Intellectual Property Development Ltd.8MiddlesexP/B
9Cambridge Display Technology Ltd.7HuntingdonP/B
10Cementation Skanska Ltd.6Hertfordshire MS
11Diagnostics for the Real World Ltd.6SFMD
12Psynova Neurotech Ltd.6SFP/B
13Ove Arup & Partners International Ltd.6LondonTE
14University of Oxford6OxfordMS
15Camcon Technology Ltd.5SFP/B
16Jaguar Land Rover Ltd.5CoventryAT
17Isis Innovation Ltd.5OxfordVarious
18Dow Corning Ltd.4GlamorganMS
Table 4. Firms located in SF with joint patents with UoC, their status, postcode, sector, number of patents and joint patents with UoC, as well as the technological collaboration strength.
SectorFirm NameSpin-OffSpin-Off (%)LocationPatentJoint PatentsTCS × 103
P/BPsynova NeurotechYes55%CB415141307.0
Wren TherapeuticsYesCB231208.7
Fluidic AnalyticsYesCB1122208.7
Sphere FluidicsYesCB21142193.2
Cell Guidance SystemsNoCB2219182.9
Mission TherapeuticsYesCB2228168.3
MedimmuneNoCB21301241.7
The Babraham InstituteNoCB2329239.9
AstrazenecaNoCB2360416.0
CAESilicon MicrogravityYes100%CB2511361.5
NyoboltYesCB421255.6
Plastic Logic-YesCB41153101.1
FlexEnableYesCB4157386.6
TCCamfridgeYes33%CB2231208.7
Camcon Technology/Currently-Silverwell EnergyNoCB24616458.3
NovaliaNoCB550151.1
CommHuawei TechnologiesNo0%CB4877211513.1
Publisher’s Note: MDPI stays neutral with regard to jurisdictional claims in published maps and institutional affiliations.

