Article

Comparative Analysis of Adverse Effects: Protein Kinase Inhibitors Versus Traditional Anticancer Therapies

by
Ioana Lavinia Radulian
,
Georgiana Nitulescu
*,
Anca Zanfirescu
and
George Mihai Nitulescu
Faculty of Pharmacy, “Carol Davila” University of Medicine and Pharmacy, 020956 Bucharest, Romania
*
Author to whom correspondence should be addressed.
Sci. Pharm. 2025, 93(2), 20; https://doi.org/10.3390/scipharm93020020
Submission received: 8 February 2025 / Revised: 22 March 2025 / Accepted: 15 April 2025 / Published: 21 April 2025

Abstract

:
The adverse effects of protein kinase inhibitors (PKIs) and other anticancer therapies were compared using FDA Adverse Events Reporting System (FAERS) data. The dataset included 159 FDA-approved anticancer drugs (71 PKIs, 88 nonPKIs) and analyzed 8216 unique adverse event (AE) terms. PKIs showed fewer systemic toxicities, with an average of 230.1 distinct AEs per drug, compared to 537.7 in nonPKIs. Hematologic AEs were significantly lower in PKIs (e.g., febrile neutropenia: 1.93% vs. 5.25%; thrombocytopenia: 2.18% vs. 3.87%), coupled with a lower incidence of infections (6.87% vs. 14.2%) and immunosuppressive effects. However, gastrointestinal and skin-related AEs were more common in PKIs (e.g., diarrhea: 13.95% vs. 8.36%). A higher proportion AEs in the PKI group (14.57%) were classified under “Investigations”, compared to the nonPKI group (9.87%). The frequency of “Skin and subcutaneous tissue disorders” AEs was twice as high in the PKI group. Clustering analysis grouped drugs by AE profiles, showing that PKIs formed more homogeneous clusters, while nonPKIs had broader variability. Multi-kinase inhibitors with VEGFR activity were linked to dermatologic AEs, likely due to EGFR inhibition in basal keratinocytes. Despite PKIs’ targeted mechanisms, resistance remains a challenge, requiring biomarker-driven strategies. This study highlights PKIs’ improved tolerability but emphasizes using personalized treatment approaches to optimize efficacy and safety.

1. Introduction

Cancer cells show an imbalanced cell cycle, along with other hallmark changes [1]. Protein kinases mediate most of the signal transduction by changing the substrate activity. They also control many other cellular processes, including metabolism, transcription, cell cycle progression, cytoskeletal rearrangement and cell movement, apoptosis, and differentiation. The cellular processes of phosphorylation and dephosphorylation are estimated to involve 50% of all proteins [2]. Therefore, protein kinases have gained significant attention in the past few decades for their major roles in signalling cascades [3]. Kinase genes are an important factor in the development of various types of cancers. When these genes are mutated or overexpressed, they can activate pathways that lead to the production of proteins directly responsible for different cancers [4].
Abnormal kinase activity is often implicated in cancer progression, making protein kinases significant targets for therapeutic intervention [5]. The development of small-molecule kinase inhibitors (KIs) has transformed cancer treatment by providing targeted therapeutic strategies that specifically inhibit these dysregulated kinase pathways [6]. Protein kinase inhibitors (PKI) have been remarkable cancer treatment options since their launch over 20 years ago. Imatinib, approved by the US Food and Drug Administration (FDA), in 2001, has been the pioneer small-molecule kinase inhibitor drug used for chronic myelogenous leukemia in blast crisis [7]. The primary target of PKIs are protein kinases which play essential roles in signalling pathways and control cellular processes such as growth, proliferation, and survival. This characteristic makes them different from traditional cytotoxic chemotherapies, which primarily target dividing cells and are known to cause considerable toxicity to normal tissues [8]. PKIs that inhibit multiple targets simultaneously are beneficial for treating complex cancer types and overcoming drug resistance, which often develops with single-target agents [9]. Moreover, many PKIs have oral bioavailability, increasing patient compliance compared to the most cytotoxic chemotherapies, which are typically administered intravenously [10].
However, PKIs used in cancer treatment have certain constraints that impact their effectiveness and therapeutic results. An important limitation is the development of cancer cell resistance, which can occur through various mechanisms, including mutations in the kinase domain that prevent drug binding, activation of alternative pathways that preserve cancer cell survival, or compensatory mutations in the kinases themselves [11,12]. While PKIs aim to target specific kinases, achieving total specificity is difficult due to the conserved nature of ATP-binding pockets across different kinases [13]. This can lead to off-target effects, increasing the risk of developing drug toxicity [14]. The presence of preexisting kinase mutations also poses a challenge, as these mutations can genetically confer resistance to inhibitors even before the beginning of the treatment [12]. Another challenge is the need for a precise understanding of the characteristics of the tumour in order to predict a patient response. The variability in patient responses necessitates personalized approaches of the therapy, combining biomarkers and kinase activity tests tailored to the patient’s cancer profile [15].
PKIs used for neoplasm treatment come with their own profiles of adverse events (AEs), which are specific to their mechanisms of action and interactions with biological targets. They often show cardiovascular AEs such as hypertension, heart failure, cardiac arrhythmias, thromboembolism, and exacerbation of coronary artery disease. This is primarily due to their impact on the kinases involved in cardiac function [16]. Several PKIs are associated with mild hepatic toxicity, necessitating close monitoring of hepatic biomarkers during treatment [17]. Skin rashes and other dermatologic reactions are commonly reported within the PKI class, with variations depending on thespecific target [18]. Mild gastrointestinal symptoms, which can impact quality of life and adherence to treatment, have also been reported in the PKI class [19].
Cytotoxic chemotherapies target rapidly dividing cells indiscriminately by interfering with cell division processes such as DNA replication or mitosis. This non-specific action leads to the death of cancer cells but also affects healthy, rapidly dividing cells like those in the bone marrow, gastrointestinal tract, and hair follicles. Therefore, these drugs are associated with systemic adverse events such as myelosuppression (leading to infections and anemia), nausea, vomiting, and hair loss [8]. Drug resistance can also develop, typically through various mechanisms such as reduced drug uptake, enhanced intracellular detoxification, inadequate drug activation, upregulation of DNA repair systems, and increased drug efflux [20].
Therefore, this article aims to compare the safety profiles of PKIs and nonPKI drugs used for cancer treatment by evaluating the data from the FDA Adverse Events Reporting System (FAERS).

2. Materials and Methods

2.1. Selection of the Cancer Drugs

The WHO ATC database [21] was used to extract all drugs classified under the code L01 Antineoplastic agents. The results were subsequently processed to remove drugs combinations, biologic drugs, and any drugs that are not approved by the FDA. The extracted data were then organized into a structured database, categorizing the inhibitors based on their respective targets.

2.2. Preparation of AE Database for Approved Anticancer Drugs

FAERS is one of the most important regulatory-maintained safety databases, frequently utilized for signal detection by the FDA and by Market Authorization Holders worldwide. The advantage of using FAERS is that the users can access data for all drugs approved in the US, providing sufficient safety evidence to be included in the package inserts. Also, FAERS data can be used to further characterize the safety profile of a drug class or conduct secondary safety analyses [22].
For the consistent coding of the AEs included in the FAERS database, Medical Dictionary for Regulatory Activities (MedDra) was used [23]. It is the global standard for coding of adverse events and drug indications for regulatory purposes. It is used by all Drug Regulatory Competent Agencies across the globe. The structure of MedDra is hierarchical, with five levels ranging from very specific to very general, from the lowest level term (LLT) to the system organ class (SOC). For analysis, Preferred Terms (PTs)—distinct descriptors for symptoms, signs, disease diagnoses, therapeutic indications, investigations, surgical or medical procedures, and social or family medical histories—as well as SOCs, which group terms by etiology, manifestation site, or purpose, were used [23]. The LLTs consist of more than 8000 specific terms, and they are all grouped into 27 SOCs.
The FAERS database was queried using the OpenVigil interface [24], a tool designed for pharmacovigilance data analysis, specifically to monitor and identify previously unreported adverse reactions. This tool includes features that clean and preprocess the FAERS data, removing duplicates and handling missing data, thereby enhancing data quality and accuracy. Additionally, it standardizes drug names and AE terms to ensure consistency and reliability in data analysis. It provides a web-based interface that supports various analysis modes, including data extraction, filtering, and exporting the results to a spreadsheet tool. It also performs disproportionality analyses, such as calculating the Reporting Odds Ratio (ROR). The ROR compares the rate of reporting a specific adverse effect for a given drug with the rate of reporting the same adverse effect for all other drugs [25]. It is calculated as the odds of an adverse event occurring in individuals exposed to a specific drug compared to the odds of that event occurring in individuals exposed to other drugs within a pharmacovigilance database [26]. The calculation of ROR involves comparing the odds of an adverse event among cases (reports of the adverse event) to the odds of the event among non-cases (other reports) [27].
OpenVigil was accessed in October 2024, and the AEs associated with the selected PKIs and nonPKI drugs, along with the corresponding descriptive statistical analysis, were extracted. The MedDra version used for the coding of AEs was 24.0. Drugs for which data were not available in OpenVigil 2.0, or that had insufficient data for statistical analysis, were excluded.
AEs were filtered for a ROR ≥ 2.0, a lower bound of the 95% CI > 1.0, and for at least three reported events. These parameters were chosen to reduce noise and to increase the sensitivity of the analysis [27].

2.3. Data Analysis

The Kruskal–Wallis test was employed to compare the two independent groups: the PKI set and the nonPKI set. The frequency values of each AE-PT served as test variables to identify significant differences. A p-value of less than 0.05 was considered indicative of statistical significance. The mean differences that were deemed significant were subsequently analyzed in greater detail.
To assess potential differences in the distribution profiles of PTs between the PKI and the nonPKI groups, a nonparametric independent samples median test was performed in SPSS Statistics 26.0 software [28]. The null hypothesis was rejected if the p value was under 0.05.

2.4. Cluster Analysis

In order to improve clustering robustness and minimize noise caused by the high number of empty data cases, the dataset was filtered by removing the PTs that were associated with only seven or fewer drugs, comprising less than 5% of the set of anticancer drugs (AC). The choice of a 5% threshold is a common heuristic in high-dimensional data analysis and balances dataset coverage with the reduction in noise from infrequent adverse event terms, facilitating clearer pattern identification. Hierarchical clustering was then conducted using the furthest neighbour method along with Euclidean distance metrics. This method was selected for its ability to create well-separated clusters and its effectiveness in identifying potential outliers. The analysis was performed using SPSS Statistics 26.0 software [28].

3. Results

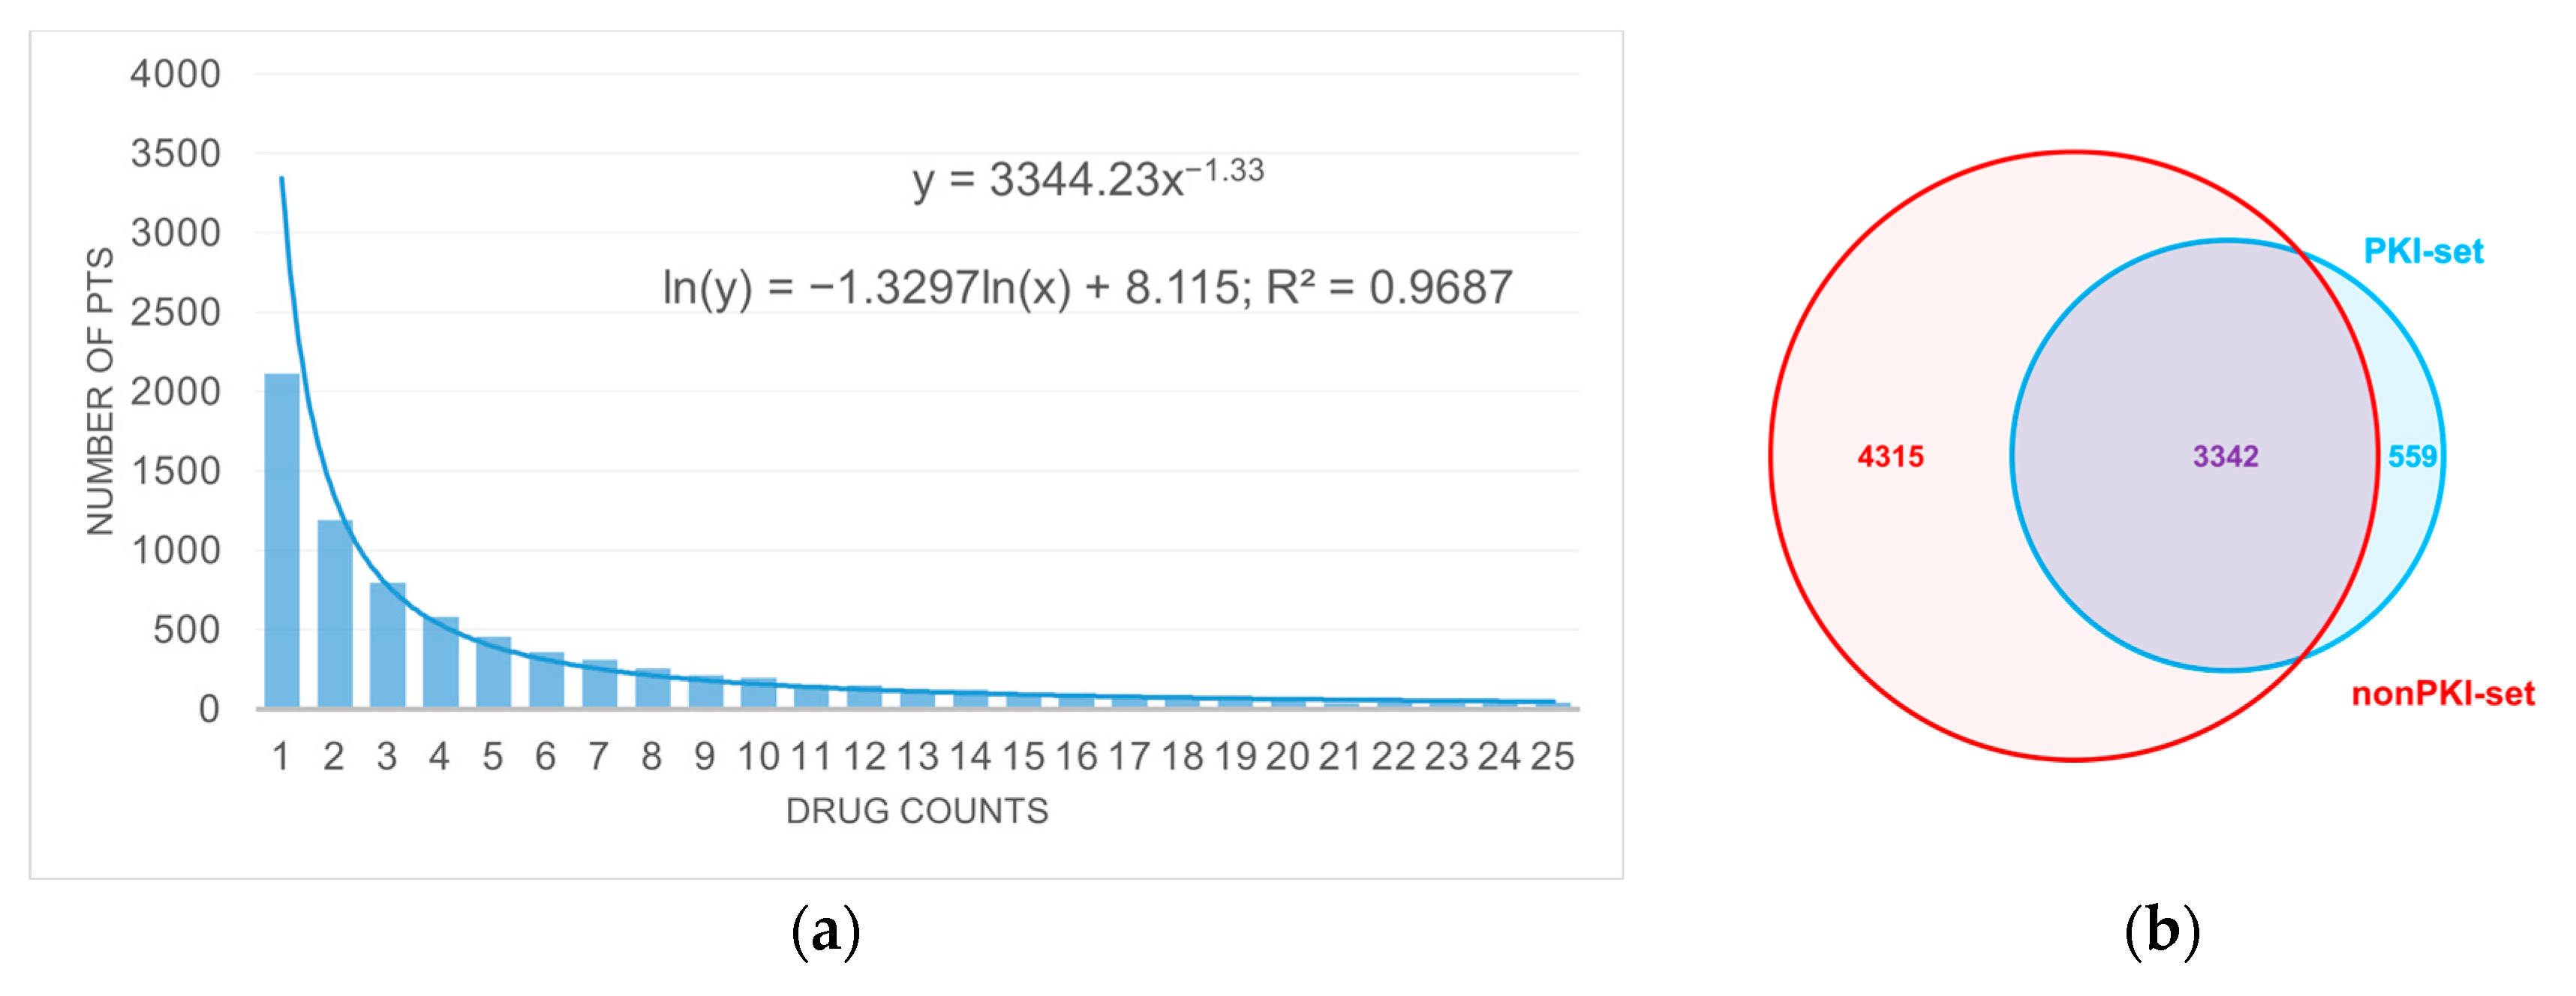
3.1. Anticancer Drug Dataset

The dataset (named AC) contained 159 anticancer drugs that were approved by the FDA and classified under L01 Antineoplastic agents. The combinations of drugs, monoclonal antibodies, and other biologic drugs have been excluded from this analysis. By focusing solely on single-agent therapies, the dataset allowed for a clearer understanding of each drug’s safety profile. The AC set was divided into two subsets: a PKI set, which contains seventy-one (71) protein kinase inhibitor drugs, and the other, named the nonPKI set, which includes eighty-eight (88) molecular entities.
The nonPKI set includes a variety of therapeutic agents categorized by their ATC code: 12 alkylating agents (L01A), 16 antimetabolites (L01B), 10 plant alkaloids and other natural products (L01C) known for their natural cytotoxic effects, 10 cytotoxic antibiotics and related substances (L01D), and 40 other antineoplastic agents (L01X). All drugs analyzed with the relevant ATC code are listed in Section 3.4.
The analysis of the AC set of compounds generated a dataset containing a total of 8216 unique AE-PTs. The most frequently observed PT was “disease progression” which was recorded for 132 drugs, representing 82.5% of the total number of analyzed drugs. This was followed by “malignant neoplasm progression” reported for 113 drugs (70.6%), and “thrombocytopenia” present in 106 drugs (66.3%). A number of 2115 PTs were observed only for one drug of the whole set.
Figure 1a illustrates the number of drugs associated with a specific number of PTs, demonstrating a clear power-law distribution. For example, 2115 PTs are associated with only one drug, while the next value, 1188, represents the number of PTs linked to exactly two drugs. This type of distribution is characterized by a small number of drugs that are linked to a high number of PTs, while the majority of drugs are associated with just a few PTs. Figure 1b displays a scaled Venn diagram illustrating the specific distribution of AE-PTs between the PKI set and the nonPKI set.
For the drugs in the nonPKI set, there were 7657 recorded PTs, compared to 3901 PTs recorded for the PKI set. Although the PKI set contains a similar number of drugs as the nonPKI set, it has a significantly narrower array of PTs, indicating a more homogeneous group. Calculating the number of PTs registered for each drug, methotrexate emerged as the drug with the highest number of unique PTs, totalling 3240, followed by cyclophosphamide with 2369 PTs, doxorubicin with 1894 PTs, vincristine with 1822 PTs, and carboplatin with 1668 PTs. Following the descending order of the number of PTs per drug, all the first 20 ones are anticancer agents from the nonPKI group. On position 21 is the first PKI drug, imatinib, with 886 PTs. On average, the drugs in the PKI set have 230.1 distinct PTs, compared to an average of 537.7 PTs for the nonPKI set.
For each drug in the AC set, the frequency of all registered PTs was calculated, yielding an array of 63,881 data points. The highest frequency value was 52.37% for diarrhea (740 event PTs) observed for neratinib, while the smallest frequency value was 0.001475% observed for 1139 events PTs of palbociclib. The average value of the frequencies registered for all events related to the PKI set was 0.721%, while the corresponding average frequency value for the nonPKI set was 0.345%. The average number of AEs value of all data was 443. The observed frequencies distribution is presented in Table 1.
The distribution of frequencies shows that most values are concentrated in the lower ranges, with approximately 57% of the frequencies falling below the 0.01% threshold. Only 303 data points are over the value of 10%, but they represent the frequencies obtained from 119 drugs in the AC set. All the drugs in the set present at least a PT with a frequency higher than 1%. In terms of PTs, only 820 AEs present frequencies over 1%. It can be observed that the number of events is increasing proportional to the decrease in the occurrence frequency.
The number of case reports retrieved ranged between 39 for methyl aminolevulinate, approved in January 2022 by the FDA for atopic dermatitis, and 271,252 for methothrexate. Methotrexate was approved by the FDA for various indications across multiple therapeutic areas and populations, including acute lymphoblastic leukemia, as part of a combination chemotherapy maintenance regimen, relapsed or refractory non-Hodgkin lymphoma as part of a metronomic combination regimen, mycosis fungoides, rheumatoid arthritis, severe psoriasis, and polyarticular juvenile idiopathic arthritis. The second highest number of case reports is cyclophosphamide with 103,517, followed by celecoxib with 71,488 case reports. The mean of the case reports is 13,280.7, with a median of 3847.

3.2. The Analysis of the PKI Dataset

Based on the filtering criteria, the PKI set, comprising 71 drugs, yielded a list of 3901 unique PTs. To examine the data, the average frequency for each PT was calculated across these drugs. The average frequency ranged from 0.0058% up to 17.69%. The highest number of drugs presenting a common PT was 62 for disease progression, followed by malignant neoplasm progression reported for 52 drugs, and diarrhea reported for 49 drugs. The PTs with calculated mean values higher than 5% are presented in descending order, along with the number of drugs associated with each PT, in Table 2. A total of 240 various PTs had a corresponding average above 1%.
Most of the PTs were reported for more than three drugs, with a median value of 8 and an average of 15. Three events reported a mean frequency greater than 5 for only one drug. Vitamin B1 decreased has been reported for fedratinib, and it is a known and very specific adverse event that may lead to Wernicke encephalopathy. Idiopathic pulmonary fibrosis was reported for nintedanib, which is also approved for the treatment of this disease. Pain showed higher mean frequency values for pexidartinib and fruquintinib. However, due to the non-specificity of the event reported, it is difficult to propose a hypothesis. The AEs (death, diarrhea, fatigue, rash, nausea, pyrexia, vomiting) with higher mean frequencies reported across a greater number of drugs are events usually expected during treatment with oncologic drugs.
The nonparametric independent sample median test utilized the frequency arrays for all AE-PT across the drugs in both sets examining a total of 3.342 variables. A significant difference was found only for 102 PTs. For 59 PTs, the average frequency is lower in the PKI group, while for 43 PTs, the average frequency is higher than that of the drugs in the nonPKI class.
The difference values ranged from −5.59% to 3.32%. The majority of the differences are relatively small, but there are some notable exceptions, particularly in blood-related conditions. For a number of 79 PTs, the difference follows in the range −0.5% and 0.5%. The PTs with absolute values higher than 0.5% are presented in Table 3.
The analysis of the presented data indicates that the majority of the PTs listed in Table 2 with positive differences values are categorized under “Blood and lymphatic system disorders” SOC. This suggests a relatively lower suppression of bone marrow activity by PKI drugs compared to other cytotoxic drugs. Notably, PTs such as metastases to the central nervous system, breast cancer metastatic, drug resistance, and chronic myeloid leukemia may reflect either disease progression or diminished efficacy in the PKI group relative to the nonPKI group. This disparity may stem from the targeted mechanisms of action inherent to PKIs, contrasting with the broader effects exhibited by other anticancer therapies.
Comparing the PTs observed in the PKI set with mean values higher than 5% (Table 2) to those showing significant differences between the PKI and nonPKI sets (Table 3) reveals that diarrhea is the only PT reported in both sets. This suggests that, aside from diarrhea, other frequently occurring PTs do not show statistically significant differences in mean values between the PKI and nonPKI drug sets. The lack of statistically significant differences for the other 23 PTs in Table 2 may stem from the low number of drugs associated with some PTs, such as extra dose administered, blood glucose increased, dyspnoea, headache, pain, idiopathic pulmonary fibrosis, or vitamin B1 decreased.
The SOC with the highest number of relevant differences between groups was “Blood and lymphatic system disorders”, with 16 PTs, followed by “Gastrointestinal disorders” with 15, and both “Investigations” and “Neoplasms benign, malignant and unspecified (incl cysts and polyps)” with 9 PTs each.

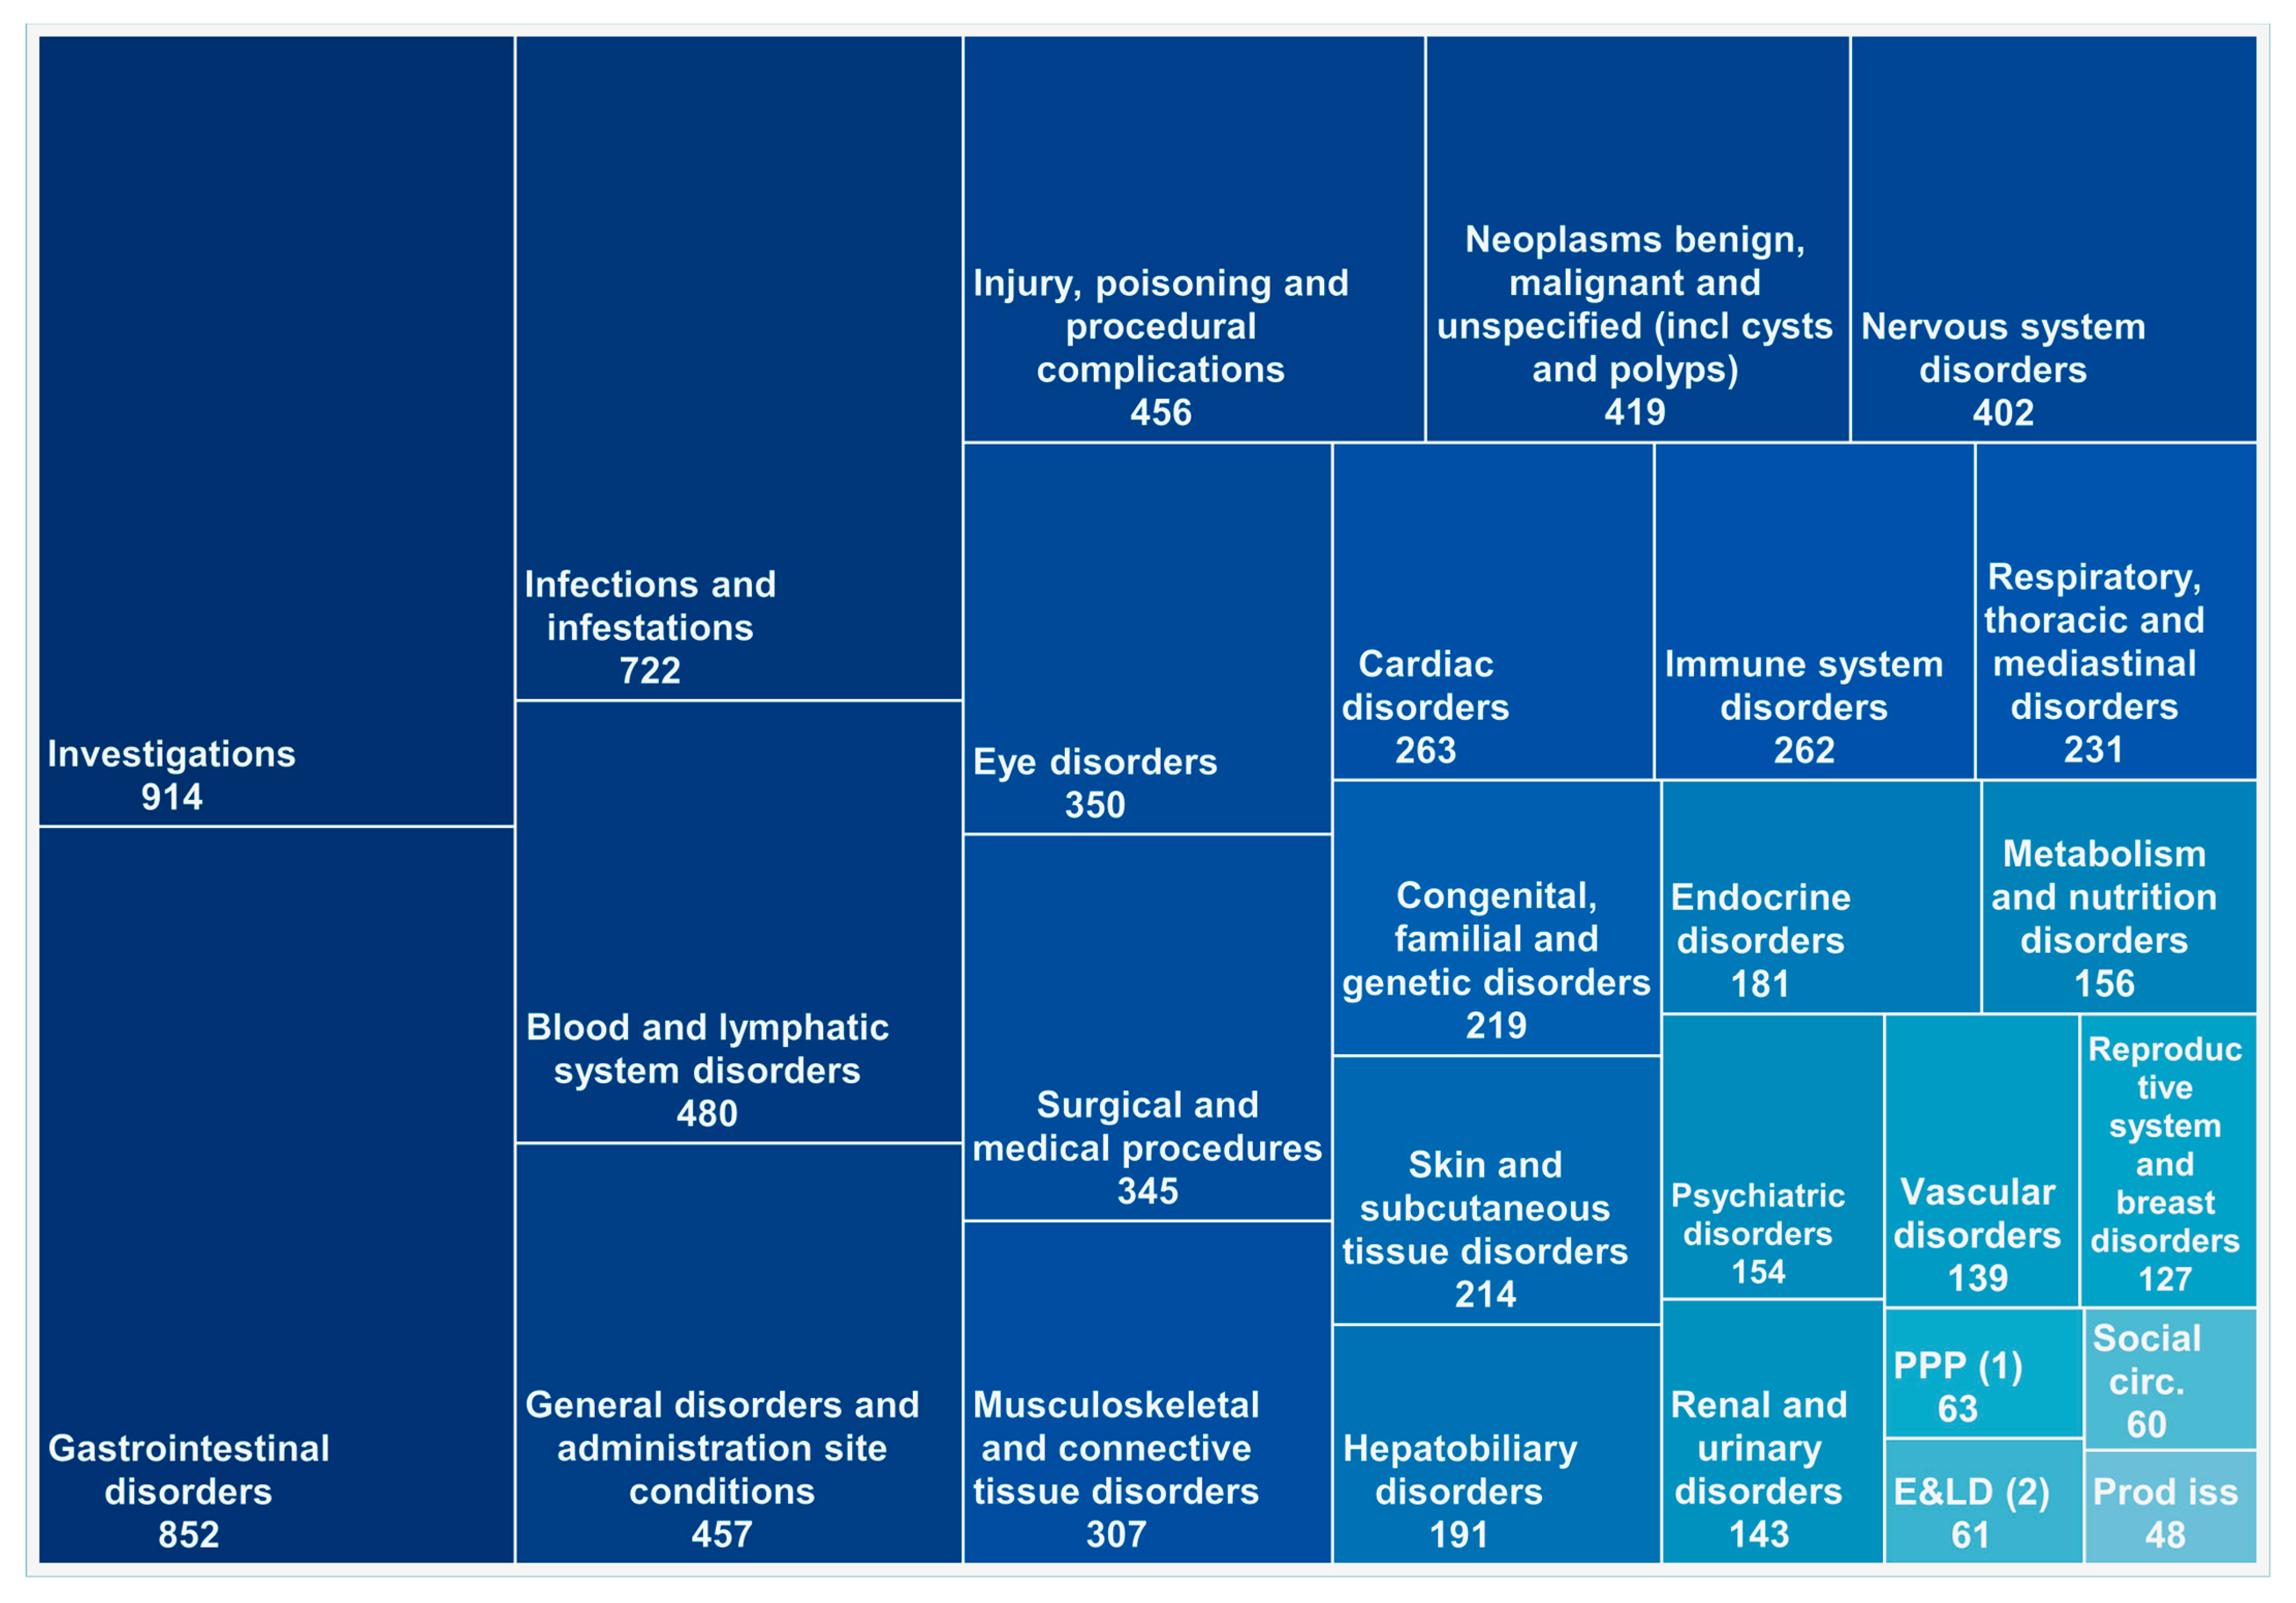
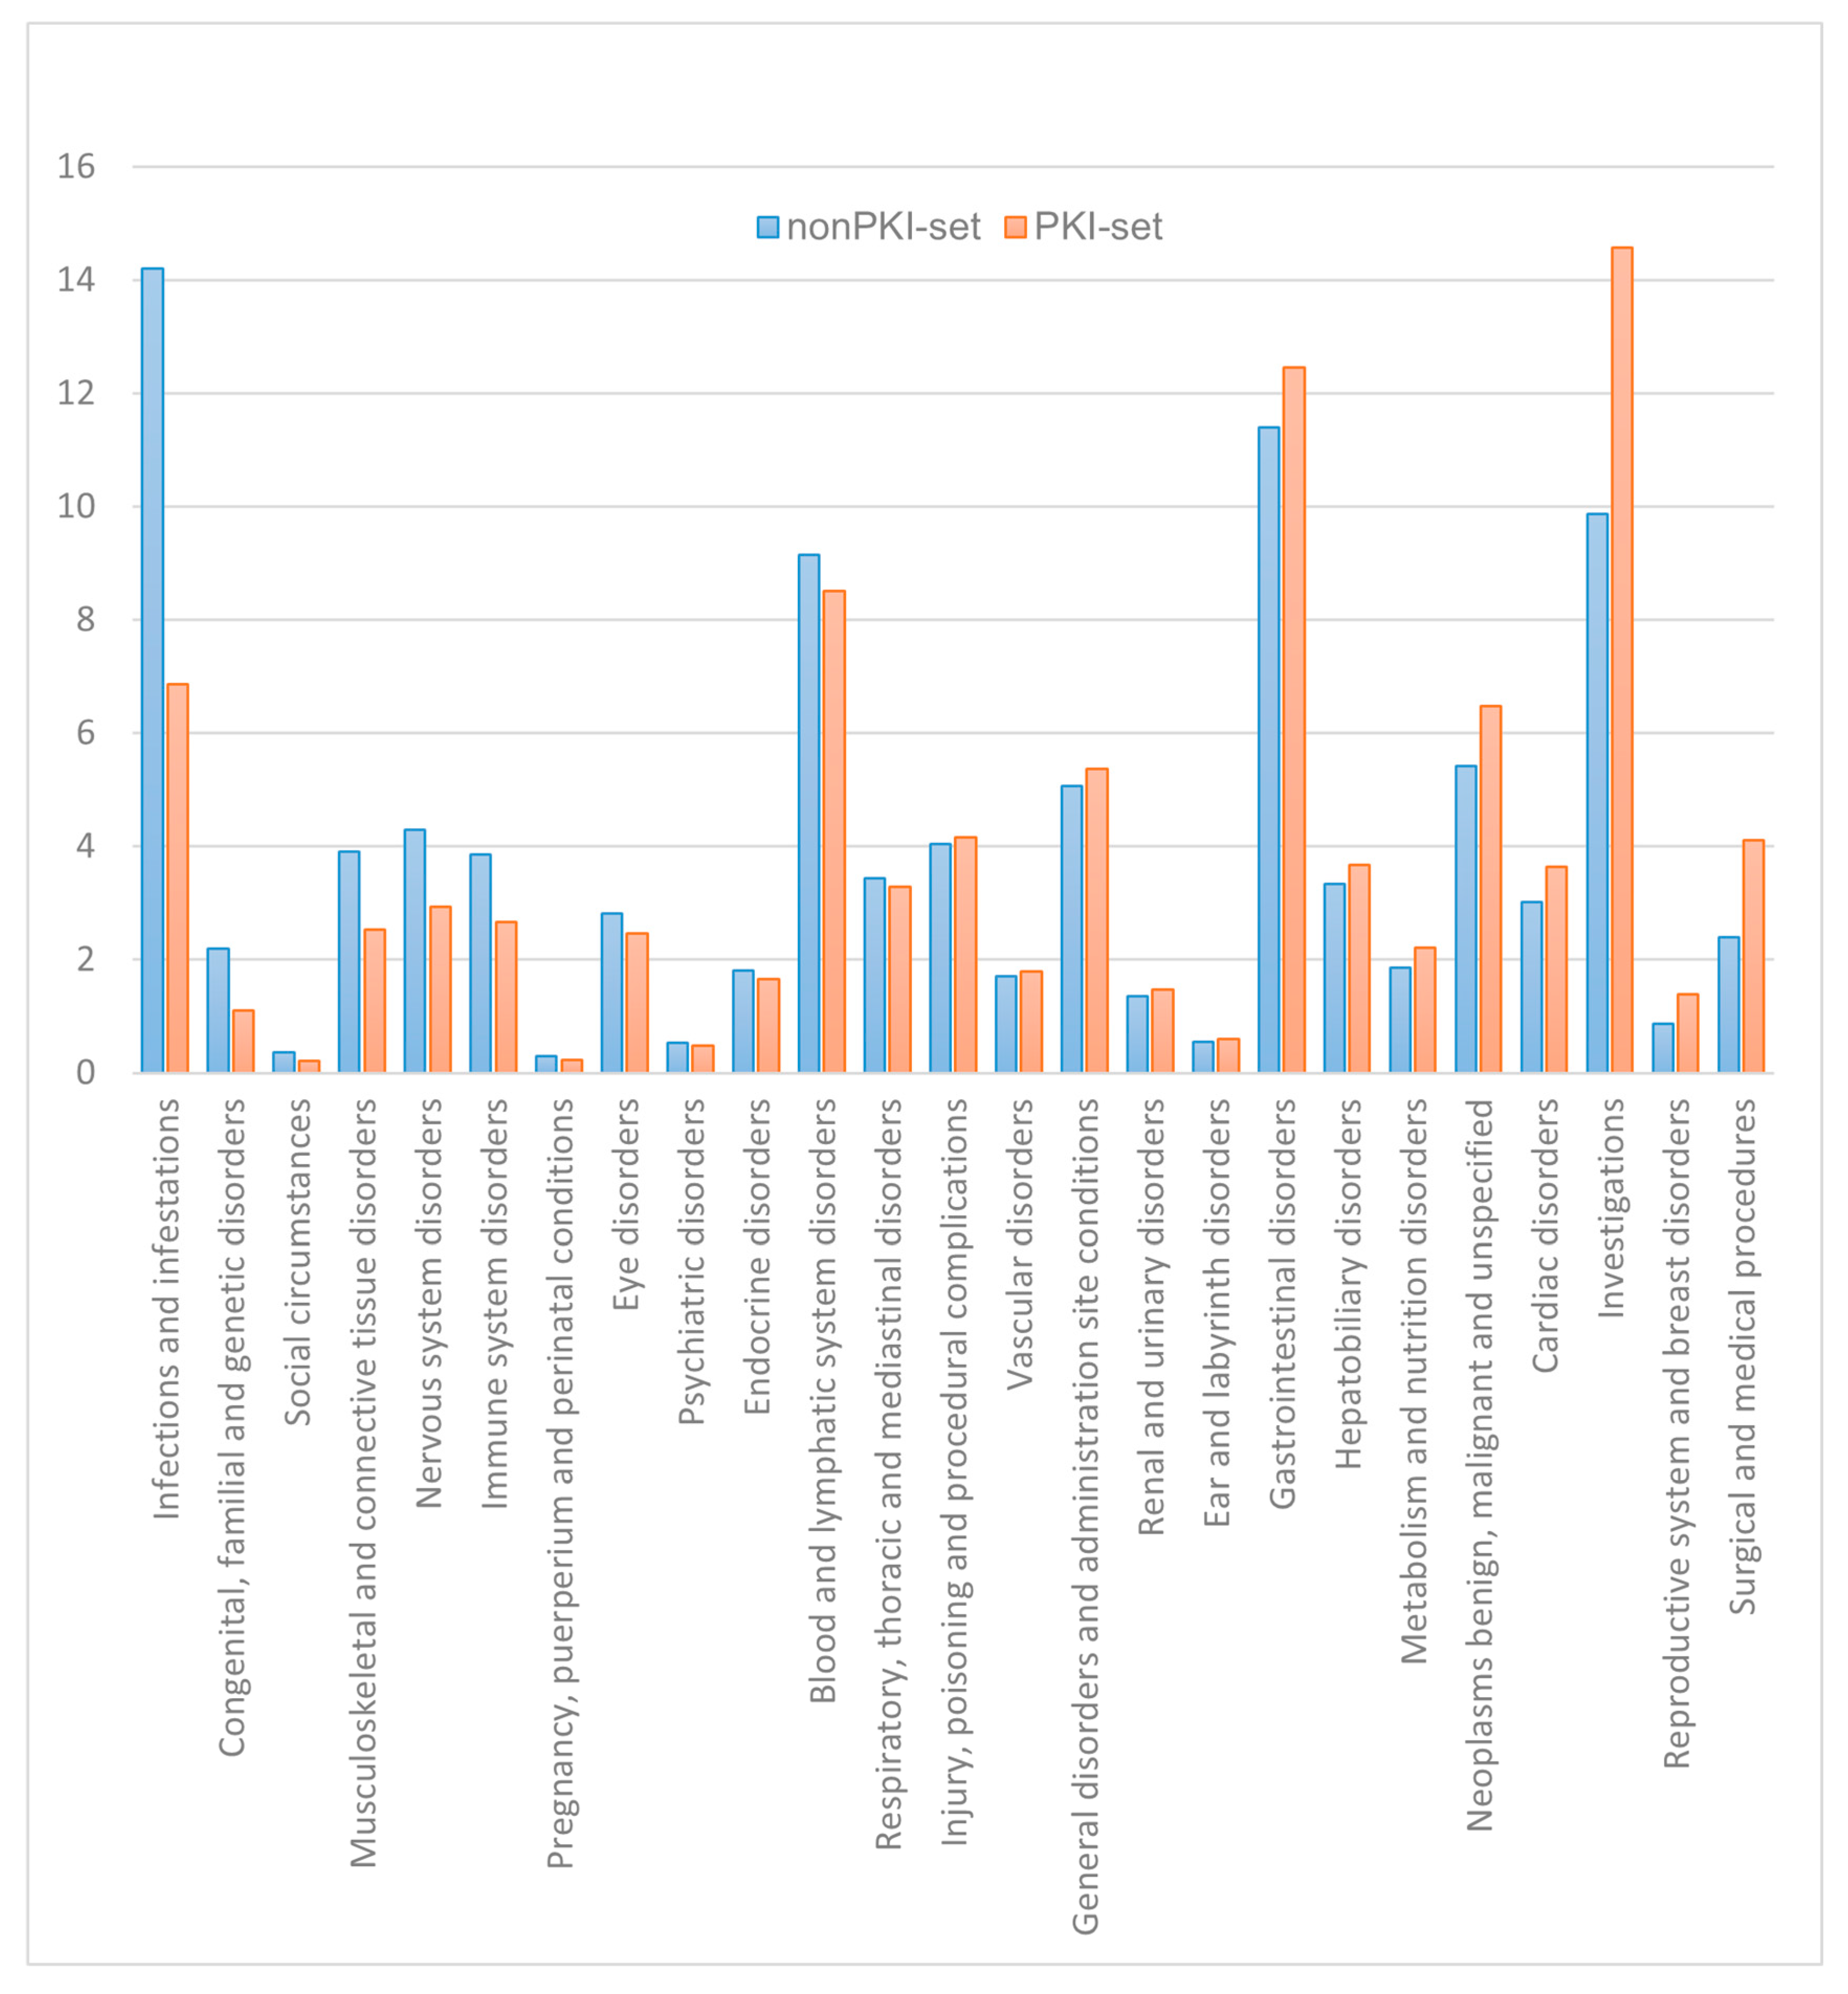
3.3. The Analysis Based on SOC Classification

Each of the 8216 observed AE-PTs was linked to its corresponding SOC category. The top three SOC categories with the most PT entries were Investigations, with 914 PTs cases; Gastrointestinal Disorders, with 852 PTs; and Infections and Infestations, with 722 PTs All the SOC categories are presented in Figure 2, along with number of the corresponding PTs.
For each of the 26 System Organ Classes (SOC), the sum of all cases associated with the corresponding PTs from the same SOC was reported as a proportion of the total number of cases for the AC drugs, specifically within the PKI group. The nonPKI group shows almost twice the frequency (14.20%) of “Infections and Infestations” compared to the PKI group (6.87%). This suggests that nonPKI drugs may be associated with a greater risk of infections as adverse reactions. Both groups exhibit high frequencies of PTs associated with the “Gastrointestinal Disorders” SOC, with nonPKI at 11.39% and PKI at 12.45%. Frequencies for Blood and Lymphatic System Disorders are relatively high for both groups, with 9.15% for nonPKI and 8.50% for PKI, indicating that both drug classes can lead to adverse events (AEs) in this category. A significant proportion of the AEs reported for the PKI group (14.57%) fall within the “Investigations” category, while the proportion for the nonPKI group is 9.87%. The frequency of the events within the “Skin and subcutaneous tissue disorders” SOC is double in the PKI group.
Figure 3 presents the distribution of frequencies by SOC in the PKI group compared to the nonPKI group.
To assess potential differences in the frequency profiles of each SOC category between the PKI and the nonPKI groups, a nonparametric independent samples median test was performed in SPSS Statistics 26.0 software, rejecting the null hypothesis if the p value was under 0.05. The means of the values for all AEs belonging to a certain SOC were calculated in the two drug sets, resulting in a PKI mean and a nonPKI mean. These mean values are not related to the statistical test and are presented as supporting information. The results are presented in Table 4.
Most SOC categories exhibit statistically significant differences (p < 0.001) between the PKI and nonPKI groups, while only a few categories demonstrate no significant differences (p > 0.05). The category “General Disorders and Administration Site Conditions” showed the highest mean in the PKI group (2.291), which is 2.6 times higher than the mean observed in the nonPKI group (0.878). The following descending values are from the SOC categories “Injury, Poisoning and Procedural Complications” and “Skin and Subcutaneous Tissue Disorders”, both of which had values close to 1, with each exhibiting nearly double the values compared to the nonPKI group. On the other hand, “Gastrointestinal disorders” showed the highest value in the nonPKI set (0.960) compared to PKI (0.310). The SOC categories “Reproductive System and Breast Disorders” and “Pregnancy, Puerperium, and Perinatal Conditions” stand out because their mean values are significantly lower than those corresponding to the nonPKI set of drugs.
The nonPKI group exhibits a higher number of PTs across all SOC categories compared to the PKI drugs, with a ratio ranging from 1.3 to 4.5. The lower number of PTs in the PKI group may suggest a more targeted effects profile and a more predictable safety profile.

3.4. Cluster Analysis of the Anticancer Drugs Based on Their AE Spectrum

The drugs were grouped in nine clusters, using the furthest neighbour method along with Euclidean distance metrics. The cluster with most drugs was Cluster 2 with 26.9% of the total number of drugs, and 30.6% of the PKI and 23.9% of the nonPKI drugs. The next two clusters by drug numbers were Cluster 1 with 18.8% and Cluster 6 with 15.6%. The list of each drug and their corresponding ATC class are presented in Table 5.
PKI drugs are predominantly found in Cluster 2 (30.6%), whereas nonPKI drugs (27.3%) are grouped within Cluster 1. Nearly half (48.7%) of the PKIs are classified into Clusters 2 and 6, whereas a greater proportion of nonPKI drugs (50.2%) are distributed across Clusters 1 and 2. Clusters 5 and 9 contained the fewest drugs, accounting for only 3.1% of the total. Cluster 9 exhibited a preference for PKIs, while Cluster 5 was primarily composed of nonPKIs. The distribution of drugs in each cluster reflects that both types of drugs (PKI and nonPKI) do not exhibit a typical AE profile (Figure 4).

3.4.1. PKI Set

The most homogenous distribution is seen for Cyclin-dependent kinase (CDK) inhibitors (L01EF), with all three drugs in the class grouped in Cluster 2. In contrast, Fibroblast growth factor receptor (FGFR) tyrosine kinase inhibitors (L01EN) show a split Cluster preference, with 50% of the drugs falling into Clusters 6 and 9.
For a few of the PKI subgroups, around half of the drugs are concentrated in a single cluster, while the remaining half are split across two or three other clusters. This is seen for the BCR-ABL tyrosine kinase inhibitors (L01EA), where Cluster 1 is predominant, and the other half is split between Clusters 2, 3, and 6; for the Epidermal growth factor receptor (EGFR) tyrosine kinase inhibitors (L01EB), mainly gathered in Cluster 2, with only one representative in Clusters 3, 5, and 6; for Mitogen-activated protein kinase (MEK) inhibitors (L01EE), with 50% of the drugs in Cluster 3 and 25% in Clusters 2 and 6; for Janus-associated kinase (JAK) inhibitors (L01EJ) that have a preference for Cluster 6 and one representative in Cluster 1 and 8; and for Phosphatidylinositol-3-kinase (Pi3K) inhibitors (L01EM), grouped in Cluster 8, with outliers in Cluster 2 and 3.
The B-Raf serine-threonine kinase (BRAF) inhibitors (L01EC) and Vascular endothelial growth factor receptor (VEGFR) tyrosine kinase inhibitors (L01EK) are mainly grouped in Cluster 2 and Cluster 6, respectively, with one outlier in Cluster 3, and Cluster 2, respectively.
A more heterogeneous distribution is seen for Anaplastic lymphoma kinase (ALK) inhibitors (L01ED), with 40% of the drugs in Cluster 4, and one representative in each of Clusters 1, 2, and 3.
Interestingly, most of the multi-kinase receptor drugs, grouped in ATC code L01EX, that have VEGFR activity, are grouped in Cluster 2, as well as the other VEGFR drugs. This is similar for the multi-kinase drugs having activity on PI3K, that are grouped in Cluster 8, as the other drugs from this subclass.
No pattern can be seen for Human epidermal growth factor receptor 2 (HER2) tyrosine kinase inhibitors (L01EH), and Bruton’s tyrosine kinase (BTK) inhibitors (L01EL).

3.4.2. NonPKI Set

All Platinum compounds (L01XA) are grouped in Cluster 1. Half of the Antimetabolites drugs (L01B) are present in Cluster 1. Four of them are pyrimidine analogues (capecitabine, cytarabine, fluorouracil, and gemcitabine), and the other four are folic acid analogues (methotrexate and pemetrexed) and purine analogues (fludarabine and mercaptopurine). Also, 50% of the plant alkaloids and other natural products (L01C) drugs are gathered in Cluster 1 as well (Docetaxel, Etoposide, Irinotecan, Paclitaxel, Vincristine). Interestingly, Vinblastine and Vinorelbine, the other 2 Vinca alkaloids are present in Cluster 2. Similar situation is seen for Taxanes, docetaxel, and paclitaxel, which are in Cluster 1, whereas cabazitaxel is in Cluster 3, and Topoisomerase 1 inhibitors, where irinotecan is in Cluster 1 and topotecan is in Cluster 2.
Of the alkylating agents (L01A), 50% are grouped in Cluster 2 (bendamustine, busulfan, carmustine, dacarbazine, ifosfamide, and thiotepa) and the remaining are distributed across Cluster 1 (25%), Cluster 3 (20%), and Cluster 5 (5%). Similarly, 50% of the cytotoxic antibiotics and related substances (L01D) are grouped in Cluster 2, with the distribution of the other drugs in Cluster 1 (20%), Cluster 3, Cluster 4, and Cluster 5 having 10% each. Most of the anthracyclines and related substances (L01DB) are grouped in Cluster 1 (doxorubicin and epirubicin) and Cluster 2 (daunorubicin, idarubicin, and mitoxantrone), valrubicin being the only one in Cluster 5. In the Proteasome inhibitors (L01XG), bortezomib, and carfilzomib preferred Cluster 1, while ixazomib can be observed in Cluster 2. For the Hedgehog pathway inhibitors (L01XJ), sonidegib and vismodegib are grouped in Cluster 6, and glasdegib in Cluster 8. The other neoplastic agents (L01XX) are grouped evenly mostly in Cluster 3, 4, 6, and 8. The only outliers are celecoxib and venetoclax in Cluster 1, adagrasib in Cluster 5, and belzutifan in Cluster 7.
For the following drugs classes a preference for a specific cluster could not be observed: Sensitizers used in photodynamic/radiation therapy (L01XD), Retinoids for cancer treatment (L01XF), Histone deacetylase (HDAC) inhibitors (L01XH), and Poly(ADP-ribose) polymerase (PARP) inhibitors (L01XK).

4. Discussion

This study provides a thorough comparative analysis of the safety profiles of protein kinase inhibitors (PKIs) and traditional nonPKI anticancer therapies using the FAERS database. By evaluating 159 FDA-approved anticancer drugs and 8216 unique PTs, we have identified significant differences between the two drug classes in terms of AE distribution and frequency. The PKI group of drugs demonstrated a narrower spectrum of adverse events compared to nonPKIs, with an average of 230.1 distinct PTs per drug, significantly lower than the 537.7 PTs per drug in the nonPKI group. Hematologic toxicity, including febrile neutropenia (1.93% vs. 5.25%), thrombocytopenia (2.18% vs. 3.87%), and anemia (2.80% vs. 4.09%), were significantly lower in the PKI group, suggesting a reduced bone marrow suppression. This is correlated with the observation that the nonPKI group showed almost twice the frequency (14.20%) of “Infections and Infestations” SOC compared to the PKI group (6.87%). Conversely, PKIs exhibited higher rates of diarrhea (13.95% vs. 8.36%), but in terms of the “Gastrointestinal disorders”, the whole category (SOC) showed a value three times smaller compared to the nonPKI set. Another important category with significant higher frequencies of adverse events within the PKI group was the “Skin and subcutaneous tissue disorders” SOC. These findings align with the pharmacological mechanisms of PKIs, which target signalling pathways that regulate not only cancer growth but also epithelial and gastrointestinal homeostasis. The unexpected PT of extra dose administered reported for ripretinib is consistent with recent publications that recommend dose escalation following disease progression [29]. In addition, the reported increase in blood glucose for alpelisib and capivasertib is explained by their effect on the AKT pathway [30].
The higher number of unique PTs in the nonPKI group can also be explained by the vast utilization of drugs like celecoxib or methotrexate, not only for the treatment of cancer but also for other indications. Celecoxib ranked 93, and methotrexate ranked 132 among the most utilized drugs in the US, as of 2022, while the PKI drugs were not included in Top 300 due to lower utilization counts [31].
Despite their improved selectivity, PKIs are not without limitations. Drug resistance remains a major challenge, arising from kinase domain mutations, activation of alternative signalling pathways, or compensatory kinase upregulation. While PKIs were designed to provide higher specificity, achieving complete selectivity remains challenging due to the conserved ATP-binding domains shared across kinase families, leading to off-target effects and potential toxicities. The presence of preexisting kinase mutations may result in intrinsic resistance, limiting therapeutic effectiveness from the outset. The higher incidence of complications, such as central nervous system metastases, breast cancer metastasis, drug resistance, and chronic myeloid leukemia, may reflect a diminished efficacy of protein kinase inhibitors. This is presumably because treatment is not always correlated with proper biomarkers or kinase activity assays, both of which are necessary for optimizing therapeutic response.
PKI resistance continues to be a challenge, but there are several strategies to mitigate it. One effective approach is combining different therapeutic agents that target multiple pathways simultaneously, which reduces the likelihood of developing drug resistance. This approach has been shown to enhance treatment response in various cancer types by leveraging the efficacy of existing drugs while mitigating their limitations [32]. Studies have demonstrated that these combination therapies can more effectively overcome resistance mechanisms compared to monotherapy, providing a more robust treatment plan [33]. Addressing resistance at the molecular and cellular levels is another focus, including targeting tumour microenvironment factors and using innovative genetic and epigenetic approaches to manage and potentially reverse resistance [34]. By integrating these advanced methodologies, the field of precision oncology continues to evolve, offering novel solutions to overcome PKI resistance and improve patient outcomes [35].
The specificity of the PKI does not fully eliminate the risk of off-target effects, particularly due to the conserved nature of ATP-binding sites across kinase families [36,37]. Addressing such AEs often requires tailored supportive care strategies to maintain patient adherence and quality of life during treatment. The mean frequency analysis identified common AEs across the PKI class and specific AEs attributed only to individual drugs—for example, vitamin B1 decreased with fedratinib, and blood glucose decreased with alpelisib and capivasertinib. Additionally, the medication error event of extra dose administered observed with ripretinib aligns recent publications and treatment guidelines recommending dose escalation following disease progression..
Most other chemotherapeutic agents, especially those with a less specific targeted mechanisms, were associated with a wide array of systemic AEs that can significantly impact patient’s quality of life. Significant differences were also observed in SOC distributions, with nonPKIs linked to higher incidences of infections, implying a potentially higher immunosuppressive effect that could affect the clinical course, necessitating an adaptive patient management [38]. These findings were linked to neutropenia reported with a higher frequency in the nonPKI group compared to the PKI group [39]. The SOC analysis identified a double frequency of reporting AEs within the “Skin and subcutaneous tissues disorders” SOC in the PKI group. In addition, similar findings were also seen during clustering analysis. Most of the drugs with multiple kinase targets (L01EX) that have VEGFR activity were grouped in Cluster 2, similar to the other VEGFR drugs, and have at least a PT within the SOC “Skin and subcutaneous tissues disorders” with a frequency greater than 1%. These events were localized at the skin level and were associated with the inhibition of EGFR in basal keratinocytes and hair follicles, which express high levels of EGFR like tumour cells [40].
In contrast to the earlier research on the broader PKI class [41], this article provides a more in-depth analysis of the PKI drugs used in the oncologic therapy. While the previous study focused on clustering based on the targets of PKI, this research emphasizes the ATC classification. Additionally, this article employs a more targeted control set within the nonPKI drug class, as opposed to the randomly selected drugs used in the previous study.
The use of FAERS data offered valuable real-world insights, but it can introduce certain biases and limitations. As a spontaneous reporting system, FAERS is subject to underreporting and reporting bias, particularly favouring widely used drugs such as methotrexate and celecoxib. This study did not adjust for drug exposure rates, combination therapies, or treatment duration, which could significantly influence AE frequency comparisons, but the error should be similar for both groups of drugs. The analysis treated all PTs equally without considering severity, potentially overstating the clinical relevance of frequent but mild adverse events (e.g., diarrhea) compared to rare but severe toxicities (e.g., febrile neutropenia). The objective of the study was to analyze whether the targeted mechanism of protein kinase inhibitors (PKIs) results in a narrower spectrum of adverse effects.
The clustering analysis has demonstrated that drugs within an ATC class tend to cluster based on similarities in their molecular mechanisms, but the degree of this clustering varies. While some drug classes exhibit homogeneous clustering patterns, others display a more heterogeneous distribution, suggesting a broader range of factors contributing to their specific safety profiles. The analysis has also indicated that for most classes, the mechanism of action is not a reliable predictor of the toxicity profile.
While PKIs provide a promising therapeutic option with a more targeted safety profile, monitoring and managing of specific AEs remain crucial. Continuous AE surveillance and real-world data assessments are essential for refining therapeutic strategies and improving patient outcomes in terms of efficacy and safety.

5. Conclusions

This research provides a nuanced understanding of the complex safety profiles of PKIs compared to conventional cytotoxic therapies. While PKIs offer enhanced target specificity, they also present unique adverse events, predominantly affecting the skin and gastrointestinal tract, attributable to their diverse interactions with kinase pathways. This study enables clinicians to tailor cancer treatments, optimizing outcomes by selecting therapies that best fit the safety profiles of individual patients. Additionally, identifying specific adverse effects linked to PKIs can guide the development of new inhibitors with better safety profiles. The challenge of drug resistance through kinase mutations calls for innovative therapeutic strategies. Ultimately, this comparative study highlights the importance of personalized approaches in cancer treatment to enhance therapeutic effectiveness and minimize adverse effects.

Author Contributions

Conceptualization, G.M.N.; data curation, I.L.R.; investigation, I.L.R., G.N., A.Z. and G.M.N.; methodology, I.L.R., G.N., A.Z. and G.M.N.; writing—original draft, I.L.R., G.N., A.Z. and G.M.N.; writing—review and editing, G.M.N. All authors have read and agreed to the published version of the manuscript.

Funding

This research received no external funding.

Institutional Review Board Statement

Not applicable.

Informed Consent Statement

Not applicable.

Data Availability Statement

Dataset available on request from the authors.

Conflicts of Interest

The authors declare no conflicts of interest.

References

  1. Hanahan, D.; Weinberg, R.A. Hallmarks of Cancer: The next Generation. Cell 2011, 144, 646–674. [Google Scholar] [CrossRef] [PubMed]
  2. Manning, G.; Whyte, D.B.; Martinez, R.; Hunter, T.; Sudarsanam, S. The Protein Kinase Complement of the Human Genome. Science 2002, 298, 1912–1934. [Google Scholar] [CrossRef] [PubMed]
  3. Franciosa, G.; Locard-Paulet, M.; Jensen, L.J.; Olsen, J.V. Recent Advances in Kinase Signaling Network Profiling by Mass Spectrometry. Curr. Opin. Chem. Biol. 2023, 73, 102260. [Google Scholar] [CrossRef] [PubMed]
  4. Das, R.; Choithramani, A.; Shard, A. A Molecular Perspective for the Use of Type IV Tyrosine Kinase Inhibitors as Anticancer Therapeutics. Drug Discov. Today 2022, 27, 808–821. [Google Scholar] [CrossRef]
  5. Pang, K.; Wang, W.; Qin, J.X.; Shi, Z.D.; Hao, L.; Ma, Y.Y.; Xu, H.; Wu, Z.X.; Pan, D.; Chen, Z.S.; et al. Role of Protein Phosphorylation in Cell Signaling, Disease, and the Intervention Therapy. MedComm 2022, 3, e175. [Google Scholar] [CrossRef]
  6. Bhullar, K.S.; Lagarón, N.O.; McGowan, E.M.; Parmar, I.; Jha, A.; Hubbard, B.P.; Rupasinghe, H.P.V. Kinase-Targeted Cancer Therapies: Progress, Challenges and Future Directions. Mol. Cancer 2018, 17, 48. [Google Scholar] [CrossRef]
  7. Dagher, R.; Cohen, M.; Williams, G.; Rothmann, M.; Gobburu, J.; Robbie, G.; Rahman, A.; Chen, G.; Staten, A.; Griebel, D.; et al. Approval Summary: Imatinib Mesylate in the Treatment of Metastatic and/or Unresectable Malignant Gastrointestinal Stromal Tumors. Clin. Cancer Res. 2002, 8, 3034–3038. [Google Scholar]
  8. Miller, M.J.; Foy, K.C.; Kaumaya, P.T.P. Cancer Immunotherapy: Present Status, Future Perspective, and a New Paradigm of Peptide Immunotherapeutics. Discov. Med. 2013, 15, 166–176. [Google Scholar]
  9. Ling, Y.; Liu, J.; Qian, J.; Meng, C.; Guo, J.; Gao, W.; Xiong, B.; Ling, C.; Zhang, Y. Recent Advances in Multi-Target Drugs Targeting Protein Kinases and Histone Deacetylases in Cancer Therapy. Curr. Med. Chem. 2020, 27, 7264–7288. [Google Scholar] [CrossRef]
  10. Zhao, Y.; Bilal, M.; Raza, A.; Khan, M.I.; Mehmood, S.; Hayat, U.; Hassan, S.T.S.; Iqbal, H.M.N. Tyrosine Kinase Inhibitors and Their Unique Therapeutic Potentialities to Combat Cancer. Int. J. Biol. Macromol. 2021, 168, 22–37. [Google Scholar] [CrossRef]
  11. Niederst, M.J.; Engelman, J.A. Bypass Mechanisms of Resistance to Receptor Tyrosine Kinase Inhibition in Lung Cancer. Sci. Signal. 2013, 6, re6. [Google Scholar] [CrossRef] [PubMed]
  12. Gurden, M.D.; Westwood, I.M.; Faisal, A.; Naud, S.; Cheung, K.M.J.; McAndrew, C.; Wood, A.; Schmitt, J.; Boxall, K.; Mak, G.; et al. Naturally Occurring Mutations in the MPS1 Gene Predispose Cells to Kinase Inhibitor Drug Resistance. Cancer Res. 2015, 75, 3340–3354. [Google Scholar] [CrossRef]
  13. Blay, V.; Gailiunaite, S.; Lee, C.Y.; Chang, H.Y.; Hupp, T.; Houston, D.R.; Chi, P. Comparison of ATP-Binding Pockets and Discovery of Homologous Recombination Inhibitors. Bioorg. Med. Chem. 2022, 70, 116923. [Google Scholar] [CrossRef]
  14. Guo, Y.; Li, X.; Xie, Y.; Wang, Y. What Influences the Activity of Degrader−Antibody Conjugates (DACs). Eur. J. Med. Chem. 2024, 268, 116216. [Google Scholar] [CrossRef]
  15. Veth, T.S.; Kannegieter, N.M.; de Graaf, E.L.; Ruijtenbeek, R.; Joore, J.; Ressa, A.; Altelaar, M. Innovative Strategies for Measuring Kinase Activity to Accelerate the next Wave of Novel Kinase Inhibitors. Drug Discov. Today 2024, 29, 103907. [Google Scholar] [CrossRef] [PubMed]
  16. Grela-Wojewoda, A.; Pacholczak-Madej, R.; Adamczyk, A.; Korman, M.; Püsküllüoğlu, M. Cardiotoxicity Induced by Protein Kinase Inhibitors in Patients with Cancer. Int. J. Mol. Sci. 2022, 23, 2815. [Google Scholar] [CrossRef] [PubMed]
  17. Maliepaard, M.; Faber, Y.S.; van Bussel, M.T.J. Reported Hepatotoxicity and Hepatotoxicity Guidance in the Product Information of Protein Kinase Inhibitors in Oncology Registered at the European Medicines Agency. Pharmacol. Res. Perspect. 2023, 11, e01067. [Google Scholar] [CrossRef]
  18. Das, A.; Sil, A.; Khan, I.A.; Bandyopadhyay, D. Dermatological Adverse Drug Reactions to Tyrosine Kinase Inhibitors: A Narrative Review. Clin. Exp. Dermatol. 2023, 48, 599–608. [Google Scholar] [CrossRef]
  19. Liu, C.; Amin, R.; Shatila, M.; Short, N.; Altan, M.; Shah, A.; Alhalabi, O.; Okhuysen, P.; Thomas, A.S.; Wang, Y. Clinical Characteristics and Outcomes of Tyrosine Kinase Inhibitor-Related Lower GI Adverse Effects. J. Cancer Res. Clin. Oncol. 2023, 149, 3965–3976. [Google Scholar] [CrossRef]
  20. Corrie, P.G. Cytotoxic Chemotherapy: Clinical Aspects Clinical Applications of Cytotoxic Chemotherapy. Medicine 2007, 36, 24–28. [Google Scholar] [CrossRef]
  21. WHO Collaborating Centre for Drug Statistics Methodology. ATC/ DDD Index 2024. Available online: https://atcddd.fhi.no/atc_ddd_index/ (accessed on 15 December 2024).
  22. Takarabe, M.; Kotera, M.; Nishimura, Y.; Goto, S.; Yamanishi, Y. Drug Target Prediction Using Adverse Event Report Systems: A Pharmacogenomic Approach. Bioinformatics 2012, 28, i611–i618. [Google Scholar] [CrossRef] [PubMed]
  23. Available online: https://Www.Meddra.Org/about-Meddra/Vision (accessed on 30 August 2024).
  24. Böhm, R.; Von Hehn, L.; Herdegen, T.; Klein, H.J.; Bruhn, O.; Petri, H.; Höcker, J. OpenVigil FDA—Inspection of U.S. American Adverse Drug Events Pharmacovigilance Data and Novel Clinical Applications. PLoS ONE 2016, 11, e0157753. [Google Scholar] [CrossRef] [PubMed]
  25. Kant, A.; van Hunsel, F.; van Puijenbroek, E. Numbers of Spontaneous Reports: How to Use and Interpret? Br. J. Clin. Pharmacol. 2022, 88, 1365–1368. [Google Scholar] [CrossRef]
  26. Faillie, J.L. Case–Non-Case Studies: Principle, Methods, Bias and Interpretation. Therapies 2019, 74, 225–232. [Google Scholar] [CrossRef]
  27. Trillenberg, P.; Sprenger, A.; Machner, B. Sensitivity and Specificity in Signal Detection with the Reporting Odds Ratio and the Information Component. Pharmacoepidemiol. Drug Saf. 2023, 32, 910–917. [Google Scholar] [CrossRef] [PubMed]
  28. IBM Corp. SPSS Statistics for Windows, Version 26.0. Statistical Software Suite; IBM Corp.: Armonk, NY, USA, 2019. [Google Scholar]
  29. George, S.; Chi, P.; Heinrich, M.C.; von Mehren, M.; Jones, R.L.; Ganjoo, K.; Trent, J.; Gelderblom, H.; Razak, A.A.; Gordon, M.S.; et al. Ripretinib Intrapatient Dose Escalation after Disease Progression Provides Clinically Meaningful Outcomes in Advanced Gastrointestinal Stromal Tumour. Eur. J. Cancer 2021, 155, 236–244. [Google Scholar] [CrossRef]
  30. Rodriguez, Y.E.; Batra, R.; Patel, K.; Martinez, S. Capivasertib-Induced Diabetic Ketoacidosis in a Patient With Estrogen Receptor-Positive/Human Epidermal Growth Factor Receptor 2-Negative (ER+/HER2-) Metastatic Breast Cancer and No Prior History of Diabetes Mellitus: A Case Report. Cureus 2024, 16, e63710. [Google Scholar] [CrossRef]
  31. Available online: https://Clincalc.Com/DrugStats/Top300Drugs.Aspx (accessed on 15 December 2024).
  32. Dhanyamraju, P.K. Drug Resistance Mechanisms in Cancers: Execution of Prosurvival Strategies. J. Biomed. Res. 2024, 38, 95–121. [Google Scholar] [CrossRef]
  33. Joshi, D.C.; Sharma, A.; Prasad, S.; Singh, K.; Kumar, M.; Sherawat, K.; Tuli, H.S.; Gupta, M. Novel Therapeutic Agents in Clinical Trials: Emerging Approaches in Cancer Therapy. Discov. Oncol. 2024, 15, 342. [Google Scholar] [CrossRef]
  34. Gao, H.; Xi, Z.; Dai, J.; Xue, J.; Guan, X.; Zhao, L.; Chen, Z.; Xing, F. Drug Resistance Mechanisms and Treatment Strategies Mediated by Ubiquitin-Specific Proteases (USPs) in Cancers: New Directions and Therapeutic Options. Mol. Cancer 2024, 23, 88. [Google Scholar] [CrossRef]
  35. Zhang, J.; Vokes, N.; Li, M.; Xu, J.; Bai, H.; Wang, J.; Wang, Z.; Zhang, J. Overcoming EGFR-TKI Resistance by Targeting the Tumor Microenvironment. Chin. Med. J. Pulm. Crit. Care Med. 2024, 2, 151–161. [Google Scholar] [CrossRef] [PubMed]
  36. Zhang, J.; Yang, P.L.; Gray, N.S. Targeting Cancer with Small Molecule Kinase Inhibitors. Nat. Rev. Cancer 2009, 9, 28–39. [Google Scholar] [CrossRef] [PubMed]
  37. Hofheinz, R.D.; Segaert, S.; Safont, M.J.; Demonty, G.; Prenen, H. Management of Adverse Events during Treatment of Gastrointestinal Cancers with Epidermal Growth Factor Inhibitors. Crit. Rev. Oncol. Hematol. 2017, 114, 102–113. [Google Scholar] [CrossRef] [PubMed]
  38. Zembower, T.R. Epidemiology of Infections in Cancer Patients. In Infectious Complications in Cancer Patients; Springer: Berlin/Heidelberg, Germany, 2014; pp. 43–89. [Google Scholar]
  39. Vento, S.; Cainelli, F. Infections in Patients with Cancer Undergoing Chemotherapy: Aetiology, Prevention, and Treatment. Lancet Oncol. 2003, 4, 595–604. [Google Scholar] [CrossRef]
  40. Holcmann, M.; Sibilia, M. Mechanisms Underlying Skin Disorders Induced by EGFR Inhibitors. Mol. Cell. Oncol. 2015, 2, e1004969. [Google Scholar] [CrossRef]
  41. Radulian, I.L.; Nitulescu, G.; Zanfirescu, A.; Nitulescu, G.M. Statistical and Clustering Analysis of Safety Profiles of FDA-Approved Protein Kinase Inhibitors. Appl. Sci. 2024, 14, 11757. [Google Scholar] [CrossRef]
Figure 1. (a) Number of PTs observed versus the number of drugs per observed PT. (b) Number of PTs observed only in the PKI set, only in the nonPKI set, and the number of PTs registered in both sets.
Scipharm 93 00020 g001
Figure 2. Distribution by SOC of the AE-PTs (PPP = Pregnancy, puerperium, and perinatal conditions; E&LD = Ear and labyrinth disorders; Prod iss = Product issues).
Scipharm 93 00020 g002
Figure 3. Distribution of frequencies by SOC in the PKI group compared to the nonPKI group.
Scipharm 93 00020 g003
Figure 4. Distribution of drugs by cluster and drug type.
Scipharm 93 00020 g004
Table 1. Number of PTs reported by the occurrence frequency range.
Range of frequency>10%1–10%0.1–1%0.01–0.1%0.001–0.01%
Number of AEs values303573321,42630,1016318
Table 2. PTs with a calculated mean value higher than 5%.
PTMean of the Frequencies (%)Number of Drugs Associated with the PT
death17.6944
diarrhea13.9549
off label use11.3424
fatigue10.9240
nausea10.7228
extra dose administered9.721
blood glucose increased9.612
product dose omission issue9.2110
rash8.4030
dyspnoea6.624
headache6.603
pyrexia6.4724
pain6.462
dizziness6.405
product use in unapproved indication6.279
idiopathic pulmonary fibrosis6.071
vomiting6.0228
hair colour changes6.026
no adverse event5.788
arthralgia5.637
pruritus5.477
vitamin B1 decreased5.271
alopecia5.2716
Table 3. PTs with absolute mean frequency values higher than 0.5% and the differences between the two sets of drugs.
PTMean nonPKIMean PKIDifference
febrile neutropenia5.251.933.32
neutropenia5.102.742.36
thrombocytopenia3.872.181.69
anemia4.092.801.30
myelodysplastic syndrome1.250.280.97
mucosal inflammation1.870.900.97
pancytopenia2.131.260.87
hepatic pain0.810.100.71
bone marrow failure1.310.660.65
haematotoxicity0.830.230.60
respiratory failure1.540.950.59
leukopenia1.390.820.57
hepatic function abnormal0.781.36−0.58
white blood cell count increased0.611.26−0.65
metastases to central nervous system0.571.62−1.05
cryptococcosis0.051.11−1.06
breast cancer metastatic0.871.97−1.10
decreased appetite3.614.74−1.13
nail disorder0.191.32−1.13
drug resistance0.581.93−1.35
cognitive disorder0.632.18−1.55
chronic myeloid leukemia0.202.20−1.99
diarrhea8.3613.95−5.59
Table 4. The adverse events with the largest differences in distribution frequency in the protein kinase inhibitors group versus the control.
SOCKruskal–Wallis TestNumber of PTs -PKINumber of PTs -nonPKIPKI MeannonPKI Mean
Blood and lymphatic system disordersp < 0.0012444600.5390.553
Cardiac disordersp < 0.0011602470.5540.308
Congenital, familial and genetic disordersp < 0.001482100.1740.067
Ear and labyrinth disordersp = 0.20434580.2060.146
Endocrine disordersp < 0.001971620.3790.167
Eye disordersp < 0.0011463190.4140.118
Gastrointestinal disordersp < 0.0014508060.3100.960
General disorders and administration site conditionsp < 0.0012034352.2910.878
Hepatobiliary disordersp < 0.0011101870.3640.230
Immune system disordersp < 0.0011012580.2890.254
Infections and infestationsp < 0.0012997140.3990.237
Injury, poisoning and procedural complicationsp < 0.0012004151.0880.601
Investigationsp < 0.0014698290.5370.299
Metabolism and nutrition disordersp < 0.001841430.5410.352
Musculoskeletal and connective tissue disordersp < 0.0011282960.6000.259
Neoplasms benign, malignant and unspecified (incl cysts and polyps)p < 0.0011893860.6610.293
Nervous system disordersp < 0.0011723790.5450.276
Pregnancy, puerperium and perinatal conditionsp = 0.01013590.0610.232
Product issuesp = 0.20321400.3020.400
Psychiatric disordersp = 0.008531430.3520.462
Renal and urinary disordersp = 0.019741350.5180.347
Reproductive system and breast disordersp < 0.001701010.0580.50
Respiratory, thoracic and mediastinal disordersp < 0.0011262220.4840.275
Skin and subcutaneous tissue disordersp < 0.0011451940.9360.409
Social circumstancesp = 0.16822570.2840.120
Surgical and medical proceduresp < 0.0011892770.3540.144
Vascular disordersp = 0.233811340.4670.227
Table 5. The clustering of the anticancer drugs (AC set) using the furthest neighbour method.
ClusterSet PKIATC CodeSet nonPKIATC Code
1ImatinibL01EA01CyclophosphamideL01AA01
DasatinibL01EA02MelphalanL01AA03
NilotinibL01EA03TemozolomideL01AX03
AlectinibL01ED03MethotrexateL01BA01
RuxolitinibL01EJ01PemetrexedL01BA04
IbrutinibL01EL01MercaptopurineL01BB02
FludarabineL01BB05
CytarabineL01BC01
FluorouracilL01BC02
GemcitabineL01BC05
CapecitabineL01BC06
VincristineL01CA02
EtoposideL01CB01
PaclitaxelL01CD01
DocetaxelL01CD02
IrinotecanL01CE02
DoxorubicinL01DB01
EpirubicinL01DB03
CisplatinL01XA01
CarboplatinL01XA02
OxaliplatinL01XA03
BortezomibL01XG01
CelecoxibL01XX33
VenetoclaxL01XX52
2PonatinibL01EA05IfosfamideL01AA06
GefitinibL01EB01BendamustineL01AA09
ErlotinibL01EB02BusulfanL01AB01
OsimertinibL01EB04ThiotepaL01AC01
VemurafenibL01EC01CarmustineL01AD01
DabrafenibL01EC02DacarbazineL01AX04
CrizotinibL01ED01CladribineL01BB04
TrametinibL01EE01AzacitidineL01BC07
PalbociclibL01EF01VinblastineL01CA01
RibociclibL01EF02VinorelbineL01CA04
AbemaciclibL01EF03TopotecanL01CE01
LapatinibL01EH01DaunorubicinL01DB02
AxitinibL01EK01IdarubicinL01DB06
AcalabrutinibL01EL02Mitoxantrone L01DB07
IdelalisibL01EM01BleomycinL01DC01
SunitinibL01EX01MitomycinL01DC03
SorafenibL01EX02ProcarbazineL01XB01
PazopanibL01EX03TretinoinL01XF01
RegorafenibL01EX05CarfilzomibL01XG02
CabozantinibL01EX07IxazomibL01XG03
LenvatinibL01EX08OlaparibL01XK01
NintedanibL01EX09
3BosutinibL01EA04ChlorambucilL01AA02
AfatinibL01EB03LomustineL01AD02
EncorafenibL01EC03ClofarabineL01BB06
LorlatinibL01ED05DecitabineL01BC08
CobimetinibL01EE02TrifluridineL01BC59
BinimetinibL01EE03CabazitaxelL01CD04
TucatinibL01EH03DactinomycinL01DA01
AlpelisibL01EM03NiraparibL01XK02
MidostaurinL01EX10Arsenic trioxideL01XX27
GilteritinibL01EX13AnagrelideL01XX35
EribulinL01XX41
4CeritinibL01ED02IxabepiloneL01DC04
BrigatinibL01ED04BexaroteneL01XF03
ZanubrutinibL01EL03Romidepsin L01XH02
VandetanibL01EX04RucaparibL01XK03
RipretinibL01EX19VorinostatL01XX53
EnasidenibL01XX59
SelinexorL01XX66
5MobocertinibL01EB10StreptozocinL01AD04
FloxuridineL01BC09
ValrubicinL01DB09
AdagrasibL01XX77
6AsciminibL01EA06NelarabineL01BB07
DacomitinibL01EB07TrabectedinL01CX01
SelumetinibL01EE04Aminolevulinic acidL01XD04
FedratinibL01EJ02AlitretinoinL01XF02
PacritinibL01EJ03PanobinostatL01XH03
TivozanibL01EK03VismodegibL01XJ01
FruquintinibL01EK04SonidegibL01XJ02
ErdafitinibL01EN01TalazoparibL01XK04
PemigatinibL01EN02PentostatinL01XX08
LarotrectinibL01EX12MitotaneL01XX23
EntrectinibL01EX14IvosidenibL01XX62
CapmatinibL01EX17LurbinectedinL01XX69
AvapritinibL01EX18
7QuizartinibL01EX11BelinostatL01XH04
PralsetinibL01EX23Belzutifan L01XX74
CapivasertibL01EX27
8NeratinibL01EH02PralatrexateL01BA05
MomelotinibL01EJ04Porfimer sodiumL01XD01
CopanlisibL01EM02GlasdegibL01XJ03
DuvelisibL01EM04TazemetostatL01XX72
PexidartinibL01EX15SotorasibL01XX73
TepotinibL01EX21EflornithineL01XX79
SelpercatinibL01EX22
UmbralisibL01EX25
9PirtobrutinibL01EL05Methyl aminolevulinateL01XD03
InfigratinibL01EN03
FutibatinibL01EN04
Disclaimer/Publisher’s Note: The statements, opinions and data contained in all publications are solely those of the individual author(s) and contributor(s) and not of MDPI and/or the editor(s). MDPI and/or the editor(s) disclaim responsibility for any injury to people or property resulting from any ideas, methods, instructions or products referred to in the content.

