Article

Non-Monotonic dc Stark Shifts in the Rapidly Ionizing Orbitals of the Water Molecule

Department of Physics and Astronomy, York University, Toronto, ON M3J 1P3, Canada
*
Author to whom correspondence should be addressed.
Atoms 2022, 10(3), 84; https://doi.org/10.3390/atoms10030084
Submission received: 11 July 2022 / Revised: 27 July 2022 / Accepted: 15 August 2022 / Published: 18 August 2022

Abstract

:
We extend a previously developed model for the Stark resonances of the water molecule. The method employs a partial-wave expansion of the single-particle orbitals using spherical harmonics. To find the resonance positions and decay rates, we use the exterior complex scaling approach which involves the analytic continuation of the radial variable into the complex plane and yields a non-hermitian Hamiltonian matrix. The real part of the eigenvalues provides the resonance positions (and thus the Stark shifts), while the imaginary parts Γ / 2 are related to the decay rates Γ , i.e., the full-widths at half-maximum of the Breit–Wigner resonances. We focus on the three outermost (valence) orbitals, as they dominate the ionization process. We find that for forces directed along the three Cartesian co-ordinates, the fastest ionizing orbital always displays a non-monotonic Stark shift. For the case of fields along the molecular axis we show results as a function of the number of spherical harmonics included ( max = 3 , 4 ). Comparison is made with total molecule resonance parameters from the literature obtained with Hartree–Fock and coupled cluster methods.

1. Introduction

Ionization of the water molecule by a dc electric field been dealt with in the past by effective potential formulations, in which a local potential is formed to define a single-electron Schrödinger equation [1,2]. Another recent approach includes calculations using the Hartree–Fock (HF), and the correlated coupled-cluster singles and doubles, CCSD(T) methods [3]. Molecules without external field are often treated using density functional theory [4]. Both the HF and CCSD methods are approximations of the multi-electron Schrödinger equation [3].
To solve the resonance problem, one employs an analytic continuation method, such as exterior complex scaling (ECS) or the inclusion of a complex absorbing potential (CAP). This is applied to avoid the use of outgoing waves describing the accelerating ionized electrons. Analytic continuation allows the use of square-normalizable wave functions to describe an exponentially decaying state. This can be done at the level of the N-electron wave function, such as in Ref. [3], or at the level of molecular orbitals (MOs), as in Ref. [1]. One might criticize the orbital-based method as being too restrictive by not including electron correlation, but it should be noted that electron spectroscopy can be used to determine different first ionization energies [5,6], and therefore the orbital picture offers interesting insights despite its shortcomings. The removal of inner-shell electrons is possible by exposing molecules to X-rays and such experiments have been carried out [7]. Tunnel ionization for aligned molecular orbitals has been shown to provide an understanding of harmonic generation in attosecond pulses [8].
We have recently developed a numerical partial-wave method for the Stark resonance problem [1] to follow up on the single-center Slater orbital HF method of Moccia [9] for the field-free problem. In this approach, we apply the partial-wave methodology to solve the resonance parameters for the three valence orbitals, using a finite-element implementation for the radial basis functions, which results in a matrix problem. The angular parts of the wave function are represented by complex spherical harmonics. The spherical harmonic basis is truncated at max = 3 for much of the work, except for fields oriented with the molecular axis where those results [1] will be compared with the case of max = 4 . Before attempting a self-consistent field scheme, we use in a first step an effective potential borrowed from the literature [10], and expand the hydrogenic parts in spherical harmonics to obtain an efficient implementation. The main new aspect of the present paper is the additional inclusion of the dc field along the x and y directions in order to observe how the Stark shifts behave as a function of field stength. This work, therefore, complements the findings of Jagau for the overall Stark shift of the molecule where these directions were also investigated [3].
Stark shifts represent an interesting problem theoretically, as well as experimentally. An example of a combined study for He atoms in a wide range of fields is given in Ref. [11]. In molecular physics, they can be used for state selection in beams, and for deflection and deceleration of diatomic polar molecules [12,13]. In the latter works one makes use of the nonlinear Stark effect in rotational states.
Here we explore the Stark shifts of the valence orbitals of the water molecule in a fixed-body frame for different orientations of the external electric field. For field orientations along the molecular axis (in the plane of the water molecule) an avoided level crossing between the two outermost orbitals ( 1 b 1 and 3 a 1 ) is observed for one field orientation. Generally, we find that the non-monotonic shifts occur whether level crossings occur or not, but interactions between the orbitals do play a role in the nonlinear behavior of the energy levels.
The paper is organized as follows. In Section 2 we discuss the potential and wavefunction models employed in the calculation. In Section 3.1 we present density plots for the orbitals under the Cartesian force directions, and in Section 3.2 the corresponding resonance parameters. Here we make our point about the non-monotonic behavior of the dc Stark shift for the MO which ionizes most rapidly for a given field direction. Section 3.3 provides a comparison with the net ionization parameters of Ref. [3]. In Section 3.4 we address the question of MO-level interactions and level crossings. We offer some conclusions and an outlook in Section 4. Throughout the paper, atomic units (a.u.), characterized by = m e = e = 4 π ϵ 0 = 1 , are used.

2. Model

We use an effective potential for the water molecule that has been developed previously for various applications (Refs. [10,14,15,16,17]). The model combines three spherically symmetric potentials for the atoms which make up the water molecule. Each part contains a screening contribution, and the parameters are adjusted such that the overall potential falls of as 1 / r at large distances to avoid contributions from electronic self-interaction.
The potential is defined as follows,
V eff = V O ( r ) + V H ( r 1 ) + V H ( r 2 ) ,
V O ( r ) = 8 N O r N O r ( 1 + α O r ) exp ( 2 α O r ) , V H ( r j ) = 1 N H r j N H r j ( 1 + α H r j ) exp ( 2 α H r j ) ,
where the parameters α O = 1.602 and α H = 0.6170 determine how the screening changes as a function of the radial distance. The variables r j (with j = 1 , 2 ) represent the electron-proton separations. The effective nuclear charge parameters are given by N O = 7.185 and N H = ( 9 N O ) / 2 = 0.9075 . The opening angle for the molecule is chosen as 105 degrees, and the O-H bond length as 1.8 a.u., in accord with Ref. [10]. The molecular plane is chosen as y z , and the geometric arrangement follows the HF calculation of Moccia [9].
The wavefunction is given as
Ψ ˜ ( r , θ , ϕ ) = = 0 max m = i , n I , N c i n m f i n ( r ) r Y m ( θ , ϕ ) ,
where Y l m are complex-valued spherical harmonics. The functions f i n ( r ) are local basis functions defined on interval i of the radial box. The index n labels the polynomial basis functions [18]. As outlined in Ref. [1], we expand the hydrogen potentials using spherical harmonics. For a basis of spherical harmonics describing the wavefunction expanded up to order max , these potentials are expanded up to a level λ max = 2 max . This is validated by the selection rules imposed by the Gaunt integrals, which are expressed in terms of Wigner 3 j coefficients.
We employ the exterior complex scaling (ECS) method, which is outlined in Refs. [18,19]. The radial variable is scaled as follows:
r r s + ( r r s ) e i ξ .
This scaling is applied to the radial variable wherever it appears in the Hamiltonian (cf. Ref. [1]).
To extend the previous work to fields in more directions than along the molecular axis ( z ^ ) we can write the Schrödinger equation, e.g., for a water molecule with a force experienced by the electron (which is opposite to the external field direction), with behavior F x ^ as
1 2 2 i = 1 3 Z i ( | r i | ) | r i | F x r sin ( θ ) cos ( ϕ ) Ψ = E Ψ .
The radial variable r r 3 (which appears also in the expanded hydrogenic | r i | -dependent parts for i = 1 , 2 ) is scaled in accord with Equation (4). The screening functions Z i ( r ) are obtained from Equation (2) by multiplication with the appropriate radial coordinate. A description of the ECS methodology can be found in Refs. [1,18,19].
In addition to fields oriented along the x-axis and the y-axis, we also implemented fields oriented in the x z plane (the results for which are given in the Supplementary Materials). We focus in this paper on the field orientations along the Cartesian axes, since they result in an interesting behavior of the dc Stark shift for the MO which is most effectively ionized for a given field direction. We present the data as a function of the force as experienced by the electron, rather than the field (i.e., the negative charge sign has been absorbed for clarity).
For the scaling radius we have chosen a large value, 16.4 a.u. (compared to the molecular size), so that we can scale the potential of the molecule when it is approximated well by 1 / r . The scaling angle is approximately 1.4 radians, and the radial functions extend to r max = 24.3 a.u. The FEM implements Neumann conditions at r max , and we have enforced a boundary condition of vanishing radial functions at r = 0 .

3. Results

3.1. Visualization of Molecular Orbitals for x-, y-, and z-Directed Forces

In Ref. [1], results for probability densities obtained from CAP-FEM solutions in Mathematica® NDEigensystem were shown. For the present work, we calculated the orbitals from the ECS-FEM eigenvectors with the help of a Fortran program. The orbitals from the ECS-FEM have prescribed discontinuities at the scaling radius [19], while the CAP-FEM solutions are smooth. Nevertheless, for radial distances below the scaling radius the shapes are consistent between these methods to the point that visual inspection alone cannot identify differences (the color schemes are similar, but not identical). For the same force orientation as presented in Ref. [1], we now add a comparison of max = 3 , 4 .
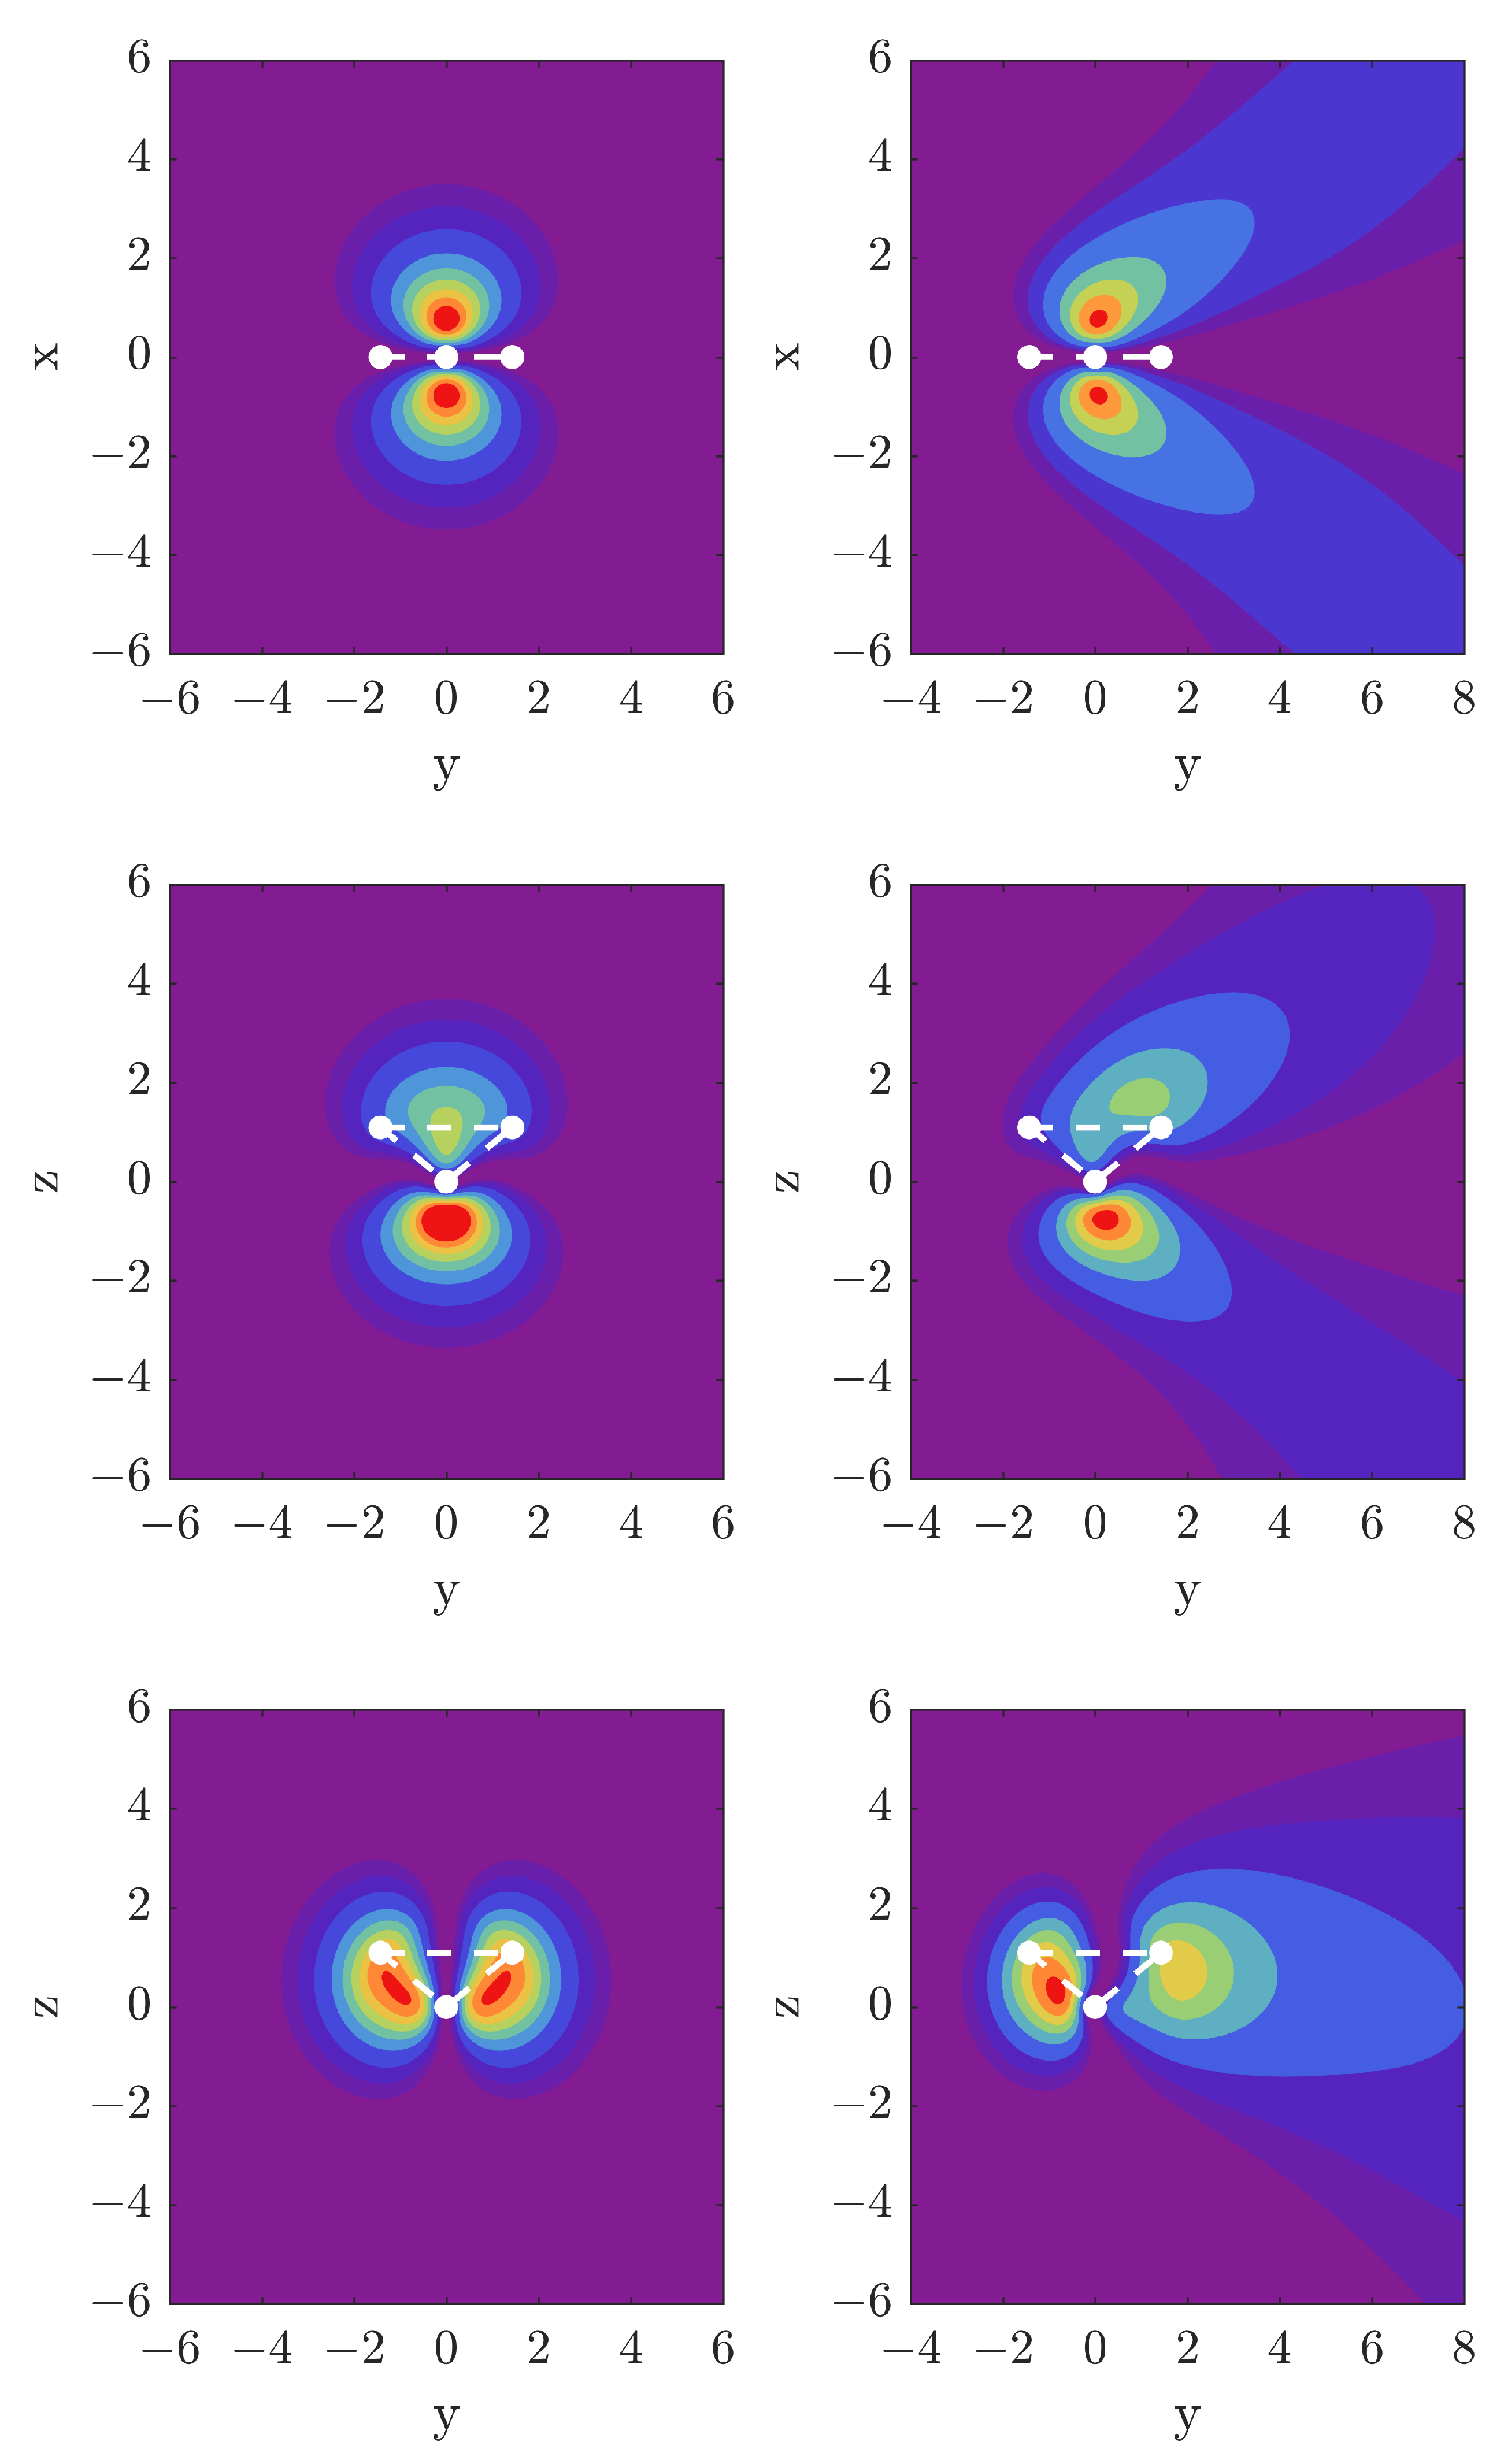
All density plots show some peculiarities. For the force applied in the x direction, the 1 b 1 MO in Figure 1 shows a structure in the orbital shape, where the left lobe of the orbital bends down, along with the right lobe of the orbital. In other words, the electron density is not purely directed along the direction of the force. For the 3 a 1 MO, we observe that it is pushed toward the top right of the box, which implies that the x-directed force leads to part of the density being pushed in the positive z direction. For the 1 b 2 MO, there is a run-away of the density to both positive and negative z along with a movement towards positive x.
When looking at results for the y-directed force in Figure 2, one notices the continuation of the trend as the MOs 1 b 1 and 3 a 1 also have a run-away movement of the density away from the direction of the force. Finally, for 1 b 2 we also observe a structure in the right lobe downwards, away from the direction of the force. All these deformations of the MO probability densities reflect the combined influence of molecular potential and external dc electric field potential.
In Figure 3 we display the MO densities for the case when the force is directed in the z direction. Here we carry out a comparison between max = 3 and max = 4 . When increasing max we observe: (i) a narrowing and re-direction of the MO density of 1 b 1 towards the direction of the force; (ii) the same occurs for 3 a 1 , although there are also two maxima in the density which form at the base of the uppermost lobe; and (iii) we find that the MO 1 b 2 slightly changes in shape, and the lobes lengthen, in part towards the direction of the force. This is caused by the added flexibility in the partial-wave expansion.
To summarize the visualization of our results, which required added computational effort compared to the resonance parameter calculations, we note that the spatial distribution of ionized electrons even under dc field conditions is far from trivial, and would present a fertile ground for comparison with experiment. We note that in the context of ac laser field ionization, R-matrix theory was used recently to predict interesting ionization patterns for the water molecule [20].

3.2. Dominant Field Direction for Ionization of MOs and Their dc Stark Shift

We now proceed with a presentation of the resonance parameters for the MOs, and focus on the behavior of the dc Stark shift for the MO with the largest ionization rate for a given field direction. Our main observation in this work is that the orbital with the strongest ionization rate for a given external field direction displays a non-monotonic behavior in the dc Stark shift.
Graphs of the resonance position for fields along the molecular axis z ^ as a function of field strength were shown in Ref. [1] to display such behavior for the 1 b 1 orbital for the orientation where electrons are pushed out opposite to the hydrogen atoms. The shift was shown to be initially positive, then reached a maximum, and became zero at about F z = 0.14 a.u., in order to continue to negative values for stronger fields.
For the 3 a 1 orbital, non-monotonic dependence of the the dc shift was observed in both directions with minima occurring at force strength of the order of F z = 0.22 a.u. and F z = 0.14 a.u., respectively. The 3 a 1 MO is the orbital with the strongest ionization rate in that case, and the minimum in the dc shift at F z = 0.14 a.u. yields to an almost vanishing Stark shift. The bonding 1 b 2 MO, on the other hand, showed monotonic behavior for fields along z ^ . The purpose of this section is to show that these features can be generalized to other field directions.
In Figure 4, the three valence orbitals are shown for the case of an external field perpendicular to the molecular plane. The results are obviously symmetric with respect to reversing the field orientation. The half-widths show clearly that the MO oriented with lobes in this direction ( 1 b 1 ) is the most easily ionized valence orbital, with rates exceeding the other MOs by one or more orders of magnitude before saturation sets in.
While the 1 b 1 MO shows non-monotonicity in the dc Stark shift with a minimum at F x = 0.12 a.u., and a vanishing shift at F x 0.16 a.u., the other MOs simply acquire increasingly negative dc shifts. We can now ask whether this behavior is more than coincidental: is it true that for a field oriented along the y ^ direction the bonding 1 b 2 orbital might be affected similarly to the 1 b 1 MO’s behavior in the case of a field along x ^ ?
The answer is provided in Figure 5 below; indeed, despite its deep binding energy for substantial field strengths, such as F y > 0.1 a.u., this orbital is clearly the most easily ionized of the three valence orbitals. Note that this is not the case for weak fields, i.e., in the pure tunneling regime. The implication would be that strong fields along the y ^ direction ionization with break-up of a hydrogen bond is becoming the dominant process.
To understand the dominance as far as ionization rate is concerned, geometric considerations are, of course, an important indicator: in a simplistic representation of the three orbitals, i.e., 1 b 1 2 p x , 1 b 2 2 p y , and 3 a 1 2 p z , it is obvious that they respond strongly to fields aligned with x , y , z , respectively, due to the occurrence of substantial dipole matrix elements from the external field.
Interestingly, the non-monotonic behavior in the dc Stark shift for the 1 b 2 orbital occurs only for field strength F y > 0.1 a.u., with a minimum at F y 0.18 a.u., and a vanishing shift at F y 0.25 a.u. Thus the overall trend is comparable to the orbital 1 b 1 , which displays very similar behaviour when under a force in the x direction. The trends of both these orbitals under their respective forces outside of F > 0.1 a.u. are very similar to the trend in 3 a 1 when the z force is in the negative direction.
For the case of fields along the molecular axis z ^ that was discussed in Ref. [1], we report some additional results here, having extended the calculations to the level of max = 4 . Compared to the field orientations along x ^ and y ^ we have the complication of asymmetry of the molecule along the molecular axis; thus, we separate the presentation for fields aligned such that the force pushes electrons out along this axis (Figure 6), and in the opposite direction (Figure 7).
We begin with electrons being pushed out towards the oxygen atom. When one considers field strengths beyond the tunneling regime (where the width turns over towards saturation), the 3 a 1 MO emerges as the one with the highest ionization rate. Due to the asymmetry, the dc Stark shift has a non-zero slope at zero field. The resonance position decreases with increasing field and reaches a minimum at F z 0.23 a.u. The more accurate max = 4 results run parallel to those for max = 3 for the dc shift. For the resonance width, the two results are not well distinguishable on a logarithmic scale except for the weakest field strengths shown.
Concerning the convergence with max , we can state that the weakest bound MO ( 1 b 1 ) is showing the smallest discrepancy, while the bonding orbital ( 1 b 2 ) is affected most, because the partial-wave expansion is sampling the full potential from the hydrogenic parts only gradually as max is increased. We observe, however, that the convergence (or lack thereof) does not have a strong impact on the features reported in this work, i.e., the non-monotonicity of the shifts. For fields in the opposite direction, i.e., ionization into the half-space on the hydrogenic side (away from the oxygen atom), we again notice that the dominant ionization contribution is from the MO 3 a 1 , and that this MO displays complicated non-monotonic behavior in the dc Stark shift.
To summarize this section we observe that the conclusions are consistent for the four possible field orientations (the z direction has two possible orientations due to asymmetry of the molecule) associated with symmetry axes of the orbitals. We conclude that the non-monotonic behavior of the dc Stark shift goes hand-in-hand with the relatively strong ionization rate for the orbital of that particular symmetry.
While our results for the widths of the 3 a 1 orbital show an asymmetry when changing the z force direction from positive to negative, this behavior is different from what was observed for the net molecular width in HF theory [3], as shown in Figure 7 of Ref. [1].
Our own net widths are dominated by the 3 a 1 orbital, and so a natural question to ask is whether there is a convergence issue in our partial-wave approach. The max = 4 results do not deviate, however, substantially from those for max = 3 . Thus, one will have to investigate further whether this difference in behavior is related to the determination of the net decay width, or whether it is the model potential approach that fails to account for self-consistent field effects in the presence of the external field.

3.3. Comparison with HF and CCSD(T) Calculations for Net Ionization

In Figure 8 we compare with the HF and CCSD(T) total molecular Stark shifts and resonance widths given in Ref. [3]. As explained in Ref. [1] for our model calculation a meaningful comparison is to consider the direct sum of orbital energies. Such an analysis corresponds to total (net) ionization from the molecule, and the five MOs are counted twice to account for the spin degeneracy.
The most direct comparison for the present results should be with the mean-field single-particle approach, i.e., the HF method, as our model potential is designed to match HF orbital energies. The comparison of the dc Stark shifts for field directions along x ^ and y ^ shows that the present model calculation yields stronger shifts as the field strength increases, but that the overall trend agrees with the HF results of Ref. [3].
We observe a similar trend in the decay widths: they agree at the factor-of-two level for the cases involving fields along x ^ and y ^ . This is an improvement compared to the results for forces along the molecular axis in the positive z direction, while comparable to the case when the force is in the negative z direction [1]. We note that the additional corrections due to electronic correlation, i.e., the CCSD(T) over the HF results, are also on a similar scale, i.e., a discrepancy at the level of factors of two–three when the ionization rate is strong.
The blue dots () mark the DS (2) values, i.e., the direct sum method, in which we calculate the total molecular Stark shift and width by adding the resonance parameters for every MO (as reported in Section 3.2) assuming double occupancy due to spin degeneracy [1]. The agreement between DS (2) and the HF results of Ref. [3] is generally good for the Stark shifts but less so for the widths. At higher field strengths, the agreement weakens, and more so for the force in the y direction. For the widths, DS (2) results (shown as ) begin with improving the agreement with HF (shown as ) as a function of the force strength. We note that the correlated CCSD(T) calculations of Ref. [3] generally do not deviate much from the HF data, and that the present model calculations in some cases, perhaps fortuitously, agree with them.
The Stark shifts for the x-directed force agree very well with the CCSD(T) results of Ref. [3] with single-digit percentage deviations. It would be of interest to compare the MO resonance parameters from HF calculations with the present model potential results in order to complement the comparison of net quantities which follow from the total energy. For the purposes of eventual comparison with the experiment, and to understand the theory better, more work must be done to bridge the gap between the multi-electron solutions, HF and CCSD(T), and the present single-electron, local potential approach. For future work, it is planned to extend the current work to a potential model from density functional theory, such as the local HF potential method [21,22].

3.4. Interactions between the Molecular Orbitals

A perturbative treatment of the distortion of the energy level spectrum due to an external field leads to a power series in an expansion parameter which is proportional to the external field. Nonlinear Stark shifts (or non-monotonic behavior) arise for strong perturbations. This approach of a limited-subspace diagonalization involving only neighboring levels shows distortions in the energy levels (in our case resonance positions) as a function of field strength which can be interpreted as ‘interactions’ between the unperturbed levels. We maintain the designation of the field-free MOs ( 1 b 1 , 3 a 1 , 1 b 2 ), even though the symmetries of the MOs are no longer observed once the electric field is turned on.
Strong non-perturbative behavior was obtained for Rydberg states of atomic hydrogen using sophisticated numerical work [23], leading to avoided energy level crossings at critical field strengths. Thus, it is of interest to view our results not only one MO at a time, but to show the energy levels for the three valence orbitals together.
For fields along the molecular axis, the asymmetry of the 3 a 1 orbital causes a marked difference in Stark shift for the two cases shown in Figure 9. The densities in the two top rows of Figure 1 serve to visualize how the 3 a 1 and 1 b 1 MOs are affected by the external field acting along ± z ^ . First of all, we note the different energy scales for the left and right panels, and how for the external electric force pushing in the + z ^ direction larger shifts are obtained than for the case of z ^ . For the bonding 1 b 2 orbital, the Stark shift is monotonic and on a relative scale decoupled from the other two valence orbitals except for some interaction with the 3 a 1 MO for force in the z ^ direction. The two outer orbitals interact strongly with each other for electic force along + z ^ with an avoided crossing at F 0 0.17 a.u.
It is interesting to consult Figure 7 to observe what happens to the decay widths as one varies the electric field strength across the crossing point. While the decay rate for what is the 3 a 1 MO at zero field levels off to a (relatively large) constant value as one increases the field strength, the one for the 1 b 1 MO keeps increasing.
For the case of fields along x ^ and y ^ shown in Figure 10, we observe a repulsion of the 1 b 1 and 3 a 1 MO energy positions for fields along x ^ . For the other case, i.e., fields along y ^ complicated behavior sets in between the bonding 1 b 2 MO with 3 a 1 at the strongest fields shown with a possible curve crossing at even stronger fields.
To summarize this section, we conclude that with the exception of the 3 a 1 MO, with the electrons being pushed to positive z ^ , for which a very nonlinear Stark shift is observed as a result of an avoided curve crossing, the non-monotonic shift behavior is not obviously related to MO levels interacting very strongly with each other. Another way to state this is that the level interactions occur while the energy levels are well separated in those cases.

4. Conclusions

In this work we have extended our previous model calculations for dc field ionization of the water molecule [1] mostly in two respects:
(i) we have included two orientations for the external field to complement the previous work which was restricted to fields along the molecular axis;
(ii) for fields oriented with the molecular axis we have validated the conclusions based on the limited calculations in the angular momentum basis by comparing results for max = 3 with those for max = 4 .
Extension (i) allowed us to gain some understanding concerning the non-monotonic behaviour of the dc Stark shift, as being associated with the MO that is most easily ionized by a given field orientation. Extension (ii), while not a complete convergence analysis, nevertheless provides strong evidence that the major conclusions concerning dc Stark shifts and resonance widths will not be overturned by the inclusion of more partial waves. These higher- contributions are likely to play a significant role when one analyzes the spatial emission properties of the ionized electrons.
It would be of great interest to explore in experiments with infrared laser fields and oriented molecules the predictions made for the non-monotonic dc Stark shifts. Experiments with oriented nitrogen and carbon dioxide molecules have been performed [8], and water vapor does represent a challenge. Ionization from particular MOs would require some method of vacancy detection, so this is definitely a challenge compared to ionization from particular MOs by electron [24] or X ray [20] impact where one has some control through the incident particle energy, or even the secondary electron energy in an (e,2e) process [5].

Supplementary Materials

The following supporting information can be downloaded at: https://www.mdpi.com/article/10.3390/atoms10030084/s1, Non-Monotonic dc Stark Shifts in the Rapidly Ionizing Orbitals of the Water Molecule (Supplementary Materials).

Author Contributions

Both authors contributed equally to this work. All authors have read and agreed to the published version of the manuscript.

Funding

This work was supported by the Natural Sciences and Engineering Research Council of Canada (NSERC) under RGPIN-2017-05655.

Data Availability Statement

Data in numerical form are available upon request.

Acknowledgments

Discussions with Tom Kirchner and Michael Haslam are gratefully acknowledged. We would also like to thank Steven Chen for support with the high-performance computing server used for our calculations. Financial support from the Natural Sciences and Engineering Research Council of Canada is gratefully acknowledged.

Conflicts of Interest

The authors declare no conflict of interest.

References

  1. Pirkola, P.; Horbatsch, M. Partial-wave approach to the Stark resonance problem of the water molecule. Phys. Rev. A 2022, 105, 032814. [Google Scholar] [CrossRef]
  2. Laso, S.A.; Horbatsch, M. Stark resonance parameters for the 3a 1 orbital of the water molecule. J. Phys. B At. Mol. Opt. Phys. 2017, 50, 225001. [Google Scholar] [CrossRef]
  3. Jagau, T.C. Coupled-cluster treatment of molecular strong-field ionization. J. Chem. Phys. 2018, 148, 204102. [Google Scholar] [CrossRef] [PubMed]
  4. Heßelmann, A.; Götz, A.W.; Della Sala, F.; Görling, A. Numerically stable optimized effective potential method with balanced Gaussian basis sets. J. Chem. Phys. 2007, 127, 054102. [Google Scholar] [CrossRef] [PubMed]
  5. Nixon, K.L.; Kaiser, C.; Murray, A.J. Ionization of Water Using the (e, 2e) Technique from the 1b1 HOMO State and from the 3a1 n-HOMO State. Available online: http://es1.ph.man.ac.uk/AJM2/Water.html (accessed on 8 December 2021).
  6. Milne-Brownlie, D.S.; Cavanagh, S.J.; Lohmann, B.; Champion, C.; Hervieux, P.A.; Hanssen, J. Dynamics in electron-impact ionization of H2O. Phys. Rev. A 2004, 69, 032701. [Google Scholar] [CrossRef]
  7. Jahnke, T.; Guillemin, R.; Inhester, L.; Son, S.K.; Kastirke, G.; Ilchen, M.; Rist, J.; Trabert, D.; Melzer, N.; Anders, N.; et al. Inner-Shell-Ionization-Induced Femtosecond Structural Dynamics of Water Molecules Imaged at an X-ray Free-Electron Laser. Phys. Rev. X 2021, 11, 041044. [Google Scholar] [CrossRef]
  8. Mairesse, Y.; Dudovich, N.; Levesque, J.; Ivanov, M.Y.; Corkum, P.B.; Villeneuve, D.M. Electron wavepacket control with elliptically polarized laser light in high harmonic generation from aligned molecules. New J. Phys. 2008, 10, 025015. [Google Scholar] [CrossRef]
  9. Moccia, R. One-Center Basis Set SCF MO’s. III. H2O, H2S, and HCl. J. Chem. Phys. 1964, 40, 2186–2192. [Google Scholar] [CrossRef]
  10. Errea, L.; Illescas, C.; Méndez, L.; Rabadán, I.; Suárez, J. Lattice description of electron loss in high-energy H++H2O collisions. Chem. Phys. 2015, 462, 17–22. [Google Scholar] [CrossRef]
  11. Windholz, L.; Wasowicz, T.J.; Drozdowski, R.; Kwela, J. Stark effect of atomic Helium singlet lines. J. Opt. Soc. Am. B 2012, 29, 934–943. [Google Scholar] [CrossRef]
  12. Bethlem, H.L.; Tarbutt, M.R.; Küpper, J.; Carty, D.; Wohlfart, K.; Hinds, E.A.; Meijer, G. Alternating gradient focusing and deceleration of polar molecules. J. Phys. B At. Mol. Opt. Phys. 2006, 39, R263–R291. [Google Scholar] [CrossRef]
  13. Aggarwal, P.; Bethlem, H.L.; Borschevsky, A.; Denis, M.; Esajas, K.; Haase, P.A.B.; Hao, Y.; Hoekstra, S.; Jungmann, K.; Meijknecht, T.B.; et al. Measuring the electric dipole moment of the electron in BaF. Eur. Phys. J. D 2018, 72, 197. [Google Scholar] [CrossRef]
  14. Lüdde, H.J.; Jorge, A.; Horbatsch, M.; Kirchner, T. Net Electron Capture in Collisions of Multiply Charged Projectiles with Biologically Relevant Molecules. Atoms 2020, 8, 59. [Google Scholar] [CrossRef]
  15. Illescas, C.; Errea, L.F.; Méndez, L.; Pons, B.; Rabadán, I.; Riera, A. Classical treatment of ion-H2O collisions with a three-center model potential. Phys. Rev. A 2011, 83, 052704. [Google Scholar] [CrossRef]
  16. Jorge, A.; Horbatsch, M.; Illescas, C.; Kirchner, T. Classical-trajectory Monte Carlo calculations of differential electron-emission cross sections in fast heavy-ion collisions with water molecules. Phys. Rev. A 2019, 99, 062701. [Google Scholar] [CrossRef]
  17. Jorge, A.; Horbatsch, M.; Kirchner, T. Multicharged-ion–water-molecule collisions in a classical-trajectory time-dependent mean-field theory. Phys. Rev. A 2020, 102, 012808. [Google Scholar] [CrossRef]
  18. Scrinzi, A.; Elander, N. A finite element implementation of exterior complex scaling for the accurate determination of resonance energies. J. Chem. Phys. 1993, 98, 3866–3875. [Google Scholar] [CrossRef]
  19. Scrinzi, A. Infinite-range exterior complex scaling as a perfect absorber in time-dependent problems. Phys. Rev. A 2010, 81, 053845. [Google Scholar] [CrossRef]
  20. Benda, J.; Gorfinkiel, J.D.; Mašín, Z.; Armstrong, G.S.J.; Brown, A.C.; Clarke, D.D.A.; van der Hart, H.W.; Wragg, J. Perturbative and nonperturbative photoionization of H2 and H2O using the molecular R-matrix-with-time method. Phys. Rev. A 2020, 102, 052826. [Google Scholar] [CrossRef]
  21. Della Sala, F.; Görling, A. The asymptotic region of the Kohn–Sham exchange potential in molecules. J. Chem. Phys. 2002, 116, 5374–5388. [Google Scholar] [CrossRef]
  22. Sala, F.D. The localized Hartree–Fock method for a self-interaction free Kohn–Sham potential: Applications to closed and open-shell molecules. Theor. Chem. Accounts 2007, 117, 981–989. [Google Scholar] [CrossRef]
  23. Luc-Koenig, E.; Bachelier, A. Systematic theoretical study of the Stark spectrum of atomic hydrogen. I. Density of continuum states. J. Phys. B At. Mol. Phys. 1980, 13, 1743–1767. [Google Scholar] [CrossRef]
  24. Song, M.Y.; Cho, H.; Karwasz, G.P.; Kokoouline, V.; Nakamura, Y.; Tennyson, J.; Faure, A.; Mason, N.J.; Itikawa, Y. Cross Sections for Electron Collisions with H2O. J. Phys. Chem. Ref. Data 2021, 50, 023103. [Google Scholar] [CrossRef]
Figure 1. Probability densities of the MOs calculated at the level of max = 3 with an x-directed force: 1 b 1 (top row), 3 a 1 (middle row), and 1 b 2 (bottom row). On the left are the field-free cases, and on the right with electric force applied with strengths 0.12, 0.20, 0.28 a.u., respectively, which give similar decay rates. Contour heights starting with the outermost are 0.005, 0.01, 0.02, then they increase in steps of 0.02 a.u. The positions of the nuclei are marked by white dots.
Atoms 10 00084 g001
Figure 2. Probability densities of the MOs calculated at the level of max = 3 with a y-directed force: 1 b 1 (top row), 3 a 1 (middle row), and 1 b 2 (bottom row). On the left are the field-free cases, and on the right with electric force applied with strengths 0.20, 0.20, 0.16 a.u. respectively, which give similar decay rates. Contour heights starting with the outermost are 0.005, 0.01, 0.02, then they increase in steps of 0.02 a.u. The positions of the nuclei are marked by white dots.
Atoms 10 00084 g002
Figure 3. Probability densities using a z-directed force for the MOs 1 b 1 (top row), 3 a 1 (middle row), and 1 b 2 (bottom row). Left column is based on max = 3 , right column for max = 4 . The force strength for the MO 3 a 1 is 0.10 a.u., while for 1 b 1 and 1 b 2 it is 0.20 a.u. Contour heights starting with the outermost are 0.005, 0.01, 0.02, then they increase in steps of 0.02 a.u.
Atoms 10 00084 g003
Figure 4. The left panel contains the resonance positions while the right panel contains half-widths for the valence orbitals of water in a DC field. Here, F x > 0 corresponds to a force experienced by the electron in the positive x direction.
Atoms 10 00084 g004
Figure 5. The left panel contains the resonance positions while the right panel contains half-widths. Here, F y > 0 corresponds to a force experienced by the electron in the positive y direction.
Atoms 10 00084 g005
Figure 6. The left panel contains the resonance positions while the right panel contains half-widths for the valence orbitals of water in a DC field. Here, F z < 0 corresponds to a force experienced by the electron in the negative z direction. The max = 3 and max = 4 results are shown in blue () and purple (), respectively.
Atoms 10 00084 g006
Figure 7. The left panel contains the resonance positions while the right panel contains half-widths for the valence orbitals of H 2 O in a dc field. Here, F z > 0 corresponds to a force experienced by the electron in the positive z direction. The max = 3 and max = 4 results are shown in blue () and purple (), respectively.
Atoms 10 00084 g007
Figure 8. The left panel displays dc Stark shifts, while the right panel displays full-widths for the water molecule. The blue dots () are the present DS (2) results calculated at the level of max = 3 , the purple dots () are the HF results, and the purple triangles () are the CCSD(T) results.
Atoms 10 00084 g008
Figure 9. Resonance positions for the three valence MOs exposed to a field aligned (left panel) and counter-aligned (right panel) with the molecular axis, where F z > 0 corresponds to a force experienced by the electron in the positive z direction. The solid dots are for calculations with max = 3 and the triangles with max = 4 .
Atoms 10 00084 g009
Figure 10. Resonance positions for the three valence MOs exposed to a field along the x-axis (left panel) and y-axis (right panel), respectively. These axes are symmetry axes, so there is no dependence on the sign of the field.
Atoms 10 00084 g010
Publisher’s Note: MDPI stays neutral with regard to jurisdictional claims in published maps and institutional affiliations.

