Article

Tunability of Half Cycle Cutoff Harmonics with Inhomogeneously Enhanced Laser Pulse

Department of Physical Sciences, Indian Institute of Science Education and Research Mohali, Knowledge City, Sector 81, SAS Nagar, Punjab 140306, India
Atoms 2023, 11(8), 113; https://doi.org/10.3390/atoms11080113
Submission received: 31 May 2023 / Revised: 28 July 2023 / Accepted: 17 August 2023 / Published: 18 August 2023
(This article belongs to the Special Issue Recent Progress in Strong-Field Atomic and Molecular Physics)

Abstract

:
For homogeneous driving, half cycle harmonics and its corresponding half cycle cutoff (HCO) show prominent spectral features, allowing one to produce an isolated attosecond pulse with suitable filtering, or vice versa the retrieval of the driving pulse itself. The temporal profile and spatial dependence of the inhomogeneously enhanced field are two important factors that determine the high harmonic generation (HHG) near a plasmonic nanostructure. This leads us to the question of how the HHG spectra and, in particular, the corresponding half cycle harmonics modify with different types of inhomogeneously enhanced fields. To elucidate this, we have made a comparative study of the HHG in three different types of inhomogeneously enhanced laser pulses by employing the time-dependent Schrödinger equation in one dimension. Within our chosen parameter range, the HCO in cutoff and mid-plateau regimes shift towards higher order with the increase of strength of the inhomogeneity in isotropic case. In anisotropic inhomogeneity, the cutoff HCO shifts towards the higher order but the mid-plateau HCO shifts towards lower order with the increase of strength of inhomogeneity. With increasing carrier envelope phase (CEP), the enhanced HCO in the lower-order harmonic region shifts towards higher orders. This shift is nearly linear from near the above threshold to mid-plateau region and becomes saturated in the near cutoff region. The harmonic spectra is modulo- π periodic for the isotropic inhomogeneity and it is modulo- 2 π periodic for the anisotropic inhomogeneity. This extension of periodicity increases the tunability of the enhanced HCO harmonics with CEP in the anisotropic inhomogeneity than the CEP tuning of the HCO harmonics in the isotropic inhomogeneity or vice versa the retrieval of CEP.

1. Introduction

The details of the temporal structure of the driving laser pulse become increasingly important for the high harmonic generation (HHG) as we go towards a few optical cycle pulse lengths [1,2,3,4,5,6]. For a chirp-free pulse, the pulse envelope and the carrier envelope phase set the amplitude of each half optical cycle. While interacting with atomic, molecular, or condensed matter systems, the overall electronic response results from the contribution form each of the half cycles of these pulses. Selective portions of the harmonic spectrum can become enhanced due to the generation in the cutoff regions corresponding to a few half optical cycles of the driving laser pulse, well-known as the half cycle cutoff (HCO) [7,8,9].
Half cycle harmonics have been studied with particular emphasis on electron dynamics in atoms and molecules interacting with a few cycle pulses. The carrier envelope phase (CEP) retrieval of a few optical cycle laser pulses through HCO have been theoretically predicted [7] and experimentally demonstrated [8]. The production of isolated attosecond pulses are demonstrated using the HCO-enhanced harmonics [8]. HCO in the near-threshold harmonics are found to be very sensitive to the ionic potential [10]. Refs. [11,12] have implemented the HCO harmonics to identify the temporal location of the HHG by exploiting the fact that the rate of change of the HCO with respect to gating depends on the location of the half cycle in the driving pulse. HCO positions have been found to drastically modify the extreme-ultraviolet (XUV) cutoff [13]. The spectral width of the XUV continuum have been controlled by modifying the difference of the cutoff energies between the highest and the second-highest half-cycles using a bichromatic field [14]. Refs. [15,16,17] have shown numerically that by employing an additional ultraviolet pulse one can enhance the selective HCO harmonics, and thereby its detection. Employing the CEP-dependent peak position of the half cycles of the electric field profile, [18] have demonstrated the extraction of a pulse’s envelope and chirp. [19] show that the idea of HCO can be applied to the high-energy coherent photoelectrons and also extended the spectral range of HCO to soft X-ray harmonics. Half-cycle cutoff features up to 385 eV using HHG with two-cycle, carrier-envelope-phase-controlled pulses at 1.85 μ m are demonstrated [20].
Recently, it has been found that the nanostructure environment is a promising candidate for the coherent control of electron dynamics to produce high-energy photons/photoelectrons along with high tunability [21,22,23,24,25,26,27]. This is due to the field enhancement, spatial variation of field intensity of the pulse, and truncation of trajectories near the nanostructure boundary [22,24]. Compared to the homogeneous fields in the inhomogeneous field, the harmonic emissions tend to become confined in the sub-cycle temporal range of the pulse. Recently, a sensitivity to the CEP on photoemissions from plasmonic gold nanoantennas excited with a few cycle optical pulses were studied and it was found that it depends heavily on the pulse shape and pulse energy, owing to the competition between the consecutive sub optical cycles [28]. Sub-cycle controlled ionization has been studied in single solid-state nanostructures recently in [29].
However, HCO in nanostructure-assisted HHG are comparatively less studied in the literature despite its potential importance in achieving selective enhancement and characterizing CEP. In a spatially inhomogeneous driving field, the HCO are found to be very sensitive to the strength of inhomogeneity, the reason being the energy gain by the electron in the laser+ion potential, which is modified heavily due to the spatial inhomogeneity [30]. Therefore, one can ask how the HCO modifies with different types/rate of inhomogeneously enhanced fields, which has not been studied so far. To illustrate this we have studied the HHG process with a few cycle driver in three different types of inhomogeneity employing time-dependent Schrödinger equations in one dimension ( 1 D ). Time-resolved harmonic generation is studied using the Gabor transformation of quantum mechanical dipole acceleration along with classical trajectory simulation.
The cutoff and mid-plateau HCO shift towards the higher order with the increase of strength for the isotropic inhomogeneity. In anisotropic inhomogeneity, the cutoff HCO shifts towards the higher order but the mid-plateau HCO shifts towards the lower order with the increase of strength of inhomogeneity. The HCO are very sensitive to the CEP of the pulse. HCO in the lower-order harmonic region shifts towards higher orders with the increase of CEP. The harmonic spectra is modulo- π periodic for the isotropic inhomogeneity and it is modulo- 2 π periodic for the anisotropic inhomogeneity. This extension of periodicity increases the tunability of the enhanced HCO regions with CEP in the latter case than the CEP tuning of the HCO harmonics in the isotropic inhomogeneity or vice versa the retrieval of CEP.
The article is organized as follows. In Section 2 we have briefly presented the theoretical methods applied in this study, in Section 3 we have presented the results, followed by a conclusion in Section 4.

2. Theoretical Methods

The interacting laser pulse is considered to be linearly polarized. The electron motion that gives most of the contribution to the harmonic generation process is parallel to the laser’s polarization direction [31]. Therefore, it is reasonable to solve the time-dependent Schrödinger equation (TDSE) in the reduced dimension. The 1 D TDSE for the atomic electron in length gauge [24,32,33] is
i t | ψ ( x , t ) = p 2 2 + V ( x ) + H I | ψ ( x , t ) ,
With H I = x E ( x , t ) , which describes the interaction of the electron with the laser pulse. We have used atomic units (a.u.) throughout unless otherwise specified.
Using Ehrenfest’s theorem, the dipole acceleration is written as
d ( t ) = ψ ( x , t ) | d d x { V ( x ) x E ( x , t ) } | ψ ( x , t ) .
The emission spectra is given by the Fourier transformation of the dipole acceleration as [33,34]
| d ( ω ) | 2 = | 0 d ( t ) e x p [ i ω t ] d t | 2 .
In the full-time Fourier transform, we obtain the complete spectral information of the harmonics, but the temporal information is lost. To detect further aspects of recollision dynamics, we perform the Gabor transformation for computing the time–frequency response (TFR) of the harmonic generation as [24,35,36,37,38]
σ W ( ω , τ ) = a ( t ) W ( t τ ) e i ω t d t ,
where the Gabor window is defined as
W ( t τ ) = e x p ( ( t τ ) 2 / δ 2 ) .
The temporal width of the Gabor window δ can be tuned to extract the relevant spectral information in expense of temporal information. As the width becomes larger, one gets closer to the original Fourier transformation [39]. The value of δ was taken as 1 3 ω , which provides a good balance between the spectral and the temporal structures of the HHG process [37]. The model potentials for the atomic system is taken as [40]
V ( x ) = 1 x 2 + α 2 .
We have taken α = 1.18 , which gives the ground state of the potential as 0.58 a.u. ( 15.76 ) eV corresponding to the ionization potential of argon. The electric field of the laser pulse is taken as
E ( x , t ) = E 0 f ( t ) [ 1 + g ( x ) ] [ c o s ( ω t + ϕ C E P ) ] ,
where the angular frequency of the laser pulse is ω = 0.0254 a.u. (1790 nm), and the peak electric field amplitude of the incoming driving laser pulse is E 0 = 0.048 a.u. (the corresponding intensity is 8 × 10 13 W / c m 2 ). We take three different forms of the spatial inhomogeneity viz. g ( x ) = ϵ q x 2 , ϵ m | x | and ϵ x . The parameters ϵ q , ϵ m , ϵ represent the strength of the field inhomogeneity. This approximation of the inhomogeneity captures the essential physics of HHG near various plasmonic nanostructure environments. Physically, the symmetric forms represent the plasmonic field enhancement near bow-tie-like nanostructures [30,32,41,42]. The spatially asymmetric plasmonic field enhancements correspond to that due to the nanotip [22,41,42]. f ( t ) represents the shape of the pulse envelope, taken as
f ( t ) = c o s 2 ( π t / τ ) ,
where τ is the length of the pulse, which is taken to be 4 optical cycles. For further analysis, we solve the Newton’s second law of motion to compute the classical trajectories of the ionized electron moving in the laser field [33]. The first return of the electron, starting from an ionization time at position x = 0 , is considered as a recollision event and the corresponding return kinetic energy is computed. This, in addition to the ionization potential, are converted to the respective emitted harmonic photon energy. A detailed investigation on the gauge dependence of these results is beyond the scope of the present work. The validity of this model study can be ensured as g ( x a b s ) 1 , where x a b s denotes the truncation boundary, which is satisfied here.

3. Results and Discussion

First, we take a look into the half cycle harmonics and corresponding HCO for high harmonic generation in a homogeneous environment. In Figure 1a we have shown the HHG spectra generated by a four cycle pulse with carrier envelope phase ϕ = 0 interacting with the model atom. The plateau and near cutoff region harmonic spectra show some prominent enhanced regions, about harmonic order 135, 105, and 50. One can see their temporal origin in the time–frequency map of the dipole acceleration, as shown in Figure 1b; they originate near 2.25 , 2.75 , and 3.25 optical cycle. Also, we can see the temporal structure of the rescattering events and identify the HCO region in the classical trajectory calculation, see the marked regions in Figure 1c. The quantum TFR map shows that these cutoff regions have comparatively higher recombination strength than in the half cycle plateau harmonics. They have contributions from both short and long trajectories, as can be seen from the TFR and classical trajectory simulations (CTS).
Now we see how the spectra modify with respect to different types of inhomogeneity and how the HCO enhancement are dependent on the structure. We have taken three different functional forms of the inhomogeneous enhancement, where the g ( x ) = ϵ x , ϵ m | x | , and ϵ q x 2 as mentioned above. Near a plasmonic nanostructure, the harmonic generation process is mostly influenced by the dynamics of free electrons in the inhomogeneous field due to the plasmonic enhancement until it hits the nanostructure and may become absorbed. Thus, the harmonic spectra depends on both the plasmonic enhancement and the absorbing boundary [22,24]. The confinement boundary, i.e., the gap size of the region of inhomogeneity is 250 a.u. In our numerical simulation, we set the absorbing boundary near ± 125 a.u., thereby we focus on the dependence of the harmonic generation on the different forms of the inhomogeneity. Numerically, we take the form of the absorbing potential V a b s as given in [43] and multiply the wavefunction with e x p ( V a b s ) after each time step. For the homogeneous driving, the classical quiver radius is x α = E 0 / ω 2 = 74.4 a.u., so the absorbing boundary is about 1.5 times higher than all of the short trajectories and a few of the long trajectories in the near classical cutoff. This loss of trajectories due to absorption of long trajectories near the boundary is clearly seen in Figure 1d where this boundary condition is satisfied compared to (c), where the absorbing boundary is set at a very high value. Hereafter, all of the computations are performed with the nanostructure-absorbing boundary condition.
In Figure 2, we have presented the HHG spectra for the above-mentioned types of inhomogeneity in different panels, where the CEP of the driving pulse is zero. For the sake of comparison, we have plotted the HHG spectra in the homogeneous driving. We have increased the strength of inhomogeneity for each type up to the point when the HCO-enhanced structure nearly disappears. In this way, we can qualitatively compare the dynamics of HCO with respect to the various types of inhomogeneity.
In the inhomogeneous driving, with the increasing strength of inhomogeneity, the extension of the cutoff is observed irrespective of the type of functional dependence. This extension of the cutoff is due to the gain in more kinetic energy while traveling in the enhanced inhomogeneous field compared to the homogeneous driving [22,24]. Also, with the increase of inhomogeneity, we can observe that the spectrum becomes more dense towards a quasicontinuum generation. For the asymmetric inhomogeneity, ref. [22] showed that with a continuous wave laser even harmonics are produced due to the broken inversion symmetry, and with the increase of strength of inhomogeneity, the intensity of even harmonics become similar to that of the odd harmonics. Similarly, in the present calculation, we can see that the spectral intensity becomes flat over the spectral range as we have used a few cycle driving pulse. Furthermore, we can clearly see the extension of each half cycle of plateau harmonics, which is due to the corresponding enhancement of the electric field amplitude of the pulse in x 2 and | x | types, but for x, we can see a different trend in the evolution of the mid-plateau HCO, which shifts towards the lower order with the increase of strength of inhomogeneity.
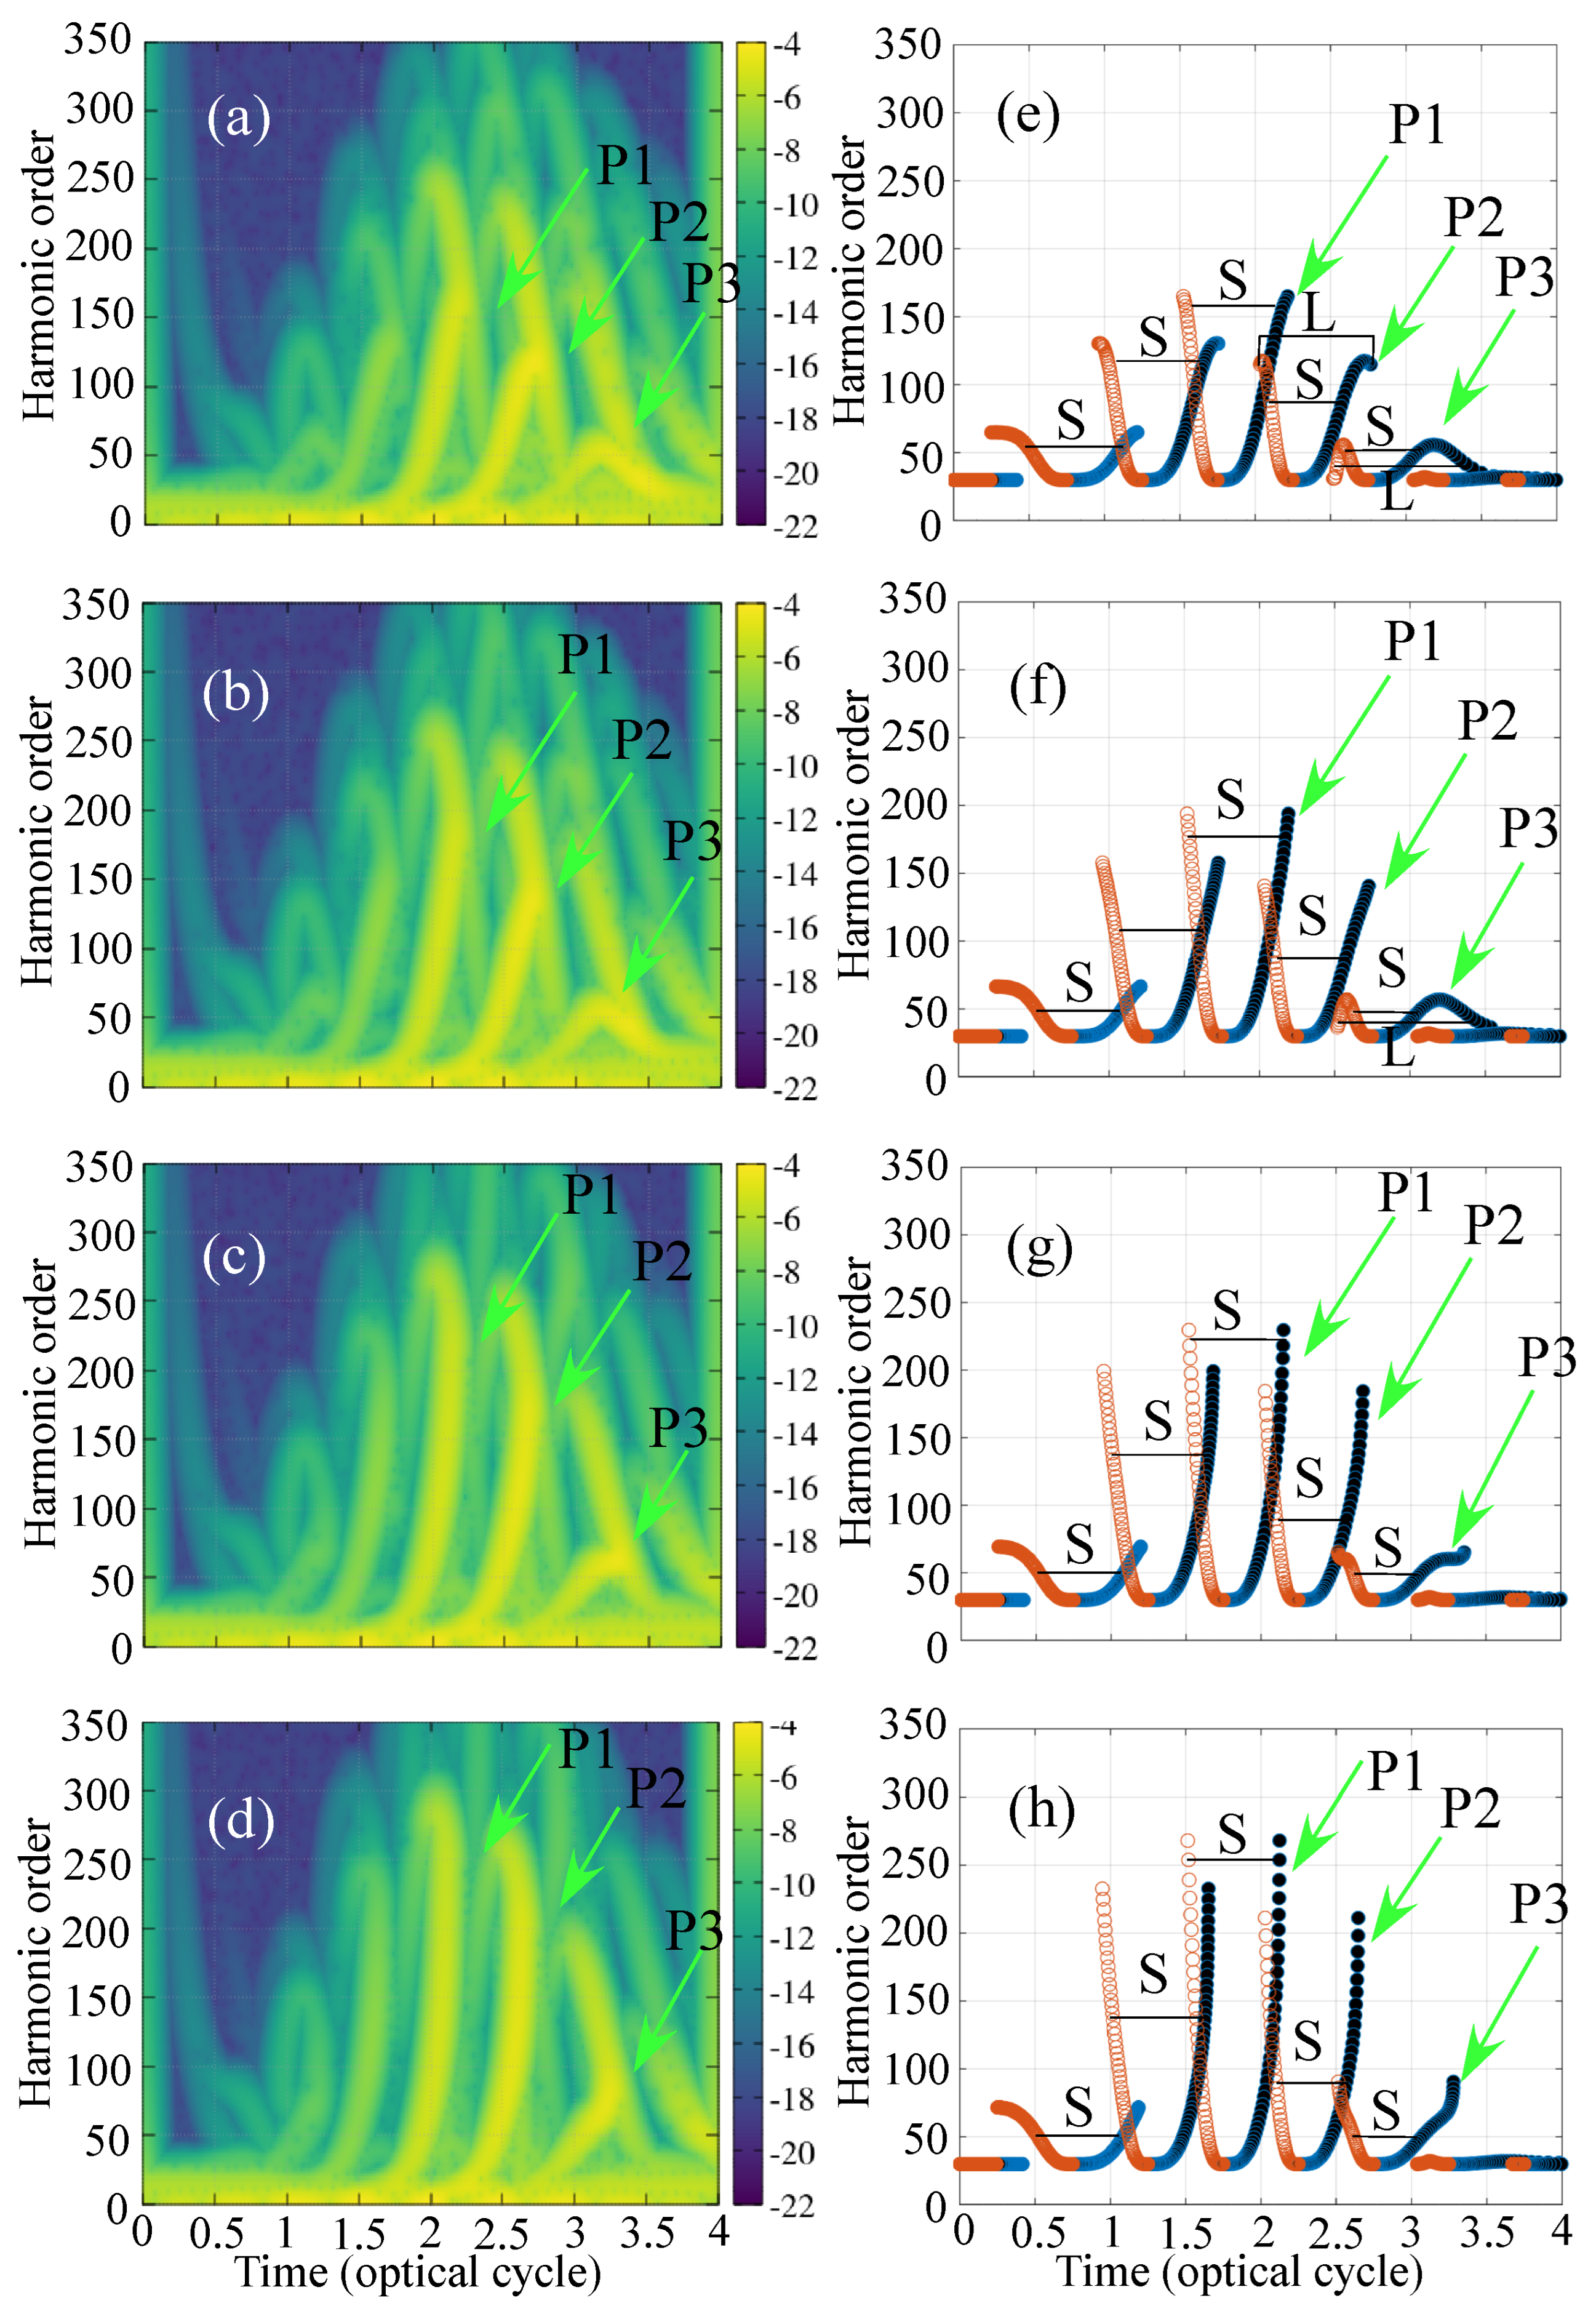
To understand the temporal development and investigate the dynamics in the half cycle, we have computed the time–frequency response of the dipole acceleration of the electron as shown in Figure 3 for ϵ m | x | inhomogeneity. The parameter varied as ϵ m = 1 × 10 4 , 5 × 10 4 , 1 × 10 3 , and 2 × 10 3 in units of inverse of length in atomic units. The harmonics are generated in the falling edge of the pulse. The primary three recollision events are identified and marked as P1, P2, and P3 in the TFR maps corresponding to the three half optical cycles. These recollision events are also clearly identified in the classical solution of Newton’s second law for electron’s motion in the inhomogeneous field for the first recollision, consecutively marked as P1, P2, and P3. This also provides a cross verification of our computation. For the lowest value of inhomogeneity, the trajectories are more or less similar to the trajectories in the homogeneous driving, as shown in panels (a,e) of Figure 3, also compared with the HHG spectra for the homogeneous (black) and curves for ϵ m = 1 × 10 4 (red). With this strength of inhomogeneity, the cutoffs are seen to have extended by a small amount. The truncation of the long trajectories are due to the absorption near the boundary (compare with the classical return picture in Figure 1d and Figure 3e). As we increase the strength of inhomogeneity, these half cycles fields become enhanced which increases the quiver radius ( E / ω 2 ) and subsequent gain in return kinetic energy ( E 2 / ω 2 ). Therefore the simple man model shows that with the increase of strength of inhomogenity, first the long trajectories and then the short trajectories would become absorbed near the boundary. This can be seen in the classical return picture in the panels (e–h) and in the quantum TFR maps in (a–d). With the increasing strength of inhomogeneity, the enhanced HCO due to the P1 and P2, i.e., cutoff and plateau, are broadened and eventually become nearly merged in the background at the highest value of the strength considered here. The enhancement near the threshold trajectory as marked with P3 in the panels are much robust with respect to the strength of inhomogeneity in the chosen parameter range.
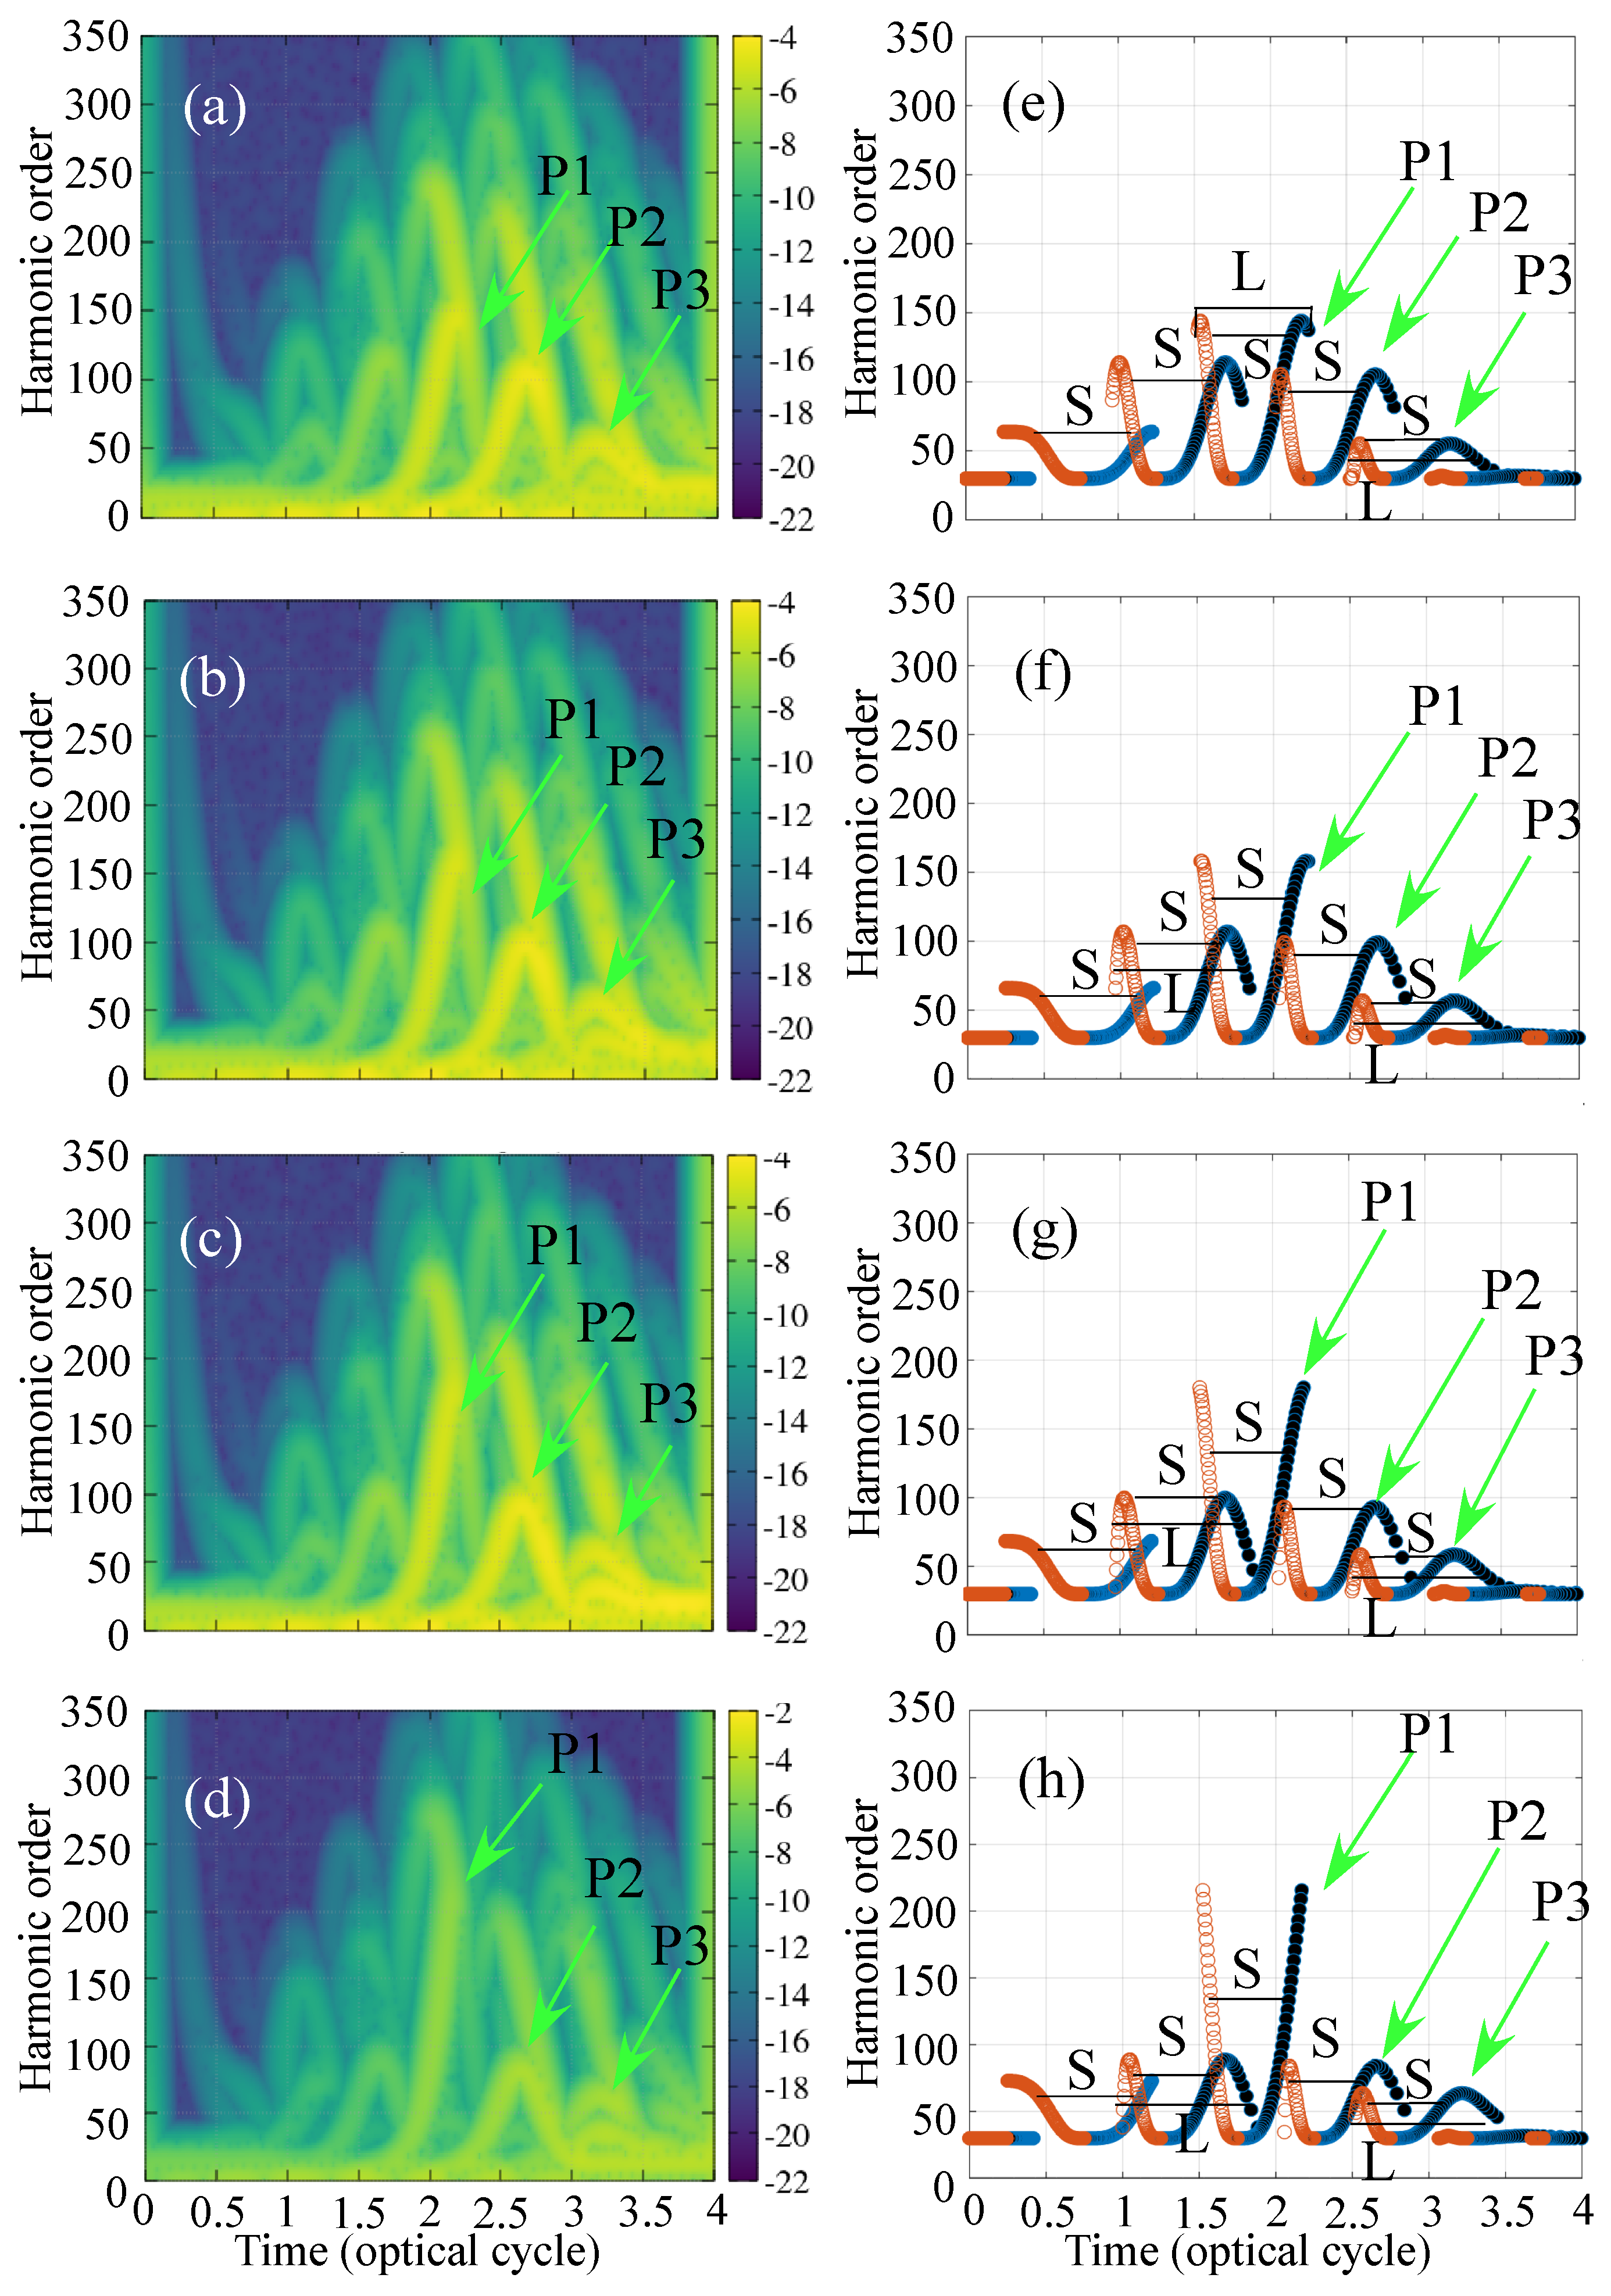
Next, we consider the functional form ϵ q x 2 for the inhomogeneity. The strength of the inhomogeneity parameters are taken as ϵ q = 5 × 10 6 , 1 × 10 5 , 2 × 10 5 , and 3 × 10 5 in units of inverse square of length in au. The harmonic spectra and the corresponding TFR along with CTS are shown in Figure 2a and Figure 4, respectively. Within the chosen inhomogeneity range, the overall feature of the modification of spectra due to the increasing strength of inhomogeneity is similar to that in the ϵ m | x | , as can be seen by comparing (a) and (b) of Figure 2. The enhanced HCO regions become broader and shift towards the higher photon energy, and visibility becomes suppressed along with the strength of inhomogeneity. The temporal dynamics, as shown in Figure 4, clearly show that the contributions, which come from the dominant three half cycle bunch of first return trajectories, viz. P1, P2, and P3, are similar to that in the previous case.
The previous two functional forms of inhomogeneity are inversion symmetric. Next, we consider the inhomogeneity ϵ x , which is asymmetric. The HHG spectra for various values of the strength of inhomogeneity are shown in panel (c) of Figure 2. The parameter values are taken to be the same as ϵ m . In Figure 5, we have presented the TFR and CTS in panels (a) and (b), respectively. The variation of spectra and corresponding dynamics are different than in the symmetric inhomogeneity. With the increasing strength of inhomogeneity, the cutoff energy corresponding to one of the half cycles marked as P1 extends towards the higher order, whereas harmonic generation in the other two half cycles compressed towards the lower orders (see panels (a–d) of Figure 5). These are also clearly visible in the classical simulations of the first return trajectories, as shown in panels (e–h) of Figure 5. Thus, we can expect that isolated XUV pulses can be efficiently generated in the anisotropic inhomogeneity using the contribution from the one dominant half cycle compared to the isotropic inhomogeneity where two dominant half cycles contribute.
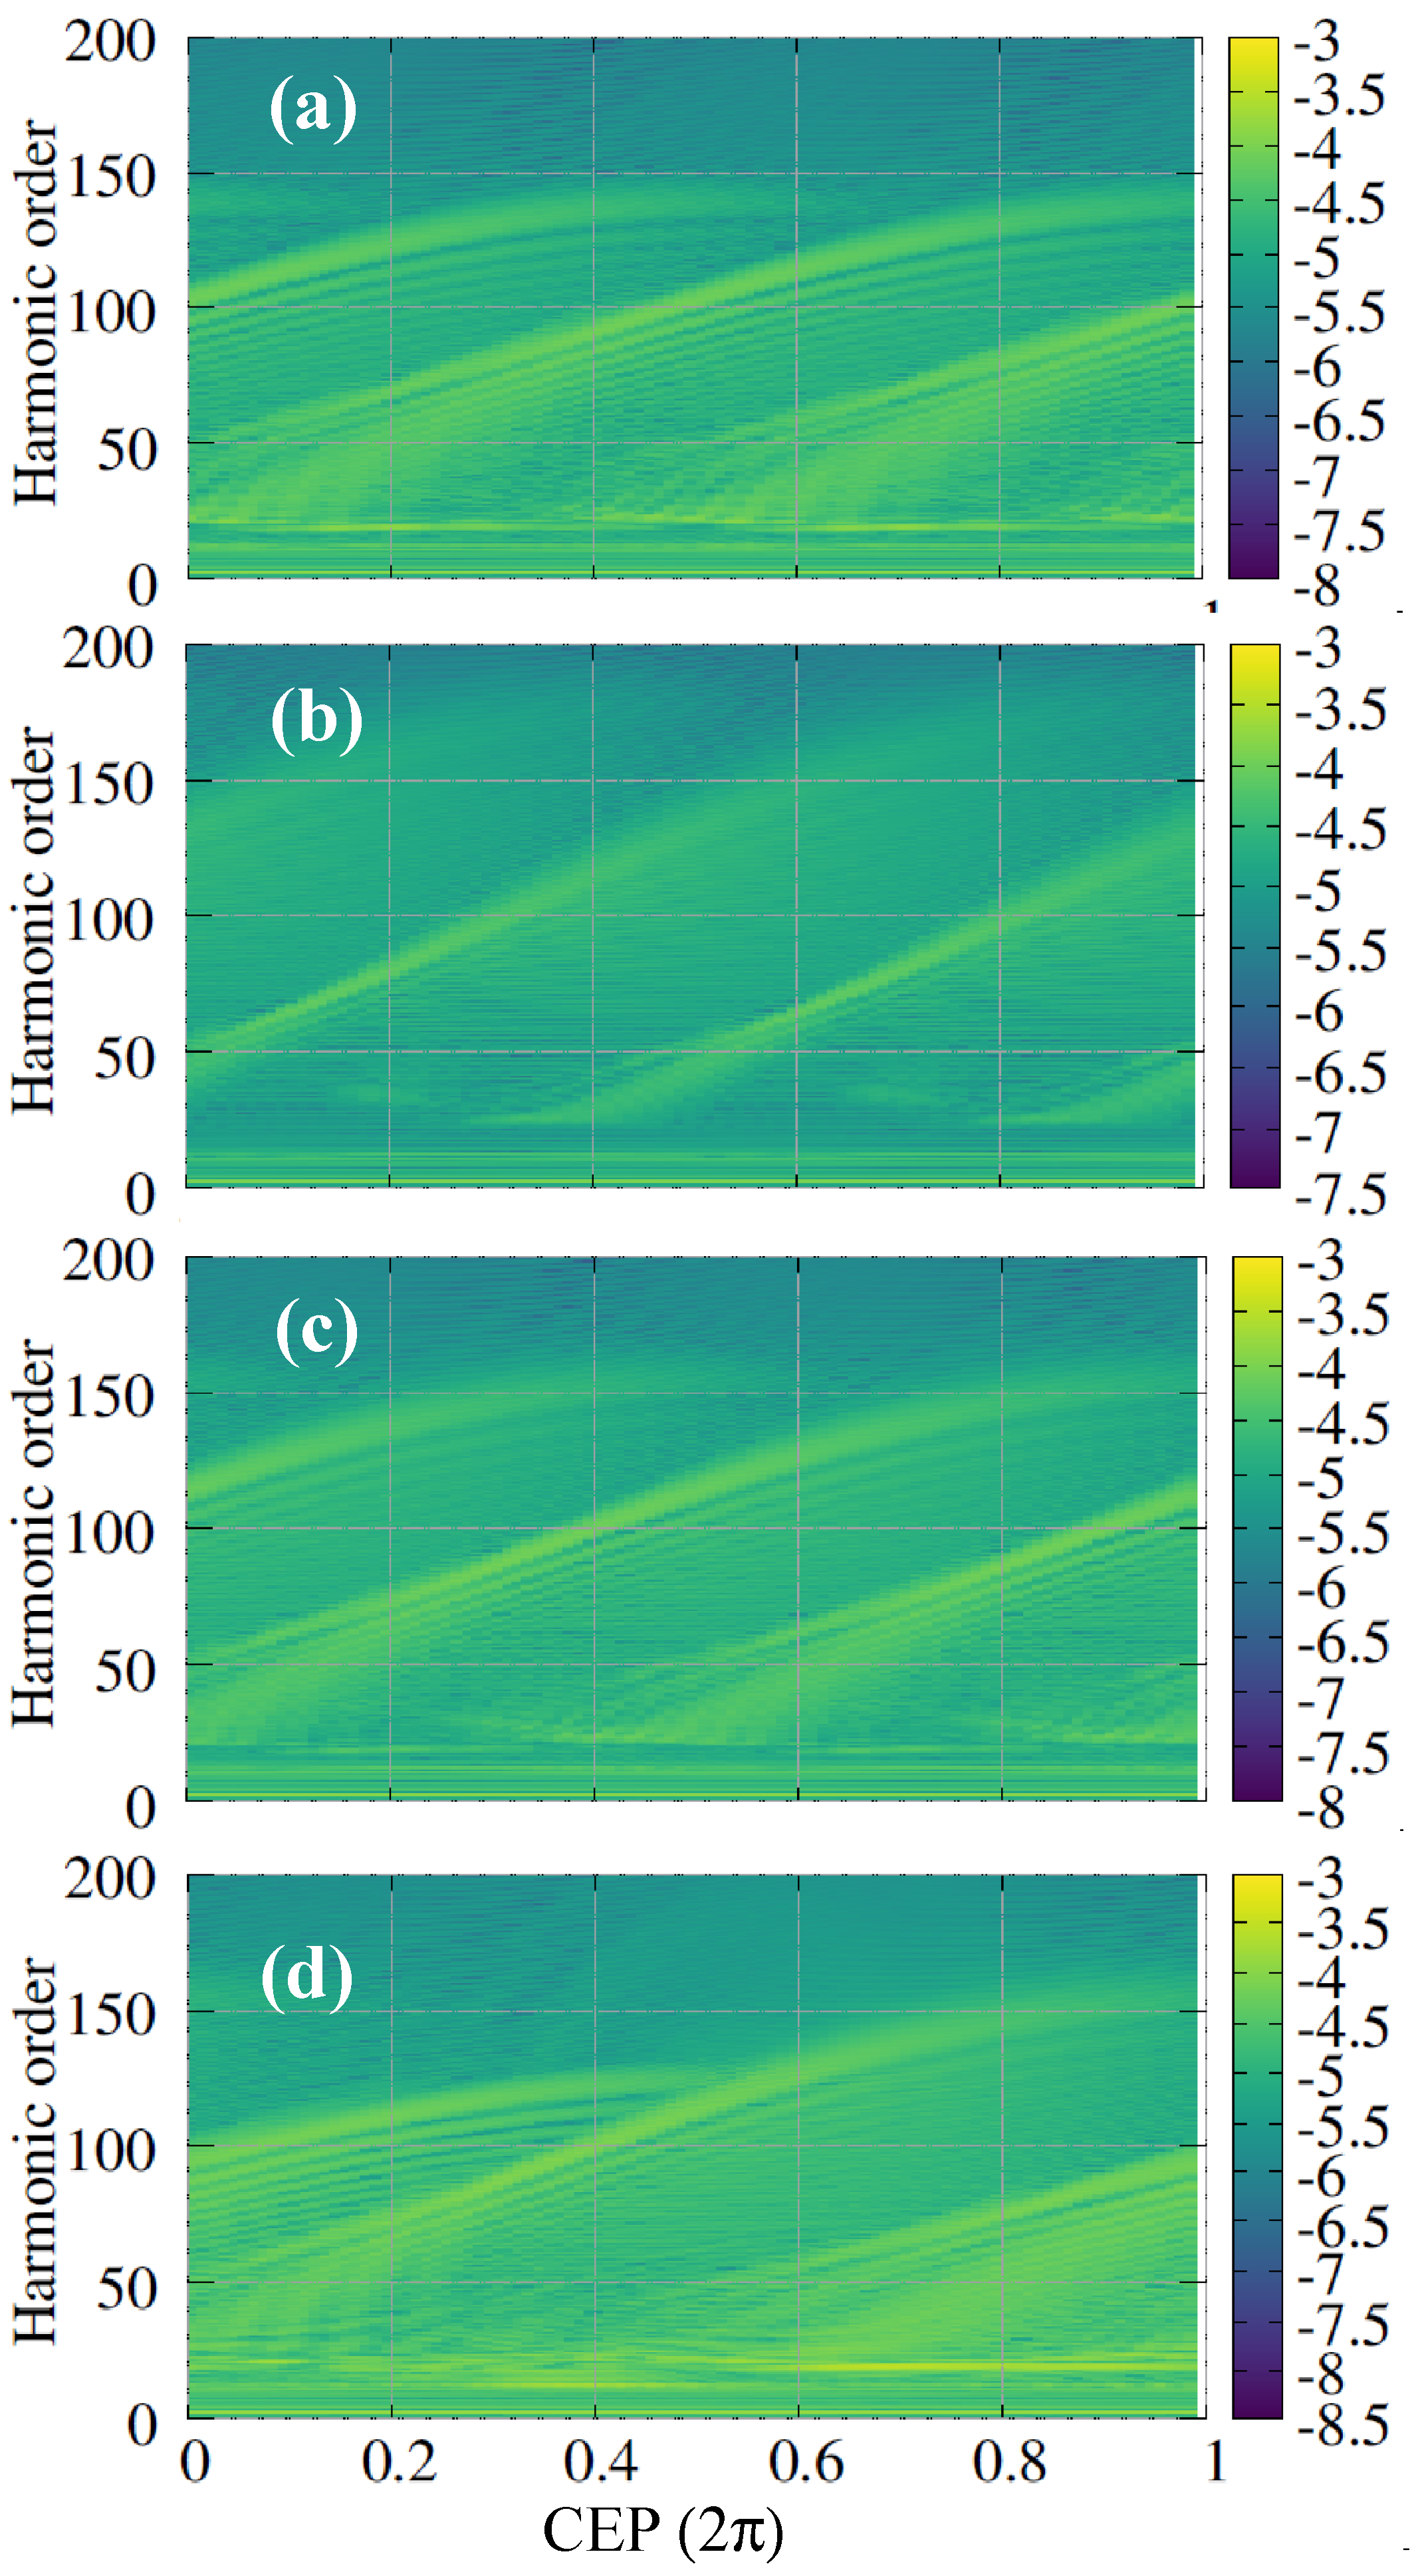
These HCO are highly sensitive to the carrier envelope phase of the driving laser pulse. In Figure 6, we have presented the complete panorama of the HHG spectra with respect to the CEP for homogeneous in (a) and for the inhomogeneities ϵ q x 2 (b), ϵ m | x | (c) and ϵ x (d) of Figure 6. The inhomogeneity parameters are taken as ϵ q = 1 × 10 5 , ϵ m = 5 × 10 4 , ϵ = 5 × 10 4 . With respect to the increase in CEP, the enhanced HCO in the lower-order harmonic region shifts towards the higher orders. This shift is nearly linear from near the above threshold to the mid-plateau region and becomes saturated in the near cutoff region. Furthermore, the harmonic spectra depends on the CEP with modulo- π for the first three isotropic driving. In the inhomogeneity of ϵ x type, the isotropy breaks and the spectra become modulo- 2 π periodic. This extension of periodicity increases the tunability of the enhanced HCO regions with respect to CEP in the latter case than that in the isotropic inhomogeneity or vice versa the retrieval of CEP using these HCO vs. CEP as the database [8]. One can further tune the HCO with the strength of inhomogeneity within a certain limit, as discussed above. The spectra and the HCO vary sensitively with respect to the length of the pulse. For a shorter pulse, the number of contributing half cycles decreases and for a longer pulse, the number of contributing half cycles increases and consecutive HCO start to overlap. How this spectra and half cycle harmonics modify in different types of inhomogeneity needs further investigation.
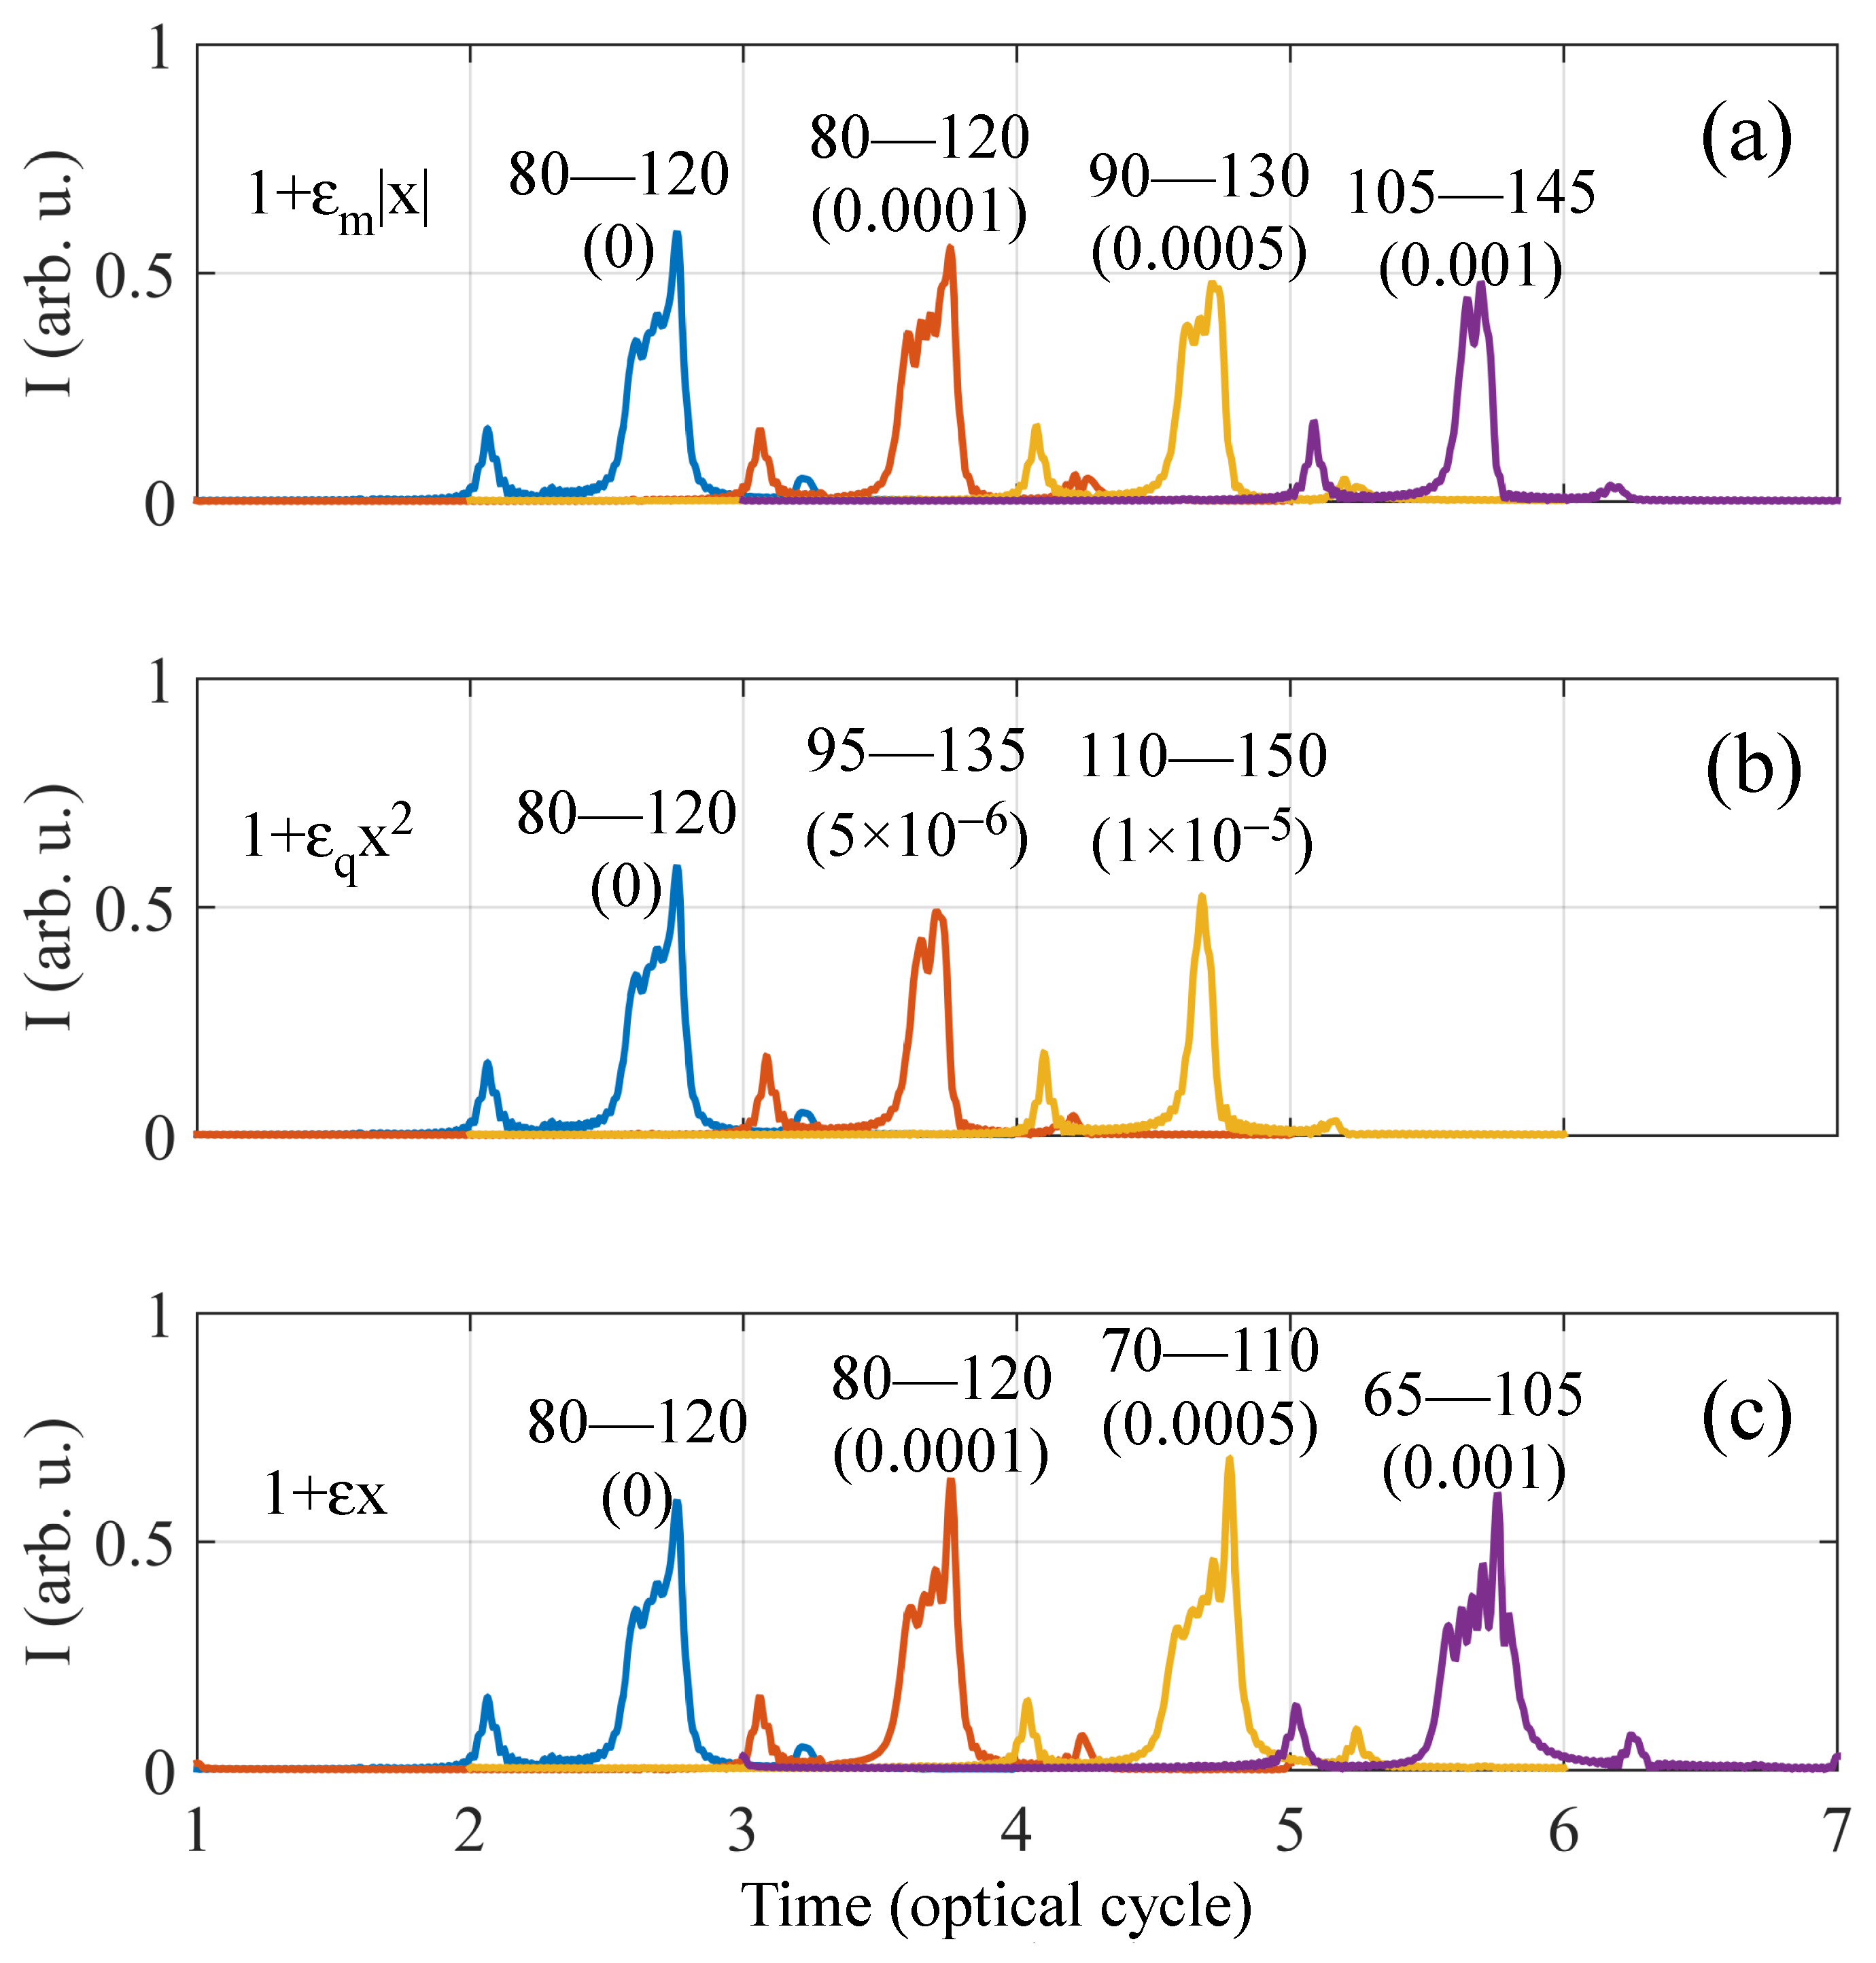
With suitable gating of these half cycle cutoff harmonics, one could generate XUV pulses. We have computed the XUV pulse profiles by gating the harmonics around the half cycle cutoff near harmonic order 100 (marked with a dashed arrow in Figure 2) presented in Figure 7. These XUV pulses are highly sensitive to the type of inhomogeneity and its strength at a fixed CEP of the driving pulse. For the isotropic inhomogeneity, this particular HCO shifts towards the higher order and the temporal width of the XUV pulse becomes narrower with the increasing strength of inhomogeneity (panels a,b). This scenario is opposite for the anisotropic inhomogeneity, where the HCO shifts towards the lower energy and the XUV pulse slightly broadens with a higher strength of inhomogeneity.
Before concluding, we would like to point out that for a long wavelength optical pulse, the spreading of the wave packet in the transverse direction is strong and could reduce the efficiency. This effect is not considered in the present numerical simulation using the 1D model, which could be further scrutinized using a full 3D TDSE simulation or Lewinstein model calculations. But, we strongly believe that the main conclusions in this work will remain same.

4. Conclusions

We have presented how the HCO modifies with different types of inhomogeneously enhanced fields. To elucidate this, we have made a comparative numerical study of the HHG in three different types of inhomogeneously enhanced laser pulses at various strengths of inhomogeneity and CEP of the pulse. The results clearly show that HCO modify with different types/rates of inhomogeneously enhanced fields, which originates from the energy gain by the electron in the laser+ion potential that modifies heavily due to the spatial inhomogeneity. Subsequently, the CEP-dependence of HCO is very different in different types of inhomogeneity. Our results demonstrate that up to a certain strength of inhomogeneity, HCO could be a robust marker for CEP retrieval/tagging. One can extract CEP within modulo- π for isotropic inhomogeneity, whereas it is modulo- 2 π for anisotropic inhomogeneity. We expect these results to aid in the control of XUV pulses when using HCO for the identification of the type of inhomogeneity.

Author Contributions

Conceptualization, A.M.; methodology, A.M.; investigation, A.M.; data curation, A.M.; writing—original draft preparation, A.M.; writing—review and editing, A.M. All authors have read and agreed to the published version of the manuscript.

Funding

This research received no external funding.

Data Availability Statement

Data are available from the corresponding author on reasonable request.

Conflicts of Interest

The author declares no conflict of interest.

Abbreviations

The following abbreviations are used in this manuscript:
HHGHigh harmonic generation
CEPCarrier envelope phase
HCOHalf cycle cutoff
XUVExtreme-ultraviolet

References

  1. Krausz, F.; Ivanov, M. Attosecond physics. Rev. Mod. Phys. 2009, 81, 163. [Google Scholar] [CrossRef]
  2. Baltuška, A.; Udem, T.; Uiberacker, M.; Hentschel, M.; Goulielmakis, E.; Gohle, C.; Holzwarth, R.; Yakovlev, V.; Scrinzi, A.; Hänsch, T.; et al. Attosecond control of electronic processes by intense light fields. Nature 2003, 421, 611–615. [Google Scholar] [CrossRef] [PubMed]
  3. Frolov, M.; Manakov, N.; Silaev, A.; Vvedenskii, N.; Starace, A.F. High-order harmonic generation by atoms in a few-cycle laser pulse: Carrier-envelope phase and many-electron effects. Phys. Rev. A 2011, 83, 021405. [Google Scholar] [CrossRef]
  4. Frolov, M.; Manakov, N.; Silaev, A.; Vvedenskii, N. Analytic description of high-order harmonic generation by atoms in a two-color laser field. Phys. Rev. A 2010, 81, 063407. [Google Scholar] [CrossRef]
  5. Peng, D.; Frolov, M.; Pi, L.W.; Starace, A.F. Enhancing high-order harmonic generation by sculpting waveforms with chirp. Phys. Rev. A 2018, 97, 053414. [Google Scholar] [CrossRef]
  6. Taoutioui, A.; Agueny, H. Femtosecond single cycle pulses enhanced the efficiency of high order harmonic generation. Micromachines 2021, 12, 610. [Google Scholar] [CrossRef]
  7. Yakovlev, V.S.; Scrinzi, A. High harmonic imaging of few-cycle laser pulses. Phys. Rev. Lett. 2003, 91, 153901. [Google Scholar] [CrossRef]
  8. Haworth, C.; Chipperfield, L.; Robinson, J.; Knight, P.; Marangos, J.; Tisch, J. Half-cycle cutoffs in harmonic spectra and robust carrier-envelope phase retrieval. Nat. Phys. 2007, 3, 52–57. [Google Scholar] [CrossRef]
  9. Cundiff, S.T. Better by half. Nat. Phys. 2007, 3, 16–18. [Google Scholar] [CrossRef]
  10. Xiong, W.H.; Geng, J.W.; Gong, Q.; Peng, L.Y. Half-cycle cutoff in near-threshold harmonic generation. New J. Phys. 2015, 17, 123020. [Google Scholar] [CrossRef]
  11. Pfeifer, T.; Jullien, A.; Abel, M.J.; Nagel, P.M.; Gallmann, L.; Neumark, D.M.; Leone, S.R. Generating coherent broadband continuum soft-x-ray radiation by attosecond ionization gating. Opt. Express 2007, 15, 17120–17128. [Google Scholar] [CrossRef] [PubMed]
  12. Abel, M.J.; Pfeifer, T.; Nagel, P.M.; Boutu, W.; Bell, M.J.; Steiner, C.P.; Neumark, D.M.; Leone, S.R. Isolated attosecond pulses from ionization gating of high-harmonic emission. Chem. Phys. 2009, 366, 9–14. [Google Scholar] [CrossRef]
  13. Cavalieri, A.L.; Goulielmakis, E.; Horvath, B.; Helml, W.; Schultze, M.; Fieß, M.; Pervak, V.; Veisz, L.; Yakovlev, V.; Uiberacker, M.; et al. Intense 1.5-cycle near infrared laser waveforms and their use for the generation of ultra-broadband soft-x-ray harmonic continua. New J. Phys. 2007, 9, 242. [Google Scholar] [CrossRef]
  14. Guo, Y.H.; Lu, R.F.; Han, K.L.; He, G.Z. Generation of an isolated sub-100 attosecond pulse in a two-color laser field. Int. J. Quantum Chem. 2009, 109, 3410–3415. [Google Scholar] [CrossRef]
  15. Zeng, Z.; Cheng, Y.; Song, X.; Li, R.; Xu, Z. Generation of an extreme ultraviolet supercontinuum in a two-color laser field. Phys. Rev. Lett. 2007, 98, 203901. [Google Scholar] [CrossRef]
  16. Lan, P.; Lu, P.; Cao, W.; Li, Y.; Wang, X. Carrier-envelope phase-stabilized attosecond pulses from asymmetric molecules. Phys. Rev. A 2007, 76, 021801. [Google Scholar] [CrossRef]
  17. Song, X.; Zeng, Z.; Fu, Y.; Cai, B.; Li, R.; Cheng, Y.; Xu, Z. Quantum path control in few-optical-cycle regime. Phys. Rev. A 2007, 76, 043830. [Google Scholar] [CrossRef]
  18. Ye, P.; He, X.; Teng, H.; Zhan, M.; Zhang, W.; Wang, L.; Zhong, S.; Wei, Z. Extraction of the in situ temporal information of few-cycle laser pulse from carrier-envelope phase-dependent high order harmonic spectrum. JOSA B 2014, 31, 1355–1359. [Google Scholar] [CrossRef]
  19. Geiseler, H.; Ishii, N.; Kaneshima, K.; Kitano, K.; Kanai, T.; Itatani, J. High-energy half-cycle cutoffs in high harmonic and rescattered electron spectra using waveform-controlled few-cycle infrared pulses. J. Phys. At. Mol. Opt. Phys. 2014, 47, 204011. [Google Scholar] [CrossRef]
  20. Teichmann, S.M.; Silva, F.; Cousin, S.L.; Biegert, J. Importance of intensity-to-phase coupling for water-window high-order-harmonic generation with few-cycle pulses. Phys. Rev. A 2015, 91, 063817. [Google Scholar] [CrossRef]
  21. Kim, S.; Jin, J.; Kim, Y.J.; Park, I.Y.; Kim, Y.; Kim, S.W. High-harmonic generation by resonant plasmon field enhancement. Nature 2008, 453, 757–760. [Google Scholar] [CrossRef] [PubMed]
  22. Husakou, A.; Im, S.J.; Herrmann, J. Theory of plasmon-enhanced high-order harmonic generation in the vicinity of metal nanostructures in noble gases. Phys. Rev. A 2011, 83, 043839. [Google Scholar] [CrossRef]
  23. Ciappina, M.; Pérez-Hernández, J.; Shaaran, T.; Biegert, J.; Quidant, R.; Lewenstein, M. Above-threshold ionization by few-cycle spatially inhomogeneous fields. Phys. Rev. A 2012, 86, 023413. [Google Scholar] [CrossRef]
  24. Ciappina, M.; Biegert, J.; Quidant, R.; Lewenstein, M. High-order-harmonic generation from inhomogeneous fields. Phys. Rev. A 2012, 85, 033828. [Google Scholar] [CrossRef]
  25. Du, T.Y.; Guan, Z.; Zhou, X.X.; Bian, X.B. Enhanced high-order harmonic generation from periodic potentials in inhomogeneous laser fields. Phys. Rev. A 2016, 94, 023419. [Google Scholar] [CrossRef]
  26. Blanco, M.; Hernández-García, C.; Chacón, A.; Lewenstein, M.; Flores-Arias, M.T.; Plaja, L. Phase matching effects in high harmonic generation at the nanometer scale. Opt. Express 2017, 25, 14974–14985. [Google Scholar] [CrossRef]
  27. Ansari, I.N.; Hofmann, C.; Medišauskas, L.; Lewenstein, M.; Ciappina, M.F.; Dixit, G. Controlling polarization of attosecond pulses with plasmonic-enhanced bichromatic counter-rotating circularly polarized fields. Phys. Rev. A 2021, 103, 013104. [Google Scholar] [CrossRef]
  28. Piglosiewicz, B.; Schmidt, S.; Park, D.J.; Vogelsang, J.; Groß, P.; Manzoni, C.; Farinello, P.; Cerullo, G.; Lienau, C. Carrier-envelope phase effects on the strong-field photoemission of electrons from metallic nanostructures. Nat. Photonics 2014, 8, 37–42. [Google Scholar] [CrossRef]
  29. Adnani, Y.; Taoutioui, A.; Makhoute, A.; Tőkési, K.; Agueny, H. Generation of superintense isolated attosecond pulses from trapped electrons in metal surfaces. Phys. Rev. A 2022, 105, 043104. [Google Scholar] [CrossRef]
  30. Mandal, A.; Singh, K.P. High harmonic generation near a bow-tie nanostructure: Sensitivity to carrier envelope phase and plasmonic inhomogeneity. Laser Phys. 2022, 33, 015301. [Google Scholar] [CrossRef]
  31. Protopapas, M.; Keitel, C.H.; Knight, P.L. Atomic physics with super-high intensity lasers. Rep. Prog. Phys. 1997, 60, 389. [Google Scholar] [CrossRef]
  32. Ciappina, M.F.; Aćimović, S.S.; Shaaran, T.; Biegert, J.; Quidant, R.; Lewenstein, M. Enhancement of high harmonic generation by confining electron motion in plasmonic nanostrutures. Opt. Express 2012, 20, 26261–26274. [Google Scholar] [CrossRef] [PubMed]
  33. Zagoya, C.; Bonner, M.; Chomet, H.; Slade, E.; de Morisson Faria, C.F. Different time scales in plasmonically enhanced high-order-harmonic generation. Phys. Rev. A 2016, 93, 053419. [Google Scholar] [CrossRef]
  34. Ansari, I.N.; Mrudul, M.; Ciappina, M.F.; Lewenstein, M.; Dixit, G. Simultaneous control of harmonic yield and energy cutoff of high-order harmonic generation using seeded plasmonically enhanced fields. Phys. Rev. A 2018, 98, 063406. [Google Scholar] [CrossRef]
  35. de Morisson Faria, C.F.; Dörr, M.; Becker, W.; Sandner, W. Time-frequency analysis of two-color high-harmonic generation. Phys. Rev. A 1999, 60, 1377. [Google Scholar] [CrossRef]
  36. Kohler, M.C.; Ott, C.; Raith, P.; Heck, R.; Schlegel, I.; Keitel, C.H.; Pfeifer, T. High harmonic generation via continuum wave-packet interference. Physical Rev. Lett. 2010, 105, 203902. [Google Scholar] [CrossRef]
  37. Chirilă, C.; Dreissigacker, I.; van der Zwan, E.V.; Lein, M. Emission times in high-order harmonic generation. Phys. Rev. A 2010, 81, 033412. [Google Scholar] [CrossRef]
  38. Sarantseva, T.; Silaev, A.; Romanov, A.; Vvedenskii, N.; Frolov, M. Time-frequency analysis of high harmonic generation using a probe XUV pulse. Opt. Express 2021, 29, 1428–1440. [Google Scholar] [CrossRef]
  39. de Morisson Faria, C.F.; Du, M. Enhancement of bichromatic high-order-harmonic generation with a high-frequency field. Phys. Rev. A 2001, 64, 023415. [Google Scholar] [CrossRef]
  40. Su, Q.; Eberly, J. Model atom for multiphoton physics. Phys. Rev. A 1991, 44, 5997. [Google Scholar] [CrossRef]
  41. Yu, C.; Wang, Y.; Cao, X.; Jiang, S.; Lu, R. Isolated few-attosecond emission in a multi-cycle asymmetrically nonhomogeneous two-color laser field. J. Phys. At. Mol. Opt. Phys. 2014, 47, 225602. [Google Scholar] [CrossRef]
  42. Guo, Y.; Liu, A.; Wang, J.; Liu, X. Atomic even-harmonic generation due to symmetry-breaking effects induced by spatially inhomogeneous field. Chin. Phys. 2019, 28, 094212. [Google Scholar] [CrossRef]
  43. Manolopoulos, D.E. Derivation and reflection properties of a transmission-free absorbing potential. J. Chem. Phys. 2002, 117, 9552–9559. [Google Scholar] [CrossRef]
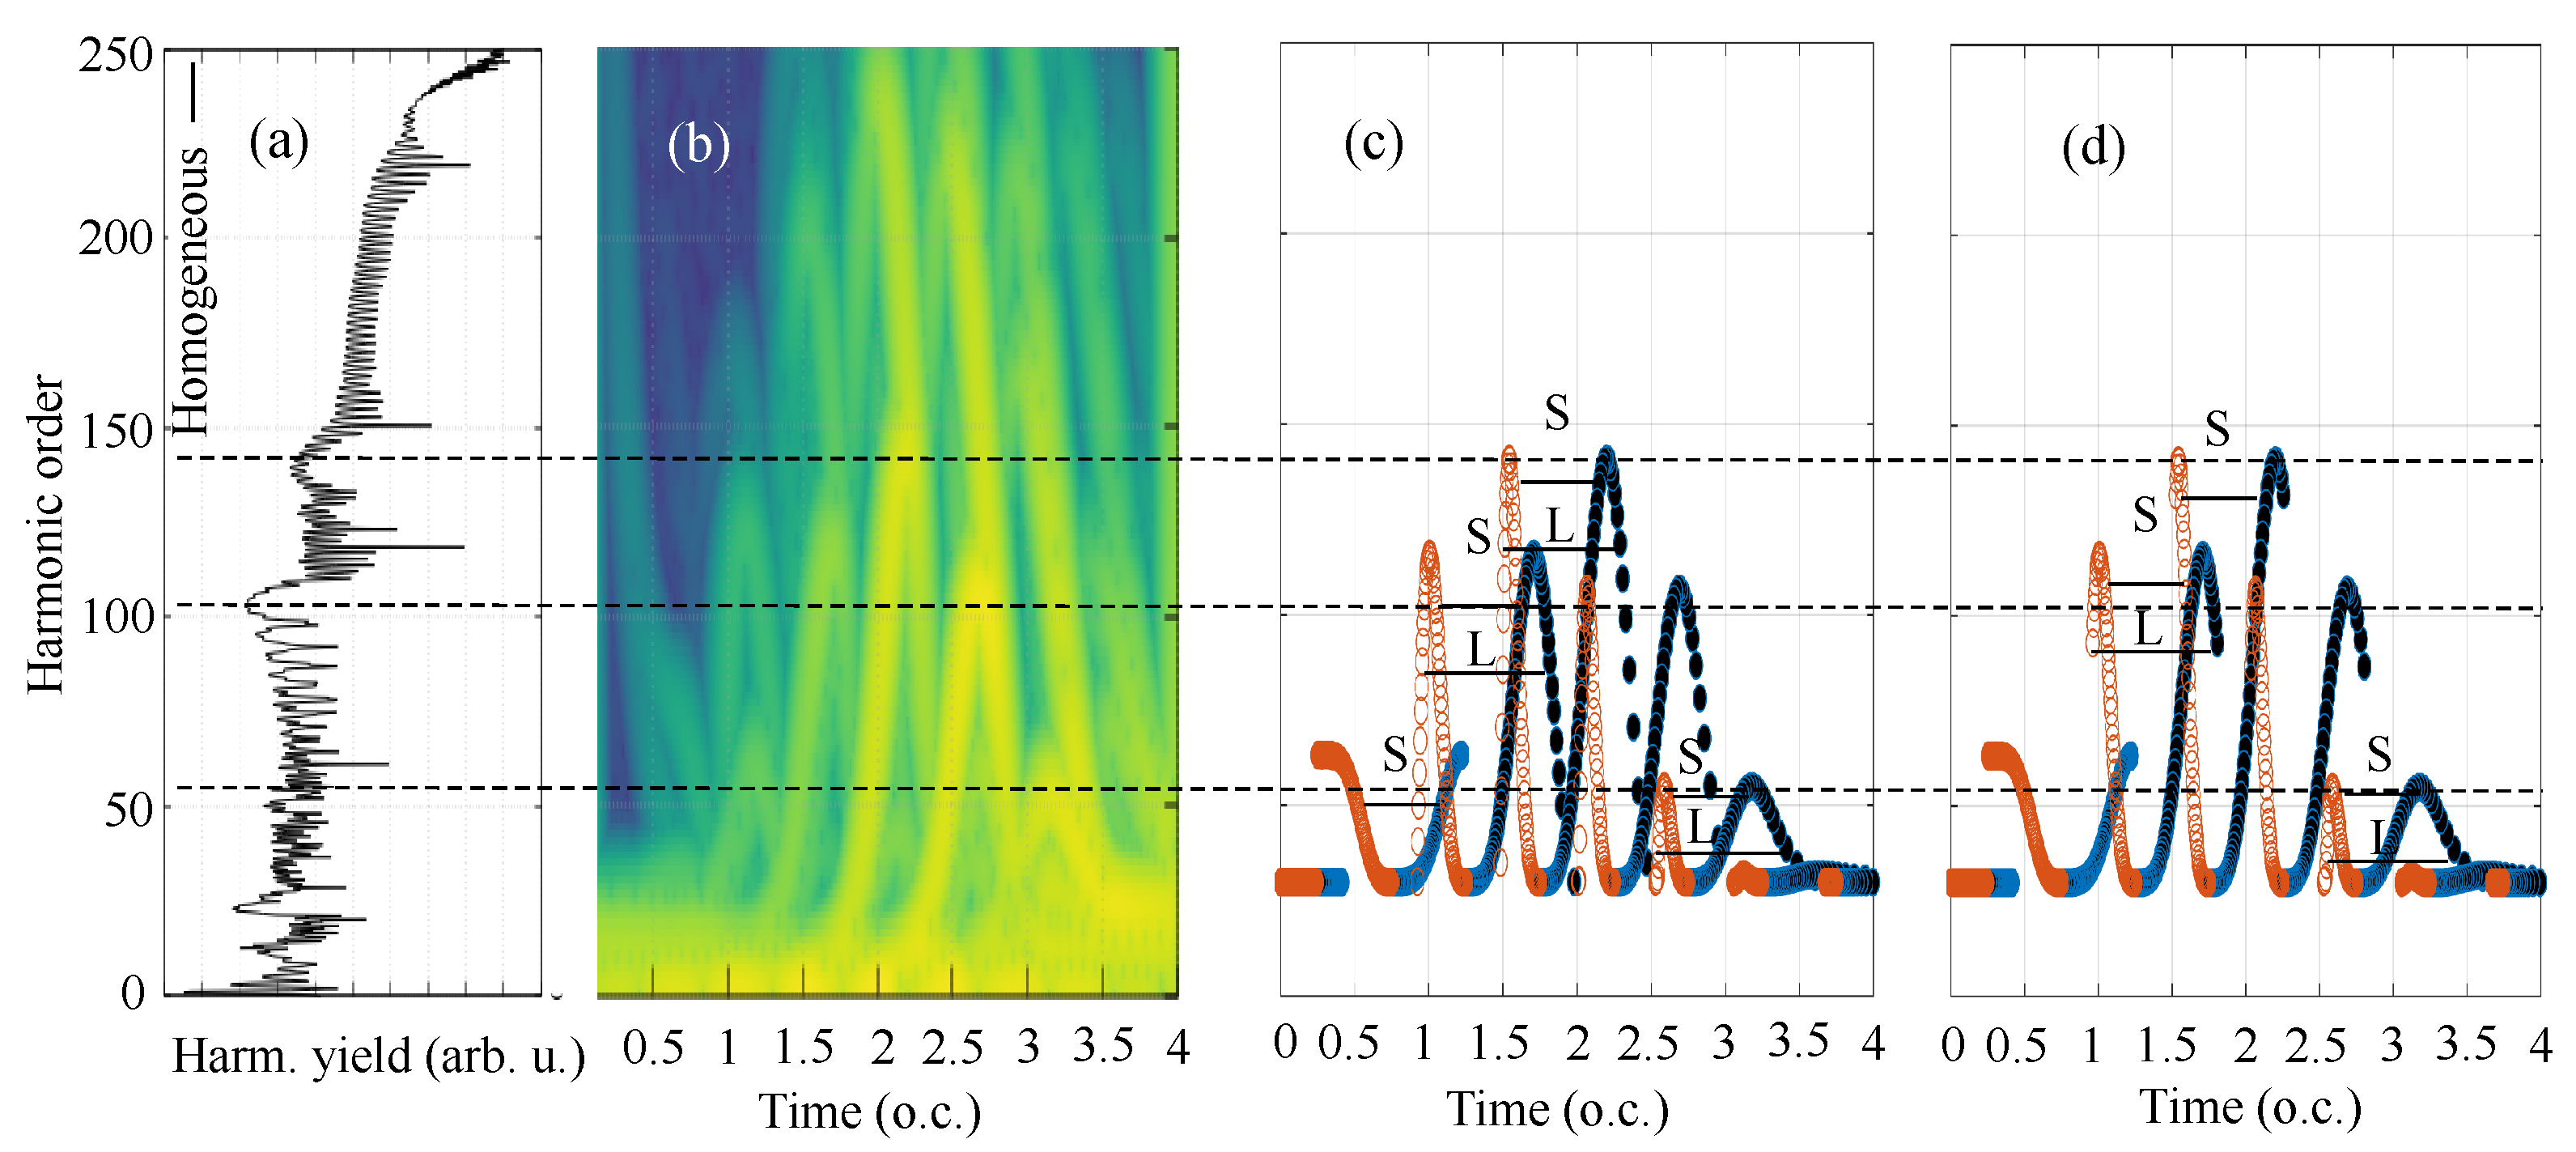
Figure 1. Half cycle cutoff: harmonic spectra (a), time–frequency response of the harmonic generation (b), and classical trajectory calculation of return energy are shown in (c,d). In the false color map in (b) yellow represents high value and blue represents low value of the intensity of the Gabor transformation. S and L represent the short and long trajectories, respectively.
Atoms 11 00113 g001
Figure 2. Variation of HHG spectra with respect to the strength of inhomogeneity for spatial dependence ϵ q x 2 (a), ϵ m | x | (b), and ϵ x (c). Harmonic yield is given in logarithmic scale. The spectra are shifted vertically to improve visualization. Different strength of inhomogeneity are indicated by arrows with corresponding color. An HCO location is indicated with pink arrow.
Atoms 11 00113 g002
Figure 3. TFR map calculated from the Gabor transformation of dipole acceleration (ad) and classical trajectory simulation of return energy (eh) are shown for the three different strengths of inhomogeneity for spatial dependence ϵ m | x | . The color map values are shown on the right of each panel of the TFR map, which represent the logarithm of intensity of the Gabor transformation, i.e., | σ W ( ω , τ ) | 2 . In CTS plots, open circles represent the starting time of the trajectories and filled circles are the time of recollision. S and L represent the short and long trajectories, respectively.
Atoms 11 00113 g003
Figure 4. The same as Figure 3 except for spatial dependence ϵ q x 2 .
Atoms 11 00113 g004
Figure 5. The same as Figure 3 except for spatial dependence ϵ x .
Atoms 11 00113 g005
Figure 6. Carrier-envelope-phase-dependent harmonic spectra are shown in color map (the color bars are shown on right side of each panel) for homogeneous (a) and for inhmogeneous driving with spatial dependence ϵ q x 2 (b), ϵ m | x | (c) and ϵ x (d).
Atoms 11 00113 g006
Figure 7. Temporal profiles of intensity of the XUV pulses generated using the harmonics around the half cycle cutoff near harmonic order 100. Different panels are for different types of inhomogeneity. The strength of the inhomogeneity and harmonic order window are mentioned in each XUV profile. Each profile is shifted in time for clarity.
Atoms 11 00113 g007
Disclaimer/Publisher’s Note: The statements, opinions and data contained in all publications are solely those of the individual author(s) and contributor(s) and not of MDPI and/or the editor(s). MDPI and/or the editor(s) disclaim responsibility for any injury to people or property resulting from any ideas, methods, instructions or products referred to in the content.