Article

Calculation of Low-Lying Electronic Excitations of Magnesium Monofluoride: How Well Do Coupled-Cluster Methods Work?

Department of Physics and Astronomy, York University, Toronto, ON M3J 1P3, Canada
Atoms 2024, 12(8), 40; https://doi.org/10.3390/atoms12080040
Submission received: 3 June 2024 / Revised: 27 July 2024 / Accepted: 31 July 2024 / Published: 8 August 2024

Abstract

:
Magnesium monofluoride is a polar molecule amenable to laser cooling which has caused renewed interest in its spectroscopy. In this work, we consider the case of three low-lying electronic excitations, namely X 2 Σ + A 2 Π , X 2 Σ + B 2 Σ + , X 2 Σ + C 2 Σ + , using well-developed quantum chemistry approaches, i.e., without reference to the spin-orbit splitting of the A 2 Π states. Accurate experimental data for these transitions have been available for over 50 years. Here, we explore the linear response method at the level of CC2 theory, as well as equation of motion methods at the level of CCSD and CC3, using two families of basis sets. Excellent agreement is obtained for the first three transitions when using the correlation-consistent basis sets and extrapolation to the complete basis limit within EOM-CC3 (at a relative precision of 10 4 ), and qualitative agreement for the other two methods. The purpose of this paper is to serve as a guide on how to approach the accurate calculation of excitations in polar diatomic molecules.

1. Introduction

The spectroscopy of polar diatomic molecules, such as magnesium monofluoride (MgF) has a long history and led, in the late 1960s, to results with remarkable accuracy. Barrow and Beale [1] resolved the rotational structure of gaseous MgF and carried out a detailed analysis resulting in the determination of molecular constants for the ground and first three electronic excited states with precise values based on the two lowest vibrational states ( v = 0 , 1 ). Higher excitations were measured and reported in 1971 by Novikov and Gurvich [2]. The detailed structure of the X 2 Σ + A 2 Π transitions including spin-orbit effects (the A 2 Π doublet is split by about 35 cm 1 ) focused on the nature of the Λ -type doubling, and it was concluded that the doublet was inverted (negative A parameter). A recent study [3] does, however, conclude that the A 2 Π doublet is normal, i.e., not inverted. Hyperfine-resolved measurements are also reported in Ref. [4].
The interest in the laser cooling of MgF has resulted in a detailed study of potential energy curves and spectroscopic constants at the level of the multi-reference configuration interaction (MRCI) [5]. These results can serve the present study as a theoretical benchmark, in addition to the experimental results [6]. The ground-state potential energy curve can be determined also from infrared spectroscopy [7] which leads to an extended Morse oscillator description of this curve. This allows us to focus directly on the calculation of electronic excitations. These studies (and the present work) ignore spin-orbit effects. Such effects can be calculated in some standard packages, e.g., in Molpro in the Breit–Pauli approximation on the basis of MRCI calculations [8]. Hyperfine constants can be obtained using two-component density functional theory [9] as implemented in TURBOMOLE [10].
Our interest in studying the accuracy of excited-state calculations within coupled-cluster (CC) theory relates to experimental work on matrix-isolated barium monofluoride (BaF) [11]. In this context earlier work on matrix-isolated atomic barium [12,13] was extended to the case of BaF in argon [14,15] and neon [16]. The matrix isolation work is motivated by performing measurements of the electron electric dipole moment. While the BaF molecule is much more complicated than MgF, the use of effective core potentials makes the computational effort comparable for the two cases. The purpose of the present work is to establish expectations on accuracy with respect to methodology and basis sets in order to understand how reliable the CC methods may be in the matrix isolation environment.
The current status of describing the electronic excitations of gas-phase BaF (and its lighter homologs CaF and SrF) can be described as follows. Results from scalar relativistic CC and MRCI calculations are reported in Ref. [17]. The all-electron Fock-space CC results for the excitation energies (which include spin-orbit splittings on the order of 400–600 cm 1 ) agree with the experiment at the level of about 200 cm 1 . Better agreement (down to about 10 cm 1 ) was obtained in Ref. [18] by including QED effects and basis set extrapolation of correlation effects calculated at the level of CCSDT(Q). A similar approach based on the four-component CC Dirac theory resulted in accurate ionization energies [19]. Hyperfine constants for F 19 ground and excited-state BaF molecules were obtained in Ref. [20] and provide some confidence in the quality of the Fock-space CC wavefunctions.
To return to the topic of the present paper we note that in Ref. [21] radiative decay rates and branching fractions of the first excited A 2 Π state of 24Mg19F were reported in a comparative experimental-theoretical work. While the theory is the relativistic Fock-space CC method, a comparison can be made with the present non-relativistic work due to the smallness of spin-orbit effects in MgF. The experimental data presented in Ref. [21] deviate somewhat (at the 15 cm 1 level) from the earlier work [1]. Studies which investigate equation-of-motion (EOM) coupled cluster methods have been carried out and are typically benchmarked against full configuration interaction calculations, but the goal of this work is to compare only the theoretical T e spectroscopic parameters to experimental determinations.
The layout of the paper is as follows: We begin in Section 2 with a short summary of how to use CC methods for electronic excitations. We show an example of high-quality potential energy curves for the X 2 Σ + and C 2 Σ + states to demonstrate the accuracy obtainable for spectroscopic constants and to explain the difference between the vertical and adiabatic excitation energies denoted as Δ T and Δ T e , respectively. In Section 3 we present our results for vertical excitation energies Δ T of MgF calculated at a fixed ground-state equilibrium separation R e using three methods and two basis set families, and compare them with experimentally determined values, and with the relativistic Fock-space CC results of Ref. [20]. We draw some conclusions in Section 4.

2. Methodology

Electronic excitation energies for molecules can be calculated in many quantum chemistry packages with a selection of methods. For the purpose of the present work, the accuracy of time-dependent density functional theory methods is not sufficient, since we would like to reach a percent-level agreement with measured values or better. This requires the inclusion of electron correlation with a systematic treatment as provided by configuration interaction or coupled cluster methodology. The correlation energies are on the order of 0.3 Hartree (a.u.) as compared to a total energy of about 300 a.u. The excitation energies considered in this work are in the order of 0.2 a.u. (differences of total energies), and this makes it necessary to adopt a proper treatment of correlation effects by using a high-level method, and a high-level basis set.
A fast method in this realm is the CC2 method coupled with response theory [22]. It is, e.g., implemented in TURBOMOLE [10], alongside a faster version based on Møller–Plesset (MP) perturbation theory, namely the ADC(2) method [23]. These allow for fast calculations based on the resolution-of-identity methods, and efficient basis sets of triple- and quadruple-zeta quality [24], (e.g., def2-QZVPPD). Transition moments and other excited-state first-order properties are calculated quickly even for larger molecules [25]. We will refer to this method as CC2-RPA. It is mostly restricted to not use the full symmetry, i.e., it is running with C1 symmetry by default in TURBOMOLE. One can use the properties of the excited states, such as transition moments to obtain some idea of which excited states have been generated.
If one requires higher accuracy, one has available a general excited-state method at the level of CC theory including single and double excitations, named EOM-CCSD (EOM stands for equation of motion) [26,27]. Since the class of polar molecules to which MgF belongs is dominated by single excitations, it should provide reasonable accuracy. One can ask for a number of excitations for each irreducible representation. We used Psi4 [28] to perform the calculations. The CCEOM package in Psi4 also allows us to perform higher-accuracy calculations at the level of EOM-CC3 theory. These are demanding calculations, but are considered the best there is for a general-purpose CC method for excited states [29,30]. The EOM-CC3 method (as implemented in Psi4) first calculates the CC3 ground state, then performs an EOM-CCSD for multiple roots (which in our work has the trend of being higher in energy than the usual EOM-CCSD roots), and then one has to pick one root at a time to calculate the EOM-CC3 value. Thus, the method is more cumbersome to use. Faster implementations of EOM-CC3 than generally available have been developed [31].
In addition to the mentioned methods, one can also attempt so-called Δ -CC methods [32]. One complements a standard ground-state CC calculation with a run where the SCF calculation is carried out for an excited state obtained by switching two orbitals (e.g., highest occupied and lowest unoccupied) to seed an SCF calculation for a Slater determinant which represents the excited state. This step may or may not work, as the SCF calculation may collapse back to the ground state. When it works, the resulting orbitals can be used in a correlated calculation at the CCSD or CCSD(T) level or higher. For the MgF molecule, we were not able to carry out the Δ -CC approach, since the Δ -SCF step failed, but it is interesting to note that in cases where the method works the excitation energies from Δ -CCSD and EOM-CCSD, in general, do not agree with each other [33]. The agreement may become better at the level of the CC3 model for which comparison with Δ -CCSD(T) and EOM-CC3 can be made. The better agreement follows from a more complete inclusion of correlation at this level. Such results for the barium monofluoride (BaF) molecule using a pseudopotential for the inner electrons of barium for the A 2 Δ , A 2 Π , and B 2 Σ + states will be reported in a separate publication.
In terms of basis sets we used the def2-family at triple- and quadruple-zeta levels and made a guess at the complete basis set (CBS) limit by using an extrapolation of the form
E cbs = 3 3 E TZ 4 3 E QZ 3 3 4 3 1.72973 E QZ 0.72973 E TZ ,
where E TZ and E QZ are the energies obtained with def2-TZVPPD and def2-QZVPPD, respectively.
We also used the correlation-consistent augmented basis sets aug-cc-PVnZ with n = 3 , 4 , 5 [34,35]. From the calculated energies E n the CBS limit can be obtained using
E cbs 1.59288 E 5 0.59689 E 4 + 0.00401 E 3
which follows from Equation (2) in Ref. [36].
For the MgF molecule, the known bond lengths for the ground and excited states in question are very close ( R 0 1.75 Å). For the comparison of methods and basis sets we restrict our calculations here to a single Mg-F separation, for which we obtain vertical excitation energies Δ T , rather than the spectroscopic parameter Δ T e , i.e., the difference in the minimal energies between the potential energy curves. Detailed calculations of such curves at the level of four-component (relativistic) Fock space CC theory are given, e.g., in Figure 1 of Ref. [21], and can be used for the justification of this shortcut (at least for the lowest two excitations we can assume Δ T Δ T e ). For other molecules, such as CaF, SrF and BaF one has to calculate the potential energy curves, i.e., energies as a function of R, e.g., as given in Ref. [17] in order to determine accurate adiabatic excitation energies. From these curves, one can then determine the spectroscopic parameters ω e and ω e x e , which follow from the nuclear vibrational excitation energies in accordance with [37]
E v = T e + ω e ( v + 1 2 ) ω e x e ( v + 1 2 ) 2 .
A final general comment for this section can be made: for each of the theory models and for each of the chosen basis sets the ground state is calculated at some level of precision. All CC calculations start from a common self-consistent field result, which for our calculations is based on spin-unrestricted Hartree–Fock theory. The changes in ground-state energy with a basis set at this level are not too significant. The differences between the values from these calculations are appreciable, and they arise mainly for two reasons: (i) the correlation contributions included in CC2, CCSD, and CC3 are different, and (ii) the truncated basis set introduces a significant error when computing correlation effects. Excitation energies are calculated relative to ground states which are numerically quite different. Nevertheless, they can be compared directly to each other when looking for excited-state Δ T values.
The theoretical methods for electronic excitations allow us to calculate the potential energy curves for a set of interatomic separations R. As given by Equation (9.8) in Ref. [37] (p. 348), the positions of the vibrational bands are determined on the basis of Δ T e and the differences in spectroscopic constants ω e and ω e x e (cf., Equation (3)). If the differences in R e values for the excited state vs the ground state are small, the correction due to the proper adiabatic treatment is small, and one may get away with a single calculation for R = R e ( X 2 Σ + ) .
How comparable are the equilibrium distances R e for the states of interest in the present work? The data in Table 1 show that this is a reasonable assumption for the X 2 Σ + and A 2 Π states, but that the B 2 Σ + and C 2 Σ + states have minima in their potential energy curves which are shifted to progressively smaller values. It is also shown that the calculated values of R e are smaller than the results derived from experimental spectra.
We adopt, for the present work, the strategy to use the experimental ground-state equilibrium separation of R e = 1.75 Å. The calculated values in Table 1 were obtained without taking basis set superposition error into account. For the X 2 Σ + state, it would be straightforward to do so by subtracting atomic energies obtained with ghosted partner atoms, but for the excited states, it is not possible to do so. For computational economy reasons our procedure for obtaining excited-state energies in Section 3 is to compute vertical excitation energies Δ T , which overestimate Δ T e , since the relaxation to a lower value of R e for the excited state is ignored. For the A 2 Π state we estimate this difference to be small, i.e., within the precision goal of a few tens of cm 1 , but for the B 2 Σ + state this increases to the order of 100 cm 1 .
In order to illustrate the difference between the vertical excitation energy Δ T and the true adiabatic excitation energy Δ T e we calculated the potential energy curves for the X 2 Σ + and C 2 Σ + states using the aug-cc-pVQZ basis, with the EOM-CC3 method. Figure 1 shows both potential energy curves on the same vertical scale, i.e., the curve for the C 2 Σ + state has been displaced by Δ T e = 42,113 cm−1 to show both curves with minima at E = 0 . The data were fitted to a Morse potential,
V ( R ) = T e + D ( 1 exp [ β ( R R e ) ] ) 2 .
The four parameters R e , T e , D , β are obtained from calculations at values of R covering the region around the minimum, and D is not treated as a realistic dissociation energy in this work. An alternative to this fitting procedure is to use a cubic spline interpolation of the data.
Solutions for the Schrödinger equation describing the relative nuclear motion ( v = 0 , 1 , 2 vibrational levels) were fitted to Equation (3). The spectroscopic parameters are in good agreement with the values derived from the experiment. For the X 2 Σ + state, we find ω e = 713 and ω e x e = 5.4 , while for the C 2 Σ + state, the results are ω e = 811 and ω e x e = 5.1 (in cm 1 ). The vertical excitation energy at R e = 1.75 Å amounts to Δ T = 42,316 cm 1 , i.e., it overestimates the excitation energy by about 200 cm 1 at this level of theory and basis set. The Franck–Condon factor (square of the overlap integral between the v = 0 states for X 2 Σ + and C 2 Σ + , respectively) is obtained as 0.744. For the two lower electronic excitations, the differences in R e values are smaller, and the overestimation of the data on the basis of single-point calculations are smaller.
In terms of computational effort, we can make the following statement. All results were obtained on multi-core workstations (e.g., Apple MacBook Pro with 8 cores). The only lengthier calculations are for the CC3 method where multiple hours were required for the calculation of a single energy when using the aug-cc-pV5Z basis. Some cross-comparisons when using TURBOMOLE vs Psi4 showed no significant differences in results between equivalent calculations. Excited-state calculation using the EOM-CC3 method for a single root took about 6–8 h with the aug-cc-pVQZ basis.

3. Results

3.1. MgF( X 2 Σ + A 2 Π )

The first excitation is to the A 2 Π J states. The present non-relativistic calculation can be compared to the experimental analysis of Ref. [1] which lists not T e but the transition energies to the lowest two vibrational states v = 0 , 1 . The J = ( 1 2 ) , ( 3 2 ) doublet has a separation of ≈35–36 cm 1 which will be of the order of the accuracy goal for calculating this excitation. Figure 2 shows this doublet as a pair of solid lines and the relativistic calculation from Ref. [21] as a pair of dashed lines at the right. This calculation gives results that are higher by about 60 cm 1 , but it should be noted that Ref. [21] includes an analysis of the data of Ref. [6] which results in higher values for the excitation energies than the original data of Barrow and Beale [1] by about 17 cm 1 . Such a difference exceeds the accuracy of the original experimental analysis and can be related to the use of the effective Hamiltonian involved in the analysis of the data. An example of such a discrepancy was reported in Ref. [39]. For our purposes, one may then argue that the best nonrelativistic result would fall not in the middle between the two black lines, but closer to the shown A 2 Π 3 / 2 energy.
On the left in Figure 2 we observe that the extrapolated CC2-RPA results underestimate the transition energy: the extrapolated result using the def2 basis sets (blue square) disagrees by about 120 cm 1 . The aug-cc basis set calculations fare better, reducing the discrepancy to about 80 cm 1 . The open symbols show that the results from the EOM-CCSD method overestimate the excitation energy. The relationship between the two basis set families remains similar to the results from the CC2-RPA method. Finally, the EOM-CC3 results (solid circles) turn out to be lower than EOM-CCSD, with the aug-cc basis set results leading to an extrapolated value that falls within 25 cm 1 of the results from Ref. [1], or Ref. [6] as re-analyzed in Ref. [21]. The EOM-CC3 method with the aug-cc basis set family can be considered a great success in reaching better than per mille relative accuracy for the transition energy. It would be interesting to find out whether the relativistic Fock-space CC method of Ref. [21] can be pushed to higher order to reach this level of precision on a system that involves 21 electrons.

3.2. MgF( X 2 Σ + B 2 Σ + )

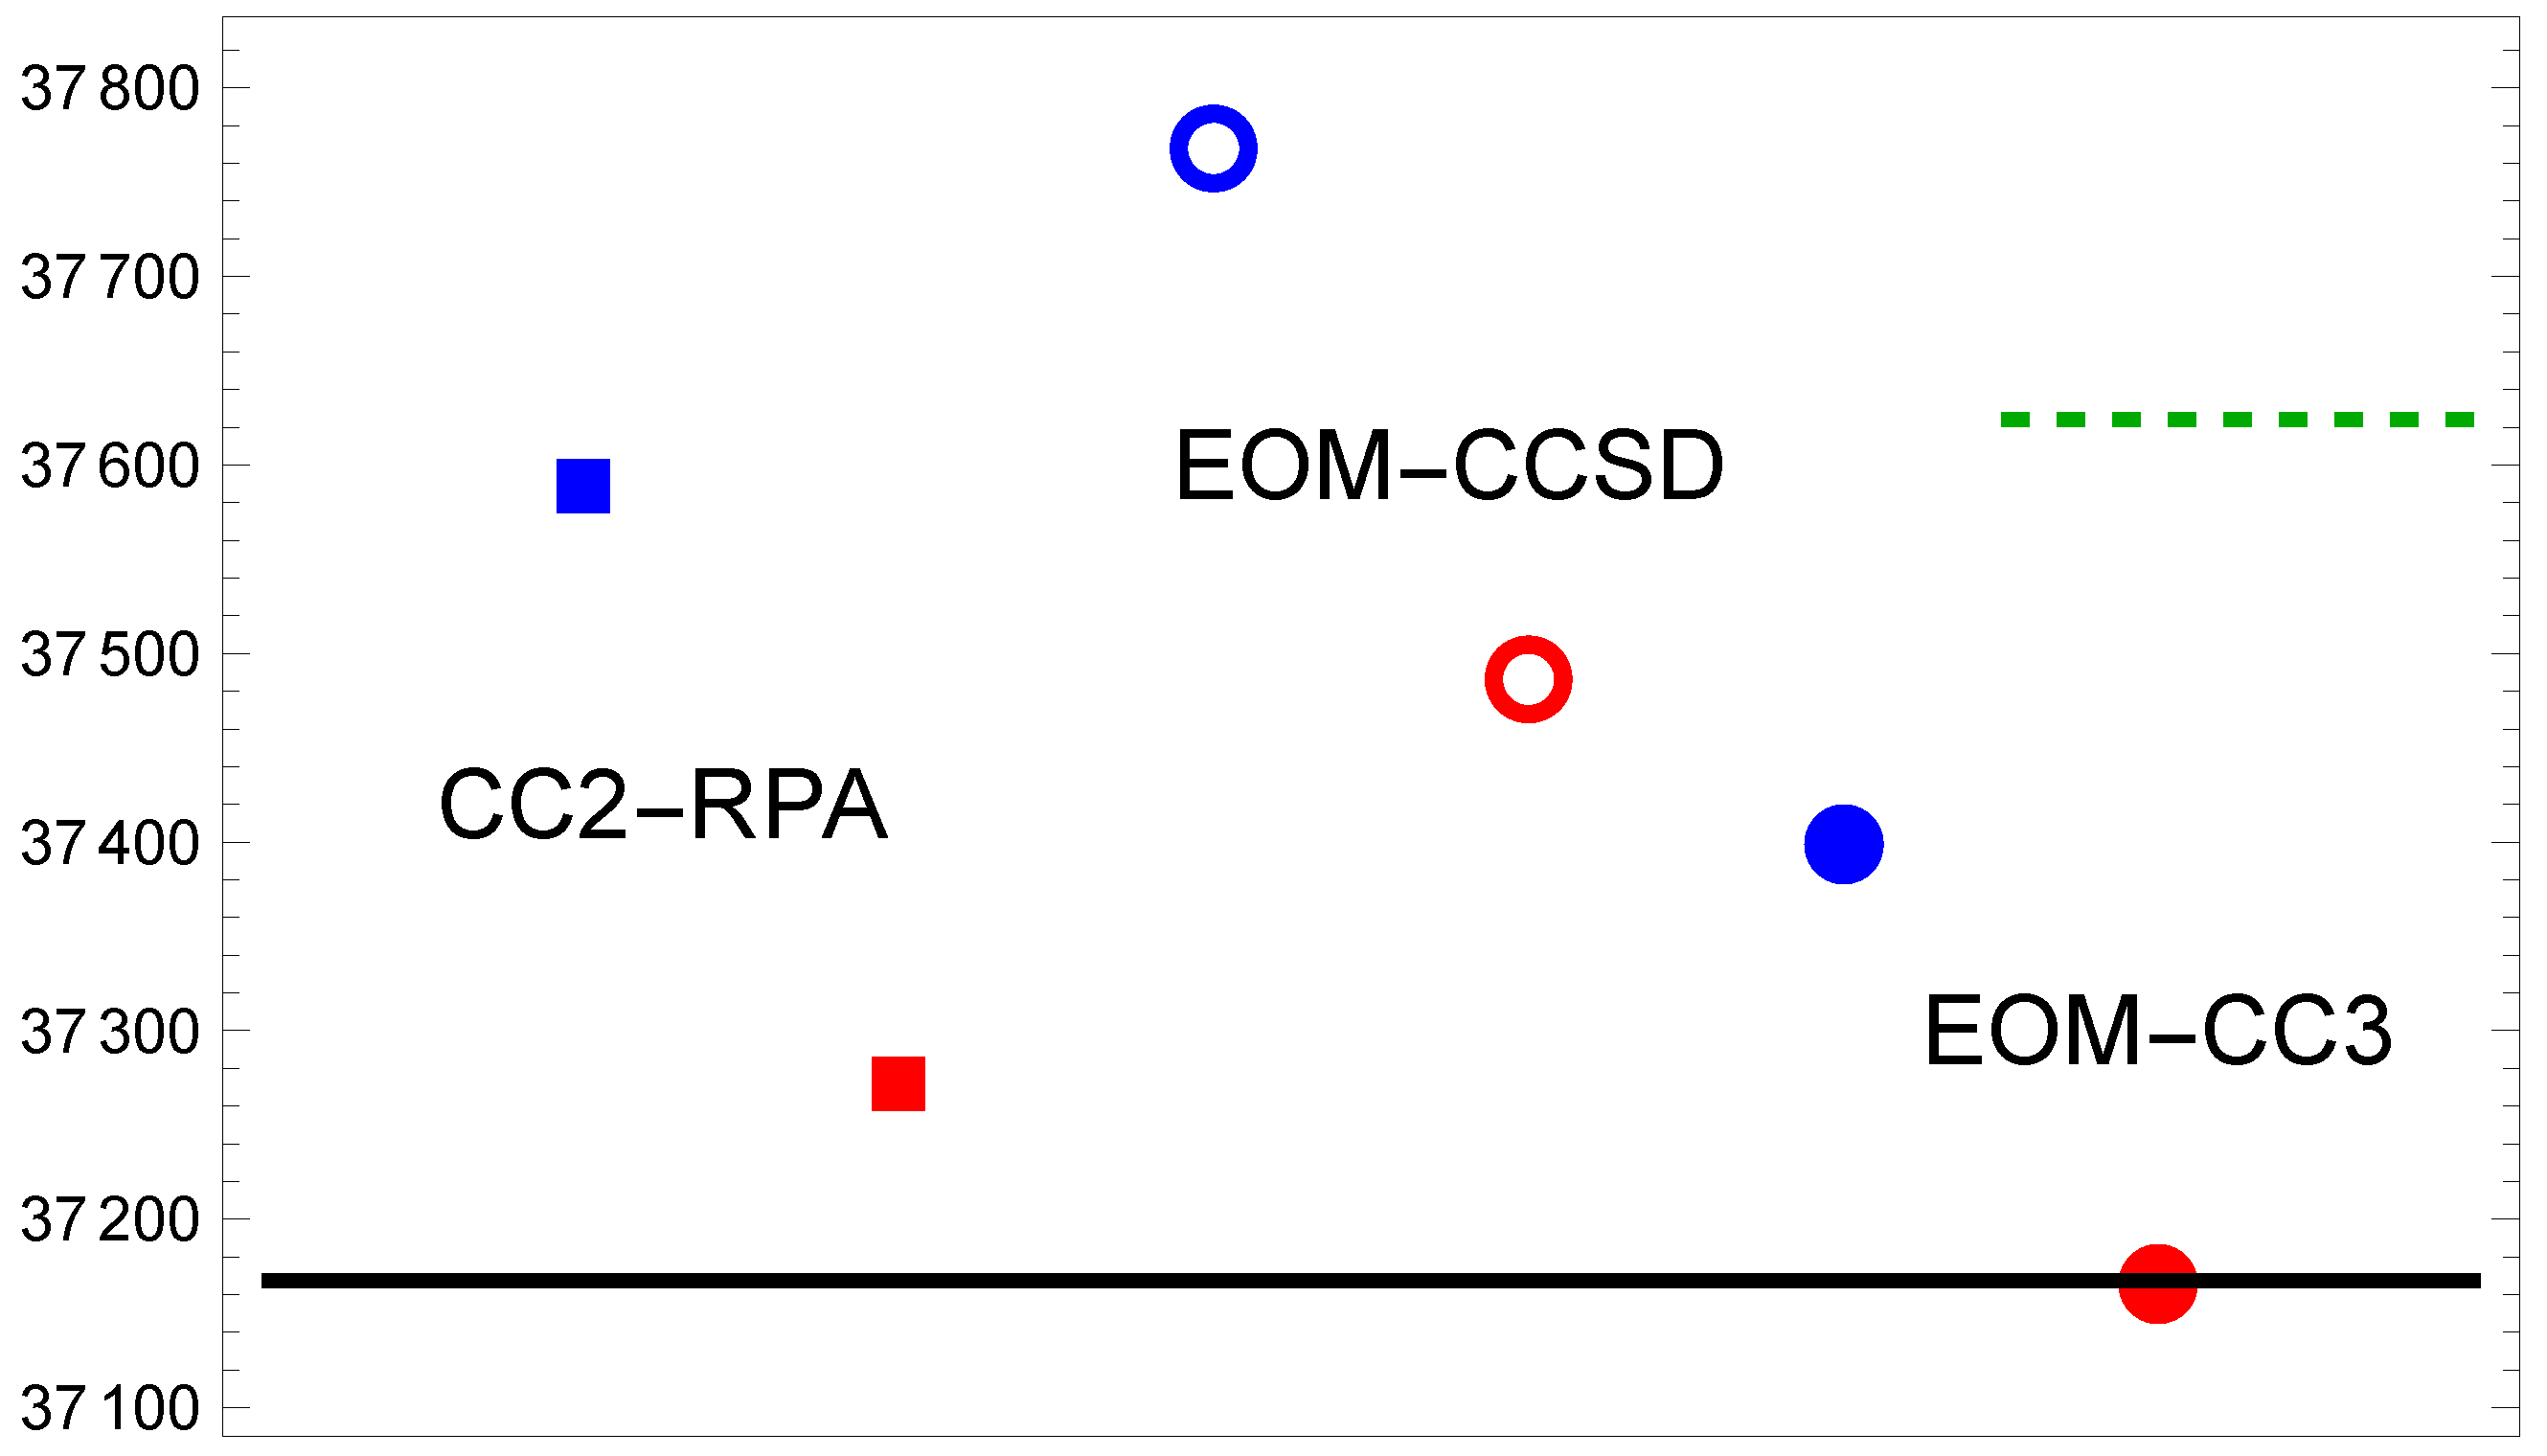
Excitations to higher electronic states can be expected to come out with less accuracy, particularly since they are of the same symmetry. Figure 3 shows that this is clearly the case: the ordinate spans a wider range. All methods approach the experimental excitation energy from above and exhibit qualitatively a similar trend when comparing the def2 and aug-cc basis sets. The differences are larger (on the order of 300 cm 1 ), and the aug-cc basis set calculations clearly do better. Remarkably the EOM-CC3 result for the aug-cc basis set falls right onto the experimental value when extrapolated to the CBS limit. Given that the calculated results represent Δ T and not Δ T e this ‘best’ result may be too low by about 100 cm 1 . The Fock-space CC results of Ref. [21] are more than 400 cm 1 too high.

3.3. MgF( X 2 Σ + C 2 Σ + )

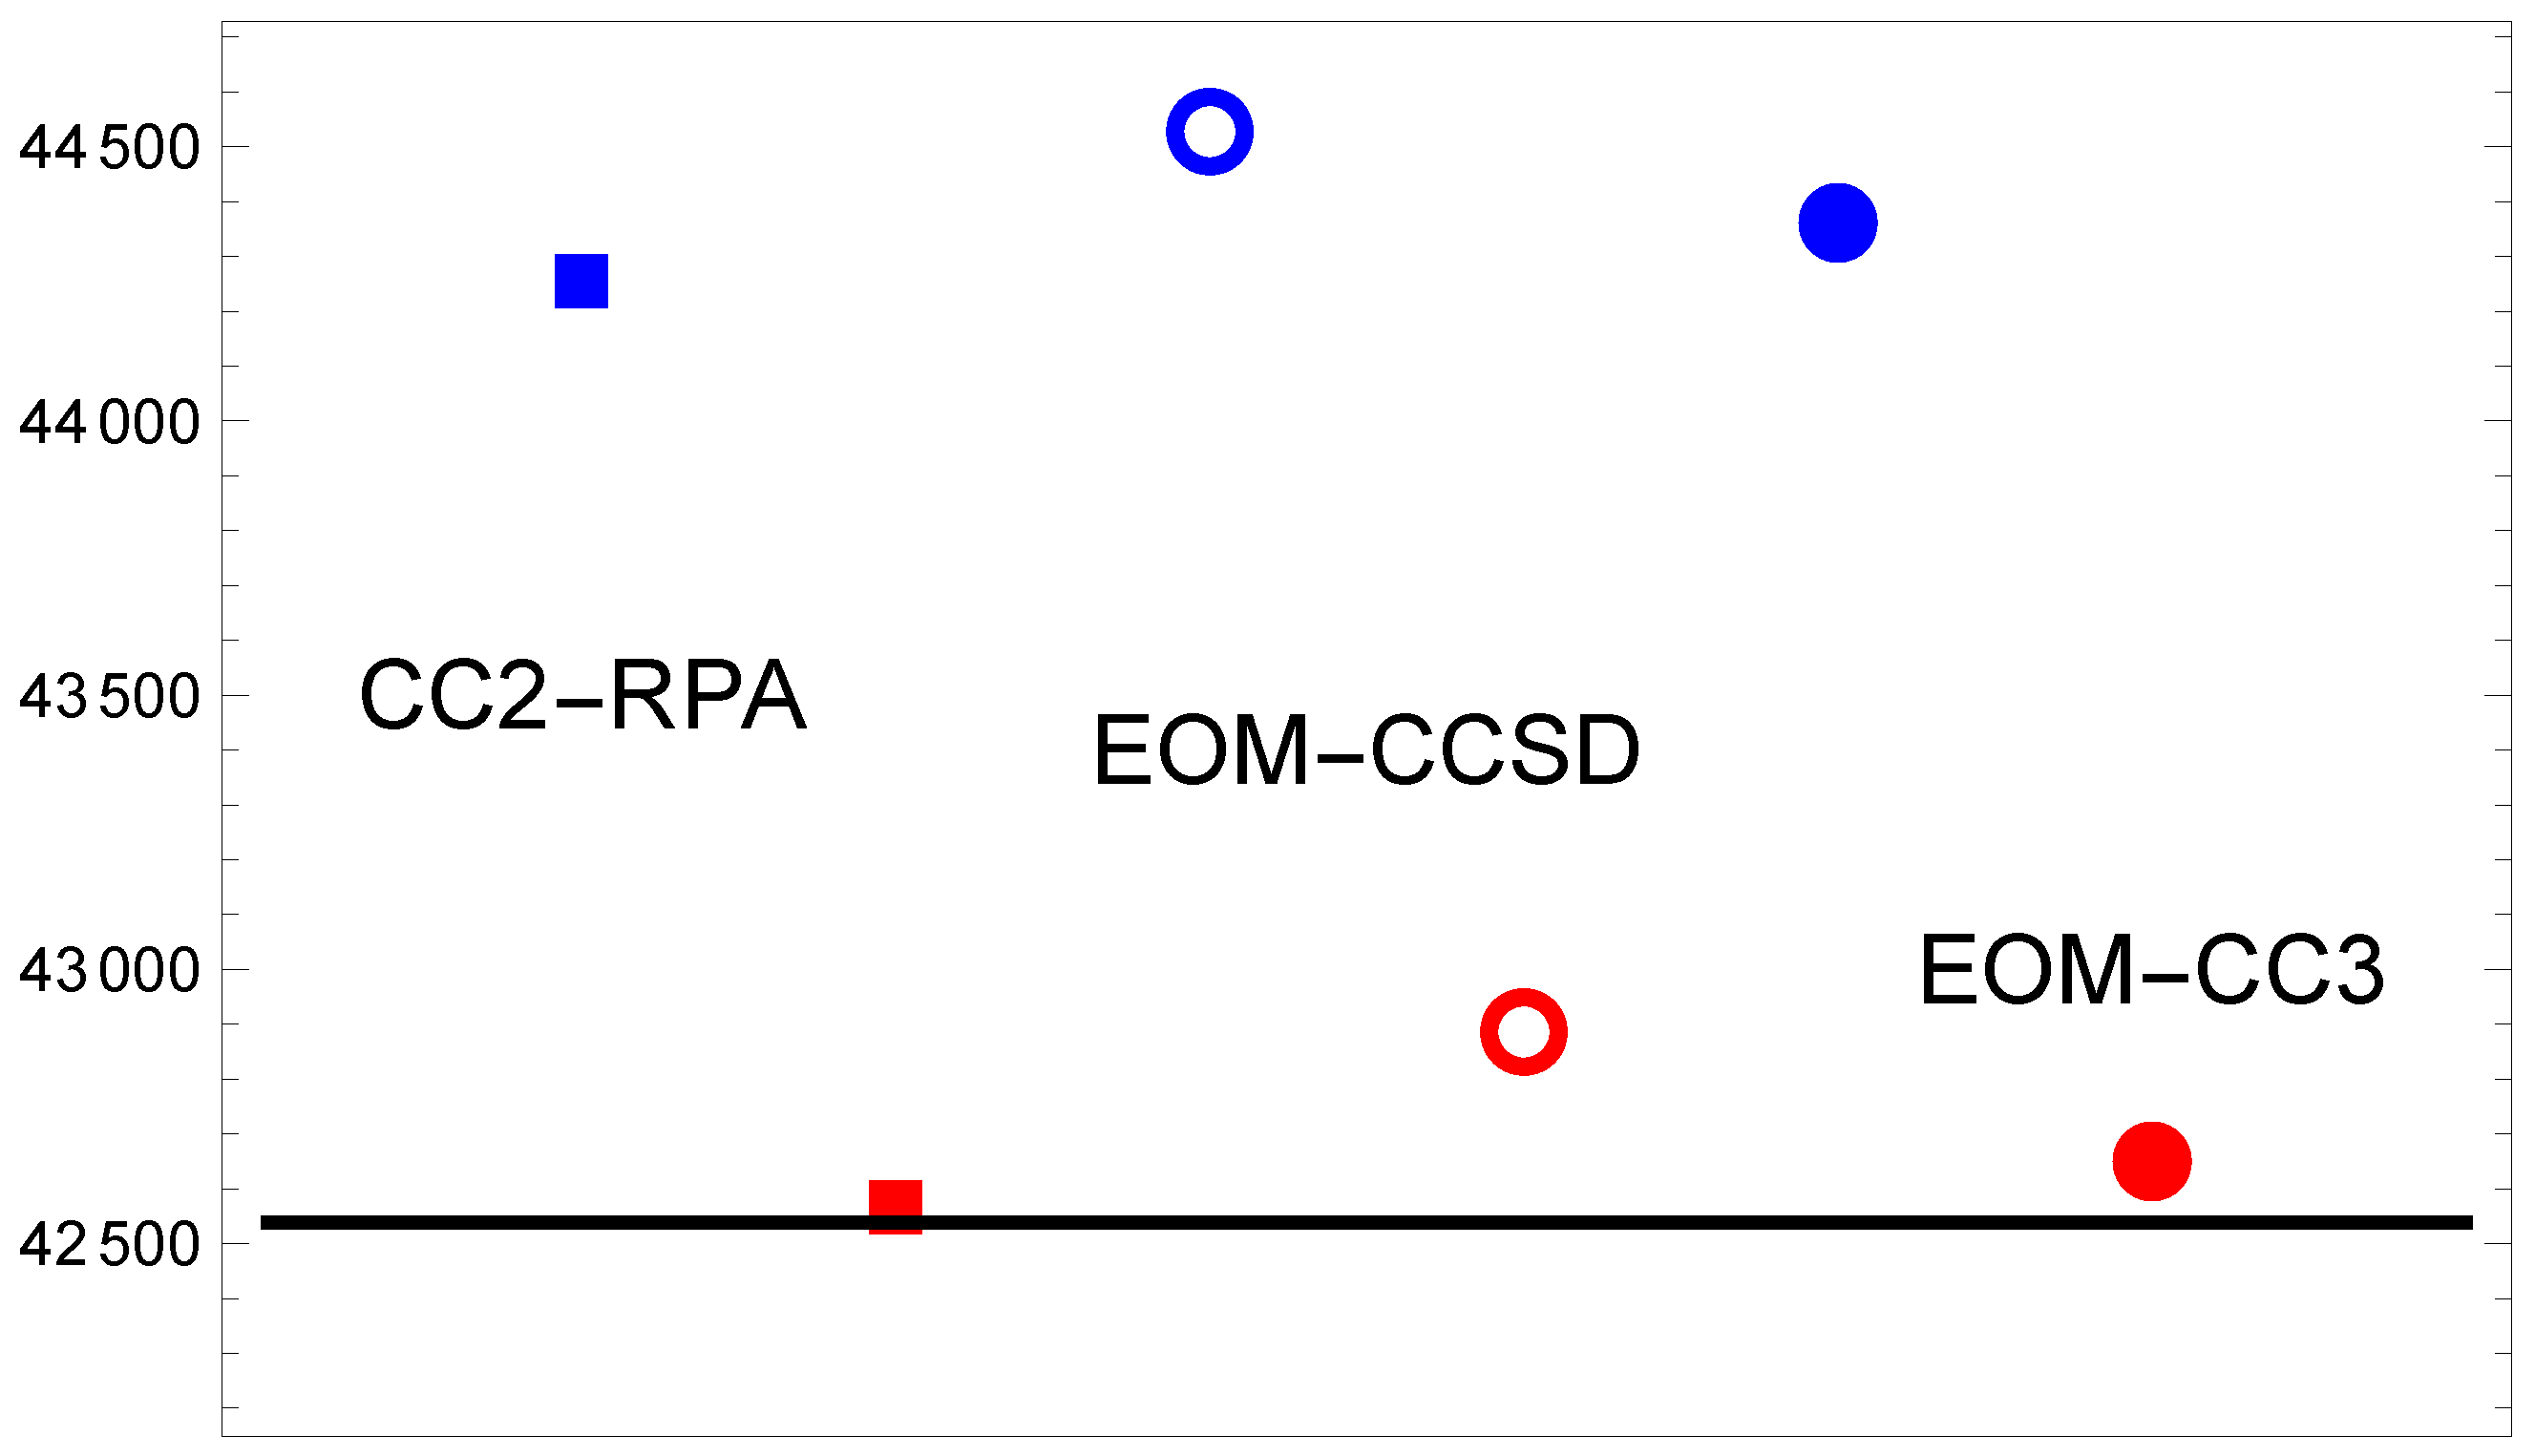
The next-higher state was considered by Barrow and Beale [1] to be a Rydberg state. The energy scale in Figure 4 is expanded to cover 2000 cm 1 . Interestingly, this range is required mostly to show the difference between results from the two basis set families. The EOM-CC3 method gives an excellent result in the CBS limit. In order to assess whether this is a lucky coincidence, we report in Table 2 the actual EOM-CC3 data for the aug-cc basis sets. These data allow one to observe some interesting trends, particularly as to how the extrapolation works.
For the excitation to the A 2 Π the progression of numbers approaches the CBS from below in a systematic way. The extrapolation to a value which is about 100 cm 1 above n = 5 is based on the fact that the quadruple- and quintuple-zeta basis results differ by almost 200 cm 1 .
For the B 2 Σ + excitation, the progression of n = 3 , 4 , 5 results is not monotonic. It follows, however, from Equation (2) that the estimated CBS limit result is governed by the increase in excitation energy between the n = 4 , 5 results. The variation in the excitation energy with basis set quality is at the 200 cm 1 level. This is an interesting observation in the context of the relativistic calculation of Ref. [21] which overestimates the experiment by about twice this amount. It leads to the conclusion that the EOM-CC3 method includes important correlation contributions almost independent of the value of n when using the aug-cc-pVnZ basis. Given that the def2 basis result was less successful (cf. Figure 3), one can argue that the augmentation of the basis set is important to achieve the reported accuracy.
For the case of C 2 Σ + excitation, the sequence of excitation energies for n = 3 , 4 , 5 is systematic and again approaches the extrapolated result from below. The data for all three excited states presented in Table 2 support the notion that the triple-zeta (n = 3) calculations can be used to obtain a quick overview of the situation accurately at the few-hundred cm 1 level.
Some comments about the level of accuracy of the best calculations, i.e., the EOM-CC3 method, are in order. In the literature, one finds the comment that in many circumstances, the accuracy at the 40 meV level (≈ 300 cm 1 ) is obtainable for this method [29]. From the data in Table 2 we provide some estimates on the basis of how the CBS limit changes relative to the n = 4 , 5 results. For the A 2 Π state, the difference between the calculated n = 4 , 5 values is about 200 cm 1 and the CBS value shifts by about 100 cm 1 . Agreement with the experiment suggests that the accuracy is at the 50 cm 1 level. For the B 2 Σ + state, the situation is similar, and Δ T Δ T e agrees at about the same level. For the C 2 Σ + state, a proper comparison with the experiment would require a proper Δ T e calculation due to the more substantial change in R e for this state. In addition to the reported data, we performed calculations with the non-augmented basis sets cc-pVnZ, which lack the higher orbital angular momentum basis functions provided by the augmentation. We found that the deviations are on the scale of about 2000 cm 1 which is the ordinate scale of Figure 4. This confirms the importance of using well-augmented basis sets when calculating excitation energies Δ T .

4. Conclusions

Electronically excited states of magnesium fluoride, a basic polar diatomic molecule, were calculated at a few levels of coupled-cluster theory. The very fast CC2-RPA method as implemented in TURBOMOLE yields good first estimates of the excitation spectrum, particularly in combination with the aug-cc basis set family.
The EOM-CCSD method which is a turnkey method to obtain the spectrum tends to overestimate the excitation energies. While the def2 basis works reasonably well for the lower two excitations, it leads to overestimated energies for the C 2 Σ + state both in the CC2-RPA and the EOM-CCSD methods.
The EOM-CC3 method requires more effort (both operationally and in terms of computing time) but represents the most accurate of these toolsets. For molecules where the Δ -CC methodology works, i.e., higher roots than for the ground state can be found, Δ -CCSD(T) computations should represent an economical alternative to it.
The results shown in Figure 2, Figure 3 and Figure 4 are for the extrapolated complete basis set limits. In Table 2 it is shown how this CBS limit is reached for the EOM-CC3 method. Table A1 in the Appendix A provides the calculated excitation energies for all cases shown in the figures.

Funding

This research was funded by the Natural Sciences and Engineering Research Council of Canada (NSERC) (RGPIN-2017-05655 and RGPIN-2023-05072).

Data Availability Statement

The raw data supporting the conclusions of this article will be made available by the author on request.

Acknowledgments

I thank Eric Hessels, Gregory Koyanagi and Rene Fournier for many discussions. I also thank the referees for their helpful suggestions. Support from the Natural Sciences and Engineering Research Council of Canada is gratefully acknowledged.

Conflicts of Interest

The author declares no conflict of interest.

Appendix A

Table A1. Numerical data for the excitation energies Δ T in cm 1 shown in Figure 2, Figure 3 and Figure 4. For each of the methods the left column shows the results from the def2 basis sets (TZ, QZ), while the right column is for the aug-cc basis sets (TZ, QZ, 5Z). CBS values are the extrapolated values shown in Figure 2, Figure 3 and Figure 4.
CC2CC2CCSDCCSDCC3CC3
A 2 Π TZ27,64627,40727,78327,54527,73127,507
QZ27,67327,45927,82827,60527,75827,566
5Z 27,634 27,798 27,744
CBS27,69227,73827,86127,91227,77727,849
B 2 Σ + TZ37,63737,20537,78537,28337,42636,966
QZ37,60837,05937,77537,19637,41236,895
5Z 36,895 37,378 37,067
CBS37,58737,27037,76837,48637,40237,169
C 2 Σ + TZ47,26742,15947,55042,40847,33742,257
QZ45,52142,18945,80342,47245,62542,316
5Z 42,316 42,732 42,534
CBS44,24742,55944,52742,88644,37542,663

References

  1. Barrow, R.F.; Beale, J.R. Rotational analysis of electronic bands of gaseous MgF. Proc. Phys. Soc. 1967, 91, 483. [Google Scholar] [CrossRef]
  2. Novikov, M.M.; Gurvich, L.V. The electronic spectra of MgF and MgF+. J. Appl. Spectrosc. 1971, 14, 820–822. [Google Scholar] [CrossRef]
  3. Xu, S.; Xia, M.; Yin, Y.; Gu, R.; Xia, Y.; Yin, J. Determination of the normal A2Π state in MgF with application to direct laser cooling of molecules. J. Chem. Phys. 2019, 150, 084302. [Google Scholar] [CrossRef]
  4. Doppelbauer, M.; Wright, S.C.; Hofsäss, S.; Sartakov, B.G.; Meijer, G.; Truppe, S. Hyperfine-resolved optical spectroscopy of the A2Π←X2Σ+ transition in MgF. J. Chem. Phys. 2022, 156, 134301. [Google Scholar] [CrossRef] [PubMed]
  5. Kang, S.; Gao, Y.; Kuang, F.; Gao, T.; Du, J.; Jiang, G. Theoretical study of laser cooling of magnesium monofluoride using ab initio methods. Phys. Rev. A 2015, 91, 042511, Erratum in Phys. Rev. A 2015, 92, 069902. [Google Scholar] [CrossRef]
  6. Gu, J.; Xiao, Z.; Yu, C.; Zhang, Q.; Chen, Y.; Zhao, D. High resolution laser excitation spectra and Franck-Condon factors of A2Π–X2Σ+ electronic transition of MgF. Chin. J. Chem. Phys. 2022, 35, 58–68. [Google Scholar] [CrossRef]
  7. Hou, S.; Bernath, P.F. Line list for the MgF ground state. J. Quant. Spectrosc. Radiat. Transf. 2017, 203, 511–516. [Google Scholar] [CrossRef]
  8. Berning, A.; Schweizer, M.; Werner, H.J.; Knowles, P.J.; Palmieri, P. Spin-orbit matrix elements for internally contracted multireference configuration interaction wavefunctions. Mol. Phys. 2000, 98, 1823–1833. [Google Scholar] [CrossRef]
  9. Bruder, F.; Franzke, Y.J.; Weigend, F. Paramagnetic NMR Shielding Tensors Based on Scalar Exact Two-Component and Spin–Orbit Perturbation Theory. J. Phys. Chem. A 2022, 126, 5050–5069. [Google Scholar] [CrossRef] [PubMed]
  10. TURBOMOLE V7.8 2024, a Development of University of Karlsruhe and Forschungszentrum Karlsruhe GmbH, 1989–2007. TURBOMOLE GmbH, Since 2007. Available online: http://www.turbomole.com (accessed on 31 July 2024).
  11. Vutha, A.C.; Horbatsch, M.; Hessels, E.A. Oriented Polar Molecules in a Solid Inert-Gas Matrix: A Proposed Method for Measuring the Electric Dipole Moment of the Electron. Atoms 2018, 6, 3. [Google Scholar] [CrossRef]
  12. Buchachenko, A.A.; Viehland, L.A. Interaction potentials and transport properties of Ba, Ba+, and Ba2+ in rare gases from He to Xe. J. Chem. Phys. 2018, 148, 154304. [Google Scholar] [CrossRef] [PubMed]
  13. Kleshchina, N.N.; Kalinina, I.S.; Leibin, I.V.; Bezrukov, D.S.; Buchachenko, A.A. Stable axially symmetric atomic impurity in an fcc solid—Ba in rare gases. J. Chem. Phys. 2019, 151, 121104. [Google Scholar] [CrossRef] [PubMed]
  14. Koyanagi, G.K.; Lambo, R.L.; Ragyanszki, A.; Fournier, R.; Horbatsch, M.; Hessels, E.A. Accurate calculation of the interaction of a barium monofluoride molecule with an argon atom: A step towards using matrix isolation of BaF for determining the electron electric dipole moment. J. Mol. Spectrosc. 2023, 391, 111736. [Google Scholar] [CrossRef]
  15. Lambo, R.L.; Koyanagi, G.K.; Ragyanszki, A.; Horbatsch, M.; Fournier, R.; Hessels, E.A. Calculation of the local environment of a barium monofluoride molecule in an argon matrix: A step towards using matrix-isolated BaF for determining the electron electric dipole moment. Mol. Phys. 2023, 121, e2198044. [Google Scholar] [CrossRef]
  16. Lambo, R.L.; Koyanagi, G.K.; Horbatsch, M.; Fournier, R.; Hessels, E.A. Calculation of the local environment of a barium monofluoride molecule in a neon matrix. Mol. Phys. 2023, 121, e2232051. [Google Scholar] [CrossRef]
  17. Hao, Y.; Pašteka, L.F.; Visscher, L.; Aggarwal, P.; Bethlem, H.L.; Boeschoten, A.; Borschevsky, A.; Denis, M.; Esajas, K.; Hoekstra, S.; et al. High accuracy theoretical investigations of CaF, SrF, and BaF and implications for laser-cooling. J. Chem. Phys. 2019, 151, 034302. [Google Scholar] [CrossRef] [PubMed]
  18. Skripnikov, L.V.; Chubukov, D.V.; Shakhova, V.M. The role of QED effects in transition energies of heavy-atom alkaline earth monofluoride molecules: A theoretical study of Ba+, BaF, RaF, and E120F. J. Chem. Phys. 2021, 155, 144103. [Google Scholar] [CrossRef] [PubMed]
  19. Kyuberis, A.A.; Pašteka, L.F.; Eliav, E.; Perrett, H.A.; Sunaga, A.; Udrescu, S.M.; Wilkins, S.G.; Garcia Ruiz, R.F.; Borschevsky, A. Theoretical determination of the ionization potentials of CaF, SrF, and BaF. Phys. Rev. A 2024, 109, 022813. [Google Scholar] [CrossRef]
  20. Denis, M.; Haase, P.A.B.; Mooij, M.C.; Chamorro, Y.; Aggarwal, P.; Bethlem, H.L.; Boeschoten, A.; Borschevsky, A.; Esajas, K.; Hao, Y.; et al. Benchmarking of the Fock-space coupled-cluster method and uncertainty estimation: Magnetic hyperfine interaction in the excited state of BaF. Phys. Rev. A 2022, 105, 052811. [Google Scholar] [CrossRef]
  21. Norrgard, E.B.; Chamorro, Y.; Cooksey, C.C.; Eckel, S.P.; Pilgram, N.H.; Rodriguez, K.J.; Yoon, H.W.; Pašteka, L.F.; Borschevsky, A. Radiative decay rate and branching fractions of MgF. Phys. Rev. A 2023, 108, 032809. [Google Scholar] [CrossRef]
  22. Hättig, C.; Weigend, F. CC2 excitation energy calculations on large molecules using the resolution of the identity approximation. J. Chem. Phys. 2000, 113, 5154–5161. [Google Scholar] [CrossRef]
  23. Hättig, C. Structure Optimizations for Excited States with Correlated Second-Order Methods: CC2 and ADC(2). In Response Theory and Molecular Properties (A Tribute to Jan Linderberg and Poul Jørgensen); Jensen, H., Ed.; Advances in Quantum Chemistry; Academic Press: Cambridge, MA, USA, 2005; Volume 50, pp. 37–60. [Google Scholar] [CrossRef]
  24. Weigend, F.; Ahlrichs, R. Balanced basis sets of split valence, triple zeta valence and quadruple zeta valence quality for H to Rn: Design and assessment of accuracy. Phys. Chem. Chem. Phys. 2005, 7, 3297–3305. [Google Scholar] [CrossRef] [PubMed]
  25. Hättig, C.; Köhn, A. Transition moments and excited-state first-order properties in the coupled-cluster model CC2 using the resolution-of-the-identity approximation. J. Chem. Phys. 2002, 117, 6939–6951. [Google Scholar] [CrossRef]
  26. Gauss, J. Equation-of-Motion Coupled-Cluster Theory, 2017. Available online: https://www.esqc.org/lectures/gauss_EOM_lecture_handout.pdf (accessed on 31 May 2024).
  27. Crawford, T.D.; Schaefer, H.F., III. An Introduction to Coupled Cluster Theory for Computational Chemists. In Reviews in Computational Chemistry; John Wiley & Sons, Ltd.: Hoboken, NJ, USA, 2000; pp. 33–136. [Google Scholar] [CrossRef]
  28. Smith, D.G.A.; Burns, L.A.; Simmonett, A.C.; Parrish, R.M.; Schieber, M.C.; Galvelis, R.; Kraus, P.; Kruse, H.; Di Remigio, R.; Alenaizan, A.; et al. PSI4 1.4: Open-source software for high-throughput quantum chemistry. J. Chem. Phys. 2020, 152, 184108. [Google Scholar] [CrossRef]
  29. Loos, P.F.; Scemama, A.; Blondel, A.; Garniron, Y.; Caffarel, M.; Jacquemin, D. A Mountaineering Strategy to Excited States: Highly Accurate Reference Energies and Benchmarks. J. Chem. Theory Comput. 2018, 14, 4360–4379. [Google Scholar] [CrossRef] [PubMed]
  30. Damour, Y.; Quintero-Monsebaiz, R.; Caffarel, M.; Jacquemin, D.; Kossoski, F.; Scemama, A.; Loos, P.F. Ground- and Excited-State Dipole Moments and Oscillator Strengths of Full Configuration Interaction Quality. J. Chem. Theory Comput. 2023, 19, 221–234. [Google Scholar] [CrossRef] [PubMed]
  31. Paul, A.C.; Myhre, R.H.; Koch, H. New and Efficient Implementation of CC3. J. Chem. Theory Comput. 2021, 17, 117–126. [Google Scholar] [CrossRef] [PubMed]
  32. Damour, Y.; Scemama, A.; Jacquemin, D.; Kossoski, F.; Loos, P.F. State-Specific Coupled-Cluster Methods for Excited States. J. Chem. Theory Comput. 2024, 20, 4129–4145. [Google Scholar] [CrossRef] [PubMed]
  33. Lee, J.; Small, D.W.; Head-Gordon, M. Excited states via coupled cluster theory without equation-of-motion methods: Seeking higher roots with application to doubly excited states and double core hole states. J. Chem. Phys. 2019, 151, 214103. [Google Scholar] [CrossRef]
  34. Prascher, B.P.; Woon, D.E.; Peterson, K.A.; Dunning, T.H.; Wilson, A.K. Gaussian basis sets for use in correlated molecular calculations. VII. Valence, core-valence, and scalar relativistic basis sets for Li, Be, Na, and Mg. Theor. Chem. Accounts 2011, 128, 69–82. [Google Scholar] [CrossRef]
  35. Kendall, R.A.; Dunning, T.H., Jr.; Harrison, R.J. Electron affinities of the first-row atoms revisited. Systematic basis sets and wave functions. J. Chem. Phys. 1992, 96, 6796–6806. [Google Scholar] [CrossRef]
  36. Peterson, K.A.; Woon, D.E.; Dunning, T.H., Jr. Benchmark calculations with correlated molecular wave functions. IV. The classical barrier height of the H+H2→ H2+H reaction. J. Chem. Phys. 1994, 100, 7410–7415. [Google Scholar] [CrossRef]
  37. Bernath, P.F. Spectra of Atoms and Molecules, 4th ed.; Oxford University Press: Oxford, UK, 2020. [Google Scholar]
  38. Linstrom, P.J.; Mallard, W.G. NIST Chemistry WebBook, NIST Standard Reference Database Number 69; National Institute of Standards and Technology: Gaithersburg, MD, USA, 2023. [CrossRef]
  39. Field, R.W.; Bergeman, T.H. Radio-Frequency Spectroscopy and Perturbation Analysis in CS A1Π(υ = 0). J. Chem. Phys. 1971, 54, 2936–2948. [Google Scholar] [CrossRef]
Figure 1. Potential energy curves for the X 2 Σ + and C 2 Σ + states in blue and red, respectively, as obtained by the EOM-CC3 method and the aug-cc-pVQZ basis. The results for the C 2 Σ + state (red) in reality are offset relative to the X 2 Σ + (blue) by Δ T e = 42,113 cm−1. The open circles show calculated results, the curves are Morse potential fits to these data. The dashed horizontal lines show the positions of the v = 0 , 1 vibrational levels indicating the substantial difference in ω e for the two states.
Atoms 12 00040 g001
Figure 2. Excitation energies Δ T in cm 1 (calculated for R = 1.75 Å) for the electronic transition MgF ( X 2 Σ + A 2 Π ). Solid lines: experimental value extracted from the analysis of rotational and vibrational ( v = 0 , 1 ) excitations for the A 2 Π 1 / 2 and A 2 Π 3 / 2 states based on data given in Ref. [1]. The short dashed lines show the Fock-space CC results from Ref. [21]. The present theoretical results are without spin-orbit coupling and should fall in between the black solid lines. Squares: results from the CC2-RPA method, open circles: from EOM-CCSD, and solid circles from EOM-CC3. For each method basis sets of increasing accuracy were applied and extrapolated to a complete basis set limit: on the left (in blue) for the def2-TZVPPD and def2-QZVPPD basis sets, and on the right (in red) for the aug-cc-pVnZ family with n = 3, 4, 5.
Atoms 12 00040 g002
Figure 3. Same as in Figure 2, but for the X 2 Σ + B 2 Σ + transition.
Atoms 12 00040 g003
Figure 4. Same as in Figure 2, but for the X 2 Σ + C 2 Σ + transition.
Atoms 12 00040 g004
Table 1. Spectroscopic data for low-lying electronic configurations of MgF: the first two columns show data derived from spectroscopic observations, i.e., vibrational frequency parameter ω e (in cm 1 ), and equilibrium separation R e (in Å) from Ref. [38]. Columns 4–6 show equilibrium distances R e (in Å) for the ground state from CCSD, CCSD(T) and CC3 calculations using the aug-cc-pV5Z basis. For the two excited states, the results are obtained with the EOM-CCSD method. The ω e values for the A 2 Π states are for J = 1 2 and J = 3 2 , respectively.
ω e ( Expt ) R e (Expt)EOM-CCSDCCSD(T)CC3
X 2 Σ + 7121.75001.7351.7401.742
A 2 Π [740, 746]1.74691.717
B 2 Σ + 7511.71851.699
C 2 Σ + 8131.69881.677
Table 2. Excitation energies Δ T in cm 1 (calculated for R = 1.75 Å) using the aug-cc-pVnZ basis and the EOM-CC3 method. Experimental data in the last column are from Ref. [1]; for the A 2 Π excited state the number marked with is based on the measurement of Ref. [6] as re-analyzed and reported in Ref. [21].
n = 3 n = 4 n = 5 CBSExpt
A 2 Π 27,50727,55627,74427,84927,817 27,834
B 2 Σ + 36,96636,89537,06737,16937,167
C 2 Σ + 42,25742,31642,53442,66342,590
Disclaimer/Publisher’s Note: The statements, opinions and data contained in all publications are solely those of the individual author(s) and contributor(s) and not of MDPI and/or the editor(s). MDPI and/or the editor(s) disclaim responsibility for any injury to people or property resulting from any ideas, methods, instructions or products referred to in the content.