
Visible Light Spectroscopy of W14+ Ions in an Electron Beam Ion Trap

 , , ,
, , ,  ,
,
Abstract
1. Introduction
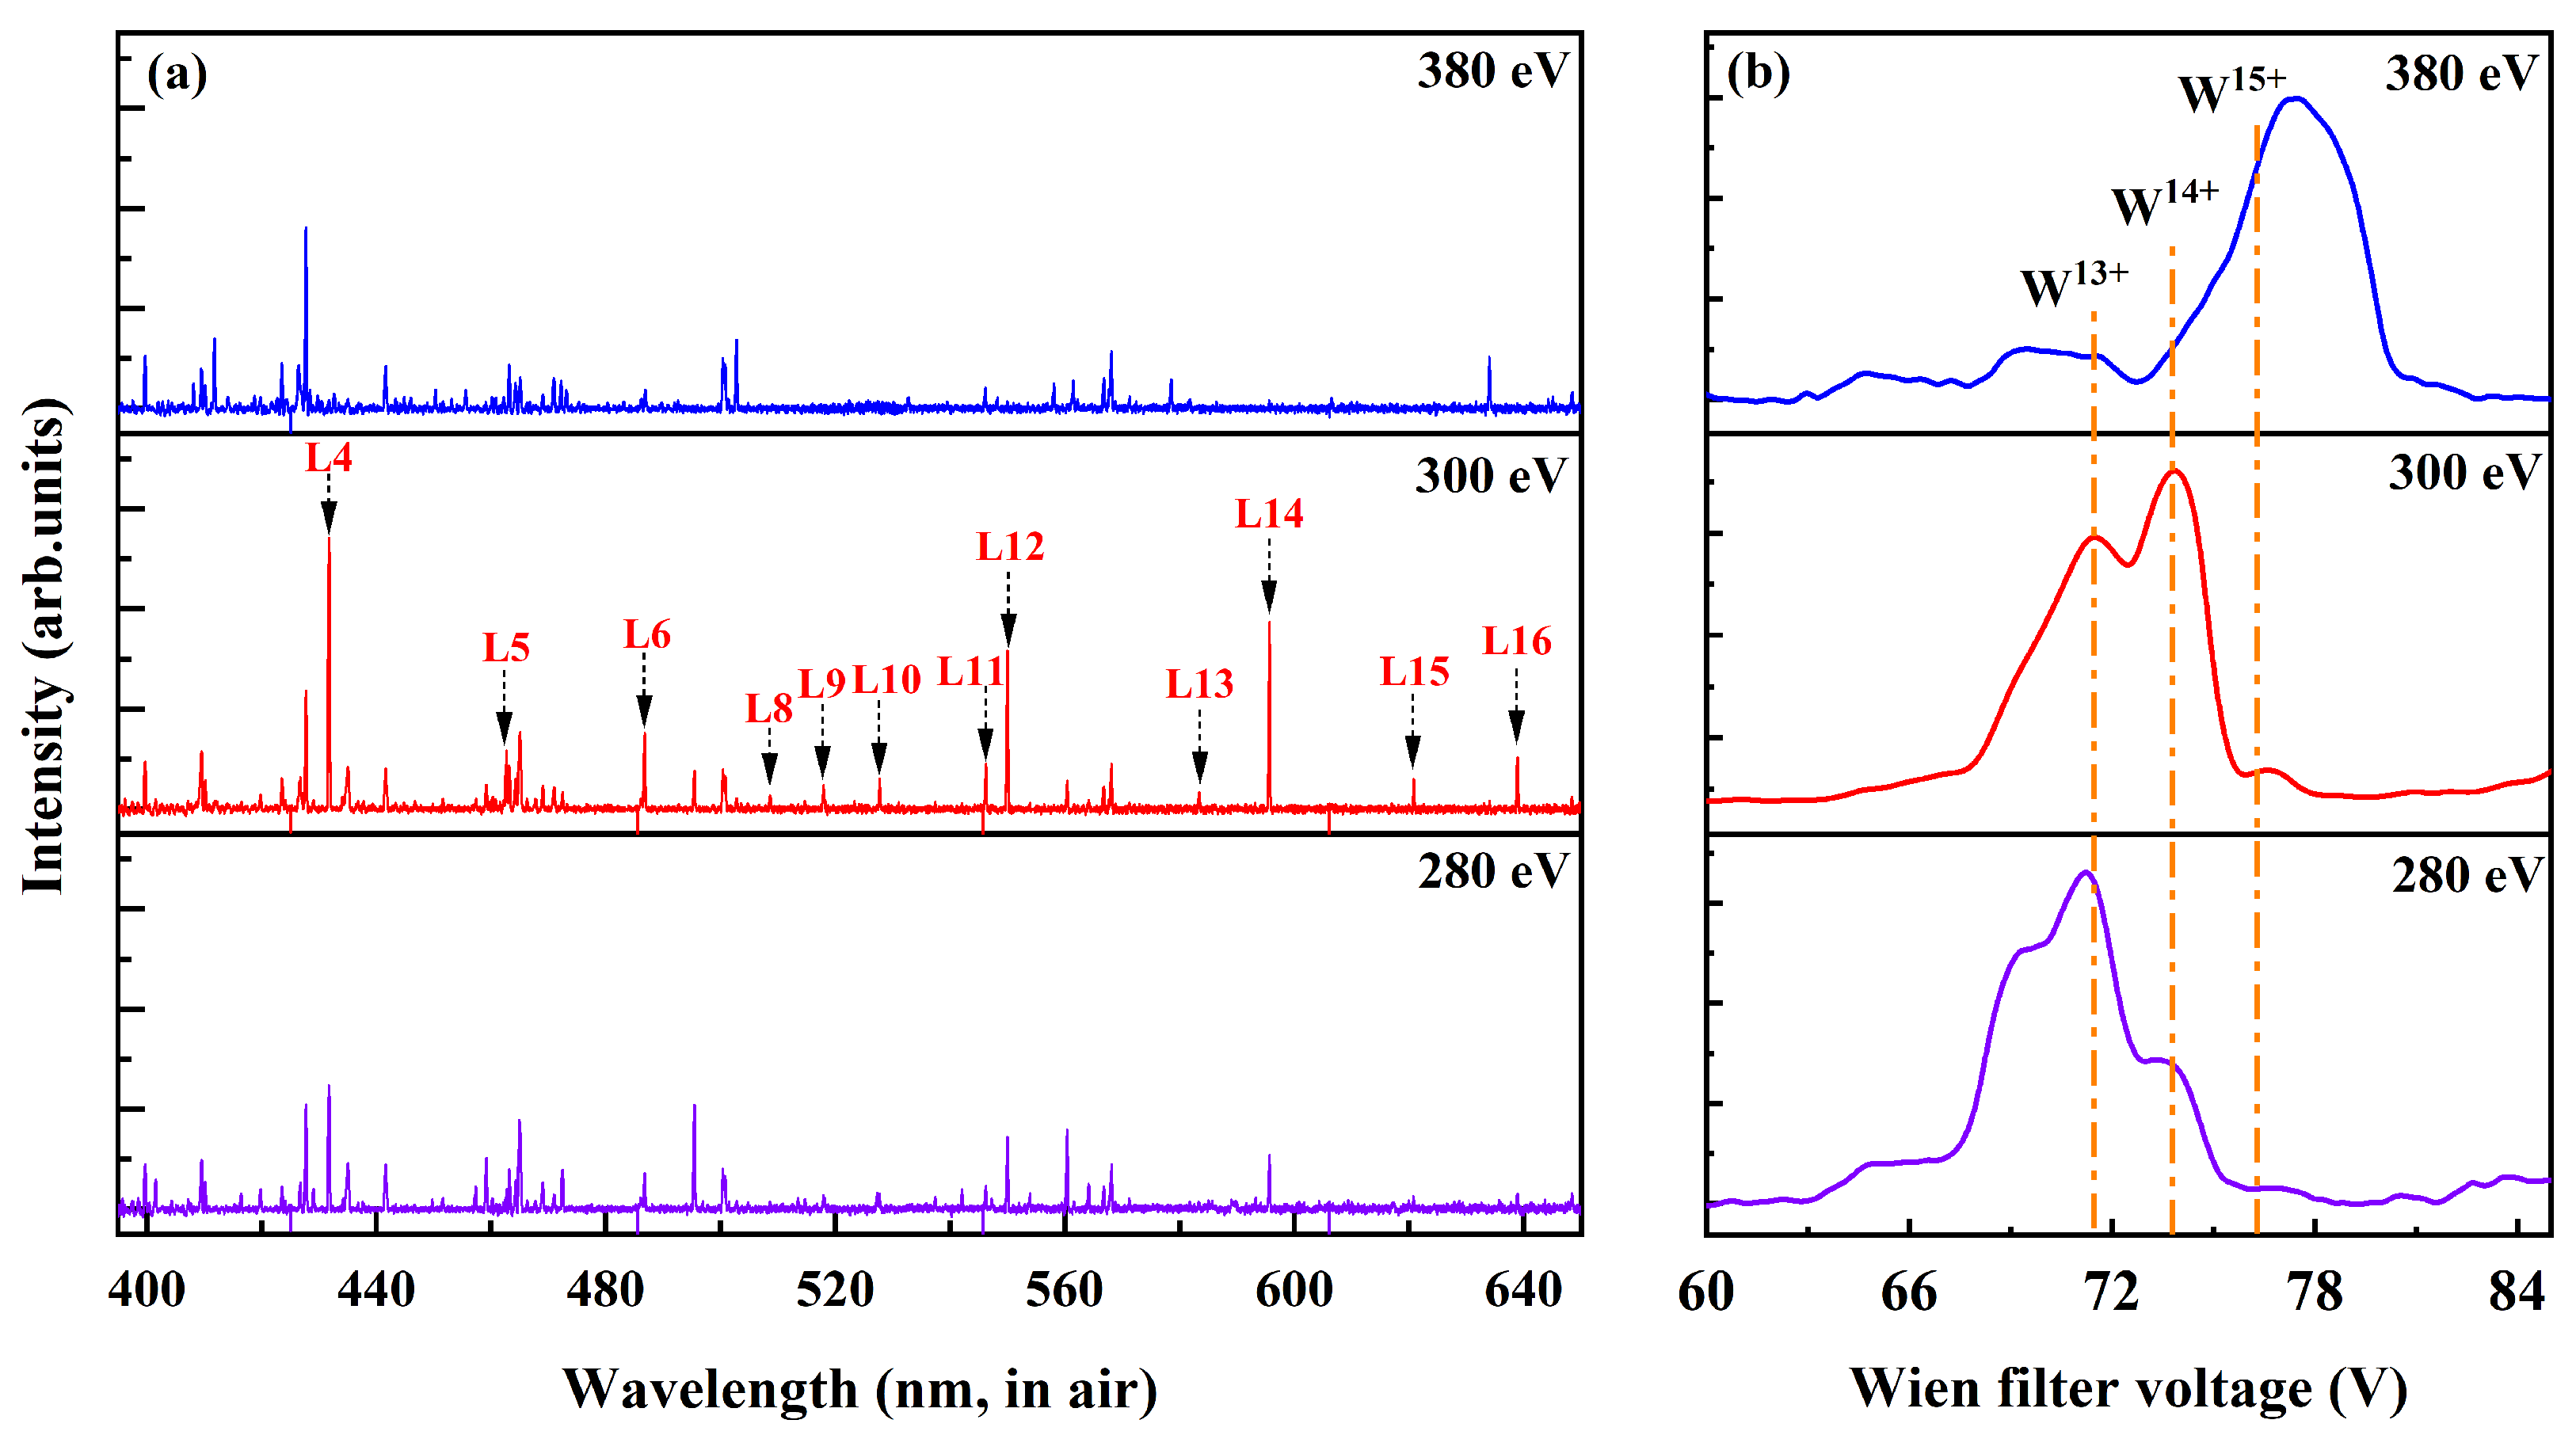
2. Experiment
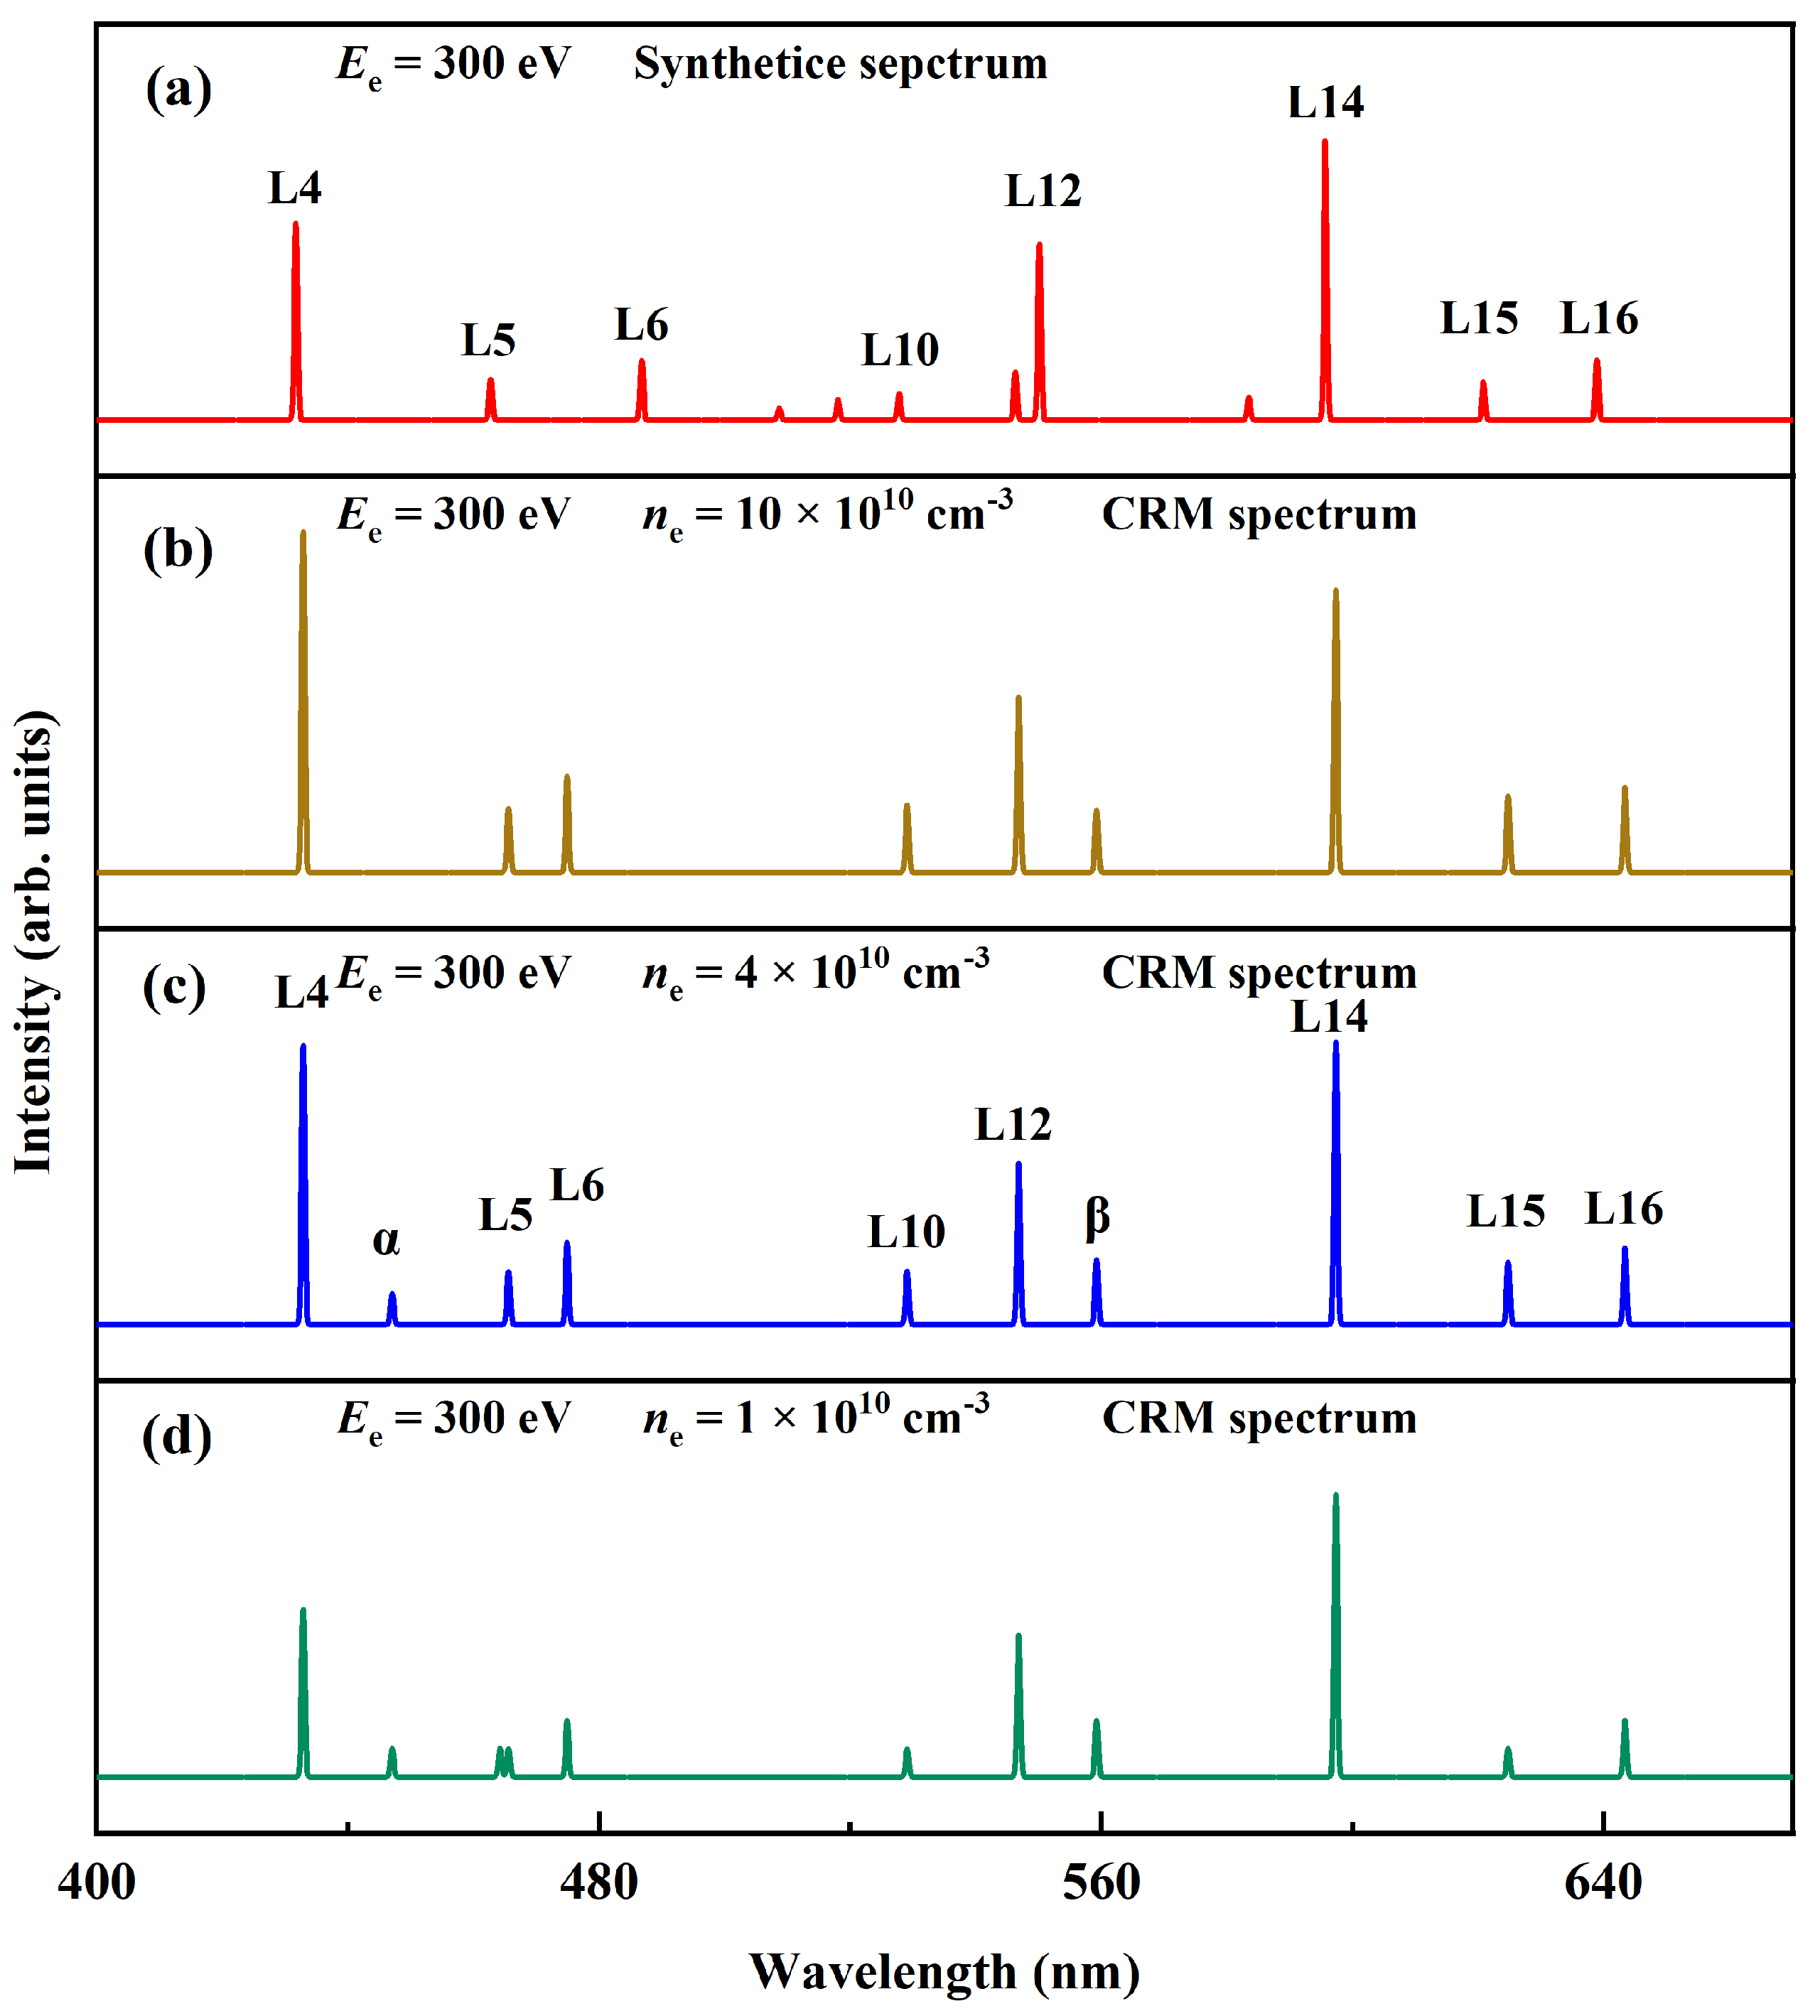
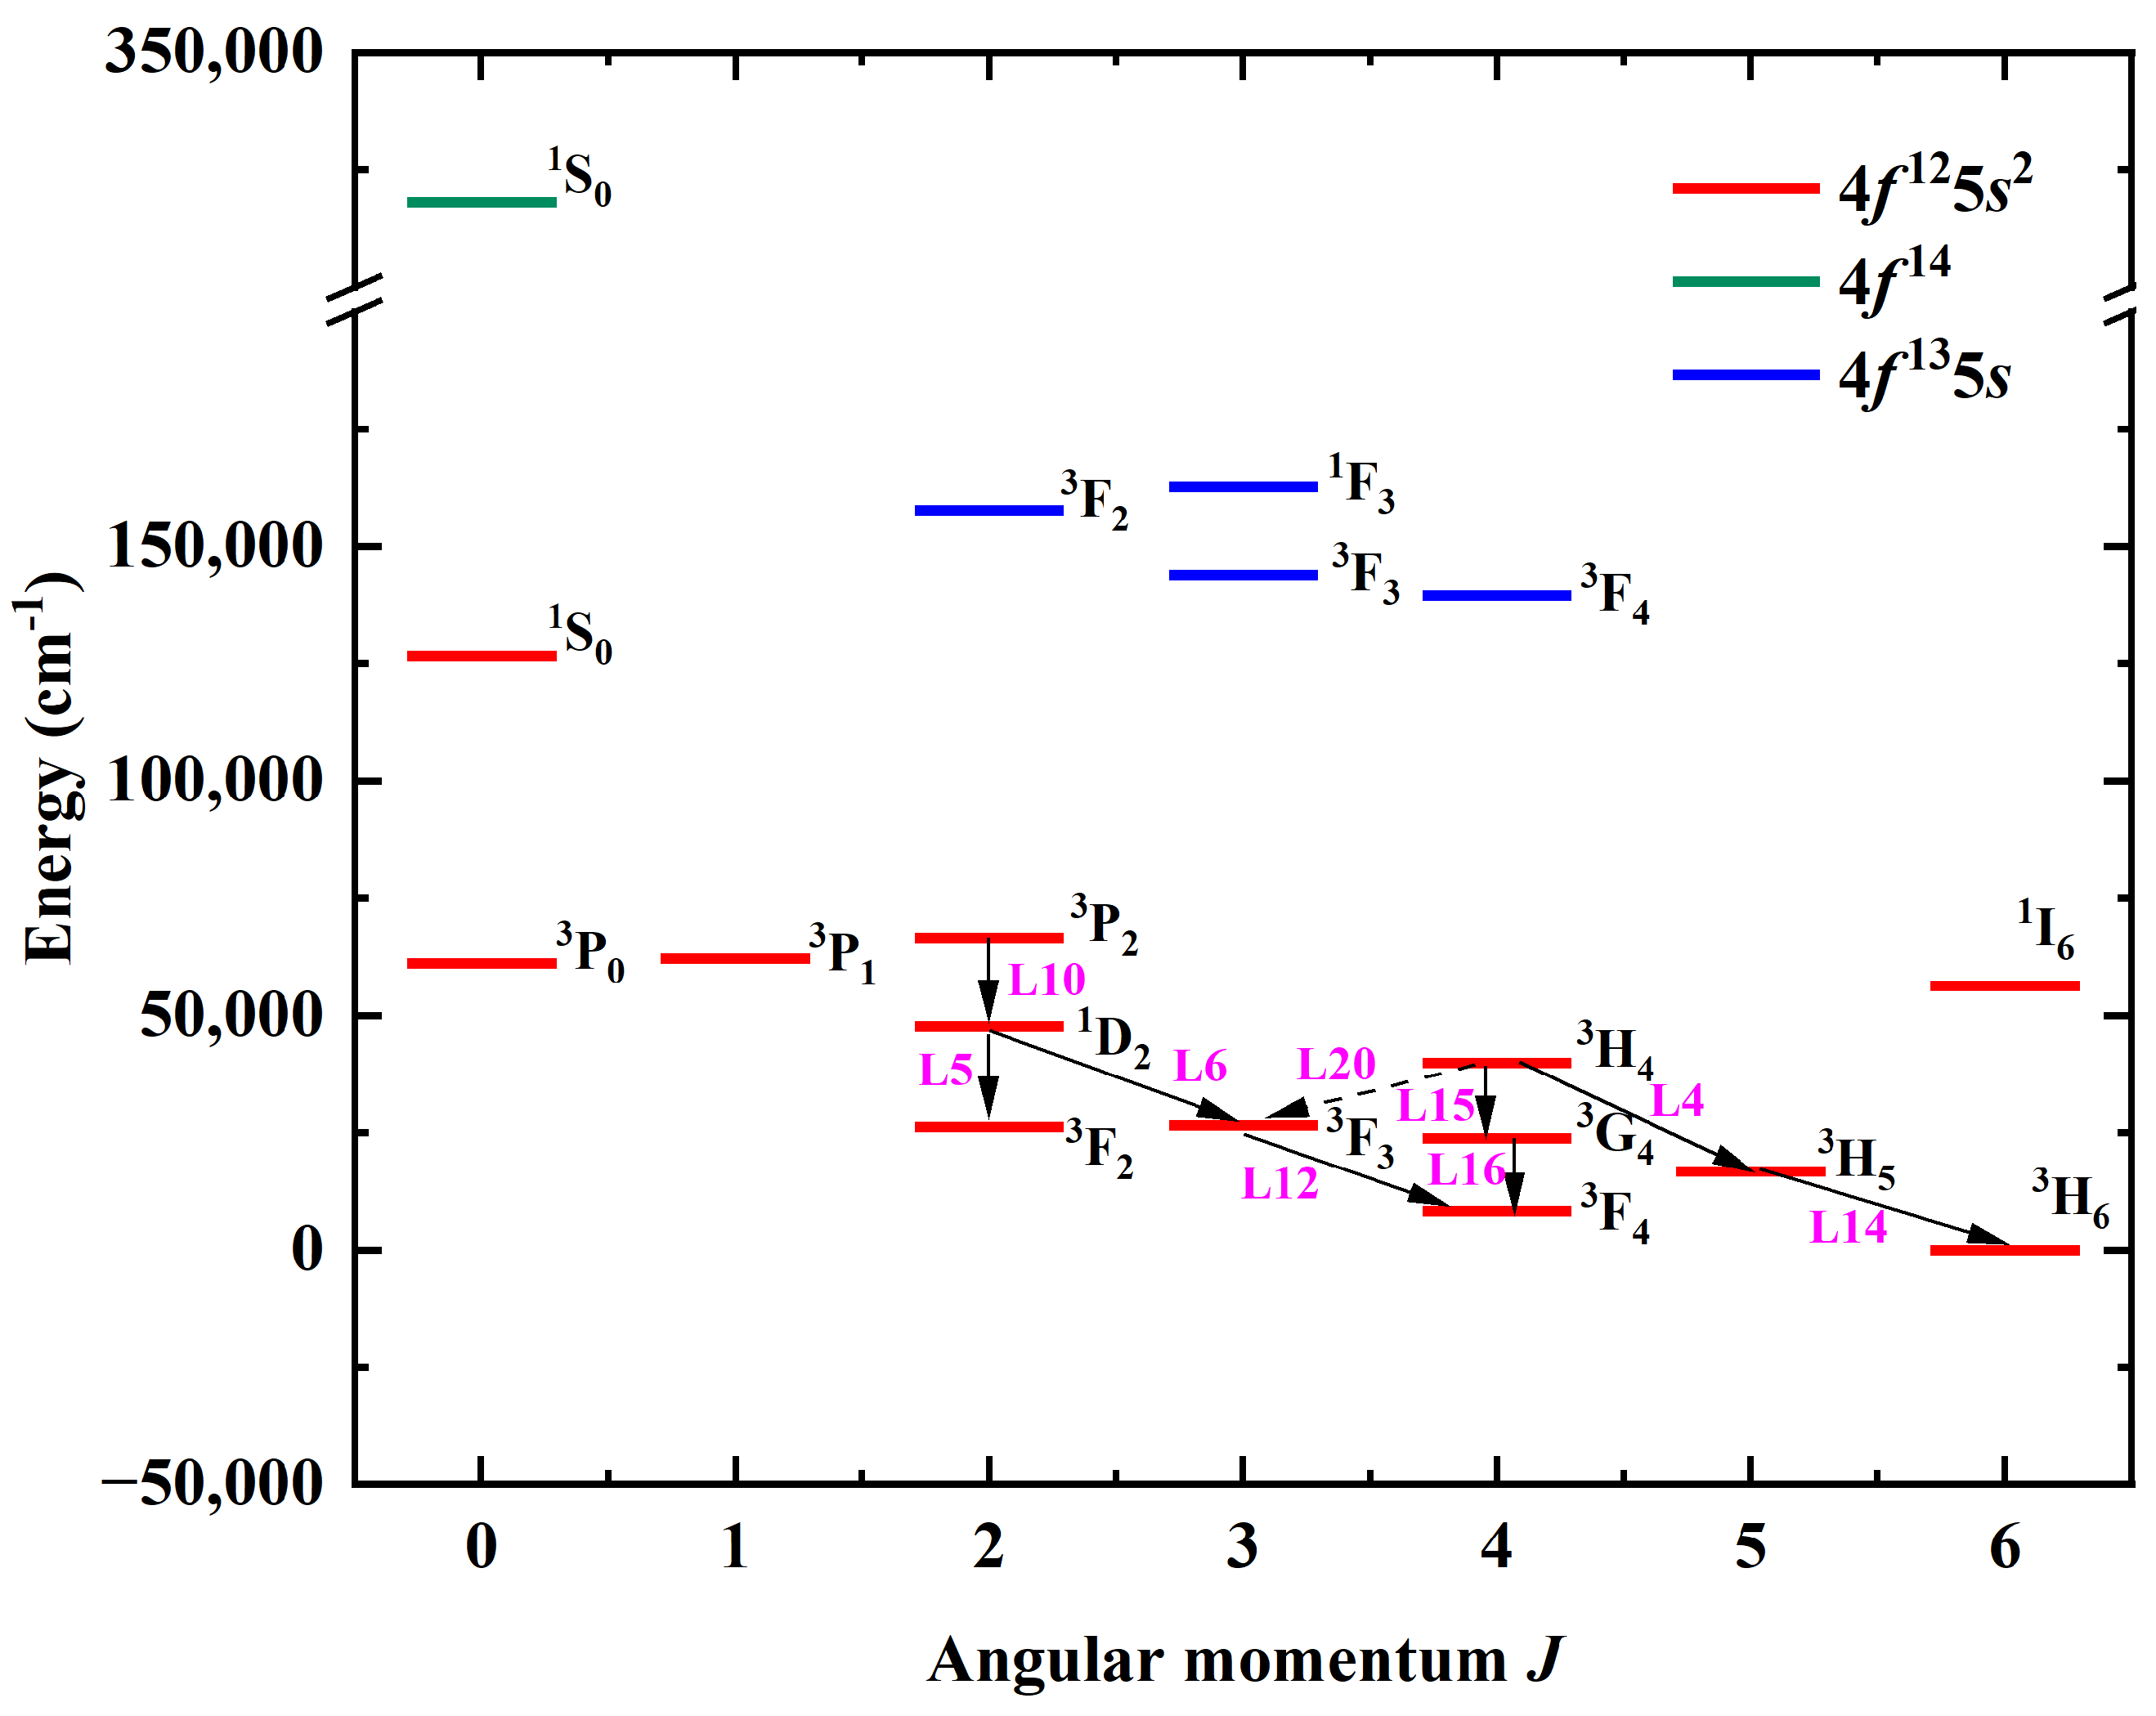
3. Calculation
4. Results and Discussion
5. Conclusions
Author Contributions
Funding
Data Availability Statement
Conflicts of Interest
References
- Hirai, T.; Carpentier-Chouchana, S.; Escourbiac, F.; Panayotis, S.; Durocher, A.; Ferrand, L.; Garcia-Martinez, M.; Gunn, J.; Komarov, V.; Merola, M.; et al. Design optimization of the ITER tungsten divertor vertical targets. Fusion Eng. Des. 2018, 127, 66–72. [Google Scholar] [CrossRef]
- Litaudon, X.; Abduallev, S.; Abhangi, M.; Abreu, P.; Afzal, M.; Aggarwal, K.M.; Ahlgren, T.; Ahn, J.H.; Aho-Mantila, L.; Aiba, N.; et al. Overview of the JET results in support to ITER. Nucl. Fusion 2017, 57, 102001. [Google Scholar] [CrossRef]
- Pitts, R.; Bonnin, X.; Escourbiac, F.; Frerichs, H.; Gunn, J.; Hirai, T.; Kukushkin, A.; Kaveeva, E.; Miller, M.; Moulton, D.; et al. Physics basis for the first ITER tungsten divertor. Nucl. Mater. Energy 2019, 20, 100696. [Google Scholar] [CrossRef]
- Hirai, T.; Panayotis, S.; Barabash, V.; Amzallag, C.; Escourbiac, F.; Durocher, A.; Merola, M.; Linke, J.; Loewenhoff, T.; Pintsuk, G.; et al. Use of tungsten material for the ITER divertor. Nucl. Mater. Energy 2016, 9, 616–622. [Google Scholar] [CrossRef]
- Neu, R.; Dux, R.; Kallenbach, A.; Pütterich, T.; Balden, M.; Fuchs, J.; Herrmann, A.; Maggi, C.; O’Mullane, M.; Pugno, R.; et al. Tungsten: An option for divertor and main chamber plasma facing components in future fusion devices. Nucl. Fusion 2005, 45, 209. [Google Scholar] [CrossRef]
- Xu, G.; Wang, L.; Yao, D.; Jia, G.; Sang, C.; Liu, X.; Chen, Y.; Si, H.; Yang, Z.; Guo, H.; et al. Physics design of new lower tungsten divertor for long-pulse high-power operations in EAST. Nucl. Fusion 2021, 61, 126070. [Google Scholar] [CrossRef]
- Meng, L.; Xu, J.; Liu, J.; Cao, L.; Wang, P.; Li, A.; Yu, L.; Xu, G.; Wang, L. Development of Langmuir probe array for the new lower tungsten divertor in EAST. Fusion Eng. Des. 2022, 175, 113011. [Google Scholar] [CrossRef]
- Kallenbach, A., for the ASDEX Upgrade Team; the EUROfusion MST1 Team. Overview of ASDEX Upgrade results. Nucl. Fusion 2017, 57, 102015. [Google Scholar] [CrossRef]
- Catarino, N.; Widdowson, A.; Baron-Wiechec, A.; Coad, J.P.; Heinola, K.; Rubel, M.; Barradas, N.P.; Alves, E.; Contributors, J. Deposition in the tungsten divertor during the 2011–2016 campaigns in JET with ITER-like wall. Phys. Scr. 2020, 2020, 014044. [Google Scholar] [CrossRef]
- Philipps, V. Plasma-wall interaction, a key issue on the way to a steady state burning fusion device. Phys. Scr. 2006, T123, 24–32. [Google Scholar] [CrossRef]
- Beiersdorfer, P.; Clementson, J.; Safronova, U.I. Tungsten data for current and future uses in fusion and plasma science. Atoms 2015, 3, 260–272. [Google Scholar] [CrossRef]
- Rzadkiewicz, J.; Yang, Y.; Kozioł, K.; O’Mullane, M.G.; Patel, A.; Xiao, J.; Yao, K.; Shen, Y.; Lu, D.; Hutton, R.; et al. High-resolution tungsten spectroscopy relevant to the diagnostic of high-temperature tokamak plasmas. Phys. Rev. A 2018, 97, 052501. [Google Scholar] [CrossRef]
- Kato, D.; Sakaue, H.A.; Murakami, I.; Goto, M.; Oishi, T.; Tamura, N.; Funaba, H.; Morita, S. Assessment of W density in LHD core plasmas using visible forbidden lines of highly charged W ions. Nucl. Fusion 2021, 61, 116008. [Google Scholar] [CrossRef]
- Fujii, K.; Takahashi, Y.; Nakai, Y.; Kato, D.; Goto, M.; Morita, S.; Hasuo, M.; Group, L.E. Visible emission spectroscopy of highly charged tungsten ions in LHD: II. Evaluation of tungsten ion temperature. Phys. Scr. 2015, 90, 125403. [Google Scholar] [CrossRef]
- Shinohara, M.; Fujii, K.; Kato, D.; Nakamura, N.; Goto, M.; Morita, S.; Hasuo, M.; Group, L.E. Visible emission spectroscopy of highly charged tungsten ions in LHD: I. Survey of new visible emission lines. Phys. Scr. 2015, 90, 125402. [Google Scholar] [CrossRef]
- Komatsu, A.; Sakoda, J.; Minoshima, M.; Sakaue, H.; Ding, X.; Kato, D.; Murakami, I.; Koike, F.; Nakamura, N. Visible Transitions in Highly Charged Tungsten Ions: 365–475 nm. Plasma Fusion Res. 2012, 7, 1201158. [Google Scholar] [CrossRef]
- Kobayashi, Y.; Kubota, K.; Omote, K.; Komatsu, A.; Sakoda, J.; Minoshima, M.; Kato, D.; Li, J.; Sakaue, H.A.; Murakami, I.; et al. Extreme ultraviolet and visible spectroscopy of promethiumlike heavy ions. Phys. Rev. A 2015, 92, 022510. [Google Scholar] [CrossRef]
- Windberger, A.; Crespo López-Urrutia, J.R.; Bekker, H.; Oreshkina, N.S.; Berengut, J.C.; Bock, V.; Borschevsky, A.; Dzuba, V.A.; Eliav, E.; Harman, Z.; et al. Identification of the Predicted 5s-4f Level Crossing Optical Lines with Applications to Metrology and Searches for the Variation of Fundamental Constants. Phys. Rev. Lett. 2015, 114, 150801. [Google Scholar] [CrossRef] [PubMed]
- He, Z.; Meng, J.; Li, Y.; Jia, F.; Khan, N.; Niu, B.; Huang, L.; Hu, Z.; Li, J.; Wang, J.; et al. Magnetic-dipole lines in Fe-like and Mn-like molybdenum ions. J. Quant. Spectrosc. Radiat. Transf. 2022, 288, 108276. [Google Scholar] [CrossRef]
- Li, Y.; Wang, Y.; Fan, J.; Si, R.; Li, J.; Zhang, M.; Huang, L.; Xiao, J.; Zou, Y.; Wei, B.; et al. Precise wavelength determination of the 4s24p 2P3/2-2P1/2 transition in Mo11+ and Ru13+ ions. J. Phys. B At. Mol. Opt. Phys. 2022, 54, 235001. [Google Scholar] [CrossRef]
- Wang, Y.; Li, Y.; Liu, J.; Jia, F.; Si, R.; Zhang, M.; Huang, L.; Tu, B.; Zou, Y.; Wei, B.; et al. Direct wavelength measurement of the 4p23P1-3P0 highly charged ion clock transition in Rh13+. J. Quant. Spectrosc. Radiat. Transf. 2022, 293, 108370. [Google Scholar] [CrossRef]
- Niu, B.; Li, Y.; Xiong, G.; Chen, J.; Hu, Z.; Fu, Y.; Zou, Y.; Chen, C.; Yao, K. The magnetic dipole transition in Rb-like ion and its core-valence correlation effect. J. Quant. Spectrosc. Radiat. Transf. 2024, 312, 108812. [Google Scholar] [CrossRef]
- Gu, M.F. Indirect X-Ray Line-Formation Processes in Iron L-Shell Ions. Astrophys. J. 2003, 582, 1241. [Google Scholar] [CrossRef]
- Lu, Q.; He, J.; Tian, H.; Li, M.; Yang, Y.; Yao, K.; Chen, C.; Xiao, J.; Li, J.G.; Tu, B.; et al. Observation of indirect ionization of W7+ in an electron-beam ion-trap plasma. Phys. Rev. A 2019, 99, 042510. [Google Scholar] [CrossRef]
- Mita, M.; Sakaue, H.A.; Kato, D.; Murakami, I.; Nakamura, N. Extreme ultraviolet spectra of multiply charged tungsten ions. J. Phys. Conf. Ser. 2017, 875, 012019. [Google Scholar] [CrossRef]
- Li, Y.; et al. Institute of Modern Physics, Fudan University, Shanghai, China, 2025, manuscript in preparation.
- Kramida, A.; Ralchenko, Y.; Reader, J.; NIST ASD Team. NIST Atomic Spectra Database (Version 5.12). 2024. Available online: https://physics.nist.gov/asd (accessed on 1 January 2024.).
- Arthanayaka, T.; Beiersdorfer, P.; Brown, G.; Hahn, M.; Hell, N.; Lockard, T.; Savin, D.W. Measurements of the effective electron density in an electron beam ion trap using extreme ultraviolet spectra and optical imaging. Rev. Sci. Instrum. 2018, 89, 10E119. [Google Scholar] [CrossRef] [PubMed]
- Arthanayaka, T.; Beiersdorfer, P.; Brown, G.V.; Gu, M.F.; Hahn, M.; Hell, N.; Lockard, T.; Savin, D.W. Laboratory calibrations of Fe XII–XIV line-intensity ratios for electron density diagnostics. Astrophys. J. 2020, 890, 77. [Google Scholar] [CrossRef]
- Jönsson, P.; Godefroid, M.; Gaigalas, G.; Ekman, J.; Grumer, J.; Li, W.; Li, J.; Brage, T.; Grant, I.P.; Bieroń, J.; et al. An Introduction to Relativistic Theory as Implemented in GRASP. Atoms 2023, 11, 7. [Google Scholar] [CrossRef]
- Peck, E.R.; Reeder, K. Dispersion of Air*. J. Opt. Soc. Am. 1972, 62, 958–962. [Google Scholar] [CrossRef]


| Ground Configuration | |
|---|---|
| Single excitation | |
| Double excitations | |
| Triple excitations | |
| No. | [17] | [18] | I [18] | [26] | Transition | ||
|---|---|---|---|---|---|---|---|
| L1 | 392.36 | 0.023 | |||||
| L2 | 396.12 | 0.036 | |||||
| L3 | 409.43 | 0.047 | |||||
| L4 | 431.75 | 431.68 | 0.659 | 431.74(3) | 431.86(3) | 432.25 | 4 → |
| L5 | 462.59 | 462.52 | 0.178 | 462.56(2) | 462.69(2) | 465.55 | 4 → |
| L6 | 486.57 | 486.55 | 0.312 | 486.59(3) | 486.72(3) | 474.91 | 4 → |
| L7 | 506.40 | 506.27 | 0.040 | ||||
| L8 | 508.39 | 508.27 | 0.061 | 508.34(3) | 508.49(3) | ||
| L9 | 517.74 | 517.64 | 0.100 | 517.78(2) | 517.92(2) | ||
| L10 | 527.70 | 527.59 | 0.136 | 527.61(2) | 527.76(2) | 529.00 | 4 → |
| L11 | 546.22 | 546.12 | 0.178 | 546.12(2) | 546.27(2) | ||
| L12 | 549.93 | 549.86 | 0.710 | 549.94(2) | 550.09(2) | 546.81 | 4 → |
| L13 | 583.23 | 583.22 | 0.107 | 583.22(3) | 583.38(3) | ||
| L14 | 595.70 | 595.71 | 1.000 | 595.69(2) | 595.86(2) | 597.30 | 4 → |
| L15 | 620.61 | 0.164 | 620.60(2) | 620.77(2) | 624.72 | 4 → | |
| L16 | 638.63 | 0.283 | 638.65(2) | 638.83(2) | 643.32 | 4 → | |
| L17 | 686.64 | 0.047 | |||||
| L18 | 691.76 | 0.011 | |||||
| L19 | 717.97 | 0.004 | |||||
| L20 | 735.96 | 0.004 | 4 → |
| Ar II | Ar II | Ar II | Ar II | Ar II | Ar II |
| 427.752786(6) | 460.956692(7) | 465.79009(7) | 496.507942(8) | 501.716264(8) | 514.178260(8) |
| Ne I | Ne I | Ne I | Ne I | Ne I | Ne I |
| 534.10932(4) | 540.05618(4) | 585.24879(5) | 594.48342(5) | 614.30626(5) | 633.44278(6) |
Disclaimer/Publisher’s Note: The statements, opinions and data contained in all publications are solely those of the individual author(s) and contributor(s) and not of MDPI and/or the editor(s). MDPI and/or the editor(s) disclaim responsibility for any injury to people or property resulting from any ideas, methods, instructions or products referred to in the content. |
© 2025 by the authors. Licensee MDPI, Basel, Switzerland. This article is an open access article distributed under the terms and conditions of the Creative Commons Attribution (CC BY) license (https://creativecommons.org/licenses/by/4.0/).
Share and Cite
Niu, B.; Chen, Z.; Chen, J.; Li, Y.; Jia, F.; Li, B.; He, Z.; Xiao, J.; Zou, Y.; Yao, K. Visible Light Spectroscopy of W14+ Ions in an Electron Beam Ion Trap. Atoms 2025, 13, 17. https://doi.org/10.3390/atoms13020017
Niu B, Chen Z, Chen J, Li Y, Jia F, Li B, He Z, Xiao J, Zou Y, Yao K. Visible Light Spectroscopy of W14+ Ions in an Electron Beam Ion Trap. Atoms. 2025; 13(2):17. https://doi.org/10.3390/atoms13020017
Chicago/Turabian StyleNiu, Ben, Zhaoying Chen, Jihui Chen, Yanting Li, Fangshi Jia, Bingli Li, Zhencen He, Jun Xiao, Yaming Zou, and Ke Yao. 2025. "Visible Light Spectroscopy of W14+ Ions in an Electron Beam Ion Trap" Atoms 13, no. 2: 17. https://doi.org/10.3390/atoms13020017
APA StyleNiu, B., Chen, Z., Chen, J., Li, Y., Jia, F., Li, B., He, Z., Xiao, J., Zou, Y., & Yao, K. (2025). Visible Light Spectroscopy of W14+ Ions in an Electron Beam Ion Trap. Atoms, 13(2), 17. https://doi.org/10.3390/atoms13020017