Article

Relativistic Atomic Structure Calculations for the Study of Electron Dynamics of Sr+ Ion Confined Inside Fullerene

Department of Physics, Indian Institute of Technology Patna, Patna 801103, India
*
Author to whom correspondence should be addressed.
Atoms 2025, 13(4), 36; https://doi.org/10.3390/atoms13040036
Submission received: 19 February 2025 / Revised: 7 April 2025 / Accepted: 16 April 2025 / Published: 18 April 2025

Abstract

:
This article presents the maiden investigation of the electronic structural properties of the Sr+ ion confined inside fullerene. The Dirac equations are solved to calculate the energy levels, probability distributions, etc. for various confinement depths of the Gaussian Annular Square Well (GASW) potential using the Multi-Configuration Dirac Hartree–Fock (MCDHF) formalism. The wavelengths, transition probabilities, and oscillator strengths are reported for the 5 S 1 / 2 5 P 1 / 2 ( D 1 line) and 5 S 1 / 2 5 P 3 / 2 ( D 2 line) transitions of the encapsulated ion. We also estimate variations in the line intensity ratio, electron density, Coulomb coupling parameter, etc. A suggested direction for the calculation of electron impact ionization cross-section using the binary-encounter Bethe (BEB) model with the present data is also given.

1. Introduction

Fullerene cages find application in a wide range of disciplines for various purposes [1]. The structure and dynamics of a confined system have been a major focus in modern research since the discovery of C60 by Kroto et al. [2], due to the favorable modifications of the intrinsic properties of an isolated atom or ion. The prime reason for using C60 is because of its ability to act as a cage and to encapsulate an atom or ion. Confining the ion inside C60 effectively isolates the ion from interacting with the surroundings [3]. The structural characteristics such as energy levels and transition properties of the encapsulated ion inside the fullerene can be modified by selecting different fullerenes or altering the charge states of the fullerene. Needless to say, the electronic dynamics of the confined ion are also affected due to the variation in the potential of the fullerene cage. Engineered ionic systems will find many exciting applications in plasma physics, medical research, astrophysics, etc. [4].
The reason behind choosing Sr+ ion in the present study is that the emission lines of this ion have been observed in a wide variety of laboratory and astrophysical plasmas. This is the fifteenth most abundant element on Earth and is commonly found in different kinds of stars, including the neutron stars [5] and halo stars [6]. The resonance lines of this ion and its four other emission lines have been recognized as extremely important for deriving precise strontium abundance in numerous astrophysical objects [7,8]. As described by Simien et al. [9], optical absorption imaging and spectroscopy, using the Sr+ in a strontium plasma, offer numerous new possibilities. Resonant transfer (RT) plasmas are predicted to occur from discharges containing one or more strontium species associated with hydrogen, since strontium ionizes at an integer multiple of the potential energy of atomic hydrogen. Apart from the Sr+, C60 is identified as another molecule abundantly present in interstellar space [10]. The fullerene molecule is efficiently formed in the tenuous and cold environment of interstellar clouds under intense ultraviolet (UV) radiation fields [11]. The abundance of Sr+ and C60 hints at the formation of endohedral Sr+ ions. Therefore, a detailed knowledge of the atomic structural properties, particularly transition data with plasma parameters, of Sr+ ions confined inside fullerene is required.
The investigation of a confined system is indeed challenging, both experimentally and theoretically. In an experiment, the complex manufacturing process of the confined system makes the characterization rather difficult, and in theory, the multi-electronic correlated nature of the confinement poses severe complexities. Nevertheless, a few attempts have been made to investigate the electronic structure with encapsulated ions. Recently, atomic structure calculations of sodium atoms confined in a fullerene cage for electromagnetically induced transparency (EIT) applications have been reported by Ahmad et al. [12]. An experiment with Li+ ion confined in C60 was performed by Shen et al. [13] for the creation of a conductive metal-fullerene-bonded framework. Aoyagi et al. [14] experimentally studied the X-ray diffraction pattern of C60 with Li+ inside, and analyzed the polarization, dispersion, and electrostatic interactions. Ab initio electronic structure calculations on various encapsulated atoms and ions were carried out by Cioslowski and Fleischmann [15] using the restricted Hartree–Fock (RHF) method. Their study included the confinement of Na+, Mg2+, and F ions, and an Ne atom inside a C60 cage. Ravinder and Subramanian [16] conducted a theoretical investigation to understand the stability of several anions inside different fullerenes using Born–Oppenheimer molecular dynamics and density functional theory. Although there have been a few theoretical investigations on different ions within fullerenes, no works have been reported that investigated the structural and spectroscopic properties of a confined Sr+ ion inside fullerene.
To bridge the gap in understanding the electron dynamics of confined ions, the present work aims to characterize a Sr+ ion confined inside C60. In particular, we report transition energies, wavelengths, oscillator strength, and transition probabilities for 5 S 1 / 2 5 P 1 / 2 and 5 S 1 / 2 5 P 3 / 2 transitions of the encapsulated Sr+ ion, using the Multi-Configuration Dirac Hartree–Fock (MCDHF) method. From these atomic data, we also estimated the line intensity ratio, electron density, plasma frequency, skin depth, and Coulomb coupling parameter for confinement depths of 0, 0.259, 0.28, and 0.30 au. We also include an interpretation for calculating the ionization cross-section from electron impact using the present data. In Section 2, we briefly describe the theoretical methodology and computational details. Section 3 presents the results and discussions of the data reported here. Finally, Section 4 summarizes and concludes this work.

2. Theoretical Methodology and Computational Details

MCDHF formalism has been successfully applied in the last few decades to compute atomic structure calculations of various kinds and complexity [17]. Here, we make use of this formalism to calculate the energy levels, probability distributions, etc. of encapsulated ions for different confinement depths. In practice, the MCDHF formalism enables the inclusion of correlations in the initial state by selectively choosing various N-electronic state functions, whose linear combination can represent the correlated initial state. To perceive the effect of fullerene on the encapsulated ions, we used the Gaussian Annular Square Well (GASW) model [18,19] to simulate the former. Both the MCDHF formalism and GASW model are briefly explained in the following subsections.

2.1. MCDHF Formalism

In the relativistic theory of confined atoms or ions, two crucial points to consider are (i) the choice of the many-electron Hamiltonian, and (ii) the representation of the atomic states. The N-electron central field Dirac–Coulomb Hamiltonian [20,21] is given as
H ( r 1 , r 2 , , r N ) = i = 1 N h ( r i ) + 1 2 i , j = 1 i j N g ( r i j ) .
The first and second terms on the right-hand side in Equation (1) represent the one-particle and two-particle operators [20,21]. The modified electronic Hamiltonian for an ion confined inside C60 is expressed as H = H + V c o n , where V c o n is an appropriate confinement potential. The sum of the operators for one and two particles can be used to describe the total Hamiltonian of the ion encapsulated in C60 as
H = i = 1 N h ( r i ) + 1 2 i , j = 1 i j N g ( r i j ) .
Here, h ( r ) = h ( r ) + V c o n ( r ) . The V c o n , used in h ( r ) in Equation (2), is an effective, attractive potential due to the presence of carbon atoms at the fullerene cage. The Dirac orbital wavefunction for a single electron in a subshell with an eigenenergy ϵ a is given by [20,21,22]
ϕ a ( r ) = 1 r i P a ( r ) Ω κ a m a ( θ ) Q a ( r ) Ω κ a m a ( θ ) .
Here, κ = ± ( j + 1 / 2 ) signifies the relativistic angular quantum number and m represents its z-component. P a ( r ) and Q a ( r ) are the large and small components of the one-electron radial wavefunctions. Ω ( θ ) s are the two-component spherical spinors which are formed by the coupling of the spherical harmonics and the two-component spin functions.
A ( N × N ) Slater determinant, which is also known as the Configuration State Function (CSF), can be used to formulate the wavefunction of the N-electron Hamiltonian, represented by [22]
Φ a b . n ( r 1 , r 2 , r N ) = 1 N ! ϕ a ( r 1 ) ϕ b ( r 1 ) ϕ n ( r 1 ) ϕ a ( r 2 ) ϕ b ( r 2 ) ϕ n ( r 2 ) . . . ϕ a ( r N ) ϕ b ( r N ) ϕ n ( r N ) .
The Dirac Hartree–Fock (DHF) equations are deduced utilizing the variational method and can be solved self-consistently to obtain the total energy as
E a b n = a a | h | a + 1 2 a b ( g a b a b g a b b a ) .
The first and second terms in Equation (5) stand for, respectively, the one- and two-electron integrals. The term g a b a b is due to the direct interaction, whereas g a b b a arises because of the exchange interaction. The matrix elements and the Dirac orbitals for the one- and two-electron terms are self-consistently obtained.
In DHF approximation, the dynamic correlation of the electrons is neglected, except for the exchange correlation. Therefore, one can surpass the DHF by considering a multi-configurational initial state. The MCDHF formalism incorporates the correlation effects of the initial states by treating the N-electron wavefunction as a linear combination of Slater determinants. The relativistic Atomic State Function (ASF), Ψ , for a state labeled as γ J M J P can be expressed as a sum of symmetry-adapted configuration-state functions (CSF) [20]:
| Ψ ( γ J M J P ) = r c r | Φ ( γ r J M J P ) .
Here, J, M J , P, and c r are the total angular momentum quantum number, total magnetic quantum number, inversion operator, and mixing coefficients of a particular configuration state. The labels γ and γ r denote other appropriate information, such as the states’ orbital occupancy and coupling scheme.

2.2. GASW Model

While considering a realistic nature of the confining potential, a method that explicitly includes the position of each C atom of the C60 with the correct icosahedral ( I h ) symmetry would be the ideal choice. However, practically, the C60 ‘cage’ is more or less penetrable at different locations of the surface, and hence the spherically averaged model potential used here is an added approximation, for a less complicated computation. Therefore, it is possible to replace the ‘all electrons’ concept with a model where only electrons of the guest atom or ion are considered, being influenced by the attractive spherical potential of the C60 cage. This technique has been used before to explain experimental results [23]. Moreover, the most popular model for simulating the endohedral fullerenes is the Annular Square Well (ASW) potential, which is a sharp-edged spherical, short-range, and attractive shell potential of mean radius r c , depth U, and thickness Δ , given as [24]
V A S W ( r ) = U for r c Δ 2 r r c + Δ 2 , 0 otherwise .
The ASW model’s sudden jumps at the shell edges, however, do not accurately reflect fullerene’s behavior. A variety of alternative model potentials, such as the δ -potential [25], the combination of Woods–Saxon (W-S) potentials ing [26], the Lorentz function model [27], the potential derived from DFT calculations [28,29], the power exponential model [30], the Gaussian model [18], the Gaussian Annular Square Well (GASW) potential [19], and others, have been proposed due to the unphysical hard boundaries of the ASW model. In contrast, the GASW is a parametrically adjustable superposition of the ASW and a Gaussian function. The primary benefit of employing the GASW is its compact borders and spatial smearing. Moreover, GASW models, within the local density approximation (LDA) of the density functional theory (DFT), simulate the jellium-like environment of the C60, as suggested by Puska and Nieminen [28]. Furthermore, they do not depict the implausible discontinuity at the shell edges. Recent articles on the calculations of electron scattering and photoionization [19,31] have demonstrated the superiority of the GASW over ASW. Hence, the GASW potential can be expressed as
V G A S W ( r ) = A 2 π σ e ( r r c 2 σ ) 2 + V A S W ( r ) .
In Equation (8), the parameters can be calculated by the trial and error method, ensuring that the C60 shell’s width and depth accurately predict the observable results, such as the electron affinity of the C60, photoionization cross-section, etc.
For the particular values of A = 3.59 au, Δ = 2.8 au, r c = 6.7 au, and the standard deviation σ = 1.70 au, calculations of the GASW model demonstrate a strong concordance with the results from the work of Puska and Nieminen employing the DFT potential [28]. The realistic character of the fullerene environment in the jellium-like model requires maintaining the ratio of Gaussian amplitude (A) to ASW depth (U) as 1.2:1 [31,32].
In the present analysis, the strength of the GASW is defined as the value of the potential at the center of the shell ( r = r c ), which can be expressed as
U 0 = V G A S W ( r = r c ) = A 2 π σ U .
To incorporate the effect of transient distortion on the encapsulated ion due to the presence of C60, we performed a second level of calculation, including the polarization potential with the total confinement potential given in Equation (10). In previous works [33,34], the polarization potential of the C60 cage was included to obtain a realistic picture. This long-range polarization potential of C60 is approximated using a static dipole polarization potential as [35]:
V p o l ( r ) = α C 60 2 ( r 2 + b 2 ) 2 .
Here, α is the static dipole polarizability of C60 and b is known as the cutoff parameter that stays within the order of the radius of the fullerene cage [36].
The effective potential for the valence electron with l = 0 of the confined ion is shown in Figure 1a, and a plot of the GASW and polarization potential with U 0 = 0.259 au is shown in Figure 1b. From Figure 1a, it can be observed that the influence of the fullerene environment introduces a dip in the electrostatic potential of the confined ion, which is further enhanced with the inclusion of the polarization effect. In Figure 1b, we can notice that the polarization of C60 significantly increased the minima in the GASW potential. This GASW potential has an advantage over ASW in mimicking confined systems, due to diffused shell boundaries with a Gaussian-shaped well.
The GASW model potential was added with the Dirac Hamiltonian in the GRASP2018 package with appropriate modifications. The wavefunctions and their derivatives at the confinement shell boundaries (at r = r c Δ 2 and r = r c + Δ 2 ) were carefully matched; these act as appropriate boundary conditions once the confinement potential has been added. The one- and two-electron integrals stated in Equation (5) use the altered wavefunction, since the MCDHF equations can be solved self-consistently employing the modified Dirac Hamiltonian.
The energy levels and other atomic properties of the encapsulated Sr+ were calculated employing a combination of the GASW model and the MCDHF formalism, which allowed us to further calculate various parameters to understand electron dynamics, which is also useful in plasma diagnostic applications. The levels of interest involved pertain to the stimulation of a single valence electron alone from the ion’s outermost orbital [37,38]. At increasing confinement depths of the fullerene cage, convergence becomes extremely difficult, since the number of CSFs increases quickly with higher principal quantum numbers. Therefore, electronic configurations of the confined ion are formed, which only include the valence-valence (VV) correlation effects.
We considered the configurations of the Sr+ as X n l with n = 4 , 5 , 6 , where X represents the configuration of core orbitals ( 1 s 2 2 s 2 2 p 6 3 s 2 3 p 6 3 d 10 4 s 2 4 p 6 ). The reference configuration that we used is the ground state ( X 5 s 1 ) of this ion. A single electron was excited from the valence ( 5 s ) to the excited orbitals ( 4 d and 5 p ) to produce the excited states successively. Table 1 presents the twelve relativistic states that were taken into consideration. These states were categorized based on their parity, and using the modified ‘GRASP2018’ package [39], independent calculations were carried out for the even and odd parities in the optimal level (OL) scheme. Initially, when calculating the convergence of the additional orbitals, the core orbitals were held frozen. We then re-optimized both the core orbitals and the extended configurations. The same process was repeated until all orbitals included in the MCDHF calculations had converged. For the configurations listed in Table 1, we carried out four sets of computations at increasing confining well depths U 0 = 0 , 0.259 , 0.28 , 0.30 au. Here, U 0 = 0 and 0.259 au represent the bare Sr+ and the ion engaged in the neutral C60 molecule [24], respectively. During the calculations, we carefully re-optimized all the electronic orbitals, including the core orbitals, for every confining well depth. In the present study, we also included QED and Breit interactions by carrying out Relativistic Configuration Interaction (RCI) calculations.
After computing the orbitals and the level energy values, the transition probability, A α β from a state α ( | γ J M J ) to an arbitrary state β ( | γ J M J ) with a lower energy value than α , was calculated using the following equation [20,40]:
A α β = 2 ω c 1 ( 2 L + 1 ) ( 2 J + 1 ) | γ J | | Q ( κ ) | | γ J | 2 .
Similarly, the strength of the transition can be expressed in terms of a dimensionless oscillator strength as [41]:
f = 1 ω | γ J | | Q ( κ ) | | γ J | 2 ( 2 L + 1 ) .
Here, ω is the angular frequency of the transition and Q ( κ ) = i = 1 N q ( i ) ( κ ) describes the possible electric and magnetic multipole transition operators of rank κ . In the current work, we took into consideration the value of i up to 2 in Equation (11), which incorporates the dipole and quadrupole electric and magnetic transitions. For the calculations of transition parameters, we employed the biorthogonal transformation [42] of the ASFs.

3. Results and Discussion

In this article, comprehensive calculations of the atomic energy levels and probability distributions of radial wavefunctions for Sr+ ion inside fullerene are reported. In addition, we also estimated the line intensity ratio (R), electron density ( n e ), plasma frequency ( ω e ), skin depth ( δ ), and Coulomb coupling parameter ( Γ ) from the present transition data. The relationship between these parameters and the atomic transition data was given in earlier studies [43,44,45]. The energy levels and probability distributions are displayed in Figure 2, Figure 3 and Figure 4, the variations in different plasma parameters are shown graphically in Figure 5, Figure 6 and Figure 7, and the results are presented numerically in Table 2, Table 3, Table 4 and Table 5.

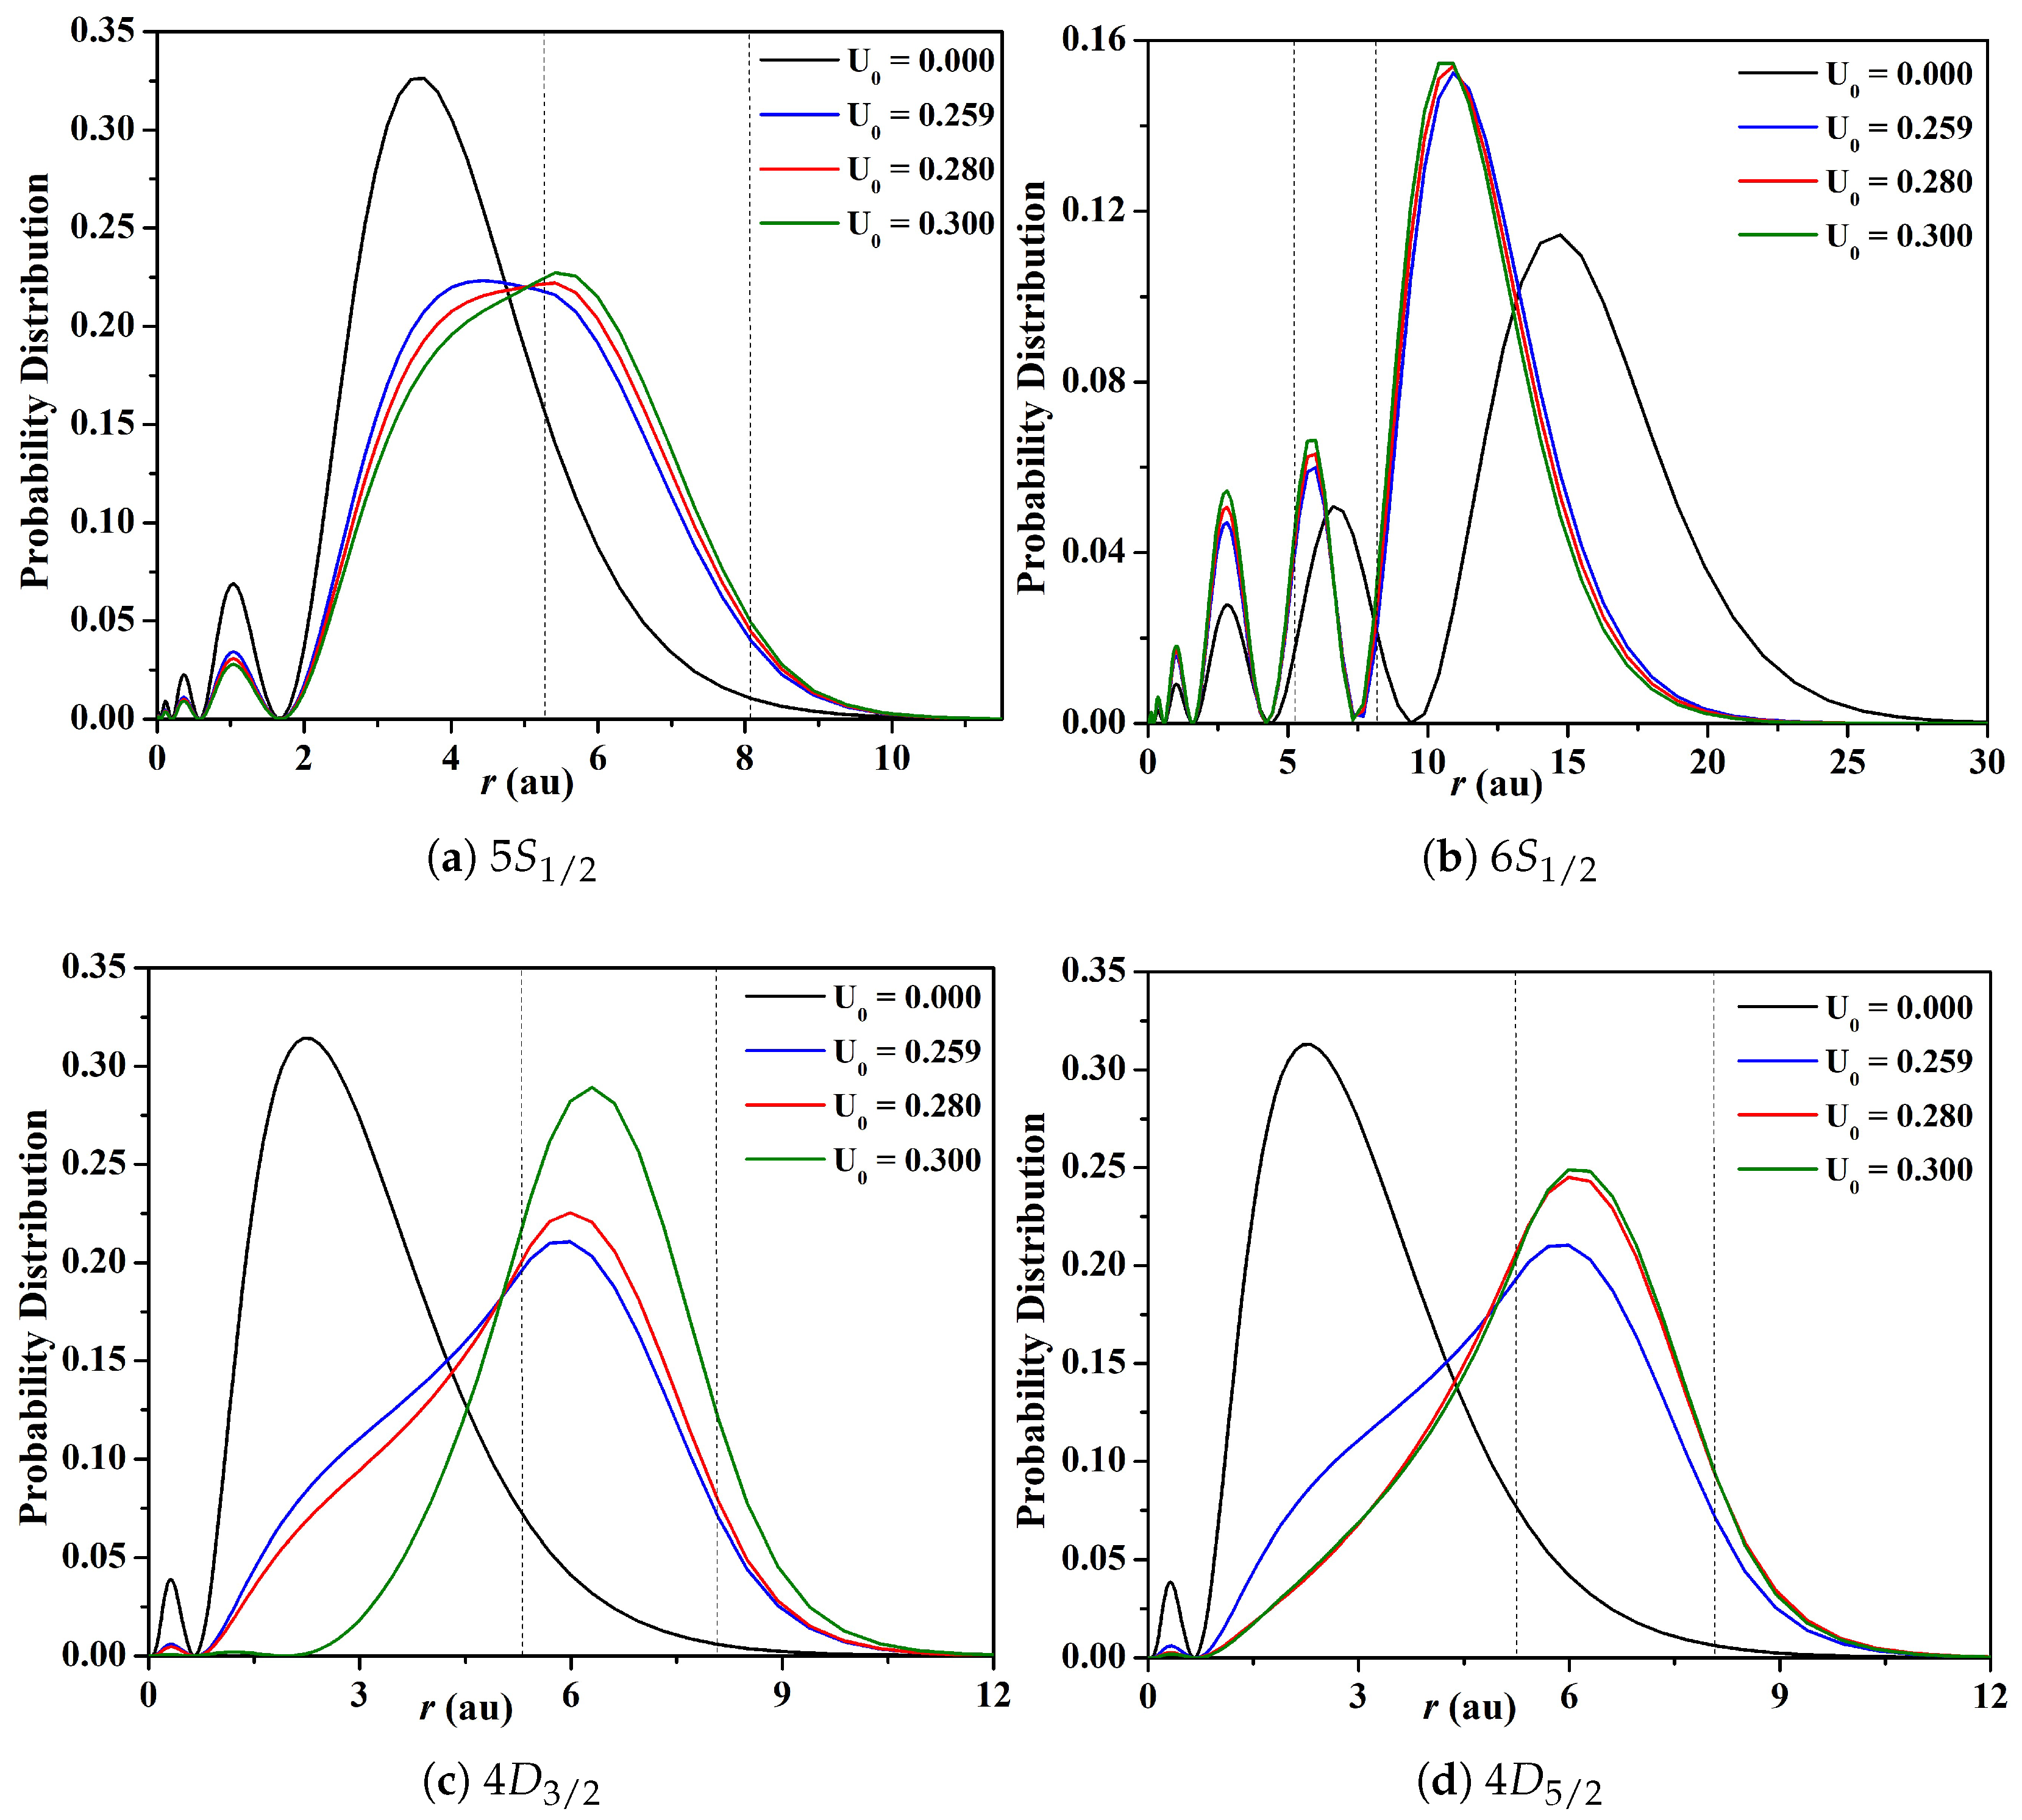
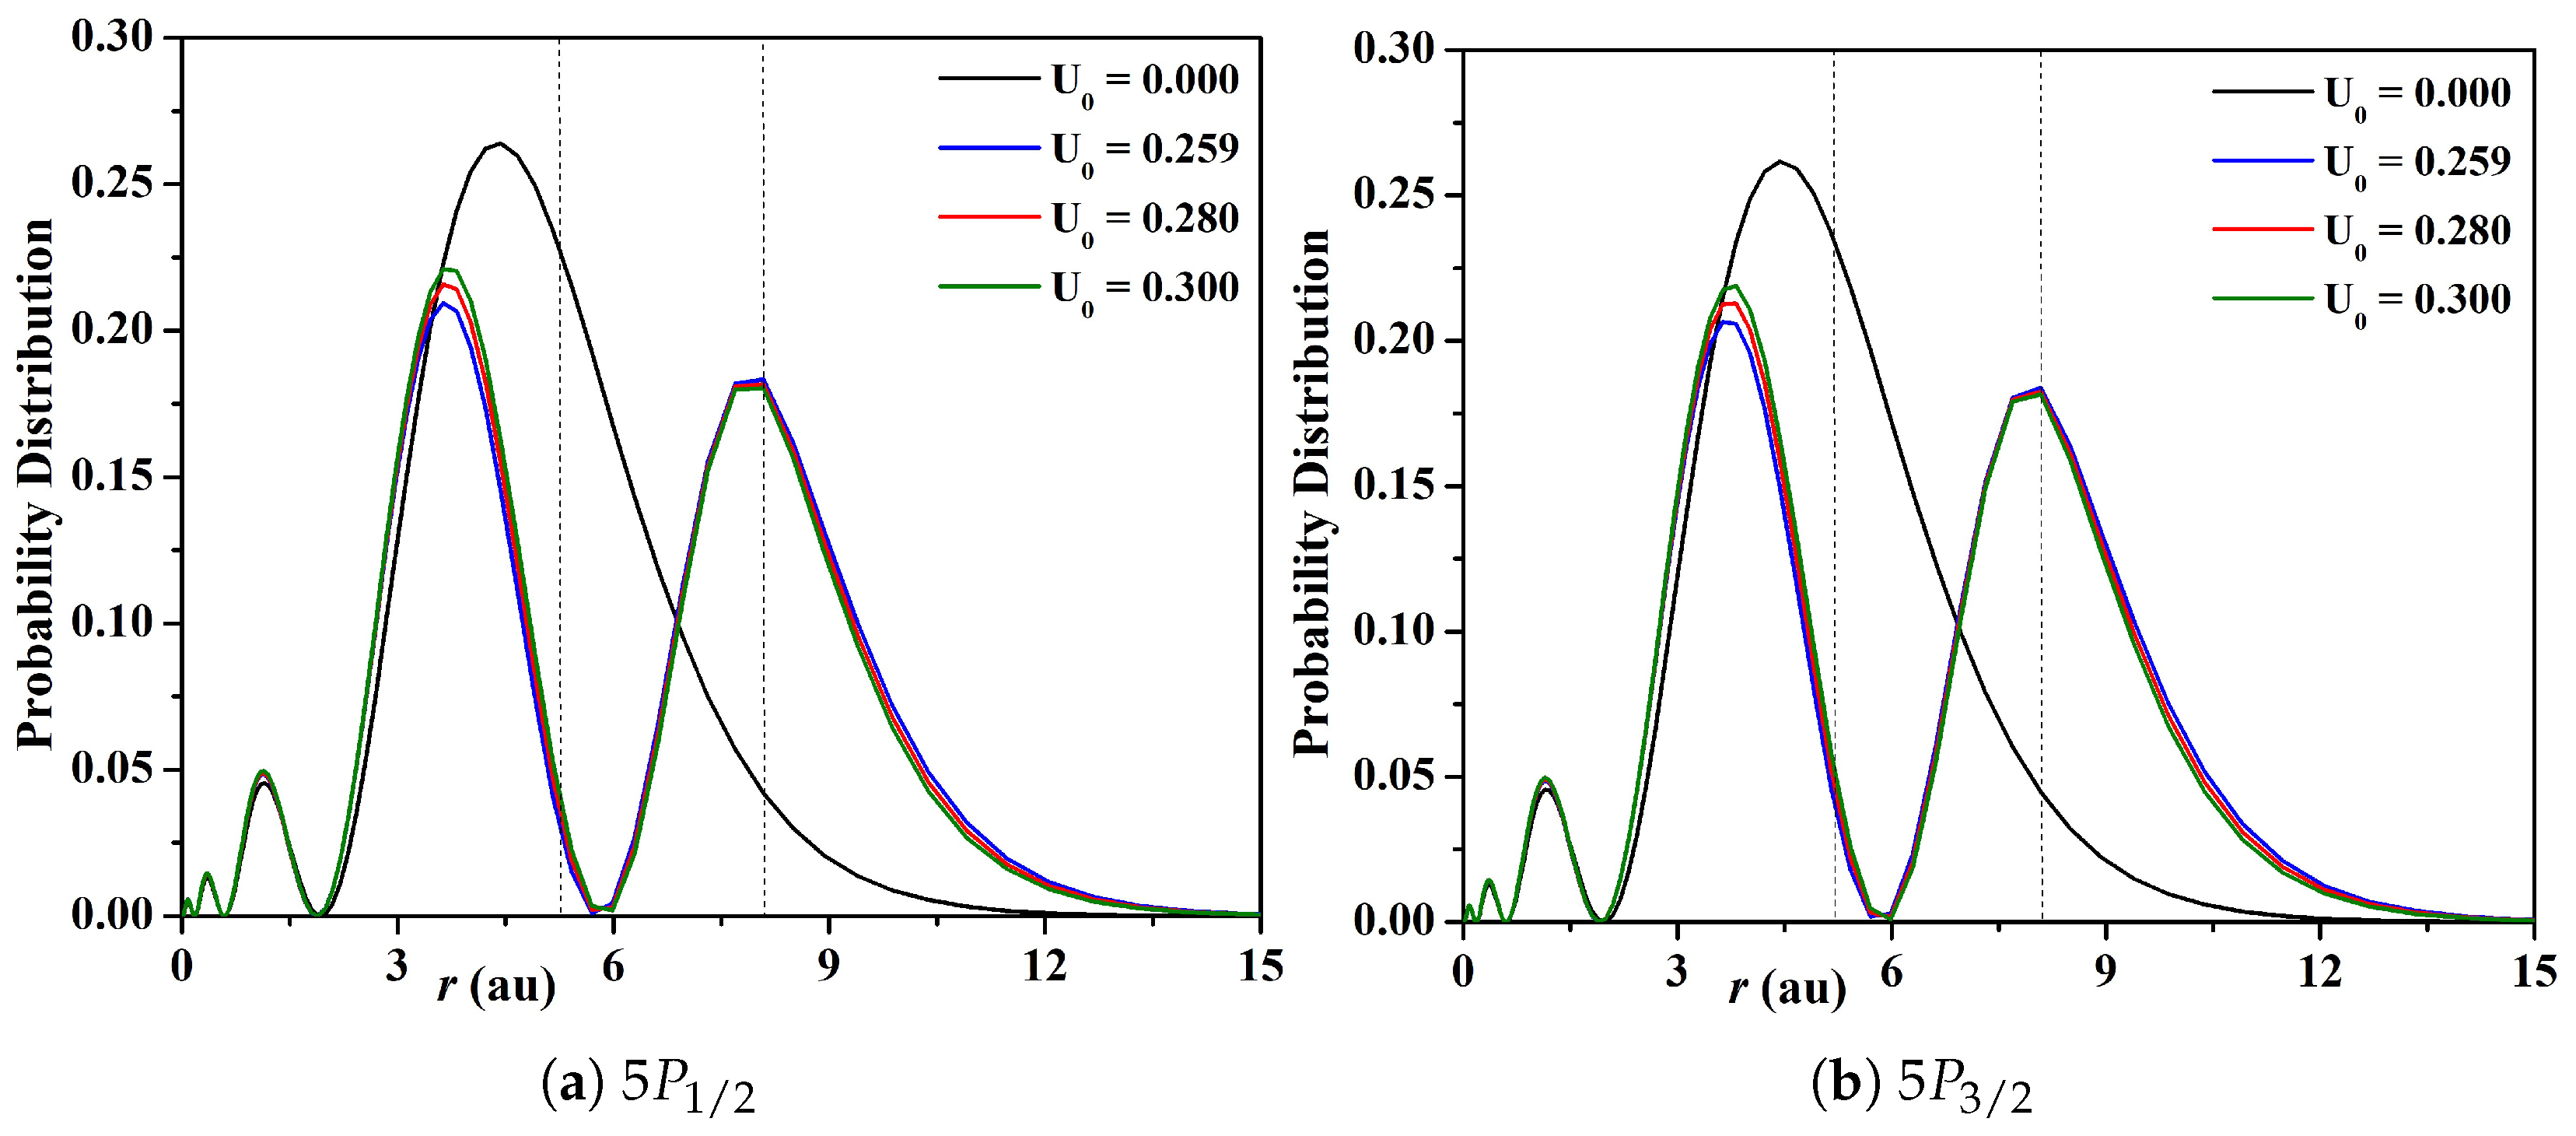
3.1. Energy Levels, Probability Distributions, and Transition Data

In this study, we noted that the energies of the core orbitals ( 1 s , 2 s , 2 p , 3 s , 3 p , 3 d , 4 s , and 4 p ) were nearly constant across the entire range of U 0 , as given in Table 2. The energy difference for a variation of U 0 from 0 to 0.30 au was ⩽0.03% for 1 s , ⩽0.25% for 2 s , ⩽0.27% for 2 p , ⩽1.44% for 3 s , ⩽1.87% for 3 p , ⩽3.46% for 3 d , and ⩽8.59% for 4 s . This insensitivity in the energy values was due to the compact radial probability densities of these core orbitals ( 1 s , 2 s , 2 p , 3 s , 3 p , 3 d , and 4 s ), which barely overlap with the confinement region [24]. On the other hand, the bare ion’s outer orbitals retained a significant radial probability density in the C60 shell region. The variation in the subshell energy became ⩽13.18% for the 4 p orbital. In contrast, the excited and valence orbitals exhibited complicated sensitivity to the change in U 0 from 0 to 0.30 au. The circumstance is unlikely to remain the same with a further increase in confinement well depth [30]. Because of the possible degeneracy of the valence orbitals, it is feasible that for a higher value of U 0 , the core orbital energies would also change. For the case of the H atom, it was shown that the orbital energy was flat at lower confinement depths, but changed with a further increase in confinement potential [30].
Table 2. Energy of the core orbitals at different values of U 0 .
Energy (au) U 0 = 0.000 U 0 = 0.259 U 0 = 0.280 U 0 = 0.300
E 1 s 595.824 596.018 596.012 596.029
E 2 s 83.341 83.538 83.532 83.549
E 2 p 73.040 73.236 73.231 73.248
E 3 s 14.154 14.351 14.346 14.362
E 3 p 10.869 11.066 11.061 11.077
E 3 d 5.755 5.952 5.946 5.962
E 4 s 2.139 2.330 2.326 2.340
E 4 p 1.278 1.463 1.460 1.472
In Figure 2, we demonstrate the alteration in valence and excited energy levels with the variation in U 0 . A systematic drop in the energy of all the states except 5 p orbital in response to the attractive potential can be seen in Figure 2. Even for small values of U 0 , the energy levels of the 5 p orbitals increased initially and become nearly unchanged throughout the remaining range. Interestingly, a peak can be observed in Figure 2 for the 4 D 5 / 2 state at U 0 = 0.28 au, due to a remarkable increase in the fine structure splitting at that particular confinement depth. Our investigation further showed that the radial probability distribution of the 4 D 5 / 2 and 4 D 3 / 2 subshells exhibited different qualitative features in the shell region of the C60. For instance, the 4 D 5 / 2 subshell’s electron density was more glued to the C60 shell region compared to that of the 4 D 3 / 2 subshell, as discussed later in connection with Figure 3c,d.
Figure 2. Energy of the states with varying U 0 .
Atoms 13 00036 g002
The effects of confinement on the radial probability distributions of valence and the excited orbitals are shown in Figure 3 and Figure 4. From Figure 3a, it is evident that the peak of the probability distributions of the 5 S 1 / 2 state was initially situated close to the nuclear Coulombic potential well (inner well); however, as U 0 increased, this peak moved within the confinement well (outer well) region. Figure 3c,d illustrate that a substantial percentage of the probability distributions of the 4 D 3 / 2 and 4 D 5 / 2 states of the bare Sr+ ion ( U 0 = 0 au) were located away from the confinement region. But as soon as the confinement was applied, these states became confined inside the C60 well and were compressed more concisely. As a result, the C60 cage attracted more electrons of the encapsulated ion with the increase in U 0 ; thus, the probability distribution of these states became closer to the C60 well. Hence, the energies of 5 s and 4 d orbitals decreased as the confinement strength increased (Figure 2). One can notice that the response of these states adequately explains the pattern of the variation in energy values of the corresponding states, as shown in Figure 2.
In Figure 4, we can see that when the confinement was applied, the various 5 p orbital states responded in a complicated way. It was found that the number of nodes increased by one with the increase in U 0 . In the case of 5 P 1 / 2 and 5 P 3 / 2 states (Figure 4), the bare ion’s wavefunction shared a good overlap with the confinement region. Upon confinement, an additional peak in the probability distribution was detected in the confinement range due to the effect of C60. Due to the confinement effect, a node was developed in the wavefunction within the confinement region. Alternatively, one can think of the formation of the node as due to the superposition of the bare ion and C60 wavefunction. A similar trend of an increase in nodes for confined atom wavefunctions was reported previously for Xe 5p and Ar 3p orbitals [46,47].
Figure 3. Probability distributions of the radial part of the wavefunctions of (a) 5 S 1 / 2 , (b) 6 S 1 / 2 , (c) 4 D 3 / 2 and (d) 4 D 5 / 2 states for different values of U 0 (in au).
Atoms 13 00036 g003
The calculated dipole moments, d = q e r , of all states are listed in Table 3. The dipole moments of these 5 p orbitals’ states initially increased for U 0 = 0.259 au and then decreased with a further increase in the confinement. For the other orbitals, contrary to this behavior, the dipole moment was consistent with the variation in U 0 . The trend of the dipole moment had a strong connection with the radial extent of the orbitals. Furthermore, the behavior of these states was consonant with the trend in energy variation, as shown in Figure 2.
In the realization and modeling of the gas phase reactions in plasma, a detailed understanding of the basic physico-chemical mechanisms inside the media of encapsulated ions, especially the ionization processes of (quasi-) free electrons, has been shown to have a key significance. To obtain electron impact ionization cross-sections, a binary-encounter Bethe (BEB) model [48,49] can be applied, which requires binding the energy and kinetic energy of the electron at the individual orbital [50,51], as given by
σ B E B = S t + u + 1 ln t 2 1 1 t 2 + 1 1 t ln t t + 1 .
Here,
t = T B , u = U B , S = 4 π a 0 2 N R B 2 .
In Equation (14), T represents a freely varying function in terms of the energy of the incident electron; B is the binding energy of the electron at a given atomic orbital, and U represents the kinetic energy of the bound electron; N signifies the number of electrons on the orbital; R represents the Rydberg constant (R = 13.605 eV); and a 0 is the Bohr radius ( a 0 = 0.529 Å). The numerical values of the binding energy (B) of the electron at different core orbitals for the encapsulated Sr+ ion are given in Table 2. For the valence and excited levels, the variation in B with potential depth ( U 0 ) is shown in Figure 2. Therefore, these values of B can be used in calculations of electron impact ionization cross-sections using the BEB model (Equation (13)). In Figure 3 and Figure 4, the probability distributions of electrons at different orbitals are shown graphically. Using the electronic probability distribution, the expectation value of kinetic energy (U) of the electron at different orbitals can be calculated. Therefore, the electron impact ionization cross-sections of encapsulated ions can be calculated using the present data and engineered by altering the value of U 0 . For further study of the temporal evolution in the plasma ionization, this impact (collision) ionization model based on electron–ion collisional cross-sections allows calculating ionization values in a much more natural manner than equilibrium models, which is useful for the further study of the temporal evolution in plasma ionization [52].
In Table 4, we have presented the values of the transition energies (E), wavelengths ( λ ), oscillator strengths (f), transition probabilities (A), and the accuracy indicators (dT) for the D 1 and D 2 transitions. Previously, a special emphasis was placed upon the D 1 and D 2 transition lines of Rb by Pooser et al. [53] in an experiment on quantum noise reduction. From Table 4, we can observe that with the increase in confinement depth, the transition energies of both D 1 and D 2 transitions increased and the energy of the D 2 transition was always greater than the D 1 transition for the cases of both bare and confined ions. This alteration in transition energy from bare to confined ion due to the presence of C60 may be significant in the study of temperature distributions and chemical compositions of the distant galaxy [54]. Therefore, these computed data, as presented in Table 4, may be used to further investigate the effect of confinement depth on line intensities and different plasma parameters.
Figure 4. Probability distributions of the radial part of the wavefunctions of all the P states for different values of U 0 (in au).
Atoms 13 00036 g004
Table 3. Dipole moment values of the states in au considering q e = 1 au.
Depth U 0 (au) d 5 S 1 / 2 d 4 D 3 / 2 d 4 D 5 / 2 d 5 P 1 / 2 d 5 P 3 / 2 d 6 S 1 / 2
0.000 4.043 3.113 3.130 4.986 5.048 14.099
0.259 4.933 5.262 5.261 6.304 6.365 10.831
0.280 5.046 5.448 5.756 6.209 6.269 10.615
0.300 5.150 6.302 5.764 6.124 6.185 10.408
Table 4. Transition data for D 1 and D 2 transitions for confined Sr+ ion inside fullerene: transition energies E in cm−1, wavelength λ in Å, oscillator strength f, transition probability A in s−1, and accuracy indicator dT.
Transition Data U 0 = 0.000 U 0 = 0.259 U 0 = 0.280 U 0 = 0.300
E D 1 21,83462,03962,64863,335
E D 2 22,51962,91463,54364,244
λ D 1 4579.847 1611.881 1596.211 1578.882
λ D 2 4440.531 1589.455 1573.721 1556.553
f D 1 0.7932 0.0104 0.0140 0.0183
f D 2 1.6300 0.0145 0.0212 0.0290
A D 1 1.261 × 10 8 1.335 × 10 7 1.835 × 10 7 2.445 × 10 7
A D 2 1.379 × 10 8 9.606 × 10 6 1.428 × 10 7 1.998 × 10 7
dT D 1 0.065 0.333 0.312 0.285
dT D 2 0.063 0.398 0.361 0.328

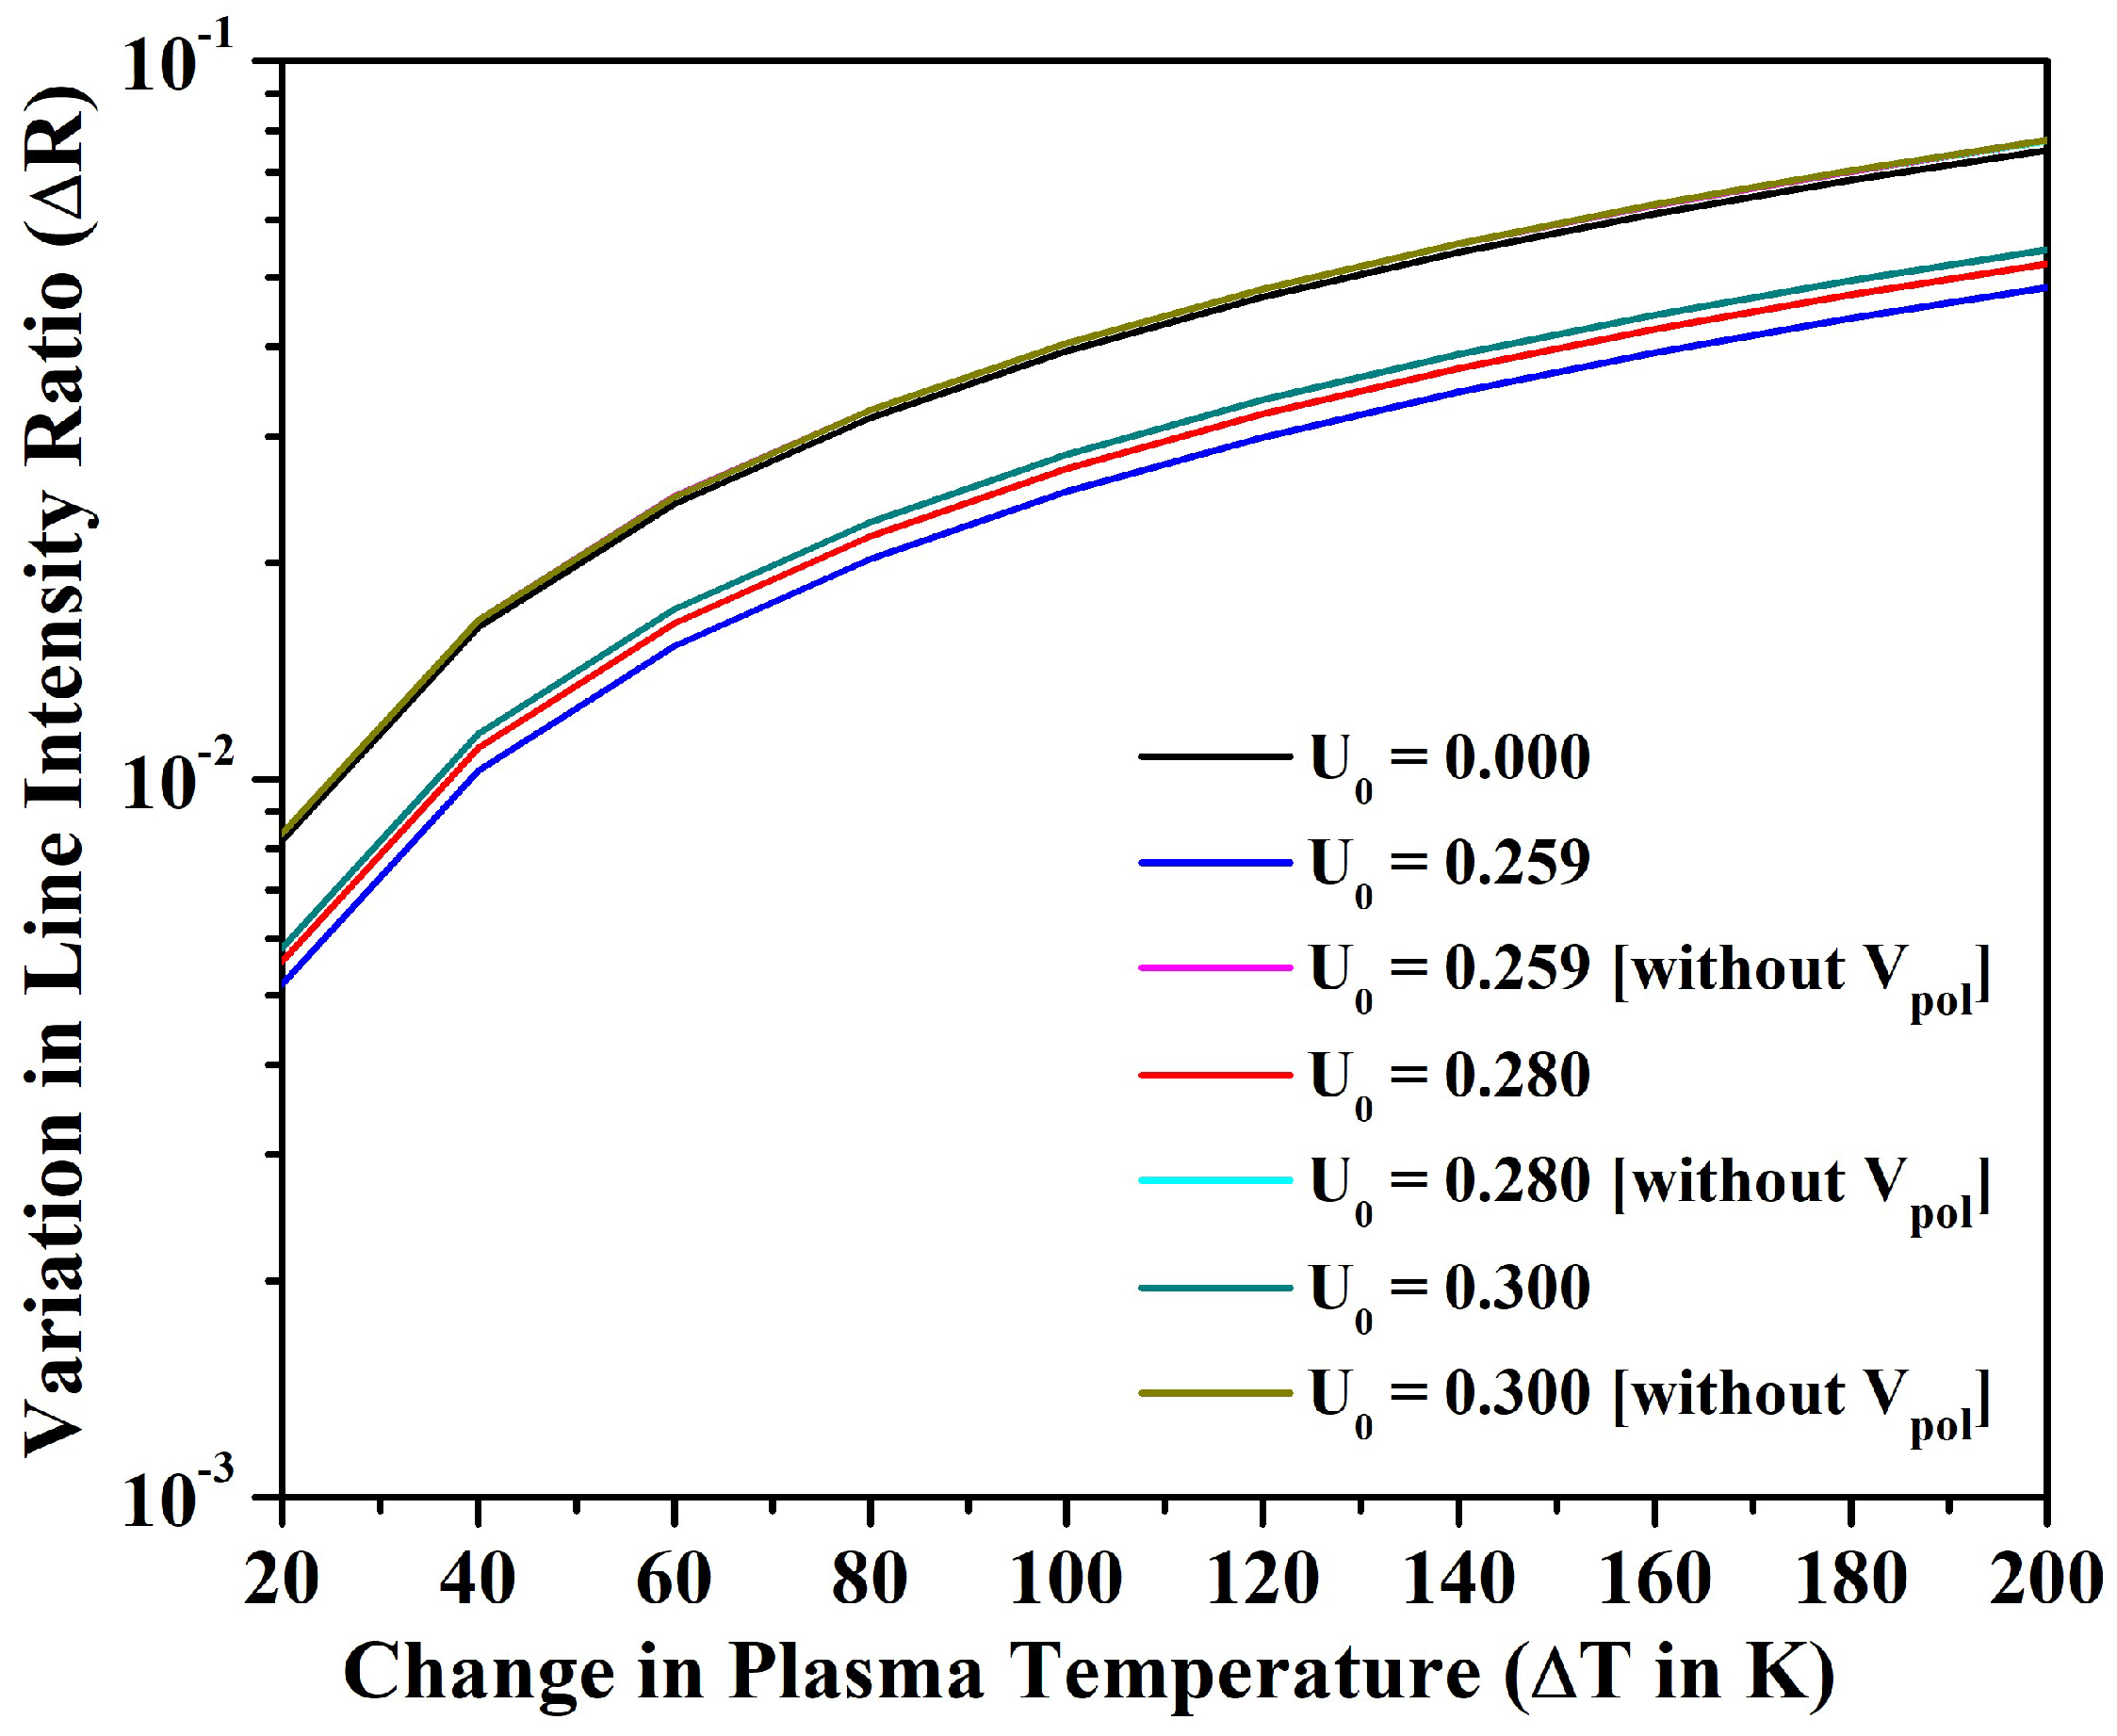
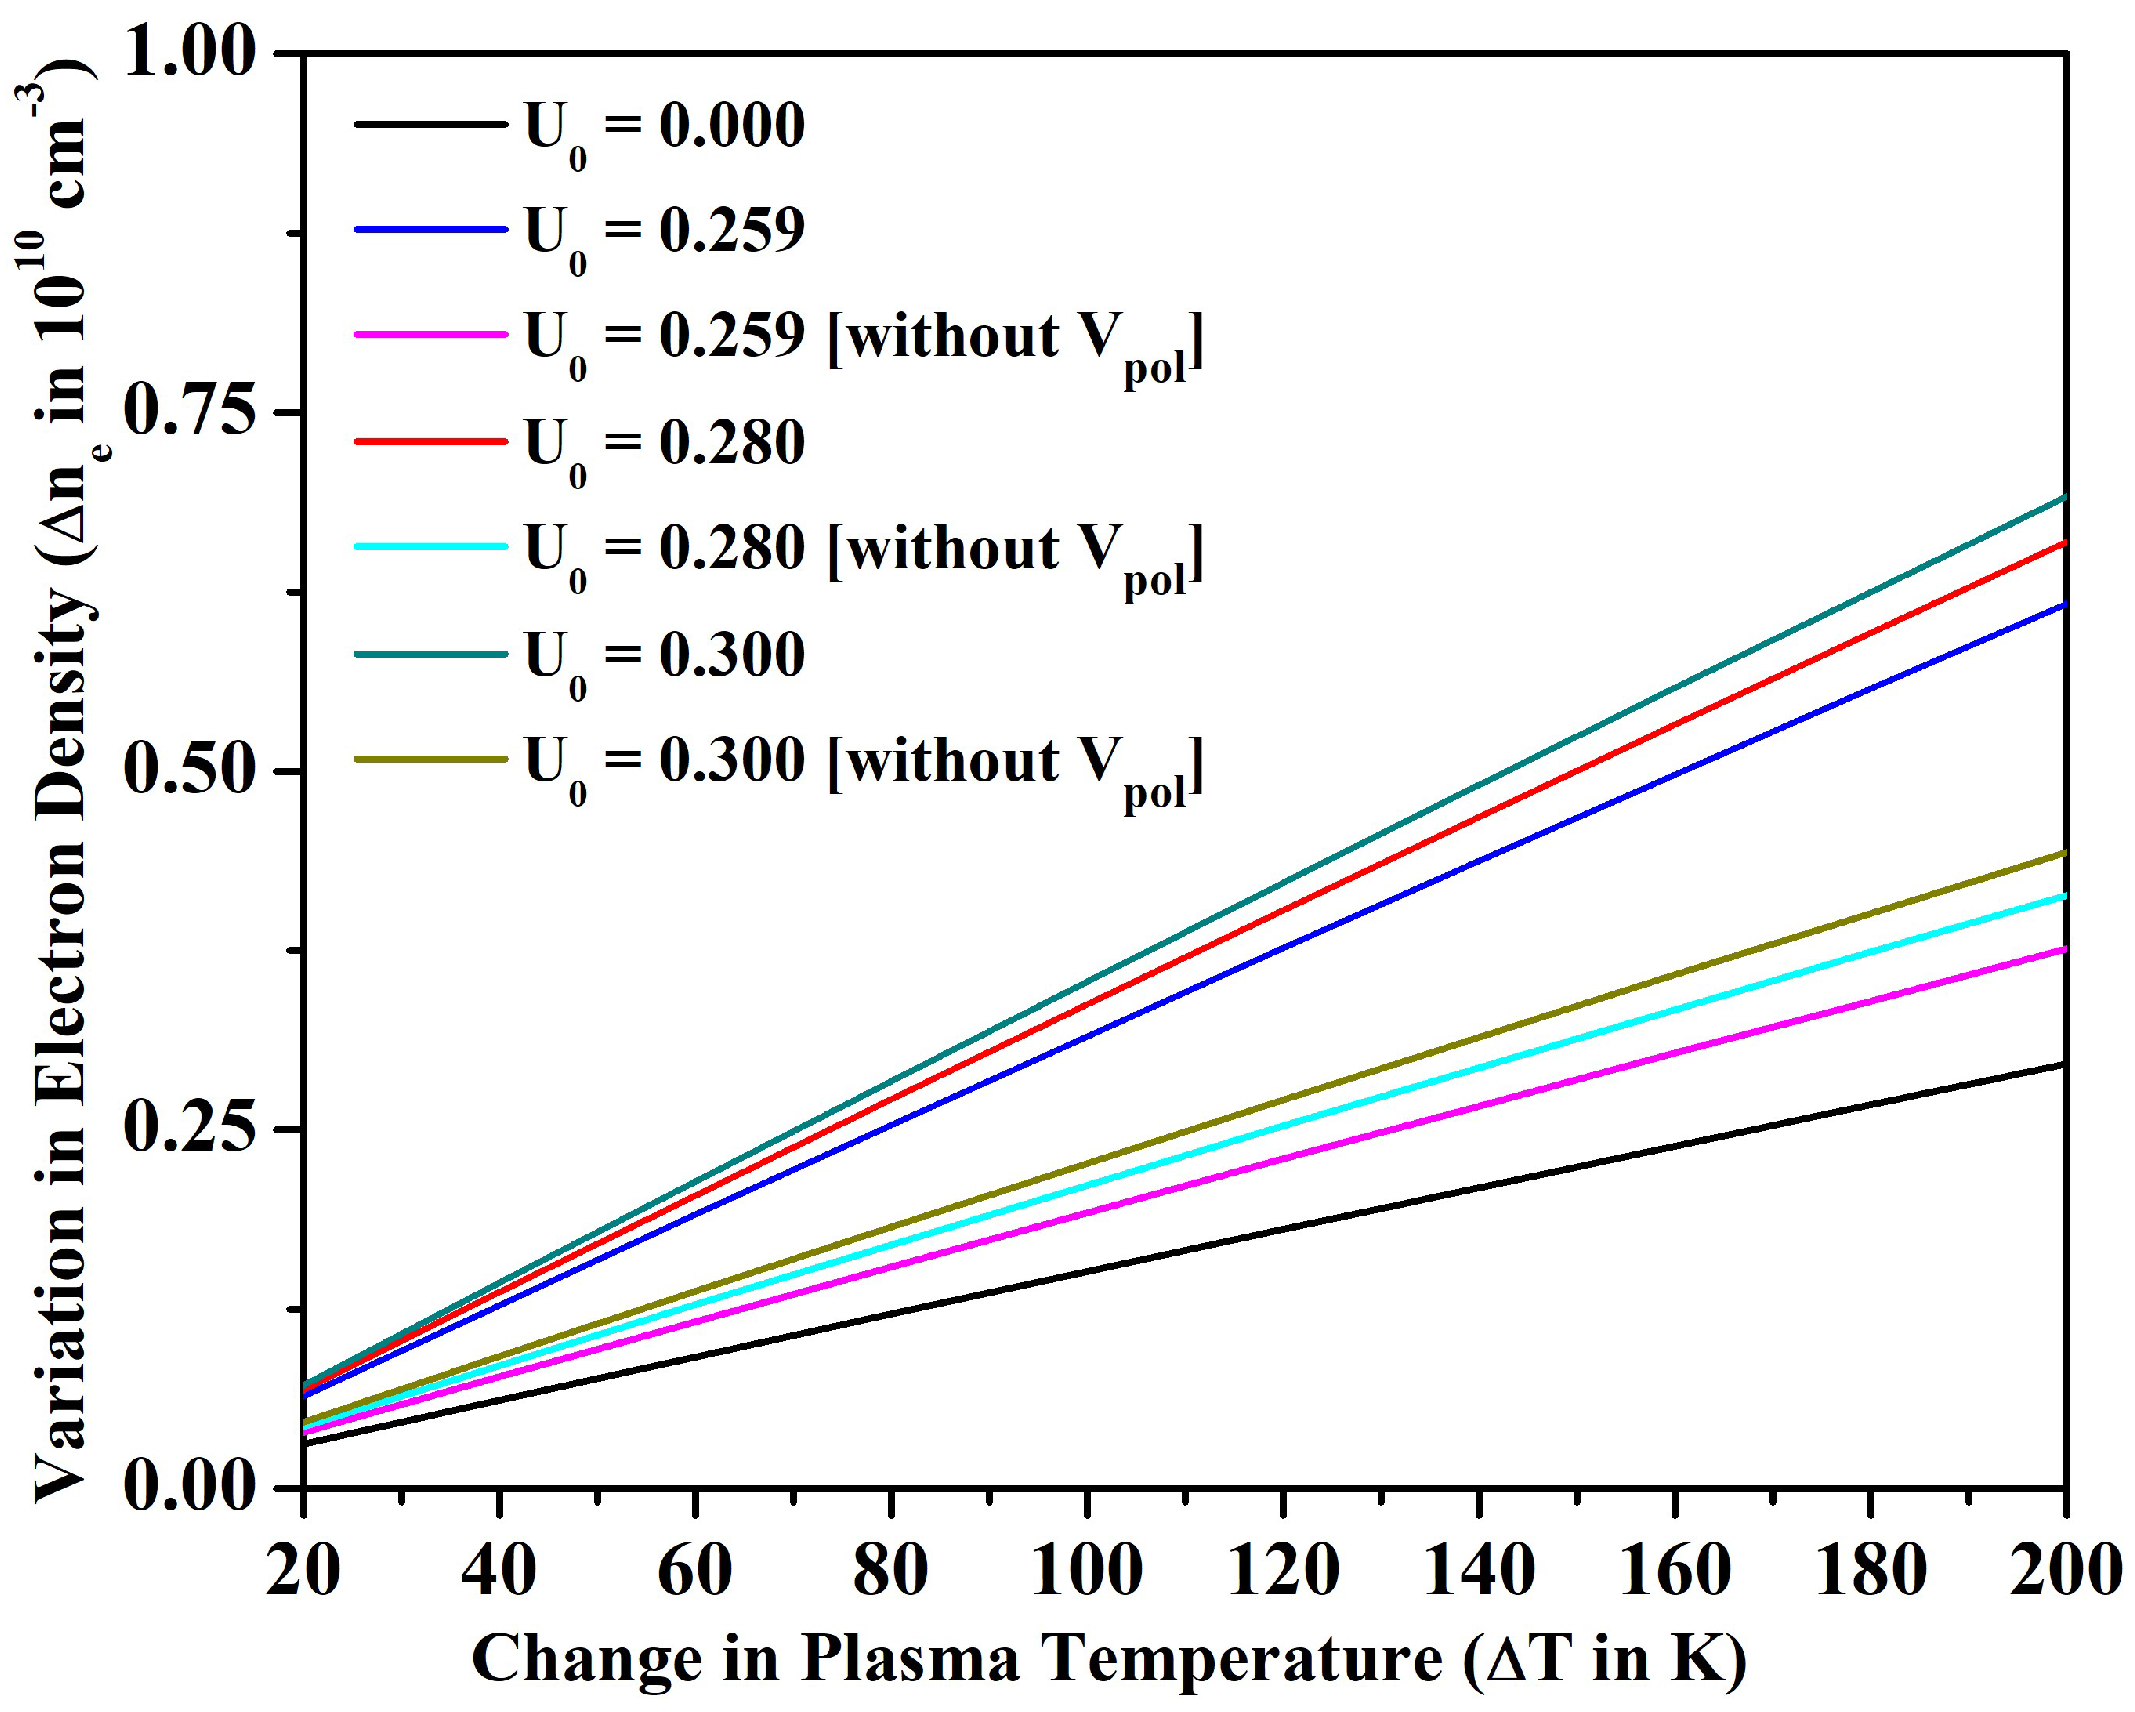
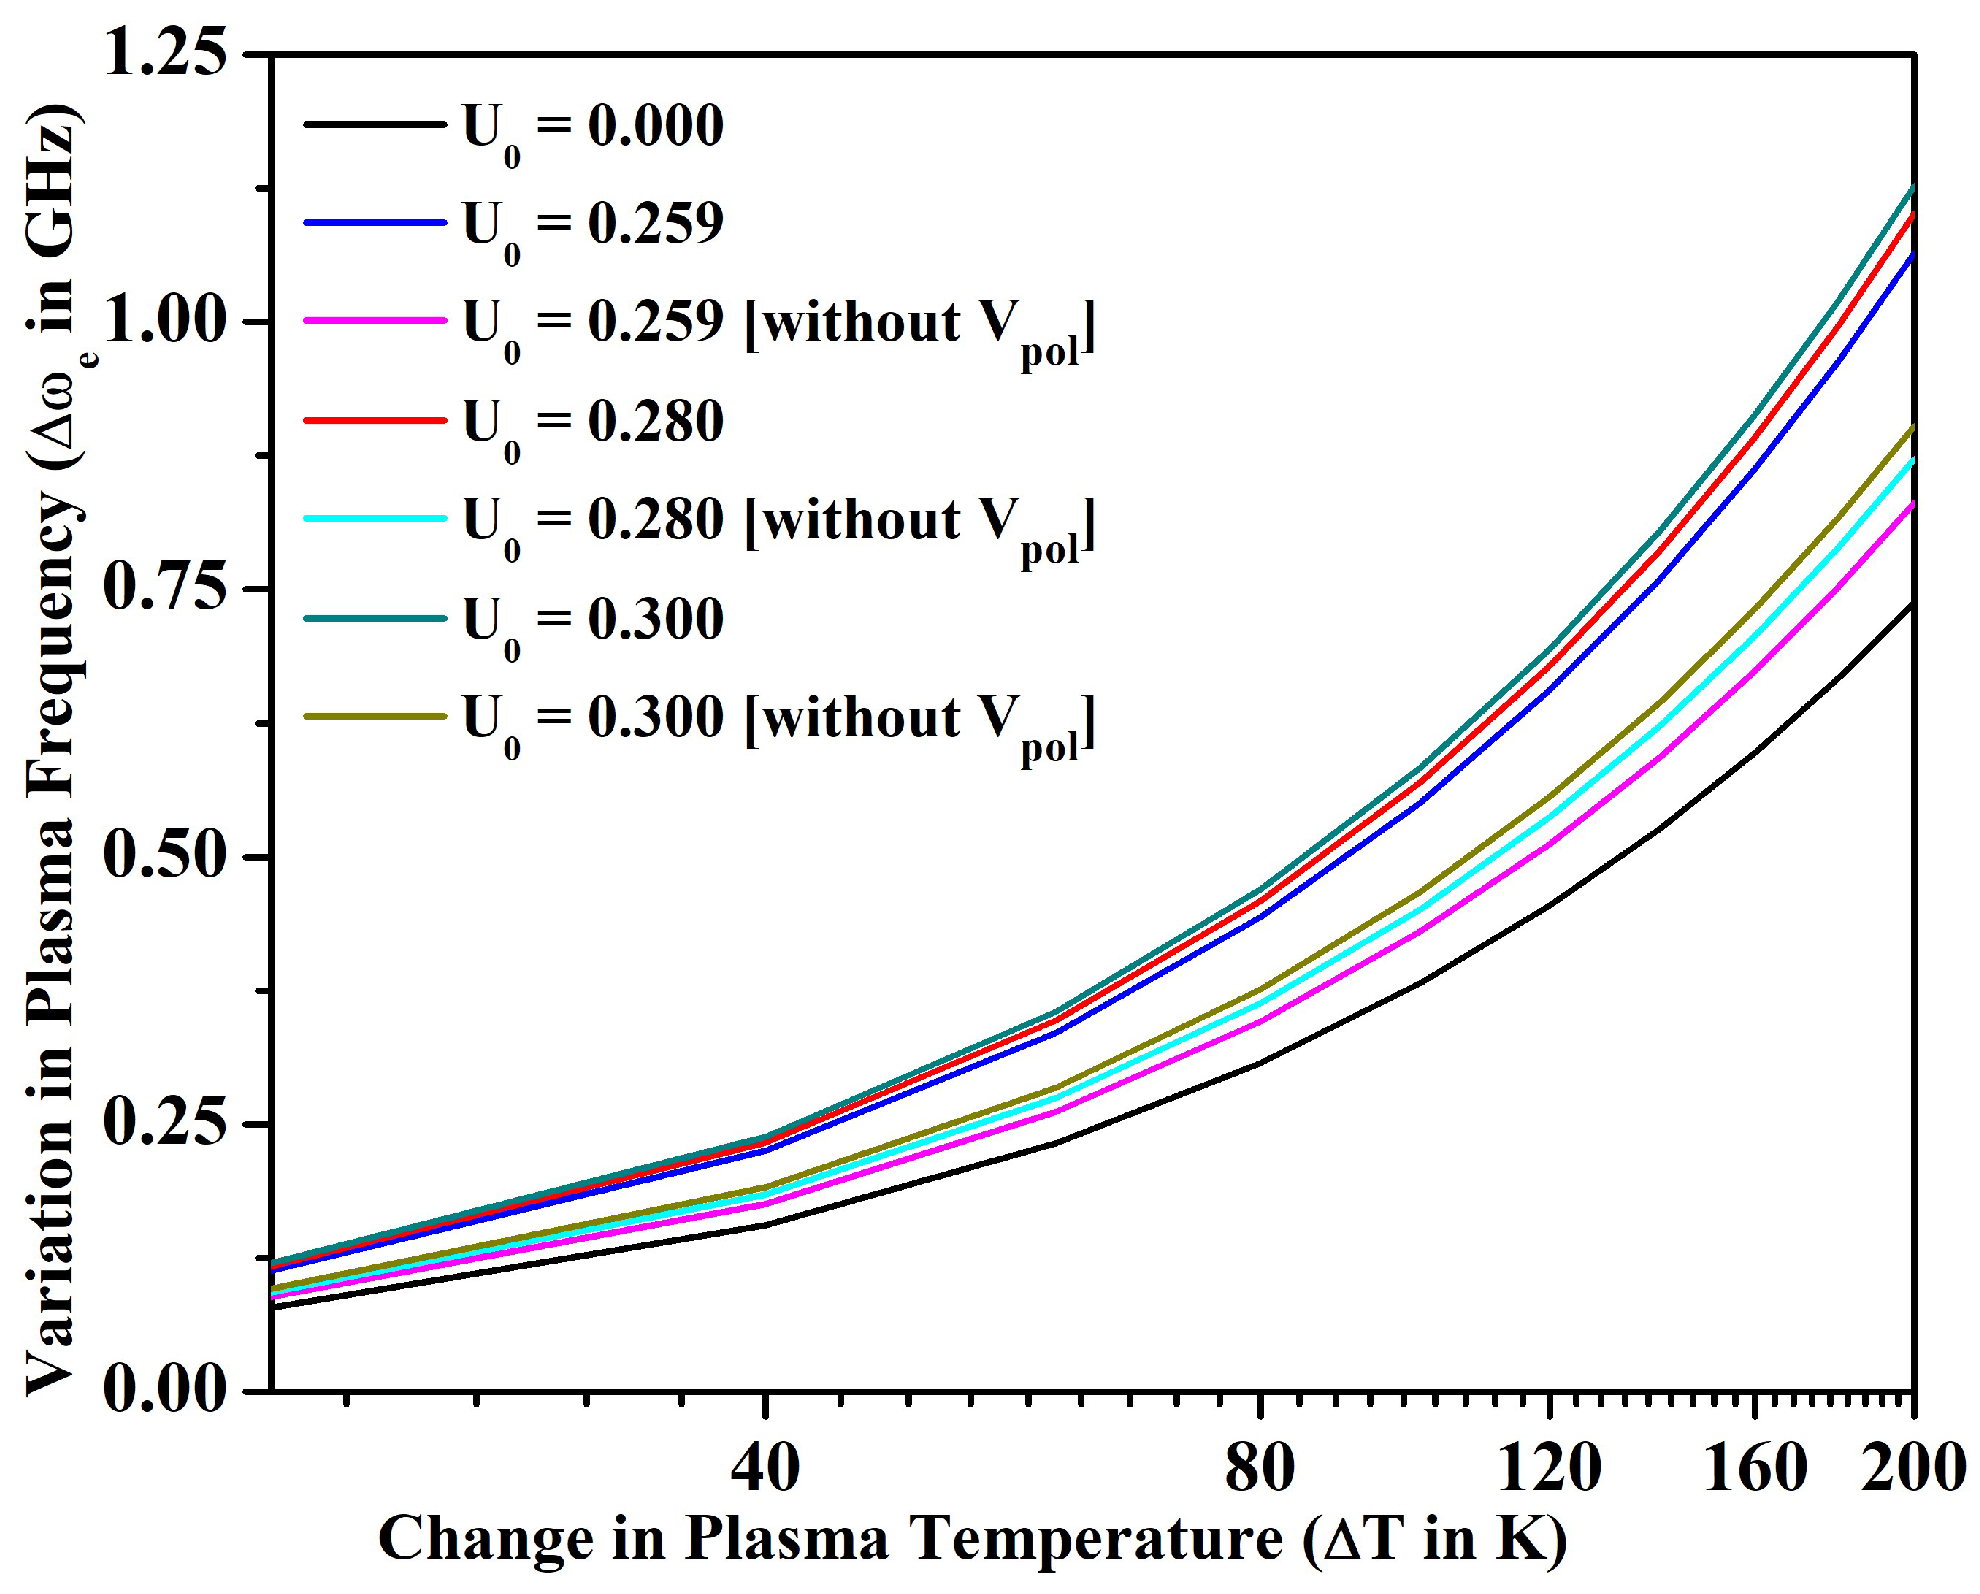
3.2. Line Intensity Ratio and Plasma Parameters

The spectroscopic parameters, such as transition wavelength and transition probability, can be engineered by slightly altering the charge states of the fullerene. A variation in spectroscopic parameters leads to a change in plasma parameters, which helps to further understand the electron dynamics in a confined system. However, if the plasma is presumed to be optically thin and in local thermodynamic equilibrium (LTE), the characterization and diagnosis become quite simple. Hence, we explored the variation in line intensity ratio (R) with temperature (T) for optically thin plasma at different potential depths of the fullerene.
The line intensity ratio of two spectral lines 1 and 2 of the same atom or ion is defined by the following equation:
R = I 1 I 2 = λ 2 λ 1 A 1 A 2 g 1 g 2 e x p ( E 1 E 2 k T )
where I is the intensity, and λ and A are the wavelength and transition probability. Here, g denotes the statistical weight of the lower level of transition. E 1 and E 2 are the respective energy levels, k is the Boltzmann constant, and T is the excitation temperature in Kelvin. In the present work, we selected two spectral lines, specifically, 1 [ 5 S 1 / 2 5 P 3 / 2 ] and 2 [ 5 S 1 / 2 5 P 1 / 2 ], for the calculation of the line intensity ratio and other parameters by varying the confinement depth. The line intensity ratio for Sr+ ion is tabulated in Table 5. From Figure 5, it can be seen that a rapid variation in Δ R occurred with the initial change in Δ T , but the ratio varied slowly at high temperatures. In Figure 5, we also compare the values of Δ R with polarization and without polarization (only electrostatic and GASW) potential; a significant impact of polarization potential was seen at different confinement depths of C60. An analysis by Nikonova et al. [55] indicated that the structural change in C60 begins to occur at a temperature above 1200 K. Moreover, another study by Borodin and Trukhacheva [56] showed that the upper boundary of the temperature for the structural stability of C60 is not constant but depends on various parameters, and in some contexts, the C60 molecule remains stable, even at high temperatures exceeding 3000 K. In the present work, however, we restricted the calculations to maximum temperature up to 1200 K, which could be extended further to higher temperatures by accounting for additional effects with the presence of a buffer gas (helium or argon). Since the plasma is considered optically thin and in LTE, the time frame for time-evolving plasmas such as Laser Induced Plasmas (LIPs) can be obtained experimentally by comparing the present data with the measured line intensity ratios at different delay times.
Table 5. Temperature (T in K), line intensity ratio (R), electron density ( n e in 10 10 cm−3), plasma frequency ( ω e in 10 10 Hz), skin depth ( δ in cm), and coupling parameter ( Γ in 10 2 ) for D 2 and D 1 transitions of bare and confined Sr+ ions inside fullerene.
U 0 = 0.000 au
T (In K) R n e (In 1010 cm−3) ω e (In 1010 Hz) δ (In cm) Γ (In 10 2 )
1000 0.421 3.099 1.581 3.016 0.709
1020 0.429 3.130 1.589 3.001 0.697
1040 0.437 3.161 1.597 2.987 0.686
1060 0.445 3.191 1.604 2.972 0.675
1080 0.453 3.221 1.612 2.959 0.665
1100 0.460 3.251 1.619 2.945 0.654
1120 0.468 3.280 1.626 2.932 0.645
1140 0.475 3.309 1.634 2.919 0.635
1160 0.482 3.338 1.641 2.906 0.626
1180 0.489 3.367 1.648 2.894 0.617
1200 0.496 3.395 1.655 2.882 0.609
U 0 = 0.259 au
T (In K) R n e (In 10 10 cm−3) ω e (In 10 10 Hz) δ (In cm) Γ (In 10 2 )
1000 0.207 6.460 2.282 2.089 0.905
1020 0.212 6.524 2.294 2.079 0.890
1040 0.217 6.588 2.305 2.069 0.876
1060 0.222 6.651 2.316 2.059 0.862
1080 0.227 6.714 2.327 2.049 0.849
1100 0.232 6.775 2.337 2.040 0.836
1120 0.237 6.837 2.348 2.031 0.824
1140 0.242 6.898 2.358 2.022 0.812
1160 0.246 6.958 2.369 2.013 0.800
1180 0.251 7.017 2.379 2.004 0.789
1200 0.256 7.077 2.389 1.996 0.778
U 0 = 0.280 au
T (In K) R n e (In 10 10 cm−3) ω e (In 10 10 Hz) δ (In cm) Γ (In 10 2 )
1000 0.218 6.913 2.361 2.019 0.926
1020 0.223 6.982 2.373 2.009 0.911
1040 0.229 7.050 2.384 1.999 0.896
1060 0.234 7.118 2.396 1.990 0.882
1080 0.240 7.185 2.407 1.981 0.868
1100 0.245 7.251 2.418 1.972 0.855
1120 0.250 7.316 2.429 1.963 0.842
1140 0.255 7.381 2.440 1.954 0.830
1160 0.260 7.446 2.450 1.946 0.818
1180 0.265 7.510 2.461 1.938 0.807
1200 0.270 7.573 2.471 1.929 0.795
U 0 = 0.300 au
T (In K) R n e (In 10 10 cm−3) ω e (In 10 10 Hz) δ (In cm) Γ (In 10 2 )
1000 0.224 7.243 2.417 1.973 0.940
1020 0.230 7.315 2.429 1.963 0.925
1040 0.236 7.386 2.441 1.954 0.910
1060 0.241 7.457 2.452 1.944 0.896
1080 0.247 7.527 2.464 1.935 0.882
1100 0.252 7.596 2.475 1.927 0.869
1120 0.258 7.665 2.486 1.918 0.856
1140 0.263 7.733 2.497 1.909 0.843
1160 0.268 7.801 2.508 1.901 0.831
1180 0.274 7.868 2.519 1.893 0.819
1200 0.279 7.934 2.529 1.885 0.808
Figure 5. Variation in line intensity ratio with temperature for different values of U 0 (in au). Here, Δ T = T 1000 and Δ R = R R T = 1000   K .
Atoms 13 00036 g005
To attain LTE, the electron density should be large and, therefore, a criterion on the limiting value of n e was proposed by McWhirter [57] as
n e 1.6 × 10 12 T 1 / 2 ( Δ E ) 3
where n e represents electron density in cm−3, T is the temperature in Kelvin, and Δ E denotes the energy gap in eV. From Figure 6, we can see that n e increased with T for Sr+, which signifies that the number of collisions in the plasma increased with the rise in temperature. From Table 5, we can see that n e increased around 50% due to the effect of encapsulation inside the fullerene. From Figure 6, the observations are remarkable, as the present calculation offered a tunability of the value of Δ n e by slightly varying U 0 . The value of electron density was found to be in the order of 10 10 cm−3, as shown in Table 5. Matters with n e of about that range were observed in space during the magnetic decoupling stage of star formation [58].
Figure 6. Variation in electron density with temperature with varying U 0 . Here, Δ T = T 1000 and Δ n e = n e n e T = 1000   K .
Atoms 13 00036 g006
The relationship between electron density and plasma frequency, or the frequency with which electrons oscillate, is expressed as
ω e = n e × 10 9 0.124 1 / 2 .
In Equation (17), ω e denotes plasma frequency in Hz. This is directly proportional to the square root of n e and, hence, depends on the one-fourth power of T. From Figure 7, it can be seen that ω e increased with T as the electrons gained more thermal energy at high temperature. In Figure 7, we can observe that the change in plasma frequency with U 0 was quite small at low temperature, but it increased at higher temperature values, which signifies that the electrons oscillated with higher frequency at high temperature due to the effect of the confinement potential. For instance, the lowest plasma frequency was calculated as 15.81 GHz for U 0 = 0 at T = 1000 K in the present work, which lies in the microwave region. However, the highest value of ω e was found to be 25.29 GHz for U 0 = 0.30 au at T = 1200 K for confined ion, which sets an enhancement in plasma frequency of about 60%.
Figure 7. Variation in plasma frequency for different values of U 0 (in au). Similarly, Δ T = T 1000 and Δ ω e = ω e ω e T = 1000   K .
Atoms 13 00036 g007
The distance up to which an electromagnetic radiation can penetrate inside a plasma is called skin depth. The expression of skin depth ( δ ) in cm in terms of electron density is given by
δ = 5.31 × 10 5 × n e 1 / 2
In Table 5, we have listed the calculated data for skin depth with increasing temperatures. From Equation (18), it can be seen that δ varied inversely with one-half power of the electron density, therefore changing inversely with the one-fourth power of the temperature. From Table 5, we can observe that the skin depth decreased quite fast with increasing temperature, and also due to the confinement potential. In this study, at T = 1200 K, the minimum value of δ was calculated as 1.885 cm for U 0 = 0.30 au. This implies that Sr+ ion plasma is highly conductive; therefore, we noticed that electron density and temperature played a vital role in minimizing the skin depth of the plasma and controlling the conductivity of the plasma. Since skin depth is calculated in the range of 3.016 cm to 1.885 cm, therefore the size of the plasmon can be tuned by varying the confinement depth of the fullerene. Therefore, this encapsulated ion plasma may be useful in various applications, such as solar cells, spectroscopy, and cancer treatment.
The relation between the Coulomb coupling parameter ( Γ ), electron density ( n e ), and temperature (T) can be expressed as
Γ = 0.225593 × 10 2 × n e 1 / 3 × T 1
The Coulomb coupling parameter represents the ratio between the average potential energy due to Coulomb interaction and the average kinetic energy of each particle. It measures the degree to which the interactions between Sr+ and C60 affect the dynamics of electrons in the confined system. The coupling constant calculated using Equation (19) is less than unity, as shown in Table 5, for all values of electron density and temperature. This signifies that the plasma formed by the Sr+ ion would be hot and weakly coupled in nature.

4. Conclusions

A comprehensive study on relativistic MCDHF calculations for Sr+ ion confined inside C60 was presented in this article. This investigation comprised fine-structure energy levels, wavelengths, transition probabilities, and oscillator strengths. We selected the GASW potential to mimic the fullerene environment, and also varied the potential strength from 0 to 0.30 au to see the alteration in electronic properties. From these calculations, we can conclude the following:
  • The MCDHF and GASW formalisms overall provided consistent and reliable results for the electronic properties of the Sr+ ion confined inside fullerene. The calculated orbital energies were a valuable component to study the electron impact ionization process using the BEB method.
  • We performed two separate calculations: one with electrostatic and GASW potentials, and another by further adding the polarization potential. We found that inclusion of the polarization effect was very important in order to accurately determine the energy levels and transition data of the confined ion.
  • We also investigated the merit of the fullerene in the alteration of line intensity ratio, electron density, plasma frequency, and skin depth with the variation in temperature for an optically thin plasma in LTE. In particular, the electron density could be increased only around 9% for the bare ion case by increasing the temperature up to 1200 K; however, n e could be increased around 50% by incorporating the effect of encapsulation within the fullerene. The electron density and other parameters of plasma could be further tuned by changing the potential depth of the fullerene.
  • We noticed that the size of the plasmon could also be tuned by varying the confinement depth of the fullerene. Finally, we were able to conclude by calculating Γ that the average kinetic energy of electrons in Sr+ ion is significantly higher than the average potential energy due to Coulomb interaction, and, therefore, these are weakly coupled in nature confined inside C60.
There is a scarcity of data in the literature regarding the structural and spectroscopic properties of the study of electron dynamics in confined ions like those studied here, having applicability in a variety of domains like plasma physics, astrophysics, etc. The present work calls for more stringent theoretical investigations and further advancement in experimental attempts for this confined ion, to infer more information regarding its interaction with fullerene.

Author Contributions

Conceptualization: B.G., J.J. and R.K.E.; data curation: B.G. and M.A.; formal analysis: B.G. and M.A.; investigation: B.G. and M.A.; methodology: B.G. and J.J.; funding acquisition: R.K.E. and J.J.; project administration: R.K.E.; resources: R.K.E. and J.J.; software: B.G., M.A. and J.J.; validation: B.G. and M.A.; visualization: B.G. and J.J.; supervision: R.K.E. and J.J.; writing—original draft preparation: B.G.; writing—review and editing: B.G., M.A., J.J. and R.K.E. All authors have read and agreed to the published version of the manuscript.

Funding

This research was supported by the Science and Engineering Research Board (SERB), DST, New Delhi through Project No. CRG/2022/000181 (RKE) and CRG/2022/000191 (JJ).

Institutional Review Board Statement

Not applicable.

Informed Consent Statement

Not applicable.

Data Availability Statement

The data generated as part of this study are all used and are available in the manuscript.

Acknowledgments

We acknowledge the Indian Institute of Technology Patna for providing computational resources and financial support.

Conflicts of Interest

The authors declare no conflicts of interest.

References

  1. Acquah, S.F.A.; Penkova, A.V.; Markelov, D.A.; Semisalova, A.S.; Leonhardt, B.E.; Magi, J.M. Review—The beautiful molecule: 30 Years of C60 and its derivatives. ECS J. Solid State Sci. Technol. 2017, 6, M3155–M3162. [Google Scholar] [CrossRef]
  2. Kroto, H.W.; Heath, J.R.; ÓBrien, S.C.; Curl, R.F.; Smalley, R.E. C60: Buckminsterfullerene. Nature 1985, 318, 162–163. [Google Scholar] [CrossRef]
  3. Harneit, W. Fullerene-based electron-spin quantum computer. Phys. Rev. B 2002, 65, 032322. [Google Scholar] [CrossRef]
  4. Jönsson, P.; Gaigalas, G.; Rynkun, P.; Radžiūtė, L.; Ekman, J.; Gustafsson, S.; Hartman, H.; Wang, K.; Godefroid, M.; Charlotte, F.F.; et al. Multiconfiguration Dirac-Hartree-Fock calculations with spectroscopic accuracy: Applications to astrophysics. Atoms 2017, 5, 16. [Google Scholar] [CrossRef]
  5. Watson, D.; Hansen, C.J.; Selsing, J.; Koch, A.; Malesani, D.B.; Andersen, A.C.; Fynbo, J.P.U.; Arcones, A.; Bauswein, A.; Covino, S.; et al. Identification of strontium in the merger of two neutron stars. Nature 2019, 574, 497–500. [Google Scholar] [CrossRef]
  6. Cowan, J.J.; Sneden, C.; Burles, S.; Ivans, I.I.; Beers, T.C.; Truran, J.W.; Lawler, J.E.; Primas, F.; Fuller, G.M.; Pfeiffer, B.; et al. The chemical composition and age of the metal-poor halo star BD +17°3248. Astrophys. J. 2002, 572, 861–879. [Google Scholar] [CrossRef]
  7. Barklem, P.S.; O’Mara, B.J. Broadening of lines of Be II, Sr II and Ba II by collisions with hydrogen atoms and the solar abundance of strontium. Mon. Not. R. Astron. Soc. 2000, 311, 535–540. [Google Scholar] [CrossRef]
  8. Zethson, T.; Gull, T.R.; Hartman, H.; Johansson, S.; Davidson, K.; Ishibashi, K. Sr II and [Sr II] emission in the ejecta of η Carinae. Astron. J. 2001, 122, 322–326. [Google Scholar] [CrossRef]
  9. Simien, C.E.; Chen, Y.C.; Gupta, P.; Laha, S.; Martinez, Y.N.; Mickelson, P.G.; Nagel, S.B.; Killian, T.C. Using absorption imaging to study ion dynamics in an ultracold neutral plasma. Phys. Rev. Lett. 2004, 92, 143001. [Google Scholar] [CrossRef]
  10. Cami, J.; Bernard-Salas, J.; Peeters, E.; Malek, S.E. Detection of C60 and C70 in a young planetary nebula. Science 2010, 329, 1180–1182. [Google Scholar] [CrossRef]
  11. Berné, O.; Tielens, A.G.G.M. Formation of buckminsterfullerene (C60) in interstellar space. Proc. Natl. Acad. Sci. USA 2011, 109, 401–406. [Google Scholar] [CrossRef] [PubMed]
  12. Ahmad, M.; Jose, J.; Goswami, B.; Easwaran, R.K. Theoretical exploration of atomic structure calculation of sodium atom confined in the fullerene cage: A primer investigation for EIT applications. J. Phys. B At. Mol. Opt. Phys. 2024, 57, 155001. [Google Scholar] [CrossRef]
  13. Shen, Y.; Cui, M.; Takaishi, S.; Kawasoko, H.; Sugimoto, K.; Tsumuraya, T.; Otsuka, A.; Kwon, E.; Yoshida, T.; Hoshino, N.; et al. Heterospin frustration in a metal-fullerene-bonded semiconductive antiferromagnet. Nat. Commun. 2022, 13, 495. [Google Scholar] [CrossRef]
  14. Aoyagi, S.; Miwa, K.; Ueno, H.; Okada, H.; Matsuo, Y.; Kokubo, K. Structure of [60]fullerene with a mobile lithium cation inside. R. Soc. Open Sci. 2018, 5, 180337. [Google Scholar] [CrossRef]
  15. Cioslowski, J.; Nanayakkara, A. Endohedral effect in inclusion complexes of the C6 cluster. J. Chem. Phys. 1992, 96, 8354–8362. [Google Scholar] [CrossRef]
  16. Ravinder, P.; Subramanian, V. Studies on the encapsulation of various anions in different fullerenes using Density Functional Theory calculations and Born–Oppenheimer molecular dynamics simulation. J. Phys. Chem. A 2011, 115, 11723–11733. [Google Scholar] [CrossRef]
  17. Fischer, C.F.; Godefroid, M.; Brage, T.; Jönsson, P.; Gaigalas, G. Advanced multiconfiguration methods for complex atoms: I. Energies and wave functions. J. Phys. B At. Mol. Opt. Phys. 2016, 49, 182004. [Google Scholar] [CrossRef]
  18. Nascimento, E.M.; Prudente, F.V.; Guimarães, M.N.; Maniero, A.M. A study of the electron structure of endohedrally confined atoms using a model potential. J. Phys. B At. Mol. Opt. Phys. 2011, 44, 015003. [Google Scholar] [CrossRef]
  19. Saha, S.; Thuppilakkadan, A.; Varma, H.R.; Jose, J. Photoionization dynamics of endohedrally confined atomic H and Ar: A contrasting study between compact versus diffused model potential. J. Phys. B At. Mol. Opt. Phys. 2019, 52, 145001. [Google Scholar] [CrossRef]
  20. Grant, I.P. Relativistic Quantum Theory of Atoms and Molecules: Theory and Computation; Springer: New York, NY, USA, 2007. [Google Scholar]
  21. Johnson, W.R. Atomic Structure Theory: Lectures on Atomic Physics; Springer: Berlin/Heidelberg, Germany, 2007. [Google Scholar]
  22. Bransden, B.H.; Joachain, C.J. Physics of Atoms and Molecules; Pearson Education: Bengaluru, India, 2003. [Google Scholar]
  23. Patel, A.B.; Chakraborty, H.S. Fourier photospectroscopy of Xe@C60 through a Xe 4d resonance window: Theory versus recent experiment. J. Phys. B At. Mol. Opt. Phys. 2011, 44, 191001. [Google Scholar] [CrossRef]
  24. Dolmatov, V.K.; Baltenkov, A.S.; Connerade, J.-P.; Manson, S.T. Structure and photoionization of confined atoms. Radiat. Phys. Chem. 2004, 70, 417–433. [Google Scholar] [CrossRef]
  25. Amusia, M.Y.; Chernysheva, L.V.; Dolmatov, V.K. Confinement and correlation effects in the Xe@C60 generalized oscillator strengths. Phys. Rev. A 2011, 84, 063201. [Google Scholar] [CrossRef]
  26. Dolmatov, V.K.; King, J.L.; Oglesby, J.C. Diffuse versus square-well confining potentials in modelling A@C60 atoms. J. Phys. B At. Mol. Opt. Phys. 2012, 45, 105102, Erratum in J. Phys. B At. Mol. Opt. Phys. 2015, 48, 069501. [Google Scholar] [CrossRef]
  27. Xu, X.; Zhang, Y.; Li, B.; Chen, X. Ab initio calculation of electrostatic potentials for C60 and C80. J. Phys. B At. Mol. Opt. Phys. 2020, 53, 035102. [Google Scholar] [CrossRef]
  28. Puska, M.J.; Nieminen, R.M. Photoabsorption of atoms inside C60. Phys. Rev. A 1993, 47, 1181–1186. [Google Scholar] [CrossRef]
  29. Dubey, K.A.; Agrawal, S.; Rao, T.R.; Jose, J. A theoretical investigation of elastic scattering of H atom by C60 and Kr@C60. J. Phys. B At. Mol. Opt. Phys. 2019, 52, 035203. [Google Scholar] [CrossRef]
  30. Lin, C.Y.; Ho, Y.K. Photoionization of atoms encapsulated by cages using the power-exponential potential. J. Phys. B At. Mol. Opt. Phys. 2012, 45, 145001. [Google Scholar] [CrossRef]
  31. Dubey, K.A.; Jose, J. Effect of charge transfer on elastic scattering of electron from Ar@C60: Dirac partial wave calculation. Eur. Phys. J. Plus 2021, 136, 713. [Google Scholar] [CrossRef]
  32. Saha, S.; Jose, J. Shannon entropy as a predictor of avoided crossing in confined atoms. Int. J. Quantum Chem. 2020, 120, e26374. [Google Scholar] [CrossRef]
  33. Dolmatov, V.K.; Amusia, M.Y.; Chernysheva, L.V. Effects of target polarization in electron elastic scattering off endohedral A@C60. Phys. Rev. A 2017, 95, 012709. [Google Scholar] [CrossRef]
  34. Amusia, M.Y.; Chernysheva, L.V. On the behavior of scattering phases in collisions of electrons with multiatomic objects. JETP Lett. 2015, 101, 503–506. [Google Scholar] [CrossRef]
  35. Drukarev, G.F. Collisions of Electrons with Atoms and Molecules; Springer: New York, NY, USA, 1987. [Google Scholar]
  36. Sabirov, D.S. Polarizability as a landmark property for fullerene chemistry and materials science. RSC Adv. 2014, 4, 44996–45028. [Google Scholar] [CrossRef]
  37. Stenholm, S. Foundations of Laser Spectroscopy; Courier Corporation: North Chelmsford, MA, USA, 2012. [Google Scholar]
  38. Allen, L.; Eberly, J.H. Optical Resonance and Two Level Atoms; Courier Corporation: North Chelmsford, MA, USA, 1987. [Google Scholar]
  39. Fischer, C.F.; Gaigalas, G.; Jönsson, P.; Bieroń, J. GRASP 2018—A Fortran 95 version of the General Relativistic Atomic Structure Package. Comput. Phys. Commun. 2019, 237, 184–187. [Google Scholar] [CrossRef]
  40. Grant, I.P. Gauge invariance and relativistic radiative transitions. J. Phys. B At. Mol. Opt. Phys. 1974, 7, 1458–1475. [Google Scholar] [CrossRef]
  41. Jönsson, P.; Godefroid, M.; Gaigalas, G.; Ekman, J.; Grumer, J.; Li, W.; Li, J.; Brage, T.; Grant, I.P.; Bieroń, J.; et al. An introduction to relativistic theory as implemented in GRASP. Atoms 2023, 11, 7. [Google Scholar] [CrossRef]
  42. Olsen, J.; Godefroid, M.R.; Jönsson, P.; Malmqvist, P.Å.; Fischer, C.F. Transition probability calculations for atoms using nonorthogonal orbitals. Phys. Rev. E 1995, 52, 4499–4508. [Google Scholar] [CrossRef]
  43. Kumar, N.; Shivankar; Jha, A.K.S.; Dimri, M.; Dawra, D.; Mohan, M. Relativistic atomic structure calculations, plasma and thermodynamic parameters for Ca X. Eur. Phys. J. Plus 2023, 138, 1155. [Google Scholar] [CrossRef]
  44. Paijwar, R.; Sharma, R.; Jha, A.K.S. Relativistic atomic structure calculations of KIX with plasma parameters. Phys. Plasmas 2022, 29, 092702. [Google Scholar] [CrossRef]
  45. Goyal, A.; Khatri, I.; Singh, A.; Mohan, M.; Sharma, R.; Singh, N. Atomic structure calculations and study of plasma parameters of Al-like ions. Atoms 2016, 4, 22. [Google Scholar] [CrossRef]
  46. Deshmukh, P.C.; Jose, J.; Varma, H.R.; Manson, S.T. Electronic structure and dynamics of confined atoms. Eur. Phys. J. D 2021, 75, 166. [Google Scholar] [CrossRef]
  47. Madjet, M.E.; Chakraborty, H.S.; Manson, S.T. Giant enhancement in low energy photoemission of Ar confined in C60. Phys. Rev. Lett. 2007, 99, 243003. [Google Scholar] [CrossRef] [PubMed]
  48. Kim, Y.-K.; Rudd, M.E. Binary-encounter-dipole model for electron-impact ionization. Phys. Rev. A 1994, 50, 3954–3967. [Google Scholar] [CrossRef] [PubMed]
  49. Hwang, W.; Kim, Y.-K.; Rudd, M.E. New model for electron-impact ionization cross sections of molecules. J. Chem. Phys. 1996, 104, 2956–2966. [Google Scholar] [CrossRef]
  50. Gupta, D.; Choi, H.; Song, M.-Y.; Karwasz, G.P.; Yoon, J.-S. Electron impact ionization cross section studies of C2Fx (x = 1–6) and C3Fx (x = 1–8) fluorocarbon species. Eur. Phys. J. D 2017, 71, 88. [Google Scholar] [CrossRef]
  51. Suriyaprasanth, S.; Choi, H.; Gupta, D. Electron and positron impact ionization of SF6−nHn(n = 0–6); (SCln, SFn−1Cl(n = 1–6)) and SF5X(X = CN, CFO). Atoms 2023, 11, 137. [Google Scholar] [CrossRef]
  52. Wu, D.; He, X.T.; Yu, W.; Fritzsche, S. Monte Carlo approach to calculate ionization dynamics of hot solid-density plasmas within particle-in-cell simulations. Phys. Rev. E 2017, 95, 023208. [Google Scholar] [CrossRef]
  53. Pooser, R.C.; Marino, A.M.; Boyer, V.; Jones, K.M.; Lett, P.D. Quantum correlated light beams from non-degenerate four-wave mixing in an atomic vapor: The D1 and D2 lines of 85Rb and 87Rb. Opt. Express 2009, 17, 16722–16730. [Google Scholar] [CrossRef]
  54. Herrnstein, J.R.; Moran, J.M.; Greenhill, L.J.; Diamond, P.J.; Inoue, M.; Nakai, N.; Miyoshi, M.; Henkel, C.; Riess, A. A geometric distance to the galaxy NGC4258 from orbital motions in a nuclear gas disk. Nature 1999, 400, 539–541. [Google Scholar] [CrossRef]
  55. Nikonova, R.M.; Lad’yanov, V.I.; Rekhviashvili, S.S.; Pskhu, A.V. Thermal stability of C60 and C70 fullerites. High Temp. 2021, 59, 179–183. [Google Scholar] [CrossRef]
  56. Borodin, V.I.; Trukhacheva, V.A. Thermal stability of fullerenes. Tech. Phys. Lett. 2004, 30, 598–599. [Google Scholar] [CrossRef]
  57. McWhirter, R.W.P. Plasma Diagnostic Techniques; Huddleston, R.H., Leonard, S.L., Eds.; Academic Press: New York, NY, USA, 1965. [Google Scholar]
  58. Desch, S.J.; Mouschovias, T.C. The magnetic decoupling stage of star formation. Astrophys. J. 2001, 550, 314–333. [Google Scholar] [CrossRef]
Figure 1. (a) Effective potential for the valence electron with l = 0 of the confined ion: electrostatic ( V s t ), GASW ( V G A S W ), polarization ( V p o l ), and (b) a radial plot of the GASW potential with and without polarization for U 0 = 0.259 au.
Atoms 13 00036 g001
Table 1. Configuration states of Sr+ for calculations.
ConfigurationsStatesParity ( 1 ) l
ing X 5 s 1 5 2 S 1 / 2 even
X 4 d 1 4 2 D 3 / 2 even
X 4 d 1 4 2 D 5 / 2 even
X 5 p 1 5 2 P 1 / 2 odd
X 5 p 1 5 2 P 3 / 2 odd
X 5 d 1 5 2 D 3 / 2 even
X 5 d 1 5 2 D 5 / 2 even
X 6 s 1 6 2 S 1 / 2 even
X 6 p 1 6 2 P 1 / 2 odd
X 6 p 1 6 2 P 3 / 2 odd
X 6 d 1 6 2 D 3 / 2 even
X 6 d 1 6 2 D 5 / 2 even
Disclaimer/Publisher’s Note: The statements, opinions and data contained in all publications are solely those of the individual author(s) and contributor(s) and not of MDPI and/or the editor(s). MDPI and/or the editor(s) disclaim responsibility for any injury to people or property resulting from any ideas, methods, instructions or products referred to in the content.

