Abstract
A novel, semi-autonomous radiological scanning system for inspecting irregularly shaped and radiologically uncharacterised objects in various orientations is presented. The system utilises relatively low cost, commercial-off-the-shelf (COTS) electronic components, and is intended for use within relatively low to medium radioactive dose environments. To illustrate the generic concepts, the combination of a low-cost COTS vision system, a six DoF manipulator and a gamma radiation spectrometer are investigated. Three modes of vision have been developed, allowing a remote operator to choose the most appropriate algorithm for the task. The robot arm subsequently scans autonomously across the selected object, determines the scan positions and enables the generation of radiological spectra using the gamma spectrometer. These data inform the operator of any likely radioisotopes present, where in the object they are located and thus whether the object should be treated as LLW, ILW or HLW.
1. Introduction
The determination of radioactivity within waste is of vital importance within the nuclear industry in general. Sorting and segregation operations are an example of this, in which waste is categorised into very low-level waste (VLLW), low-level waste (LLW), intermediate-level waste (ILW) and high-level waste (HLW), depending on the type and activity of radioactivity emitted. Depending on which category the item corresponds to, the disposal cost can vary dramatically with rough costs of ~GBP 3000/m3 for LLW, ~GBP 50,000/m3 for ILW and ~GBP 500,000/m3 for HLW [1,2,3]. Thus, rather than taking a worst-case scenario approach and treating everything as HLW, it is financially prudent to categorise waste correctly before disposal. The robotic systems used within sorting and segregation operations are still typically tele-operational, since automated systems are not yet at a stage where trust levels are such that the industry would allow a “no human in loop” situation. Research into robotics within the nuclear industry has increased significantly over the last decade or so, with numerous projects in this area such as the RoMaNs project based at the National Nuclear Laboratory [4], the extensive work by Stolkin et al. [5,6,7,8] and work inspired by events such as the Fukushima Daiichi NPP disaster of 2011 [9,10,11,12,13,14,15,16].
A common but mistaken assumption is that only radiation-hardened robotics should be used within the nuclear industry, hence hydraulically actuated robots [17,18,19,20,21,22] and platforms that feature radiation-hardened components [23] have traditionally been in favour. Although this may be true for operations within high-radiation environments such as hot cells, other typical nuclear environments exhibit radiological levels which may be too high for daily human exposure but are not sufficient to damage conventional hardware. For a worker to receive a dose of 1 mSv over the course of a day would be seen as very high and almost certainly not As Low As Reasonably Practicable (ALARP). However, this dose is virtually irrelevant to COTS electronic components, where radiation hardness testing tends to begin at around five or six orders of magnitude higher than this [23]. Thus, although commercially available robotic platforms may not be useable within the primary containment vessel of a nuclear reactor, for example, they may be useable within activities such as the categorisation of general waste. Hence, at present in the UK, an increasing volume of research involves the development of large-scale industrial robot platforms designed for locations with relatively low radiological activity, e.g., [24,25]. There have been other radiation detectors which have been attached to robots before. An example is Miller et al. [26] who attached a LaBr3 detector to a small-wheeled robot that was subsequently driven semi-autonomously around an uncharacterised area, with 37 MBq 137Cs sources successfully located in various places. The sensor is collimated and is designed to radiologically scan the visible area. Further, White et al. [2] used a KUKA 150 KR to raster scan over a tabletop featuring several radiological sources. A LIDAR system was used here to determine the profile of the sources upon the table and thus maintain a consistent distance between detector and object.
In this context, the present article concerns the development of a novel, three-mode, semi-autonomous, radiological scanning system capable of inspecting uncharacterised and irregularly shaped objects for contamination. The research has focused on low-cost solutions where possible, i.e., utilising components that can be purchased cost-effectively. The work builds on the limited, single-mode results attained in previous work by Monk et al. [27]. The present article expands on this preliminary work to now fully describe the proposed system and present new results to evaluate its operation within more complex and realistic scenarios.
Section 2 discusses the various system components, including the overall configuration, the vision system, robot hardware and gamma ray spectrometer used. The software algorithm developed to autonomously determine the required pose to be taken by the manipulator is described in Section 3 before the use of RGB and depth sensor is discussed in Section 4. Section 5 contains details of experimentation undertaken in order to validate the system, followed by further discussion and conclusions in Section 6 and Section 7, respectively.
2. System Components and Setup
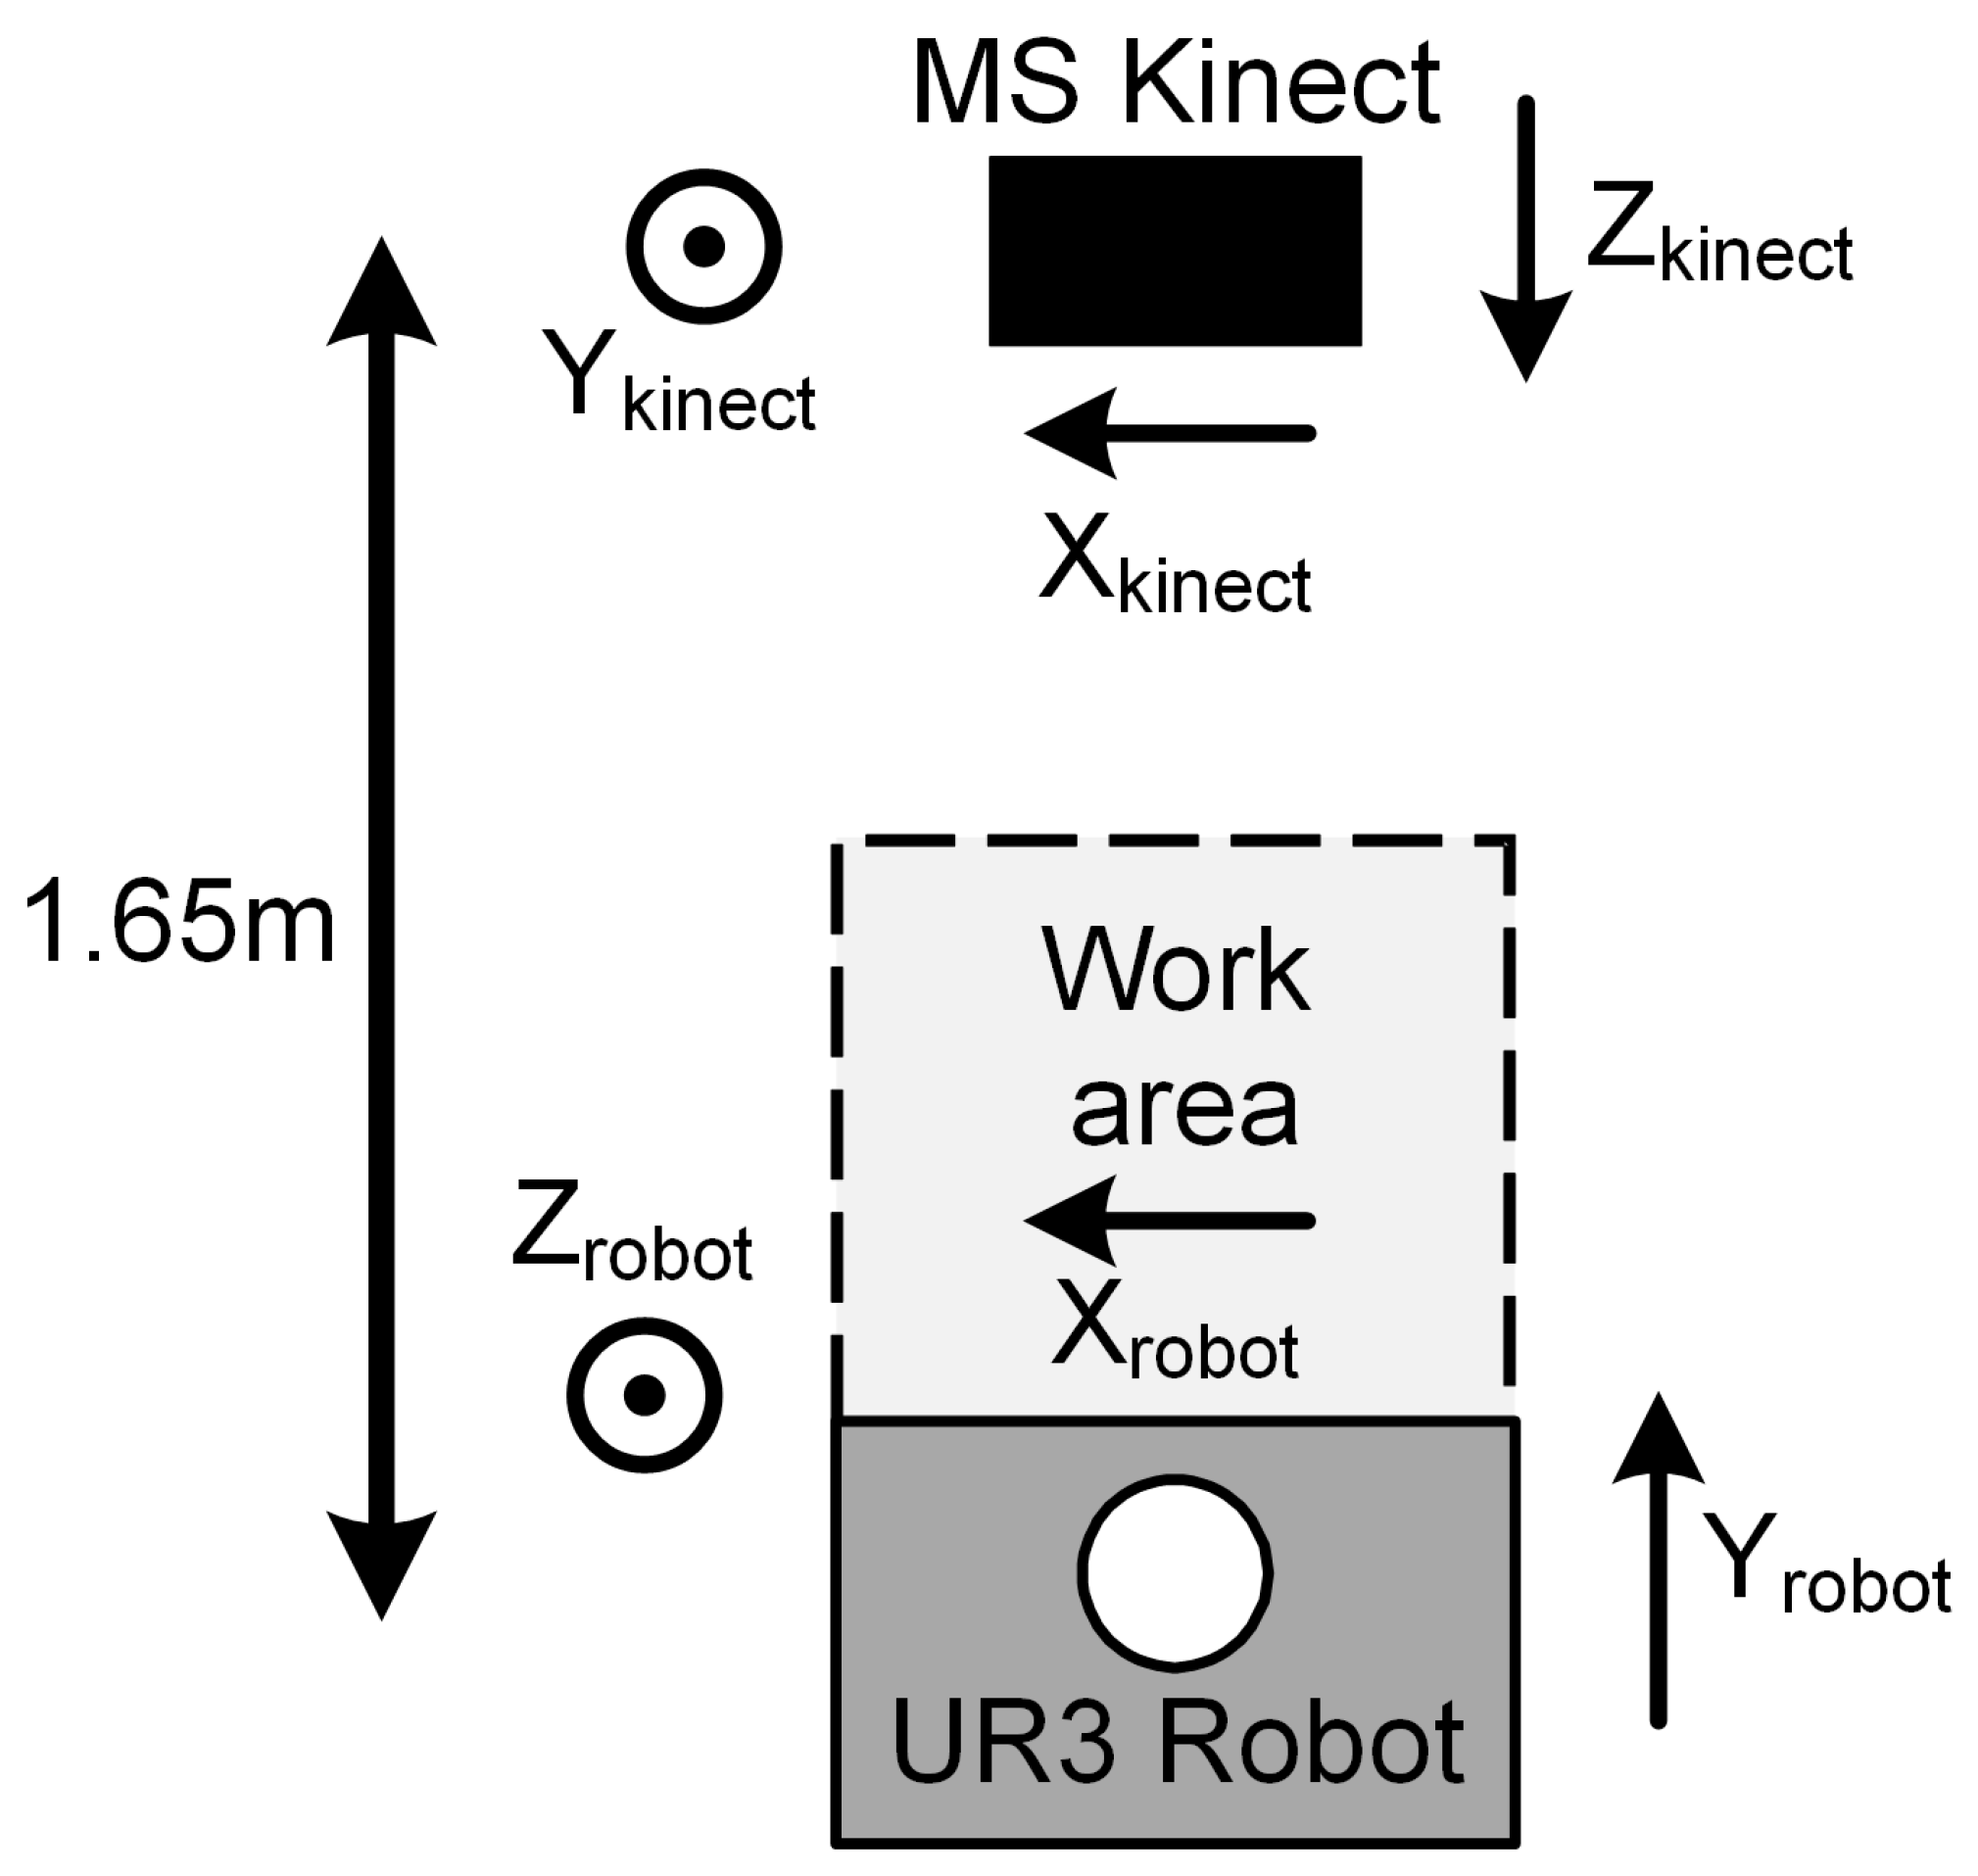
The system developed here consists of a Microsoft Kinect V2 3D vision system, a six DoF UR3 robot (Universal Robots) and a Kromek RadAngel Cadmium Zinc Telluride (CZT) crystal-based radiation detector. These components are linked and controlled via code developed by the authors using the MATLAB 2019a software environment, with connection to peripherals via USB and ethernet. The number of scan positions chosen is entirely down to the operator and is simply a trade-off between accuracy and scan time taken. The spectra generated by the Kromek RadAngel is collected within bespoke and freely downloadable software (KSpect [28]) to create a radiological spectrum. In addition, the authors have developed python software to record a series of spectra as the position of the detector changes. The manipulator and vision systems are located on either side of the workspace, as shown in Figure 1.
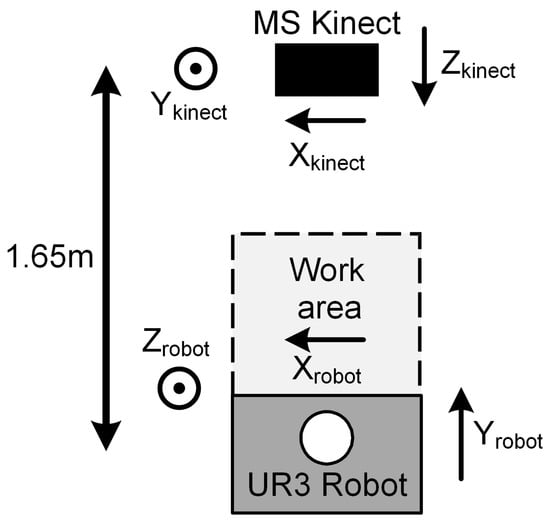
Figure 1.
Top-down view of system setup [27]. Copyright 2020 IEEE.
There are thus two frames of reference considered here: one relative to the Kinect vision system (Xkinect, Ykinect, Zkinect) and one relative to the UR3 robot (Xrobot, Yrobot, Zrobot). As shown in Figure 1, Xkinect is determined as being from right to left in the camera field of view, Ykinect represents top to bottom and Zkinect is depth from the camera location outwards. The robot co-ordinate scheme differs in that Yrobot is taken as from the robot towards the vision system (analogous to Zkinect), and Zrobot is height from the base of the robot (analogous to Ykinect). The X orientation for both the Kinect and robot is the same in each case. The UR3 robot is widely used in research and is described in some detail in [27].
The Microsoft Kinect v2 camera can be purchased at low cost (<GBP 50) due to its popularity and thus mass production. It was released in 2014 and discontinued in January 2018, although it is still used within research environments due to factors such as widely available online support. Although there are more modern vision systems, such as the Orbbec Astra Pro series or the Intel Realsense series, the Kinect sensor is significantly cheaper and thus can be considered sacrificial. Vision system do not typically enjoy the same radiological robustness as other peripherals (such as actuators) due to significant numbers of electronic components, and thus may need to be replaced more often than other elements in the system. The Kinect v2 features an RGB camera with a resolution of 1920 × 1080 pixels, and a field of view of 84.1 by 53.8° [29]. The depth camera operates via a time-of-flight system [30] and features a resolution of 512 × 424 pixels, a field of view of 70.6 × 60° and a depth range of between 0.4 and 4.5 m.
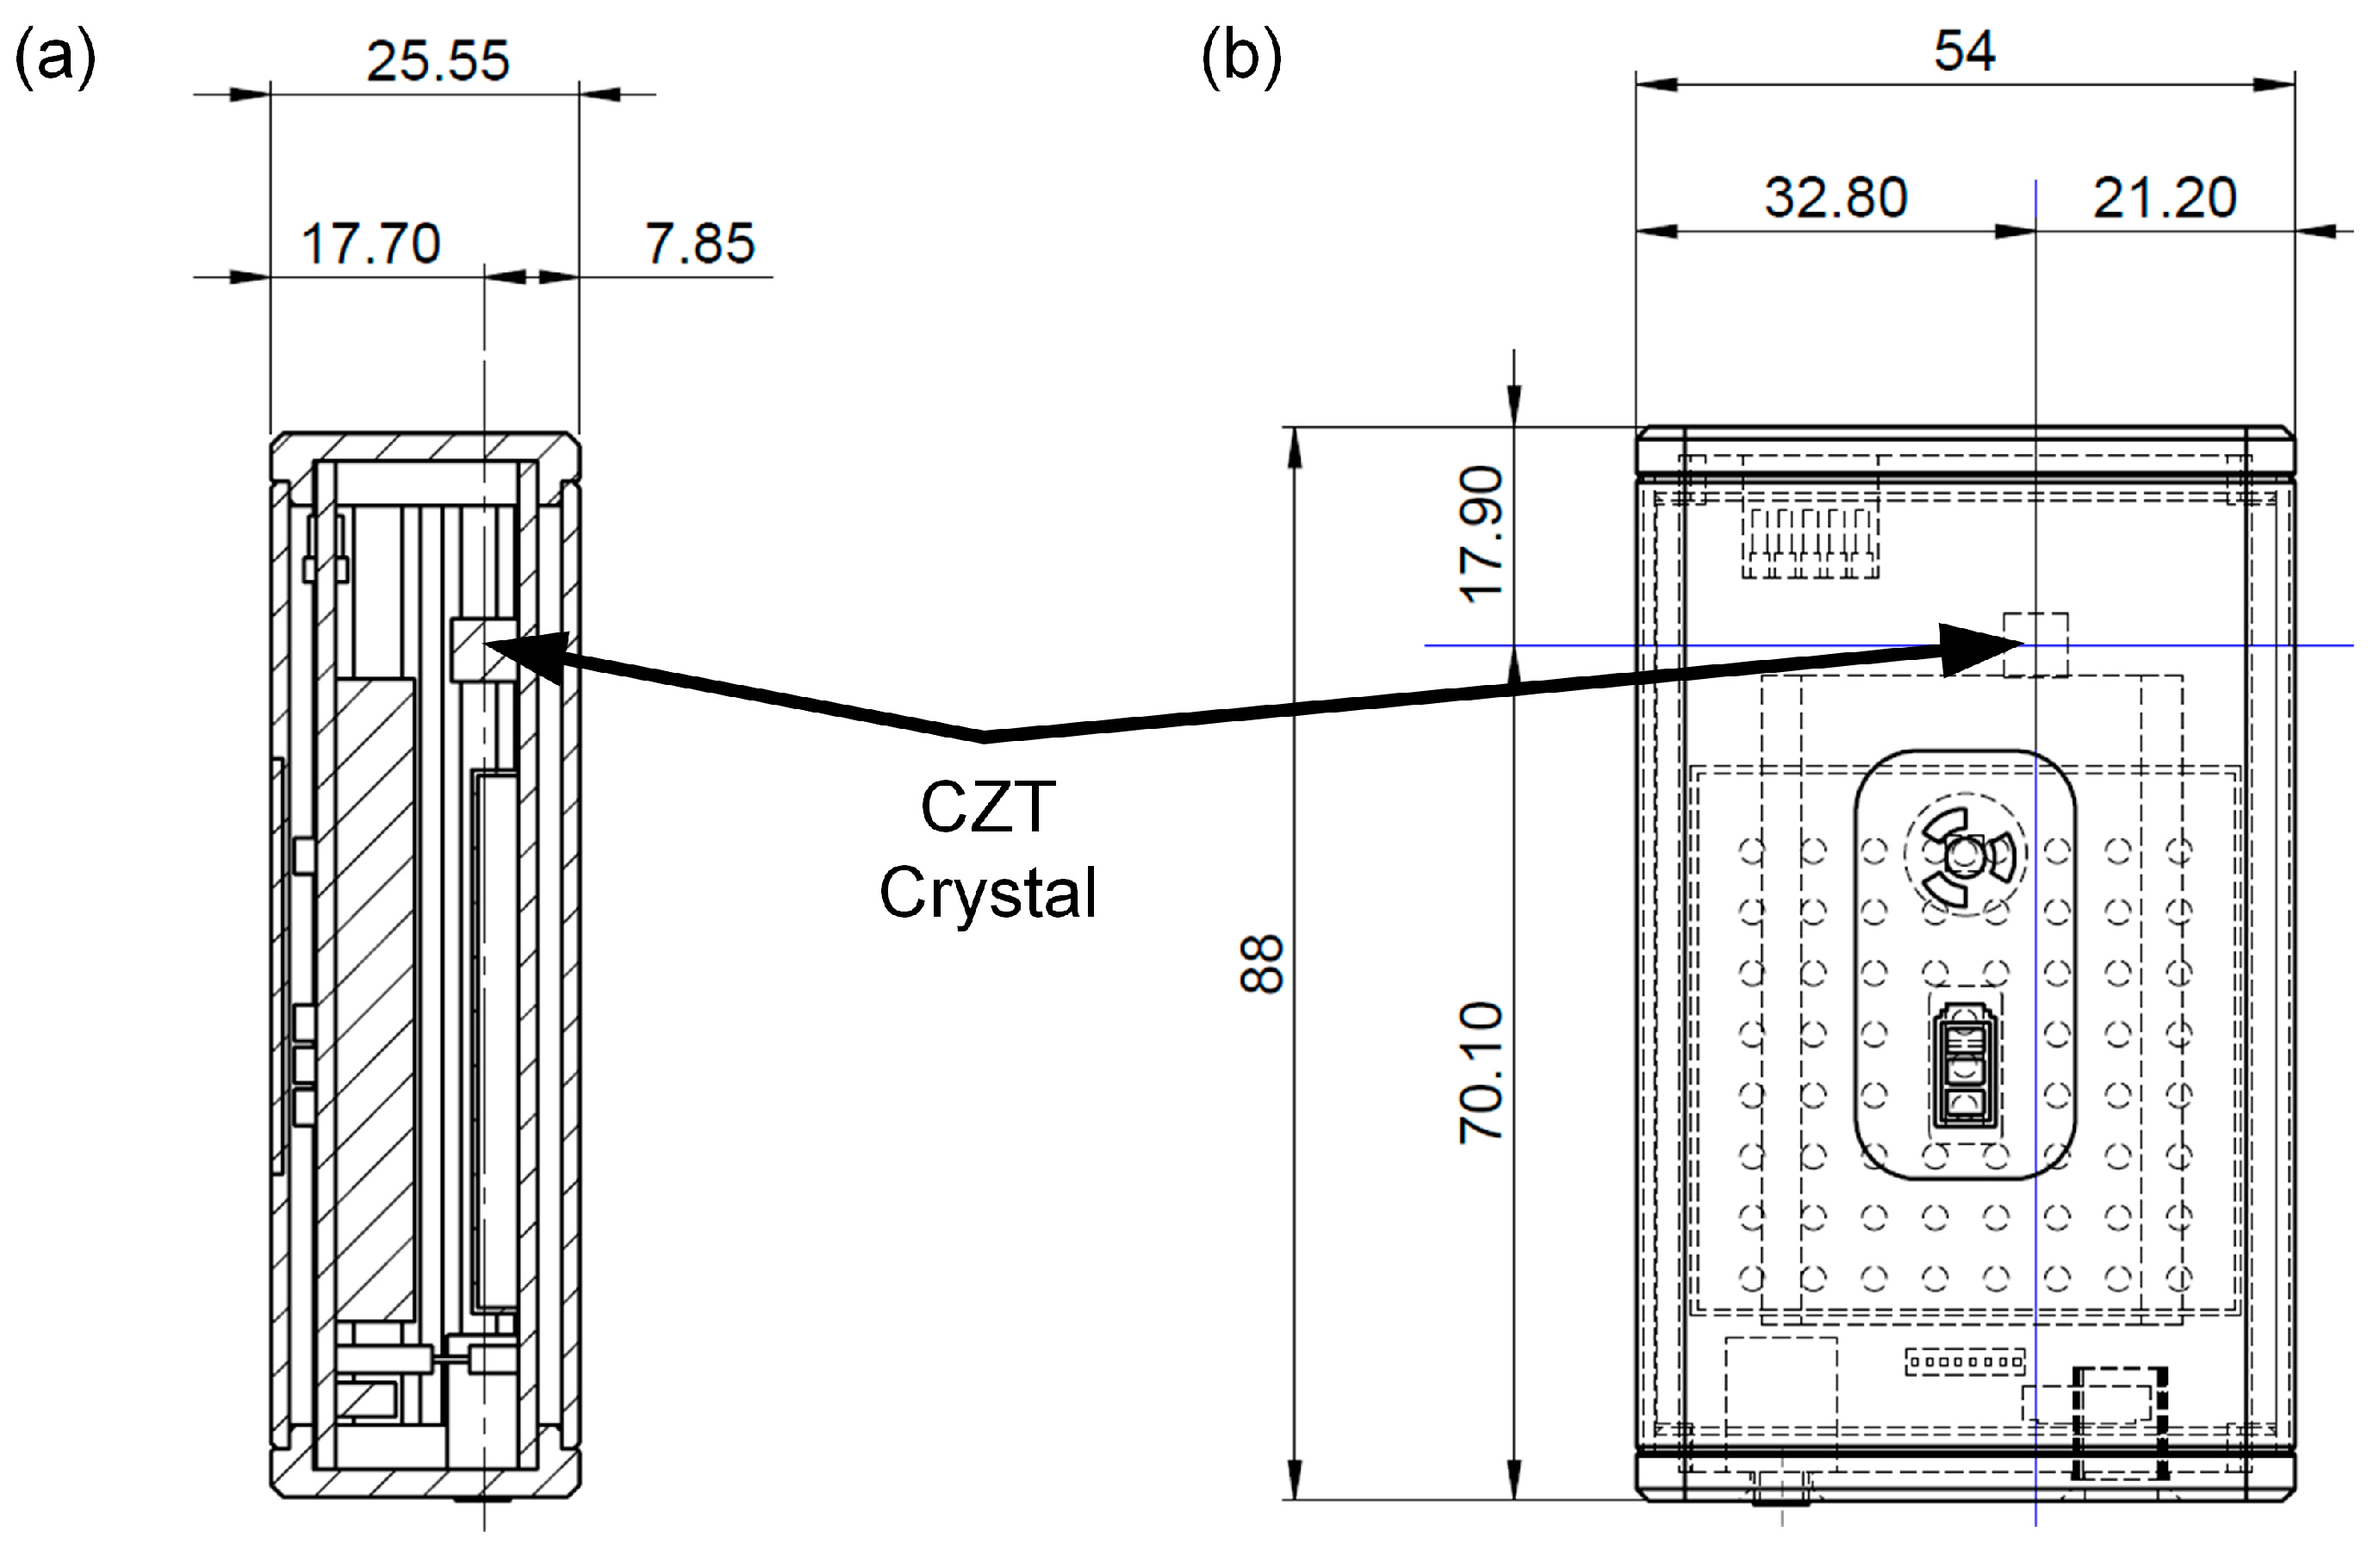
The Kromek RadAngel, shown in Figure 2, is a highly portable and affordable (~GBP 650) 5 mm side-length, cubic CZT crystal-based entry-level gamma ray spectrometer [31]. The overall package size is 90 mm × 55 mm × 25 mm, with a mass of 135 g. The output is over 4096 channels and features a spectral resolution of 3.5% over a range of between 40 and 1500 keV.
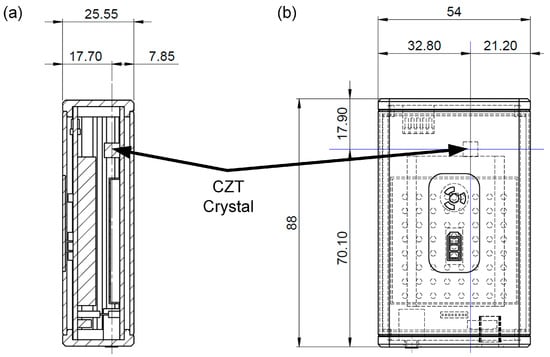
Figure 2.
(a) Side and (b) front view of the Kromek RadAngel. Units are in mm.
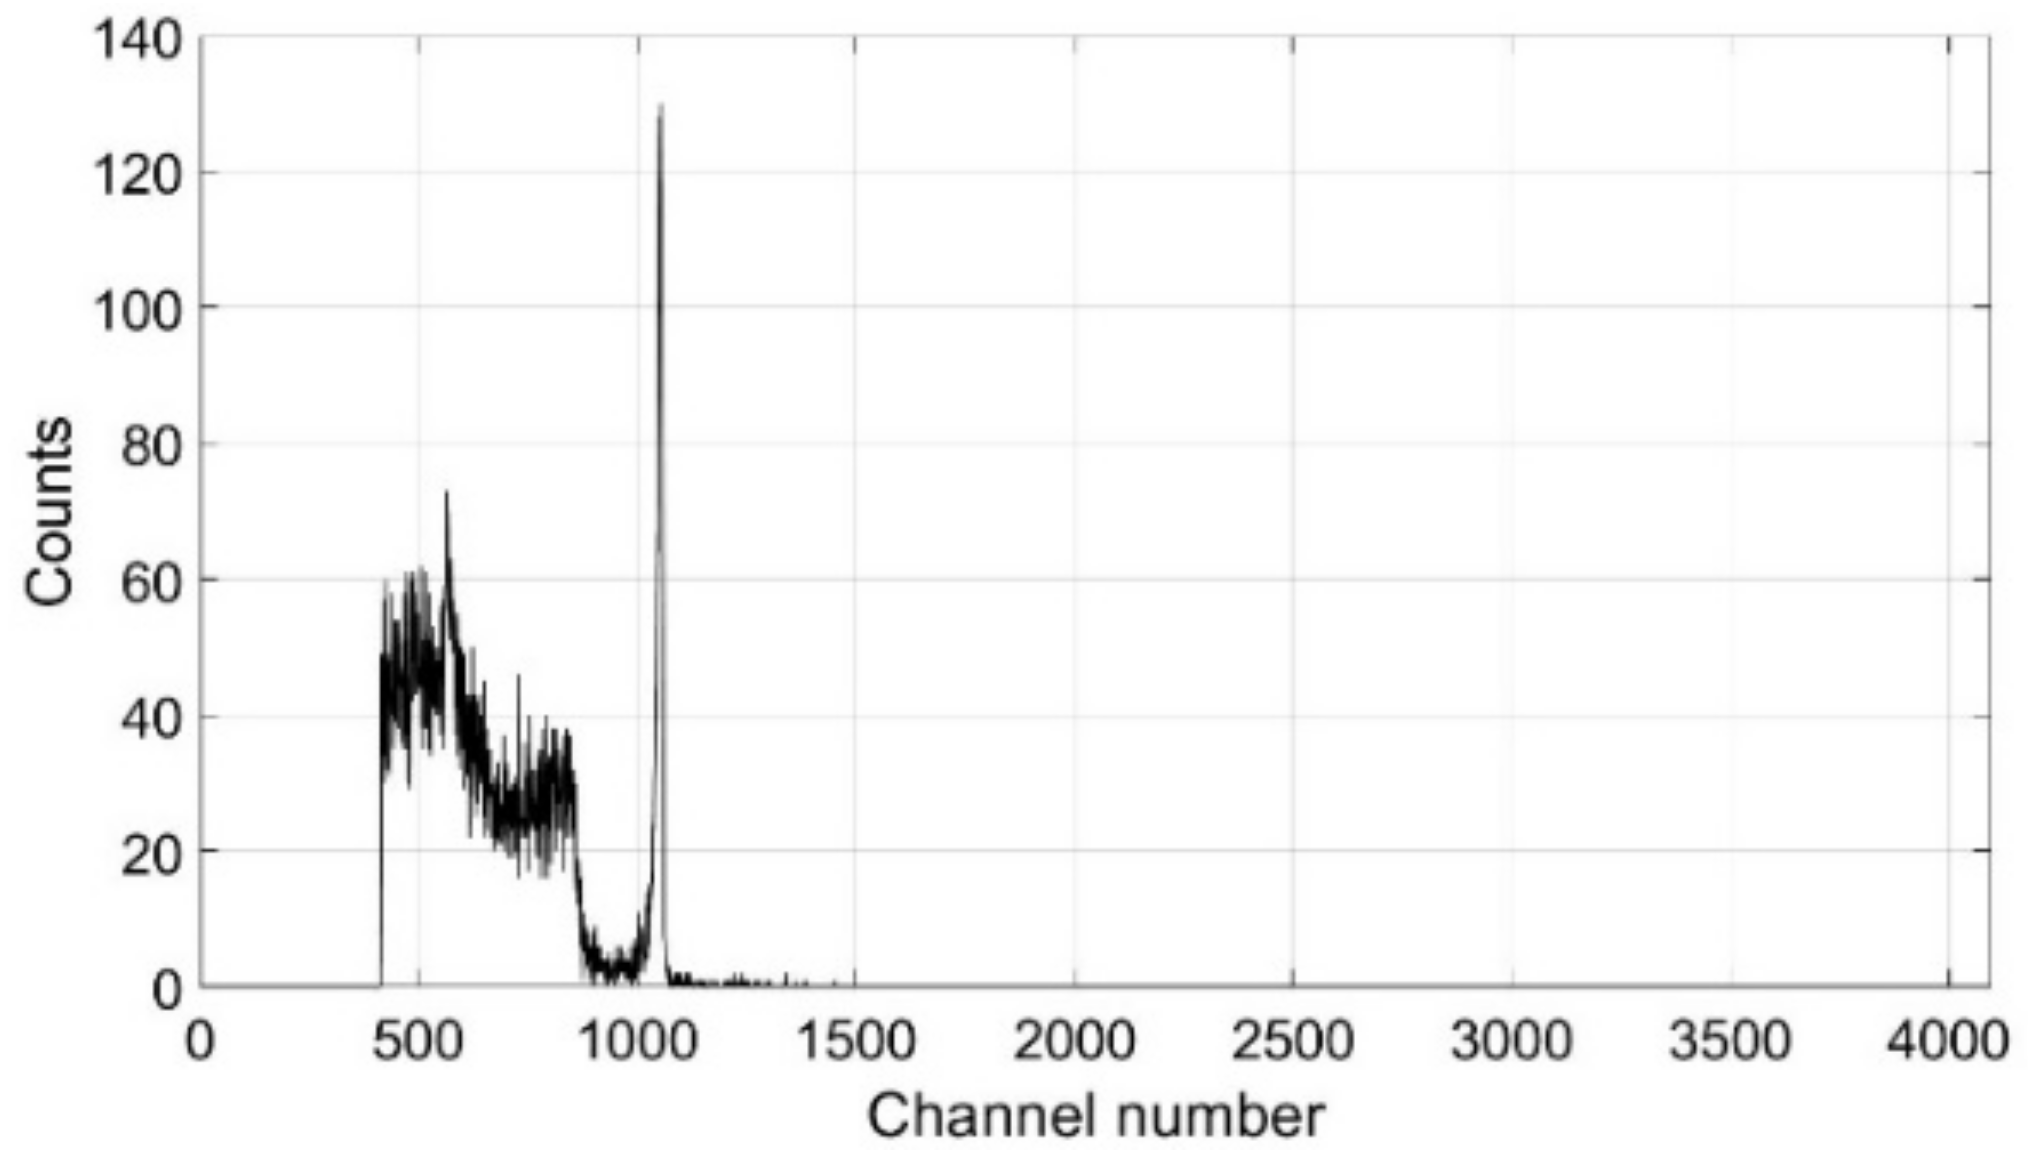
This software was initially utilised here to calibrate the sensor using a 309 kBq 137Cs sealed source as shown in Figure 3. The signature 661.6 keV 137Cs sharp peak is shown to correspond to channel number 1053. A bespoke resourced python script [32] was compiled in a ROS catkin package and was used in the remainder of this work to repeatedly read each detection event into a .CSV file. The package is compiled in ROS Melodic Morenia (the release of ROS at the time of the lab work) allowing a spectrum to be constructed for a user-defined number of seconds over each of the different positions taken by the end effector. The data acquired by the Kromek RadAngel is saved as a 4096 × n grid (where n is the number of scan positions). Further, the Kromek RadAngel was attached to the end effector via a bespoke PLA 3D printed holder.
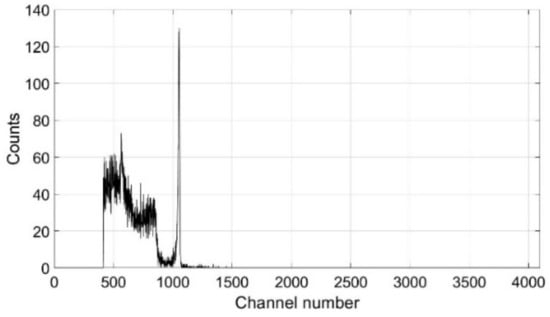
Figure 3.
Calibration using a 309 kBq 137Cs source.
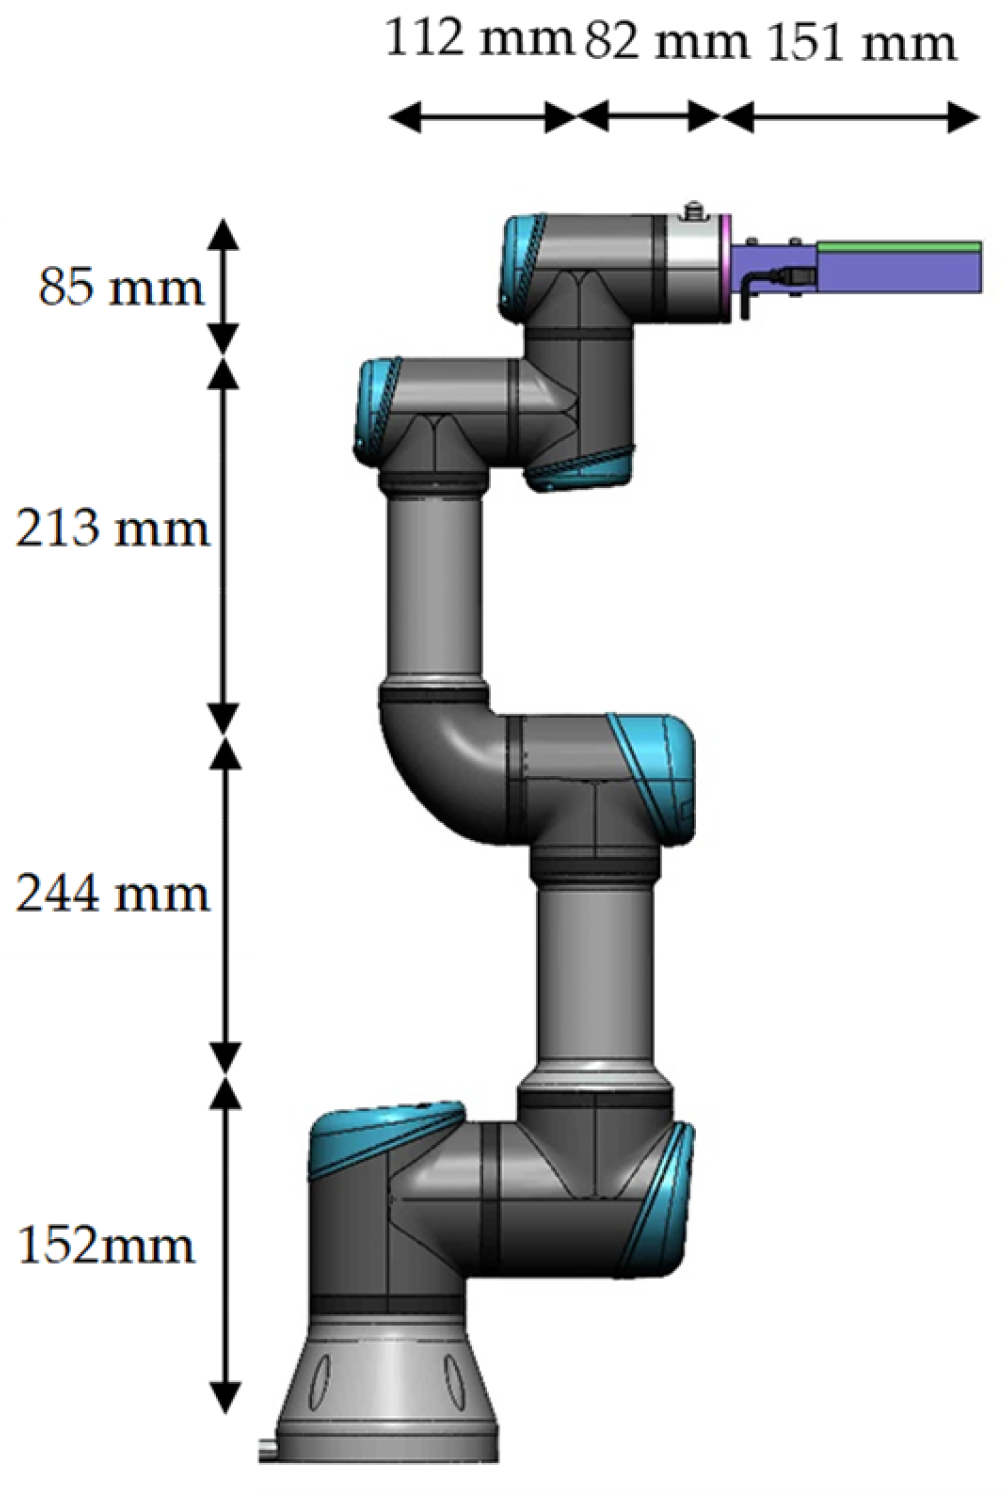
The Universal Robots UR3 possesses six revolute degrees of freedom (DOF), a payload of 3 kg, has a reach of 500 mm and a footprint of Ø128 mm. A diagram of the robot and the attached Kromek RadAngel is shown in Figure 4. The designed temperature range for operations is between 0 and 50 °C, which may preclude the robot from being used in some of the higher-temperature areas within a nuclear facility. Compared to some other commercially available robots, it is also a cost-effective solution at around GBP 15,000.
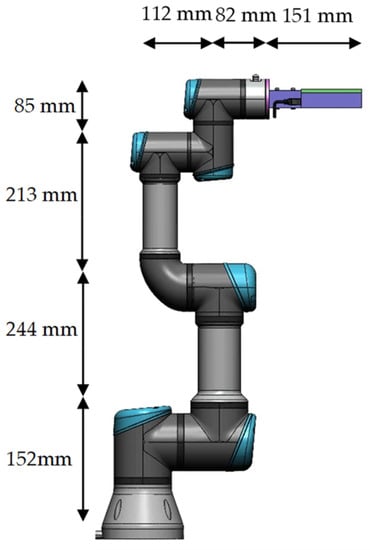
Figure 4.
The UR3 robot and Kromek RadAngel detector.
It is possible to control the platform using third-party software environments, such as python (within ROS) and via MATLAB, using an IEEE 802.3u connection (Fast Ethernet). For the present work, a bespoke program within MATLAB utilises the teach pendant and commands sent through the Ethernet gateway.
An iterative inverse Jacobian technique is used here, utilising the Denavit–Hartenberg parameters of the UR3 robot, as shown in Table 1. One significant limitation in using this technique is the significant period of time that the algorithm is observed to complete within the MATLAB environment, with a delay of several minutes observed in certain scenarios. This is due to the significant overhead required to repeatedly calculate the inverse of the Jacobian matrix. As a back-up in case this problem become significant, a simpler alternative technique was developed using the ikunc function, available within Peter Corke’s robotics MATLAB toolbox [33]. This approach works by minimising the error between the forward kinematics of the joint angle solution and the end effector frame as an optimisation. Regardless of the method used, the set of required joint angles (using the moverobotJoint function) was sent to the embedded code in the UR3 teach pendant. This code has been widely used to control Universal Robot manipulators in this way and can be found freely available on repositories such as Github [34]. It acts as a portal which allows third party software, such as MATLAB, to send commands to the manipulator.

Table 1.
Denavit–Hartenberg parameters for the UR3 robot [35]. Copyright 2020 IEEE.
3. Scan Position Determination Algorithms
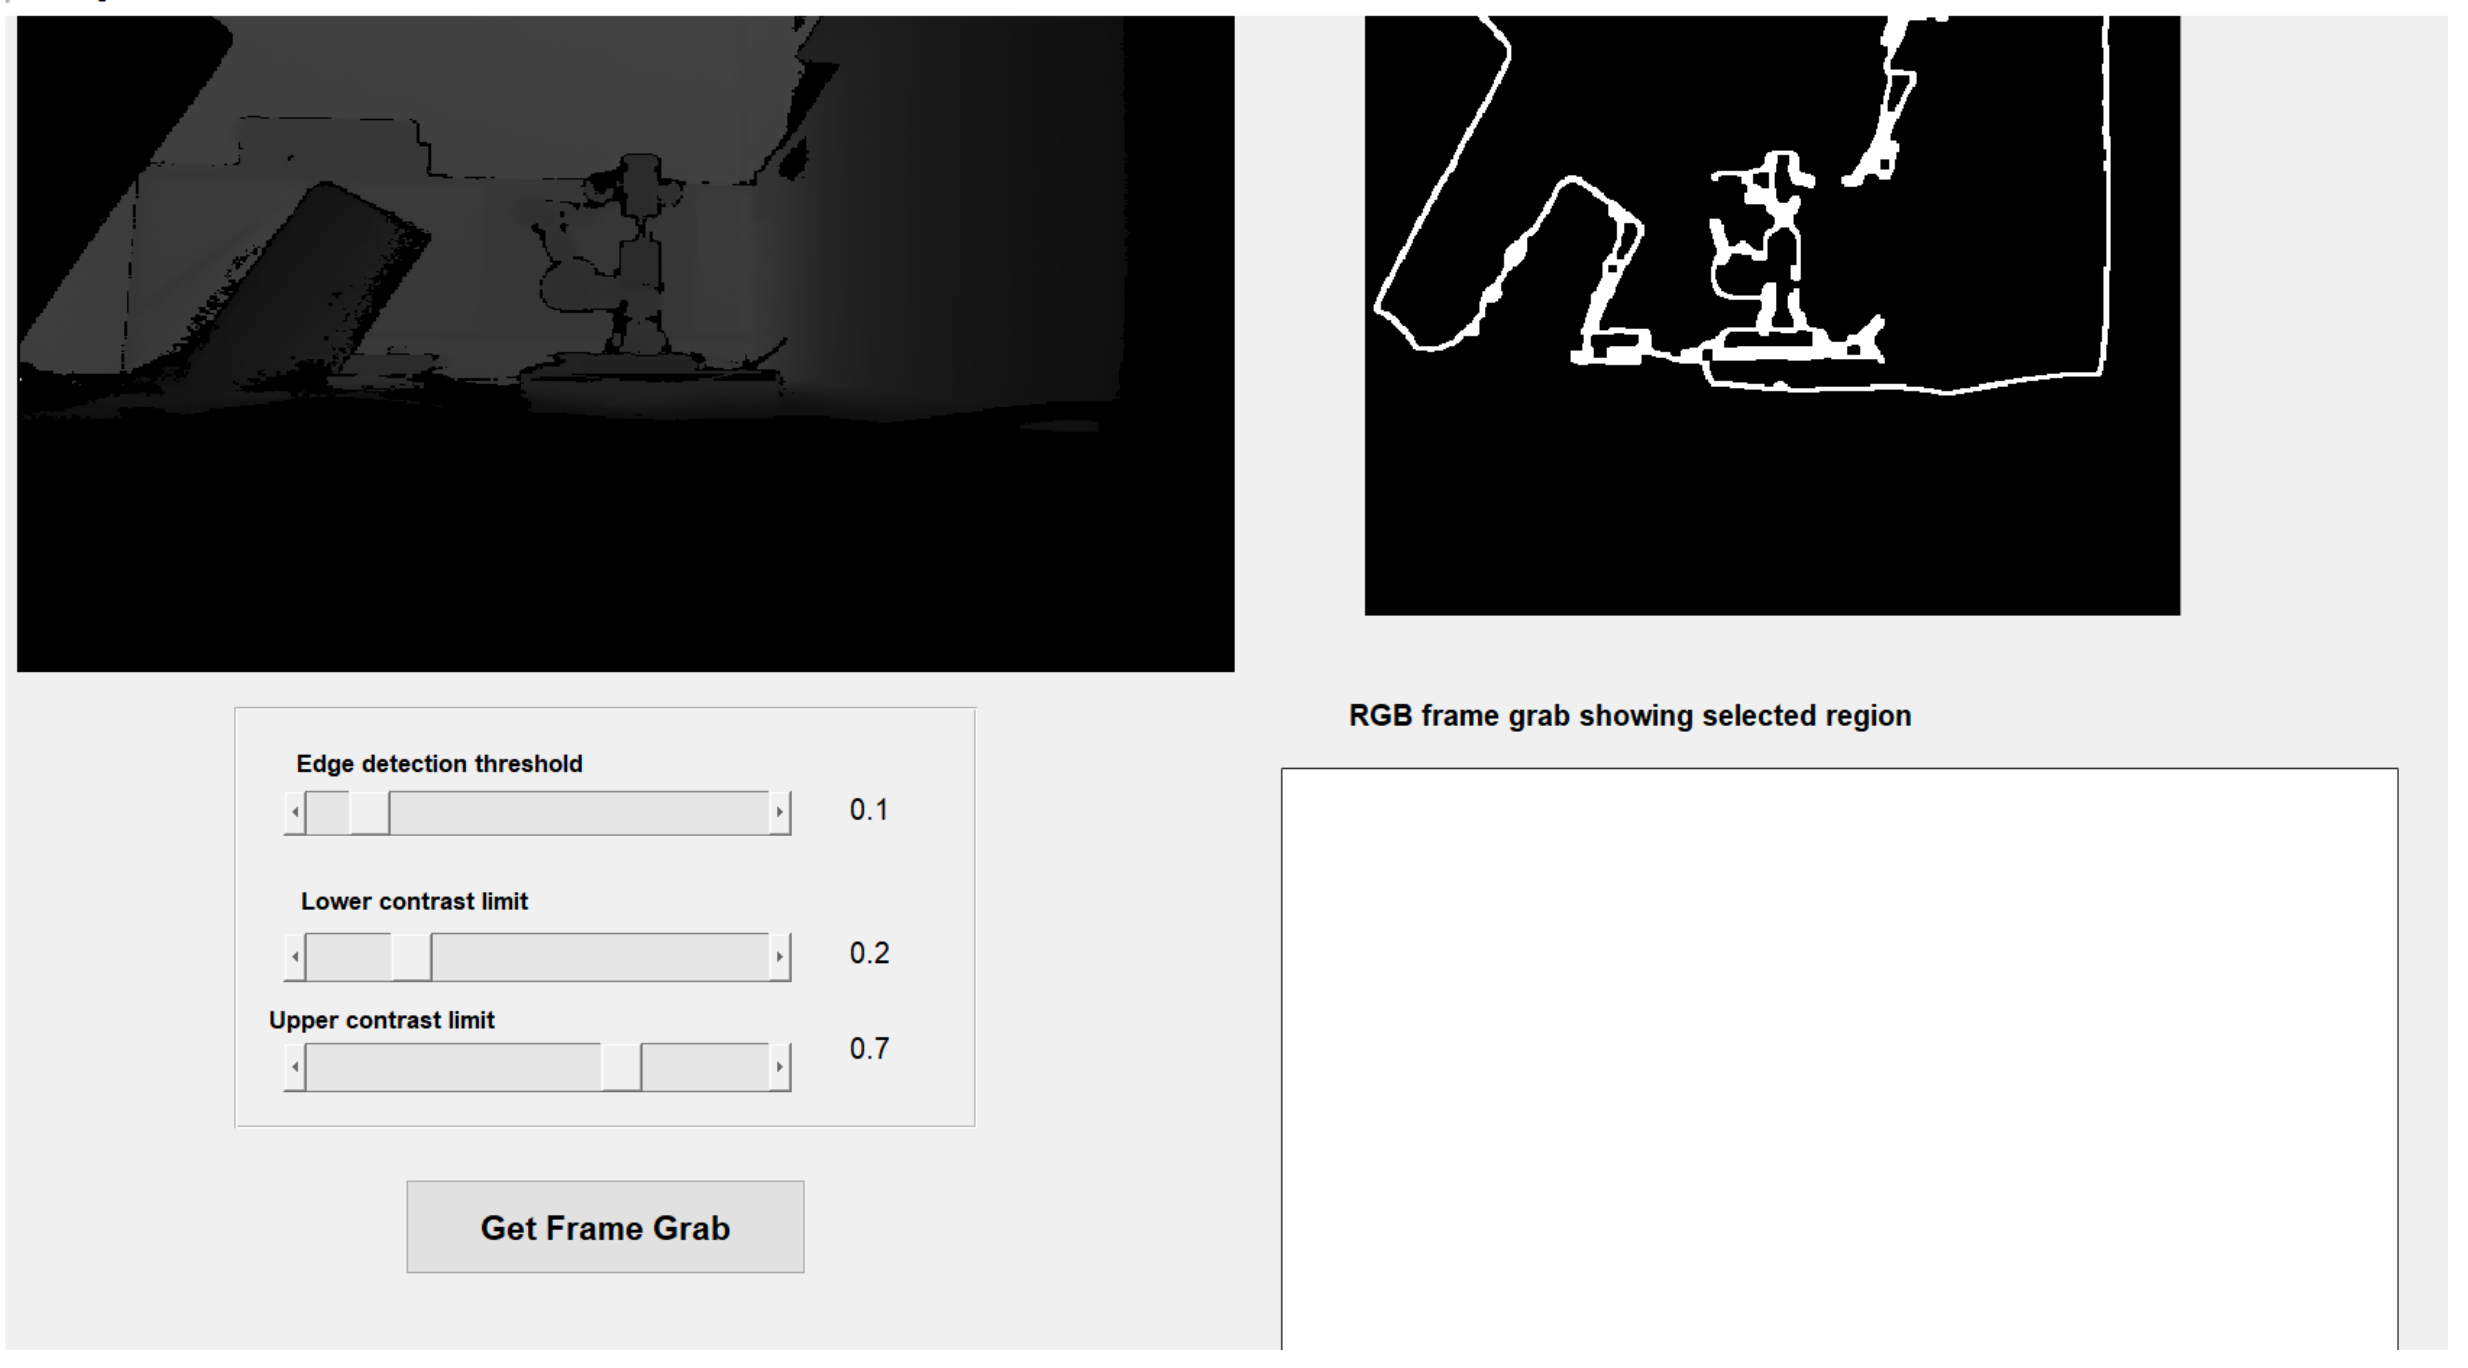
Three bespoke software algorithms have been developed here and are henceforth referred to as modes 1, 2 and 3. Each one determines the scan positions and orientations in slightly different ways. In both mode 1 and mode 2, the Kinect’s RGB camera is utilised to present an image to the operator who then takes a snapshot of the scene by pressing the appropriate button on the screen. A Canny algorithm [36] implemented in MATLAB [37] is used to find interfaces between significantly different colour areas. These interfaces are presented to the operator, who has the option to either continue with the process, change the Canny threshold (thus more or less interfaces are displayed), or to take another snapshot entirely. Mode 3 is similar except that the greyscale image generated by the depth sensor is used in lieu of the RGB image. The object of interest is selected by clicking upon it, whereupon only the relevant interface lines are shown to the operator. The GUI is shown in Figure 5 where mode 3 has been utilised, with depth data illustrated in the greyscale image in the top left. The Canny algorithm has been used to determine interfaces as shown in the top right, and the sensitivity has been maximised by the top slider.
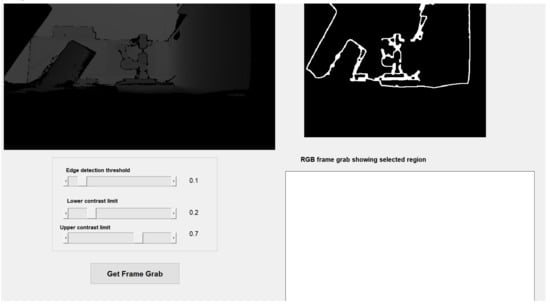
Figure 5.
The GUI in mode 3.
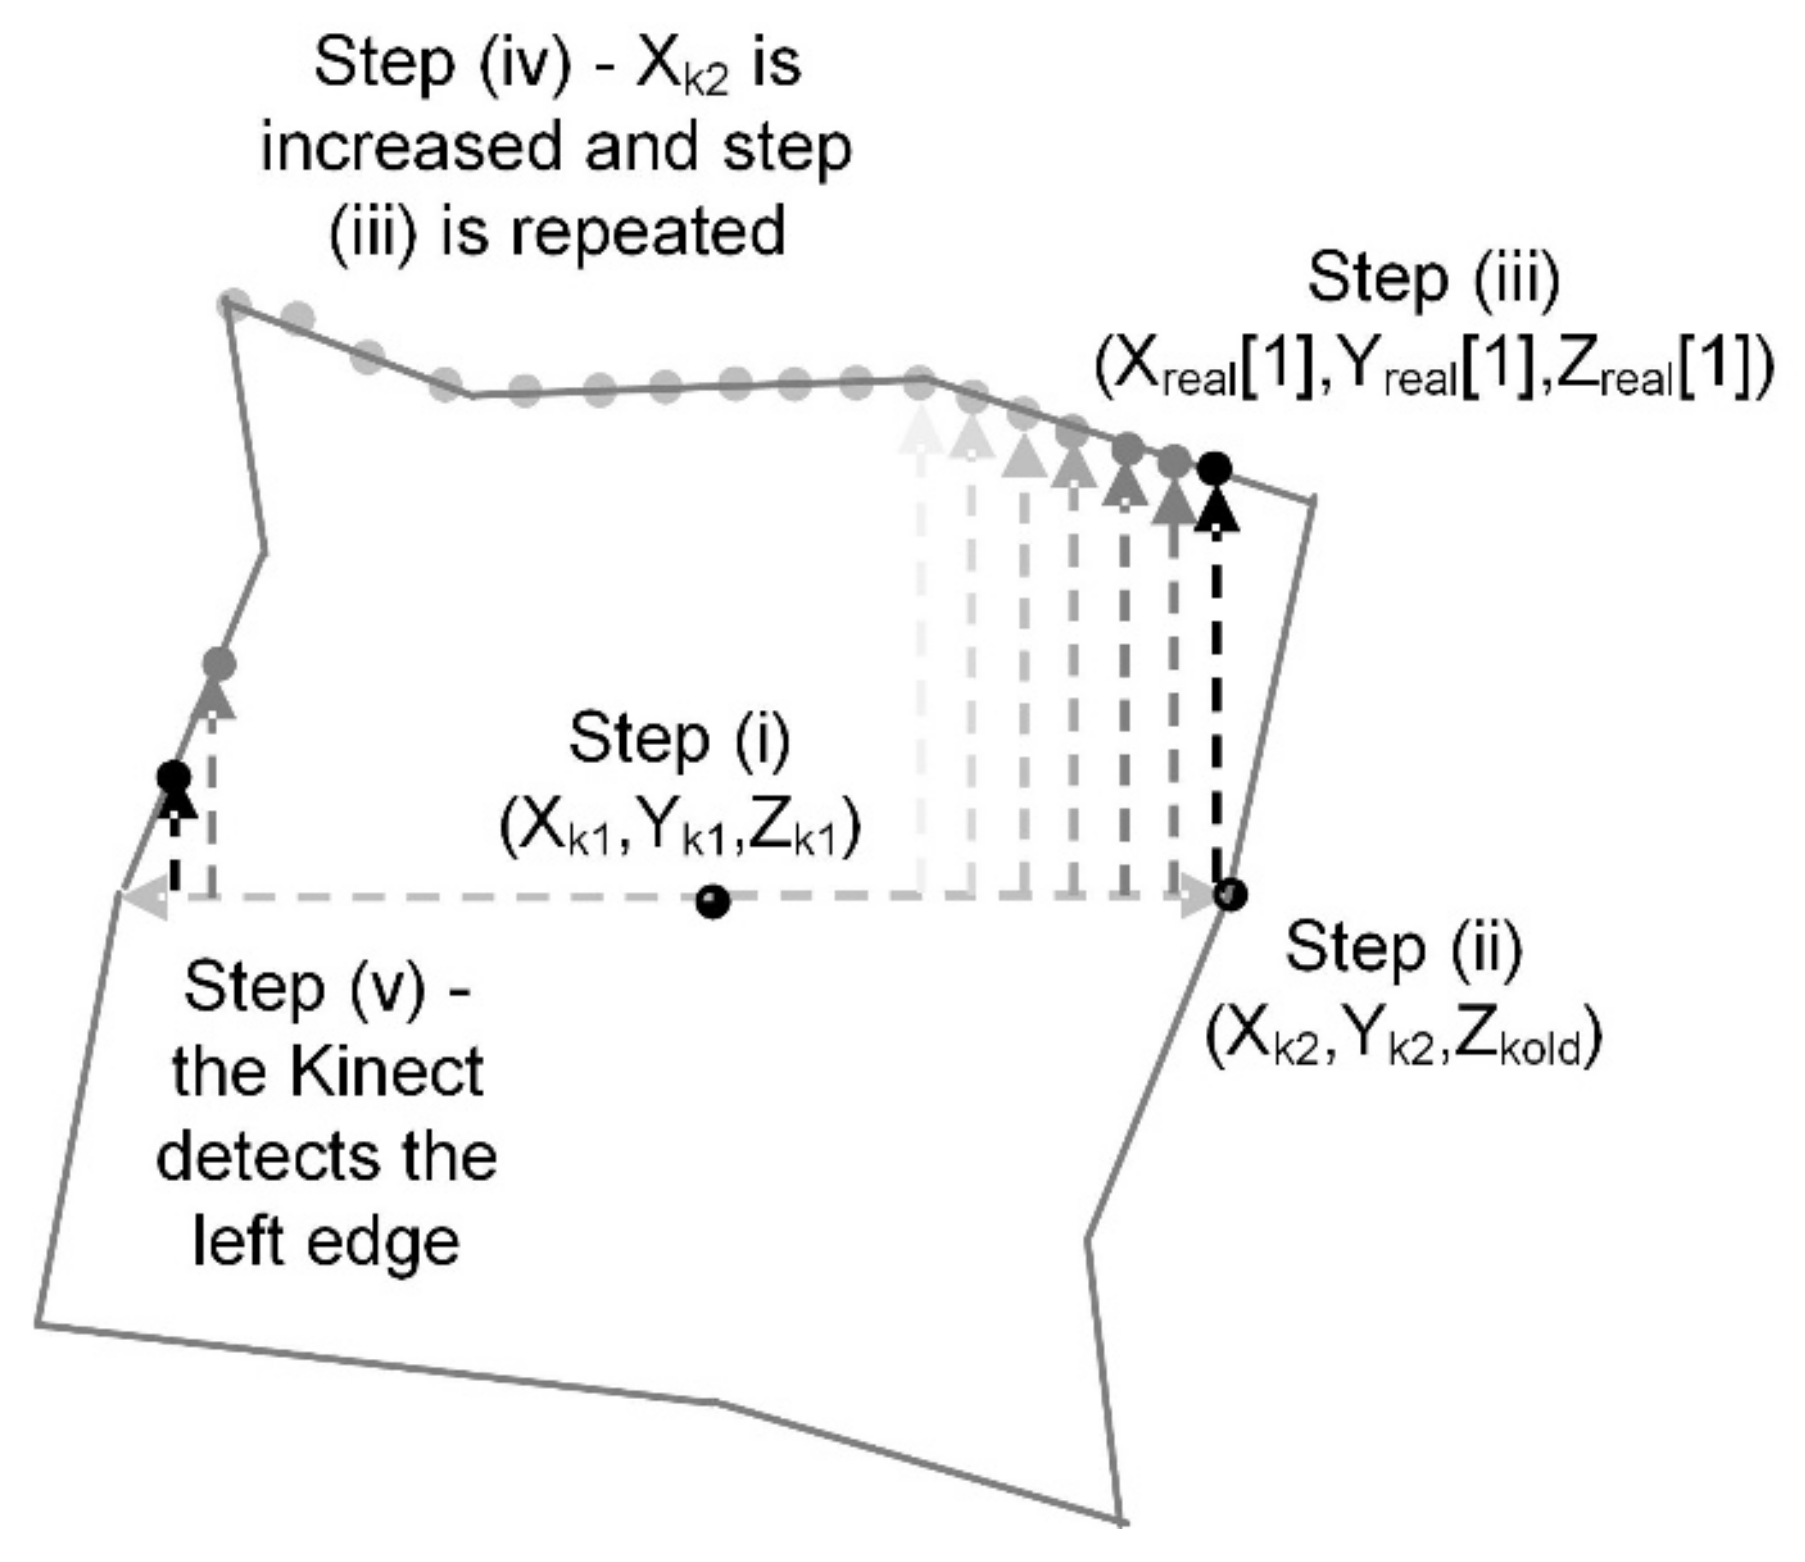
If mode 1 is being utilised then the height, width, orientation and centre of the selected object is determined via the in-built regionprops function [38]. This mode is only relevant if the object is an orthogonal box and thus the scan can occur linearly from the top left to the top right corners. Orientation in three dimensions is detectable within this algorithm via the depth camera and thus the mode is suitable for an orthogonal box in any alignment. Earlier work [27] has been published which describes the algorithm in mode 1, and thus this work concentrates on the two more complex algorithms—modes 2 and 3. The process associated with these two modes features several stages. All values referred to here are in millimetres.
- (i)
- The click to select the object returns three position values, Xk1, Yk1 and Zk1 within the Kinect frame of reference. Temporary values Xk2, Yk2 and Zk2 are also set to the same.
- (ii)
- A while loop algorithm is used to determine the right edge of the object. Within the loop, Xk2 is decremented by one; Zkold is defined as the value of Zkinect before a new value of Zkinect is acquired corresponding to (Xk2, Yk2). This repeats until the acquired value of Zkinect is significantly greater than Zkold, indicating the right edge of the object has been reached.
- (iii)
- Stage (ii) is repeated although instead, Yk2 is decremented by one within a while loop which runs until the new acquired value of Zkinect is significantly larger than Zkold indicating that the top of the object has been reached. Three empty arrays Xreal, Yreal and Zreal are now initialised, with the first element of each of the arrays set to Xk2, Yk2 and Zkold, respectively.
- (iv)
- Xk2 is incremented by one, with Yk2 returned to its original value of Yk1. Then stage (iii) is run again, providing a value of Yk2 to add into Yreal while Xk2 is added to Xreal and Zkold adds to Zreal.
- (v)
- Stage (iv) is repeated with a new value of Zk1 acquired every time Xk2 is incremented, until a large increase in Zk1 is observed. This indicates the left edge of the object has been reached and the three arrays created contain the 3D co-ordinates of the upper edge of the object.
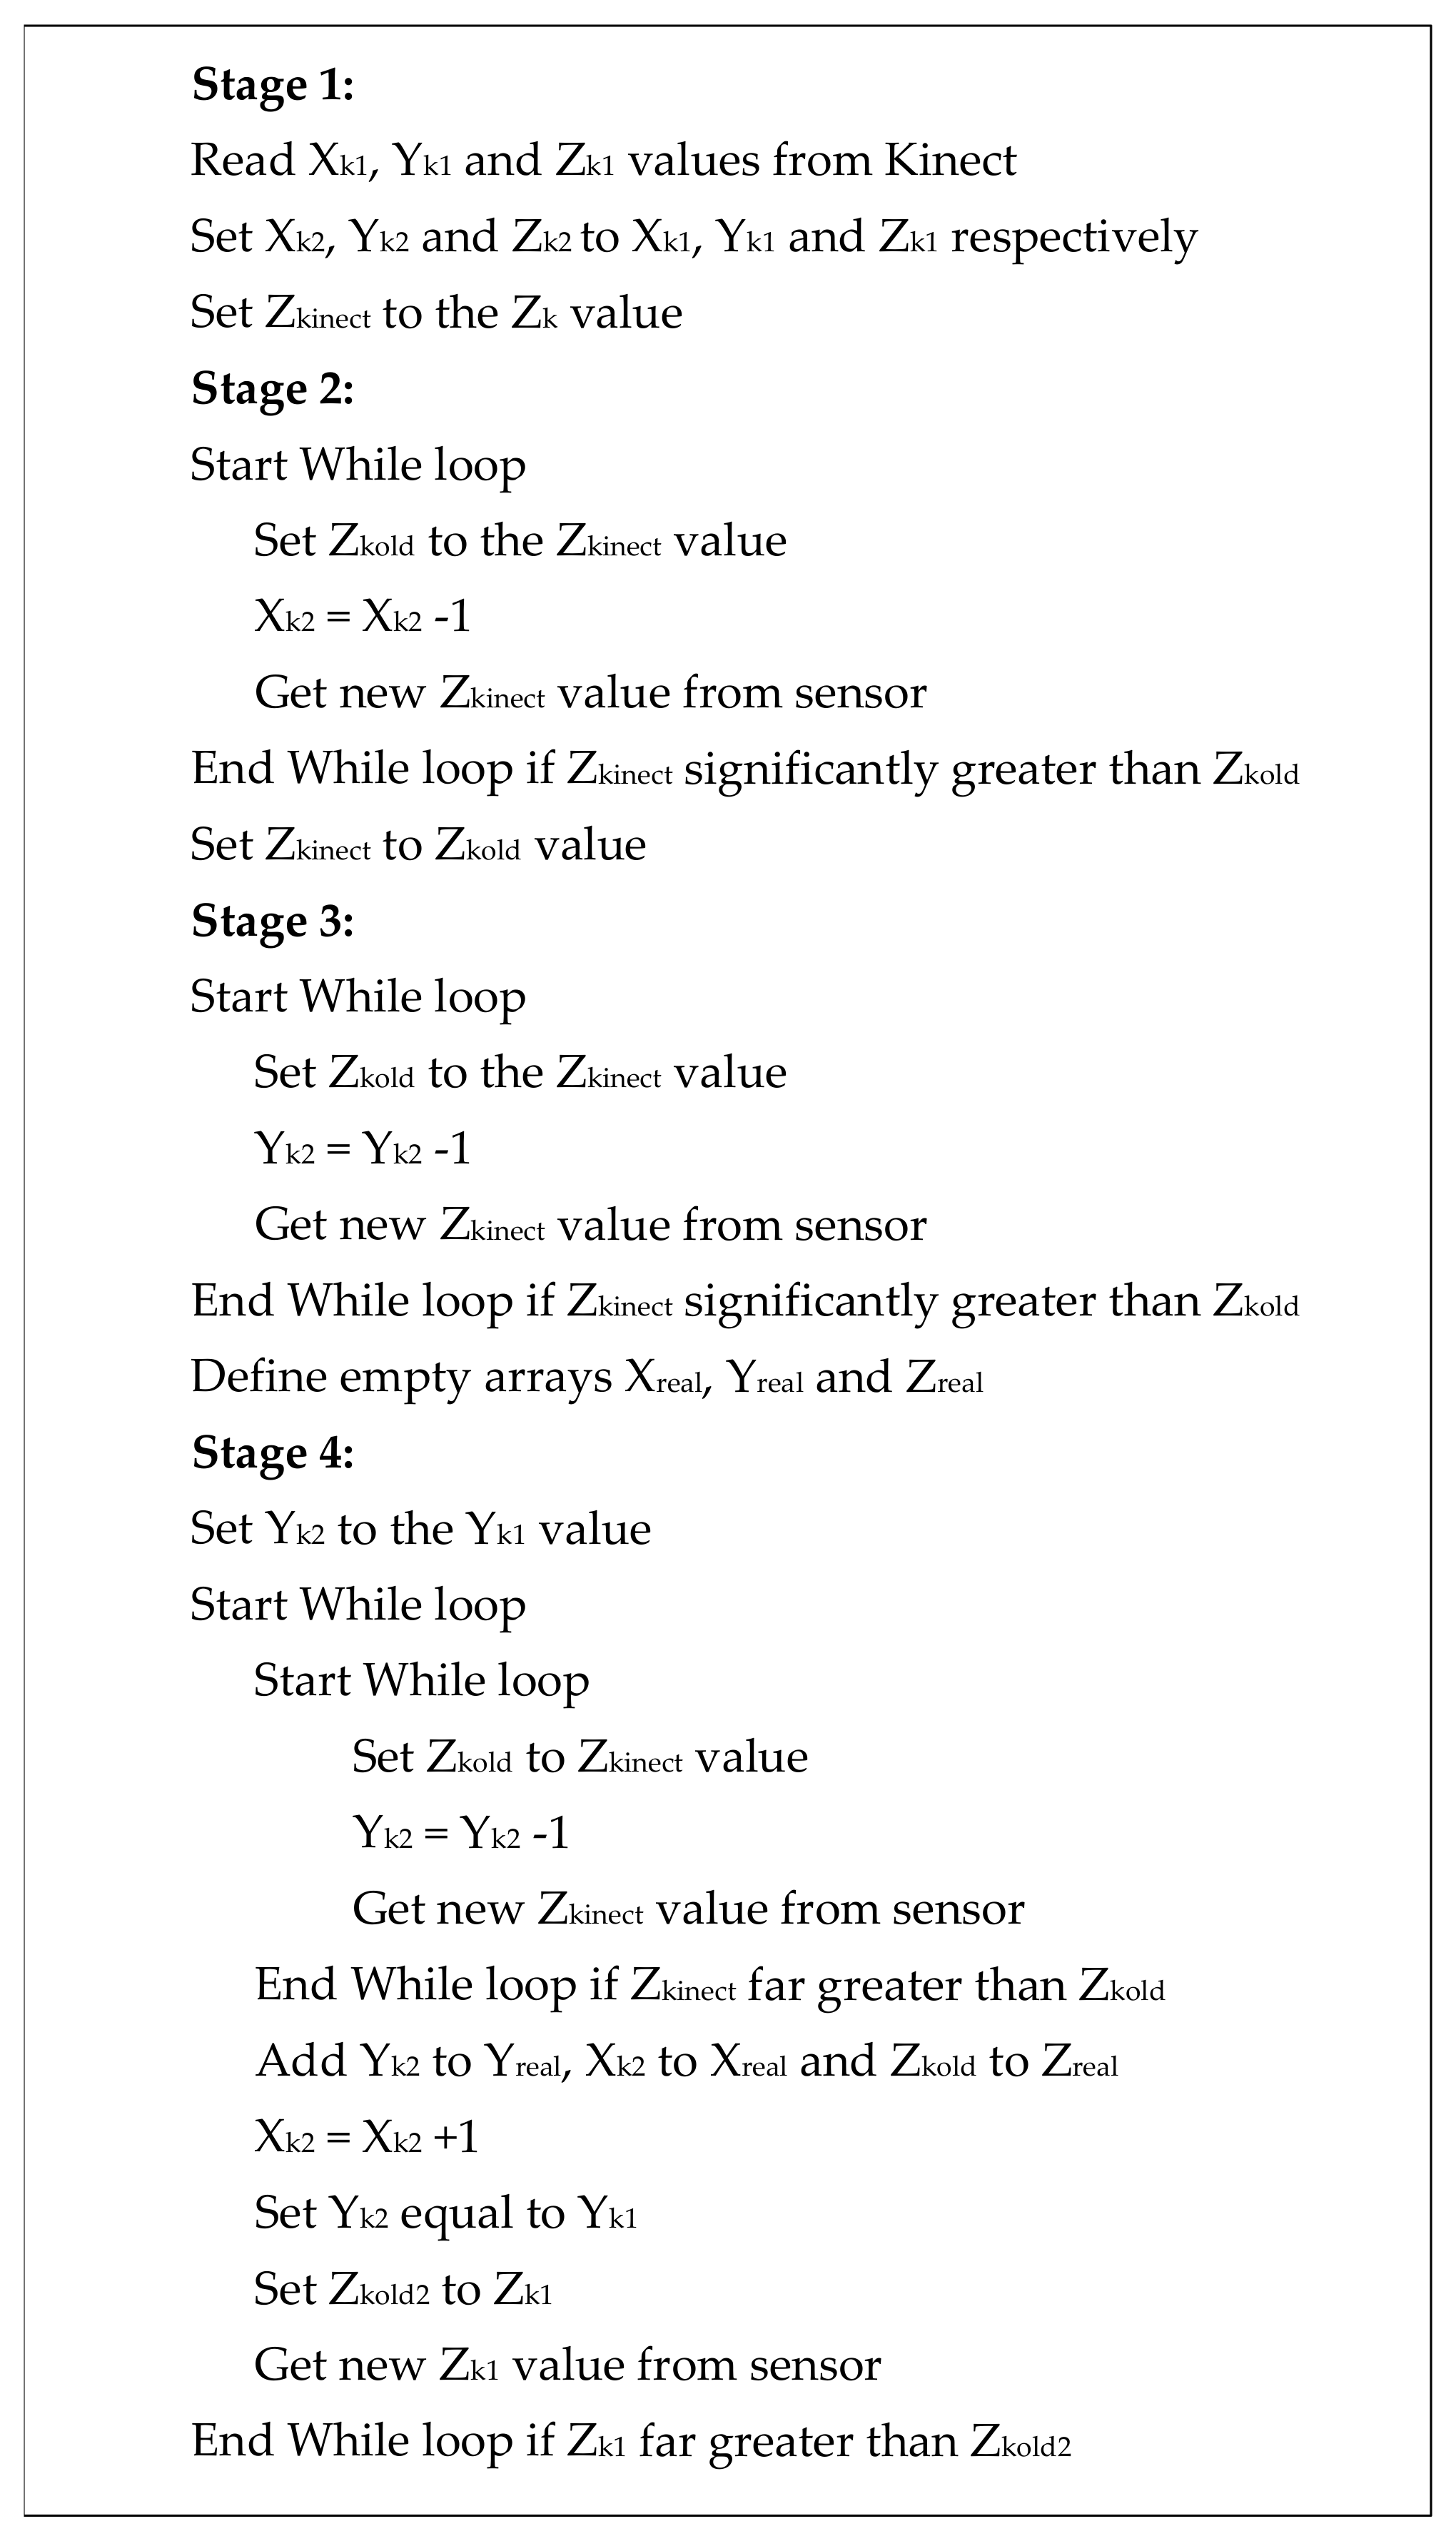
The process is illustrated in Figure 6 and summarised in the form of pseudocode as shown in Figure 7.
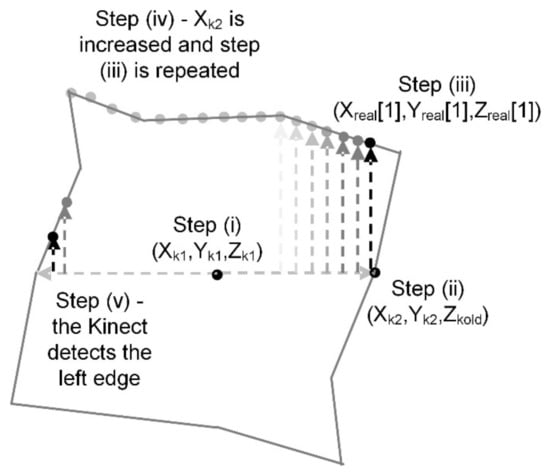
Figure 6.
The five steps to determine the profile of the top of the object.
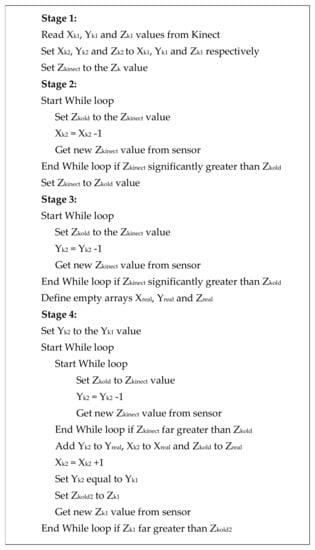
Figure 7.
Pseudo code describing how the top edge determination works.
The Xreal, Yreal and Zreal array values are subsequently converted into cartesian values (relative to the Kinect co-ordinate frame) using simple trigonometry, along with two new values Ykcart and Zkcart—the cartesian values of the position the original mouse-click as above (analogous to the Yk and Zk in stage (i) above). Due to differences in the resolution and range of the RGB and depth sensors, the numbers used in the calculations are different, although the fundamental principle is the same, with the three-dimensional co-ordinates of these points recorded in arrays Xcart, Ycart and Zcart.
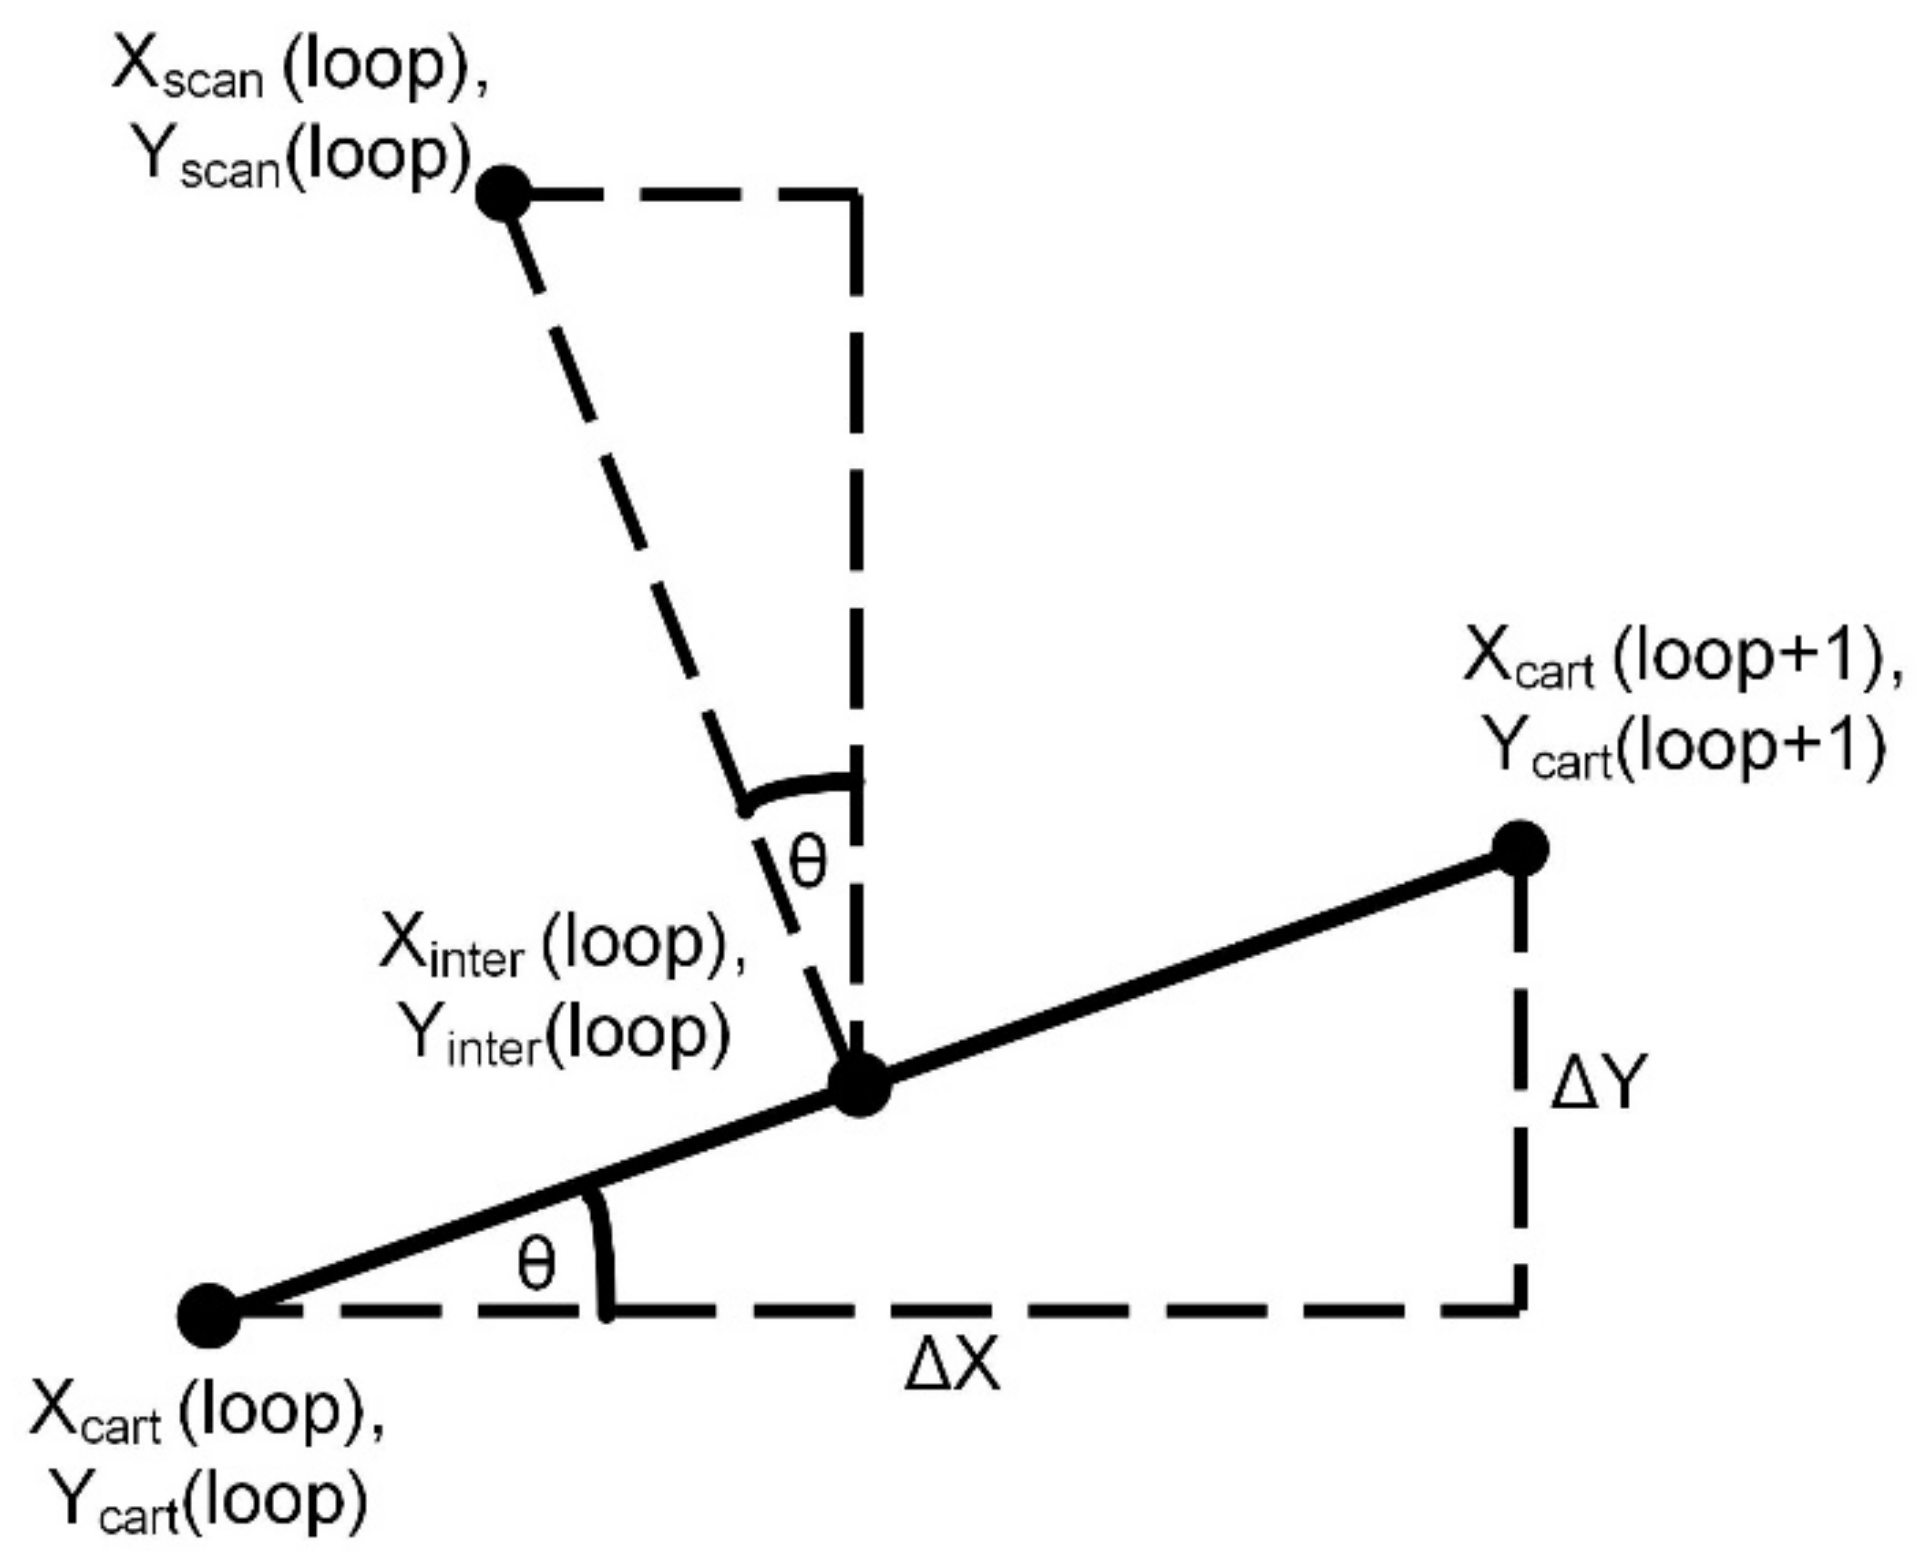
From this stage onwards, regardless of which mode was used in the vision system (1, 2 or 3), the remaining steps are the same. Six new arrays, Xinter, Yinter, Zinter, Xscan, Yscan and Zscan, are defined (again in the Kinect frame of reference) where the arrays Xinter, Yinter, Zinter feature the values halfway between the points determined above, and Xscan, Yscan and Zscan represent the position the scan should be taken at. An offset of 60 mm was chosen here through trial and error with this value representing a situation where the sensor was as close to the surface as possible without touching it. This value was altered in some versions where a greater gap scenario is tested.
If ΔX and ΔY are defined as the differences (in pixels) between consecutive elements in the Xcart and Ycart arrays, respectively, then these values Xscan, Yscan and Zscan can be determined as shown in Equations (1)–(6), with Figure 8 illustrating the concept.
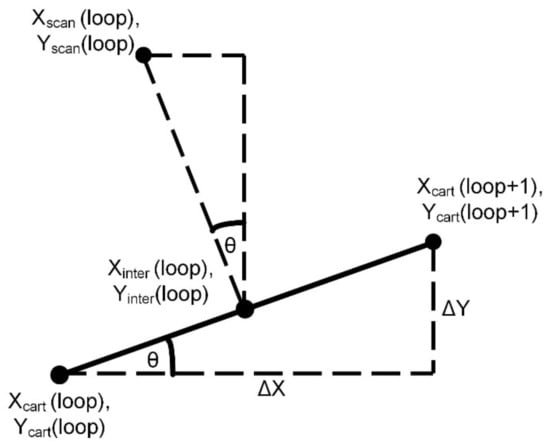
Figure 8.
Determination of scan positions.
At this stage, there are six arrays which represent the cartesian co-ordinates of the locations at the top edges of the object being scanned and the positions the end effector should take in order to facilitate the scanning operation, namely Xcart, Ycart, Zcart, Xscan, Yscan and Zscan. These six arrays are all relative to the base of the Kinect and are given in millimetres, whereas the robot kinematics requires that the values are relative to the base of the UR3 manipulator and with units set to metres. Hence, the Equations which convert the co-ordinates from the Kinect origin to the UR3 origin are shown in (7) to (14). The value of 163 mentioned in Equations (7), (10) and (14) are due to a combination of the physical difference in position of the kinect and the UR3 manipulator, and the anticipated thickness of the objects to be scanned.
Although the required position of the end effector is now defined, the orientation is not. It is possible to determine the change in orientation required in the roll rotational axis (within the base frame) using (15) (assuming the start position of the end effector is vertically downwards). This is also true of the change required in the pitch orientation, where a similar argument is made and a similar equation is determined, i.e., (16).
Nominally, the Euler angles which correspond to a downward facing end effector are (π, 0, π). However, if the perturbations determined in (15) and (16) are accounted for, the new Euler angles are shown in (17).
Thus, the position and orientation required of the robot end effector can be determined.
4. Using a ToF Depth Sensor vs. an RGB Sensor
The three algorithms used here have evolved, in part, from earlier research by the some of the present authors [17,18,19,20,21,24], in which the RGB sensor of the Kinect was used to identify colour interfaces (the articles concern positioning a hydraulically actuated robot for pipe-cutting operations). However, this approach relied on three assumptions.
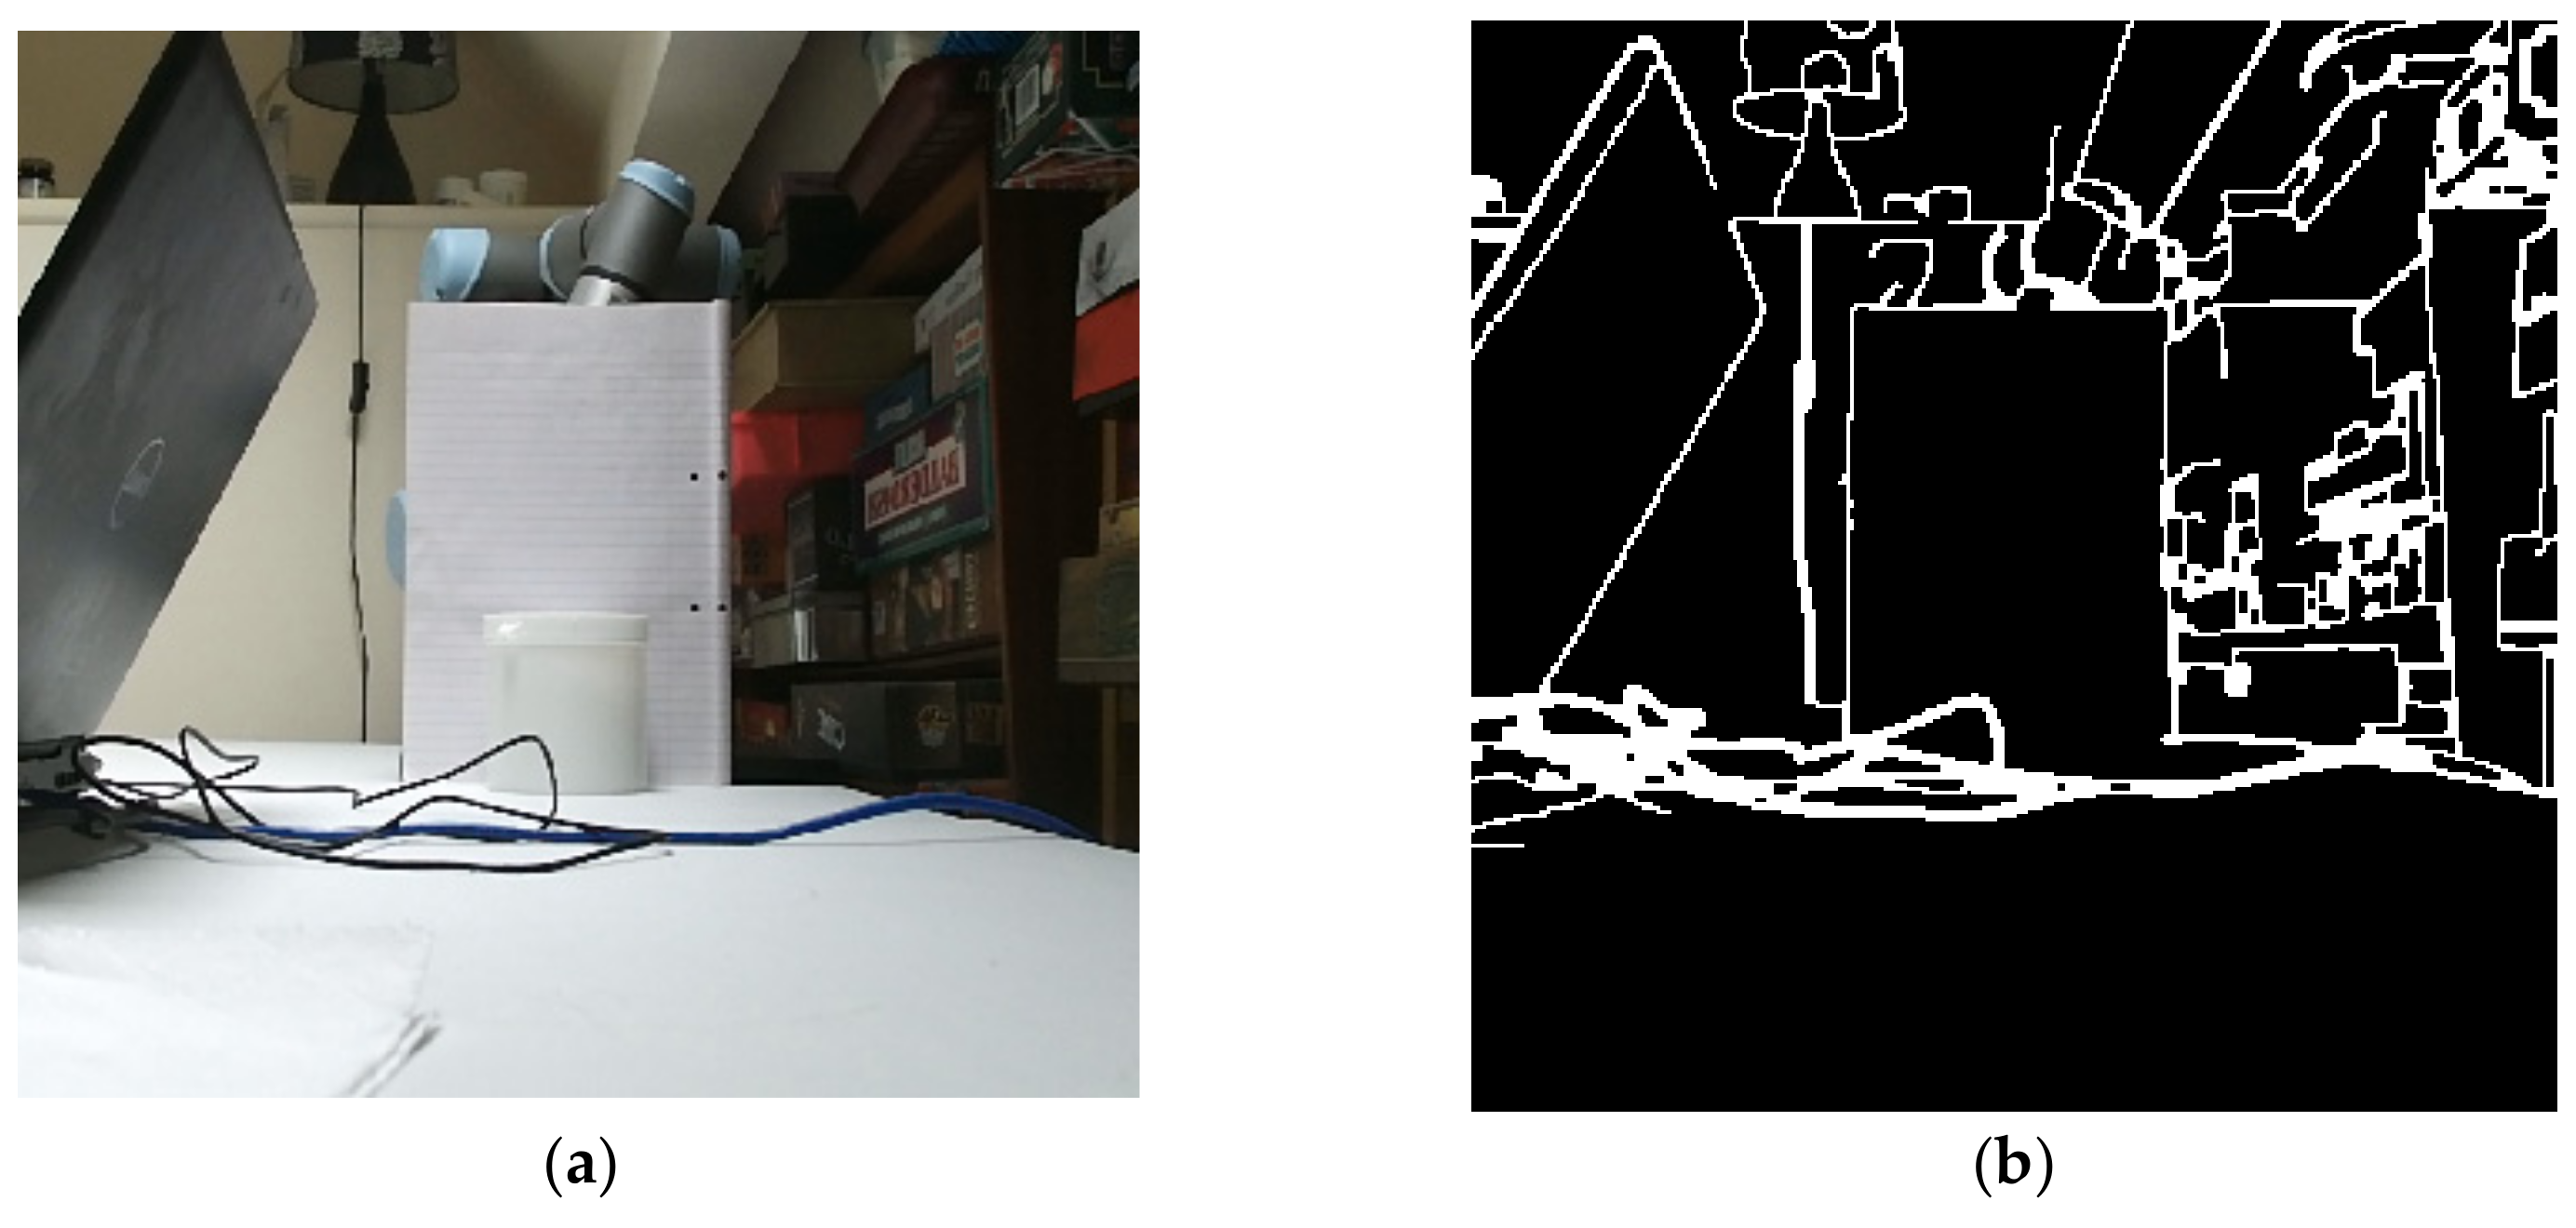
(1) The object had to be of a significantly different colour to the background, otherwise the vision system would be confused by the lack of clear interfaces as illustrated in Figure 9.
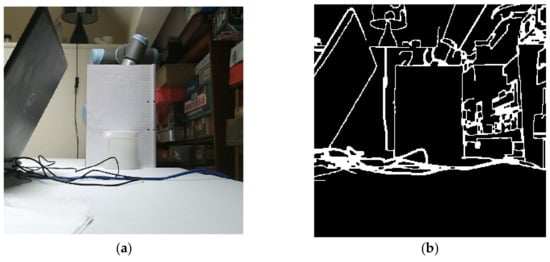
Figure 9.
(a) An RGB image of a white tub in front of a white background and (b) the Canny algorithm applied to this image.
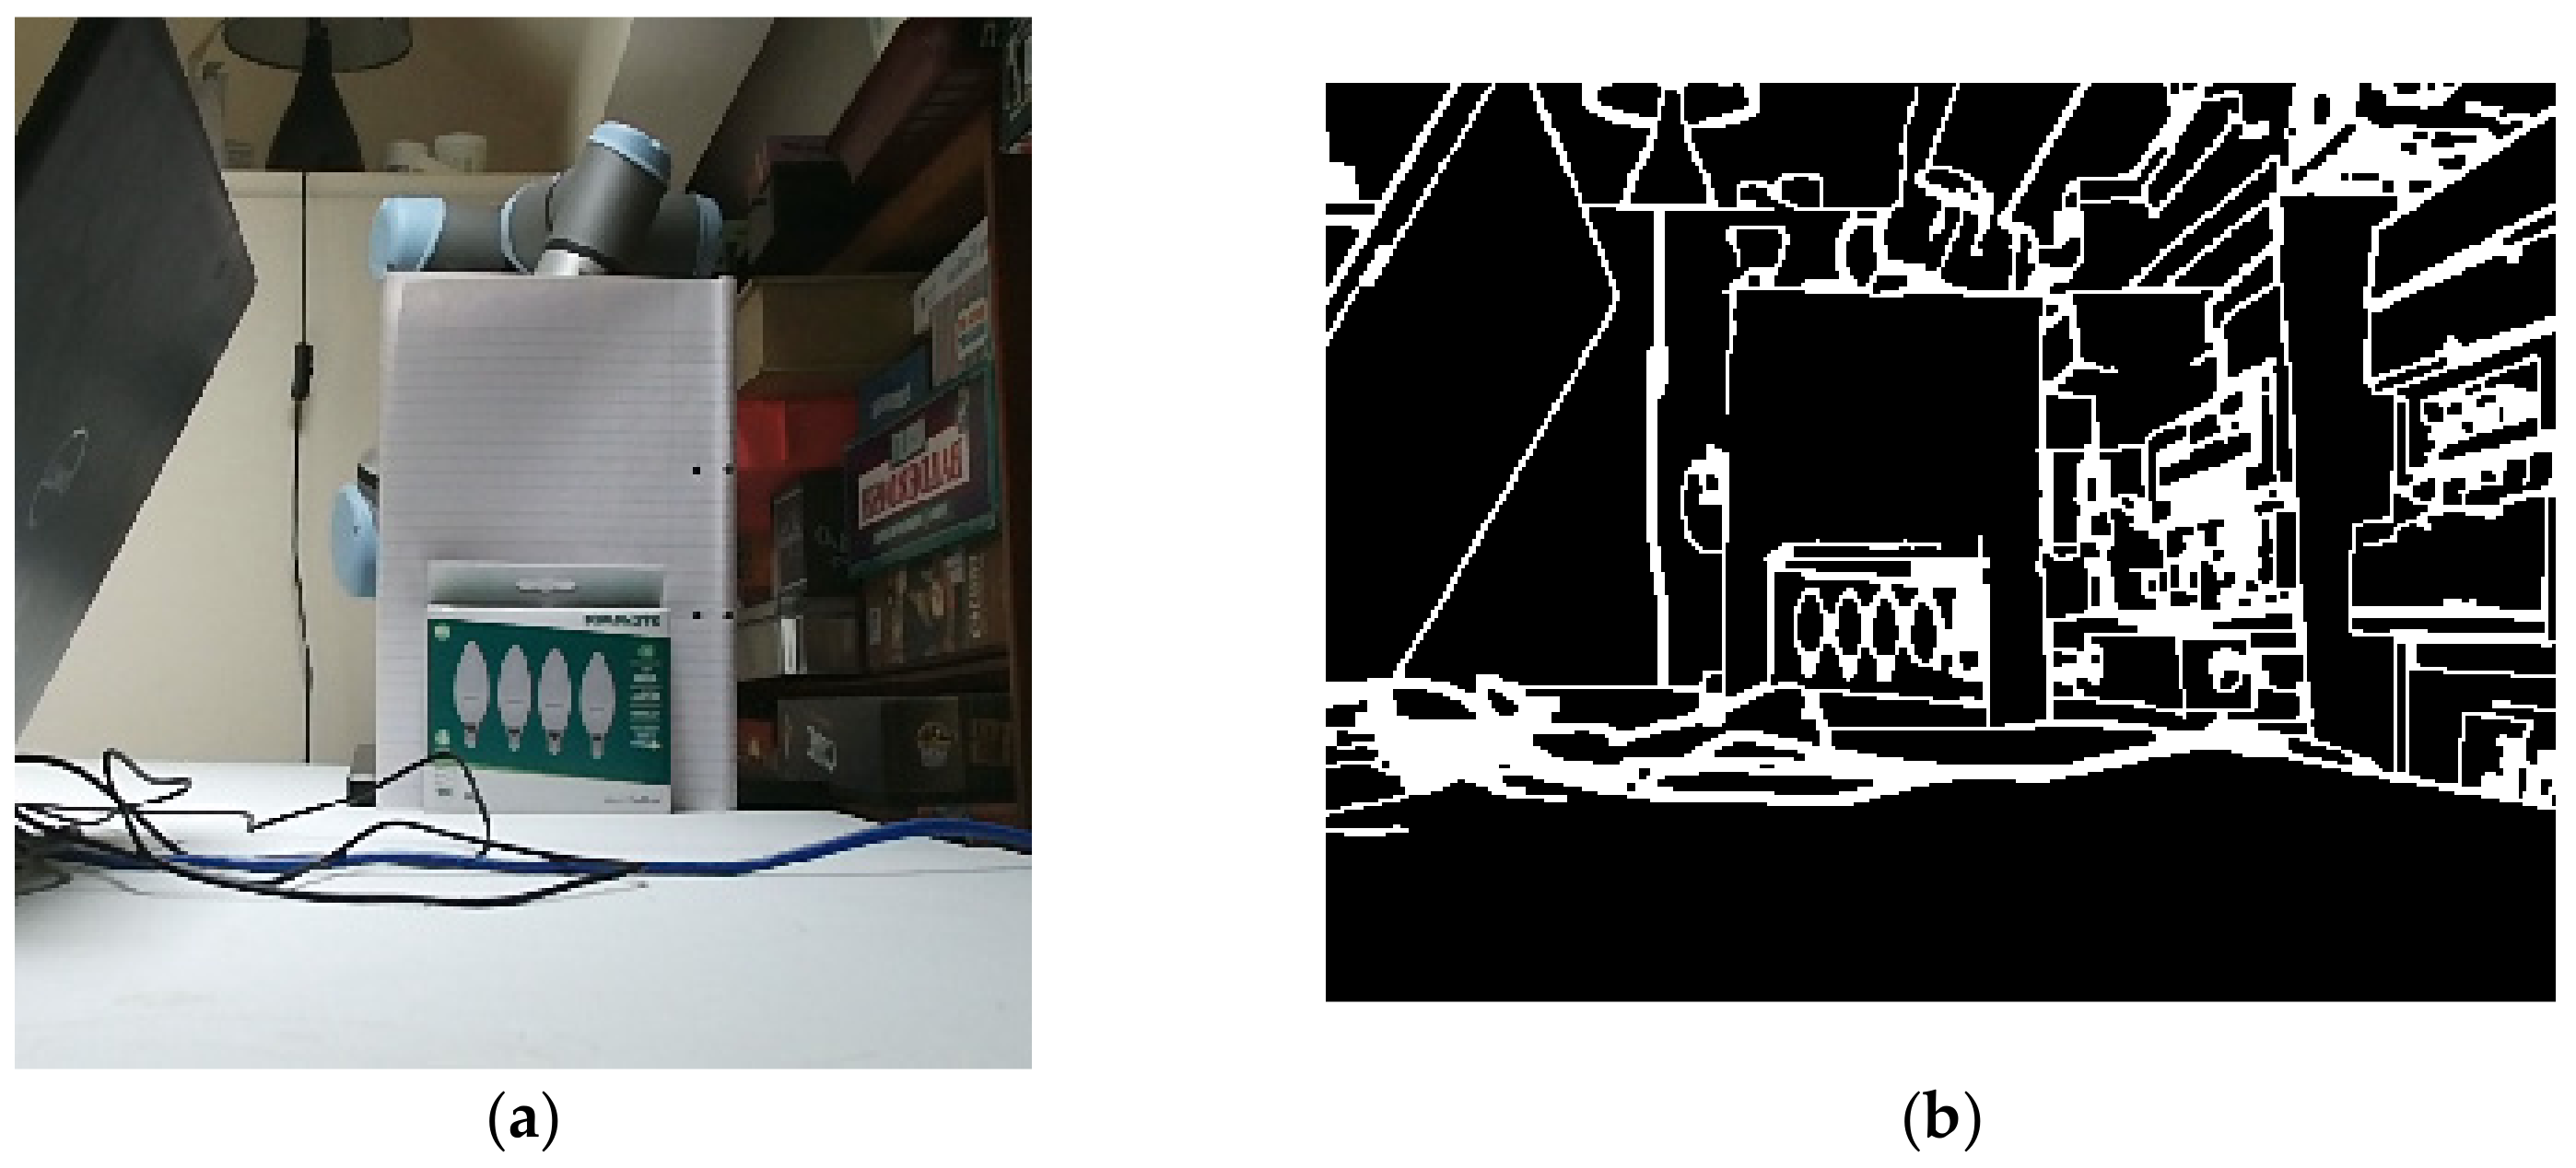
(2) The object must be of a single colour, otherwise the RGB system may identify the interfaces between the colours upon the object as separate (as illustrated in Figure 10). To address these issues to some degree, the slider in the developed GUI allows the operator to alter the Canny algorithm sensitivity.
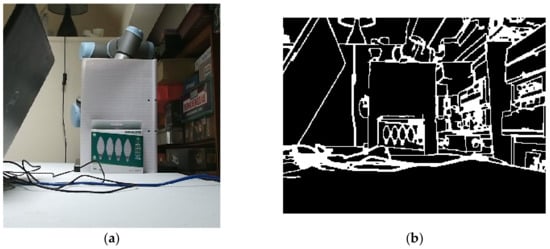
Figure 10.
(a) An RGB image of a multi-coloured object; (b) interfaces between colours on object.
(3) Light conditions had to be favourable, otherwise the ability of the algorithm to determine interfaces between colours could be compromised.
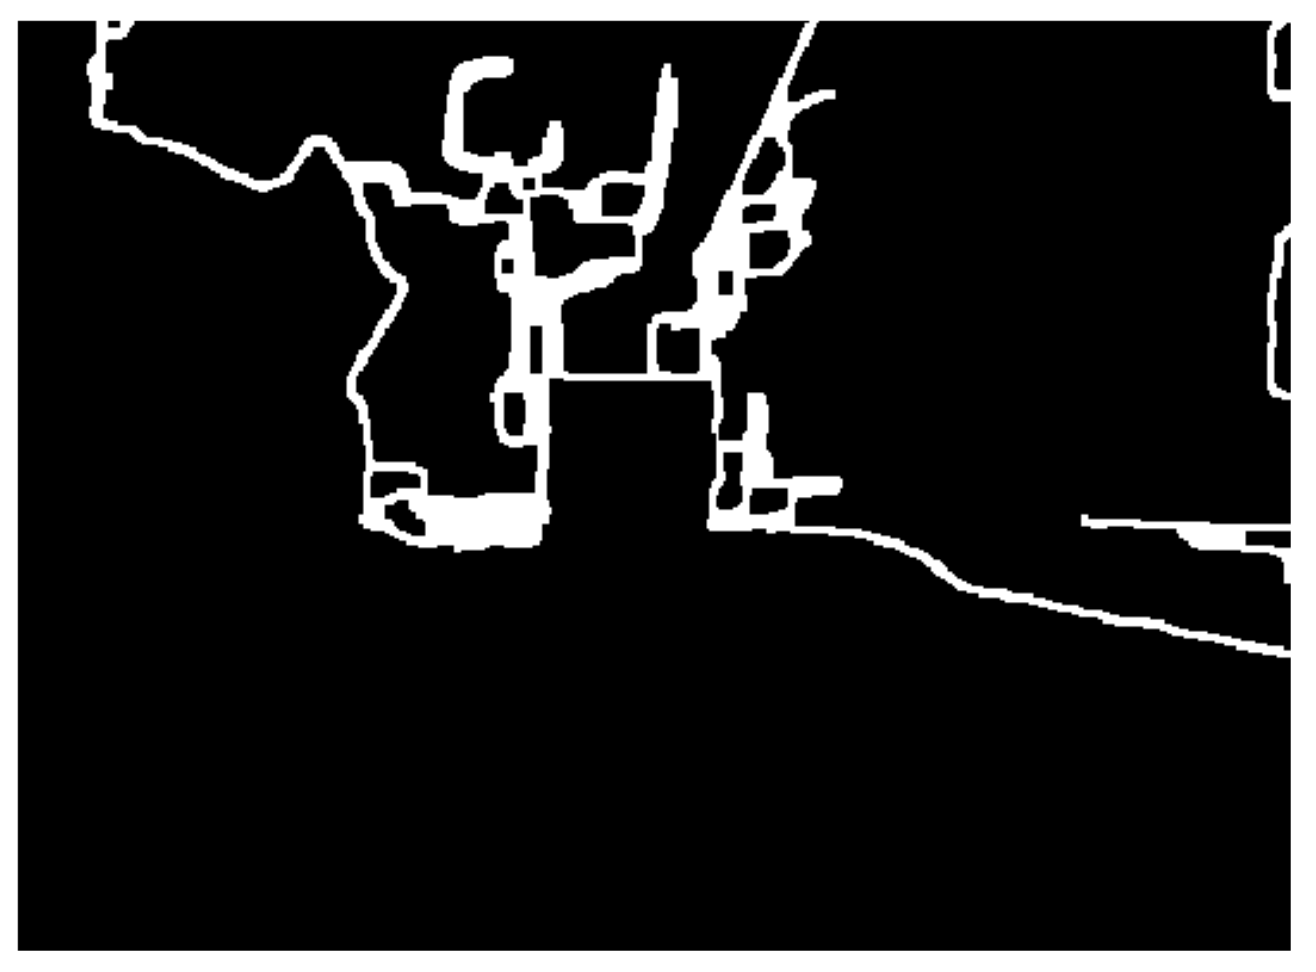
The alternative to the RGB sensor is the Kinect V2′s time-of-flight-based depth sensor, which features an IR laser diode which emits modulated light with the reflected signal compared with the transmitted one; the phase shift used to determine the depth of the point. The three major detrimental effects associated with the RGB camera noted above would not be expected to affect the depth camera in the same way. However, using the depth facility introduces other challenges as illustrated in Figure 11 which shows the output when a depth sensor has been used with a basic orthogonal box on a table.
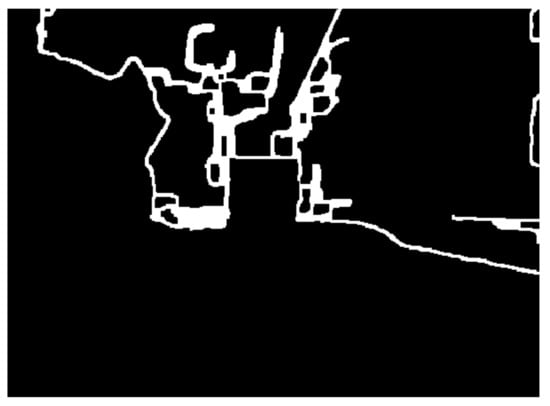
Figure 11.
Depth sensor Canny interfaces with object on table.
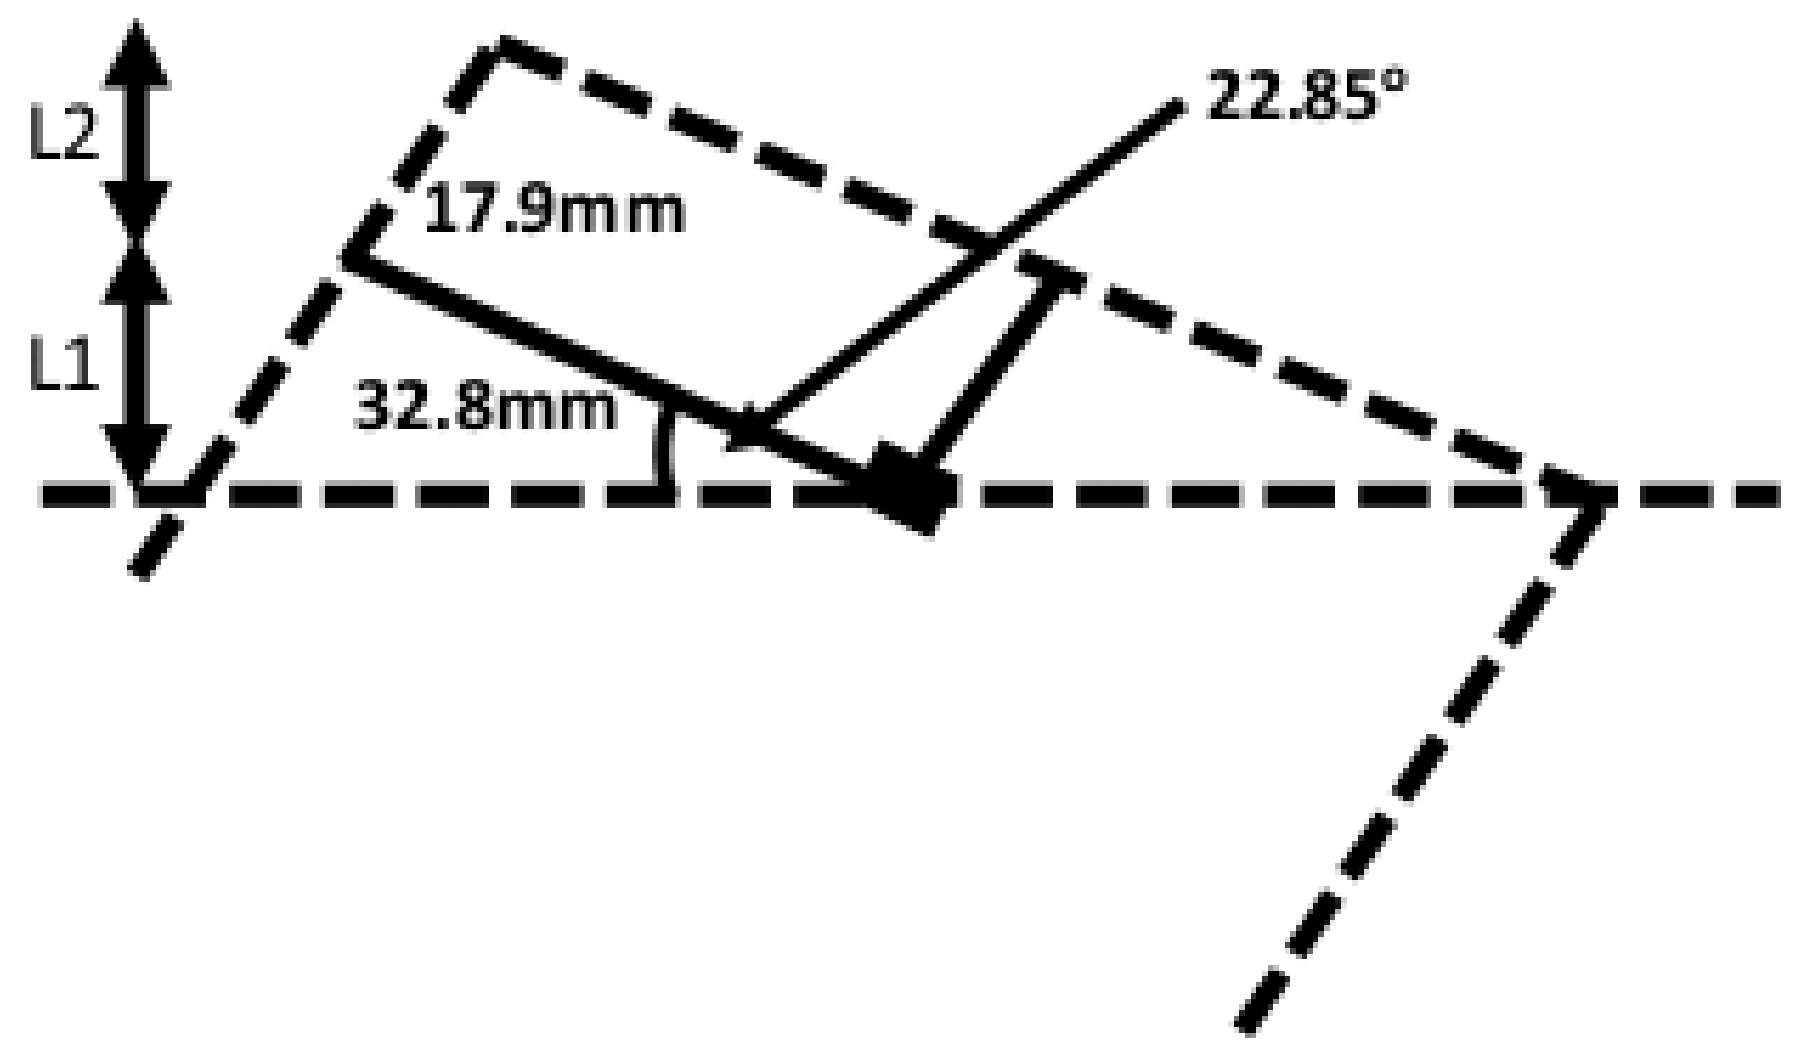
Another weakness here concerns the resolution of the depth sensor. The Kinect v2 depth sensor features a resolution of 512 × 424 pixels, a field of view of 70.6 × 60° and a depth range of between 0.4 and 4.5 m. If the sensor is one meter away from the front face of the object, then each incremental value in the × direction is 2.41 mm, while a corresponding change in the Y direction is 2.47 mm. The worst-case scenario is that the surface exhibits an angle of 22.85° relative to the normal. If the × value increases by one (i.e., 2.41 mm) then the recorded Y value would increase by either 0 cm or the aforementioned 2.47 cm. Thus, the required angle determined by the algorithm would be either 0 or 45.7°. In either scenario, if the real angle is the aforementioned 22.85° the error would be 22.85°. Although the CZT crystal within the RadAngel device operates regardless of orientation, the error in this angle ensures that the casing of the RadAngel would limit how close the CZT crystal could get to the object. If the angle is correct, then the CZT crystal is 17.9 mm from the source. However, if the RadAngel assembly is tipped by the aforementioned 22.85° angle, then the distance increases to 29.23 mm as shown in Figure 12 and (18).
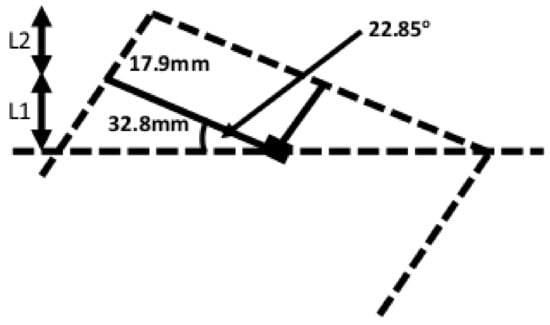
Figure 12.
How angle affects the RadAngel radiation sensor.
Going from a distance of 17.9 to 29.2 mm is a factor increase of 1.63, or an intensity ratio of 2.67 (intensity proportional to distance squared)—a potential problem if low-activity contamination spots are to be identified. However, with a safety margin of 10 mm utilised to ensure no contact between the RadAngel casing and the object, this equates to a comparison between distances of 27.9 and 39.2 mm—an intensity ratio of 1.98. Using the RGB camera instead reduces this problem, as it possesses a greater resolution than the depth camera (1920 × 1080 pixels, and a field of view of 84.1 by 53.8°). Applying the same process as above, the worst-case scenario is that the intensity at the crystal would be reduced by a factor of only 1.44. Another way to rectify this problem is to only scan every other point on the X axis, i.e., a position every 4.82 mm as opposed to every 2.41 mm. This is calculated to reduce the intensity by a factor of 1.58 rather than the aforementioned 1.98. If mode 1 were to be used, then this effect is generally reduced greatly. If an object were 100 mm wide with the smallest measurable distance in the Y direction being 0.869 mm (i.e., using the RGB sensor), then the smallest angle error would be 0.249°. Using (38), we can see this equates to a distance of 18.04 mm or 28.04 mm with a 10 mm safety margin. Compared to a nominal 27.9 mm, this indicates an intensity factor of 1.01 between the best-case and worst-case scenarios.
5. Experiments and Results
5.1. Repeatability
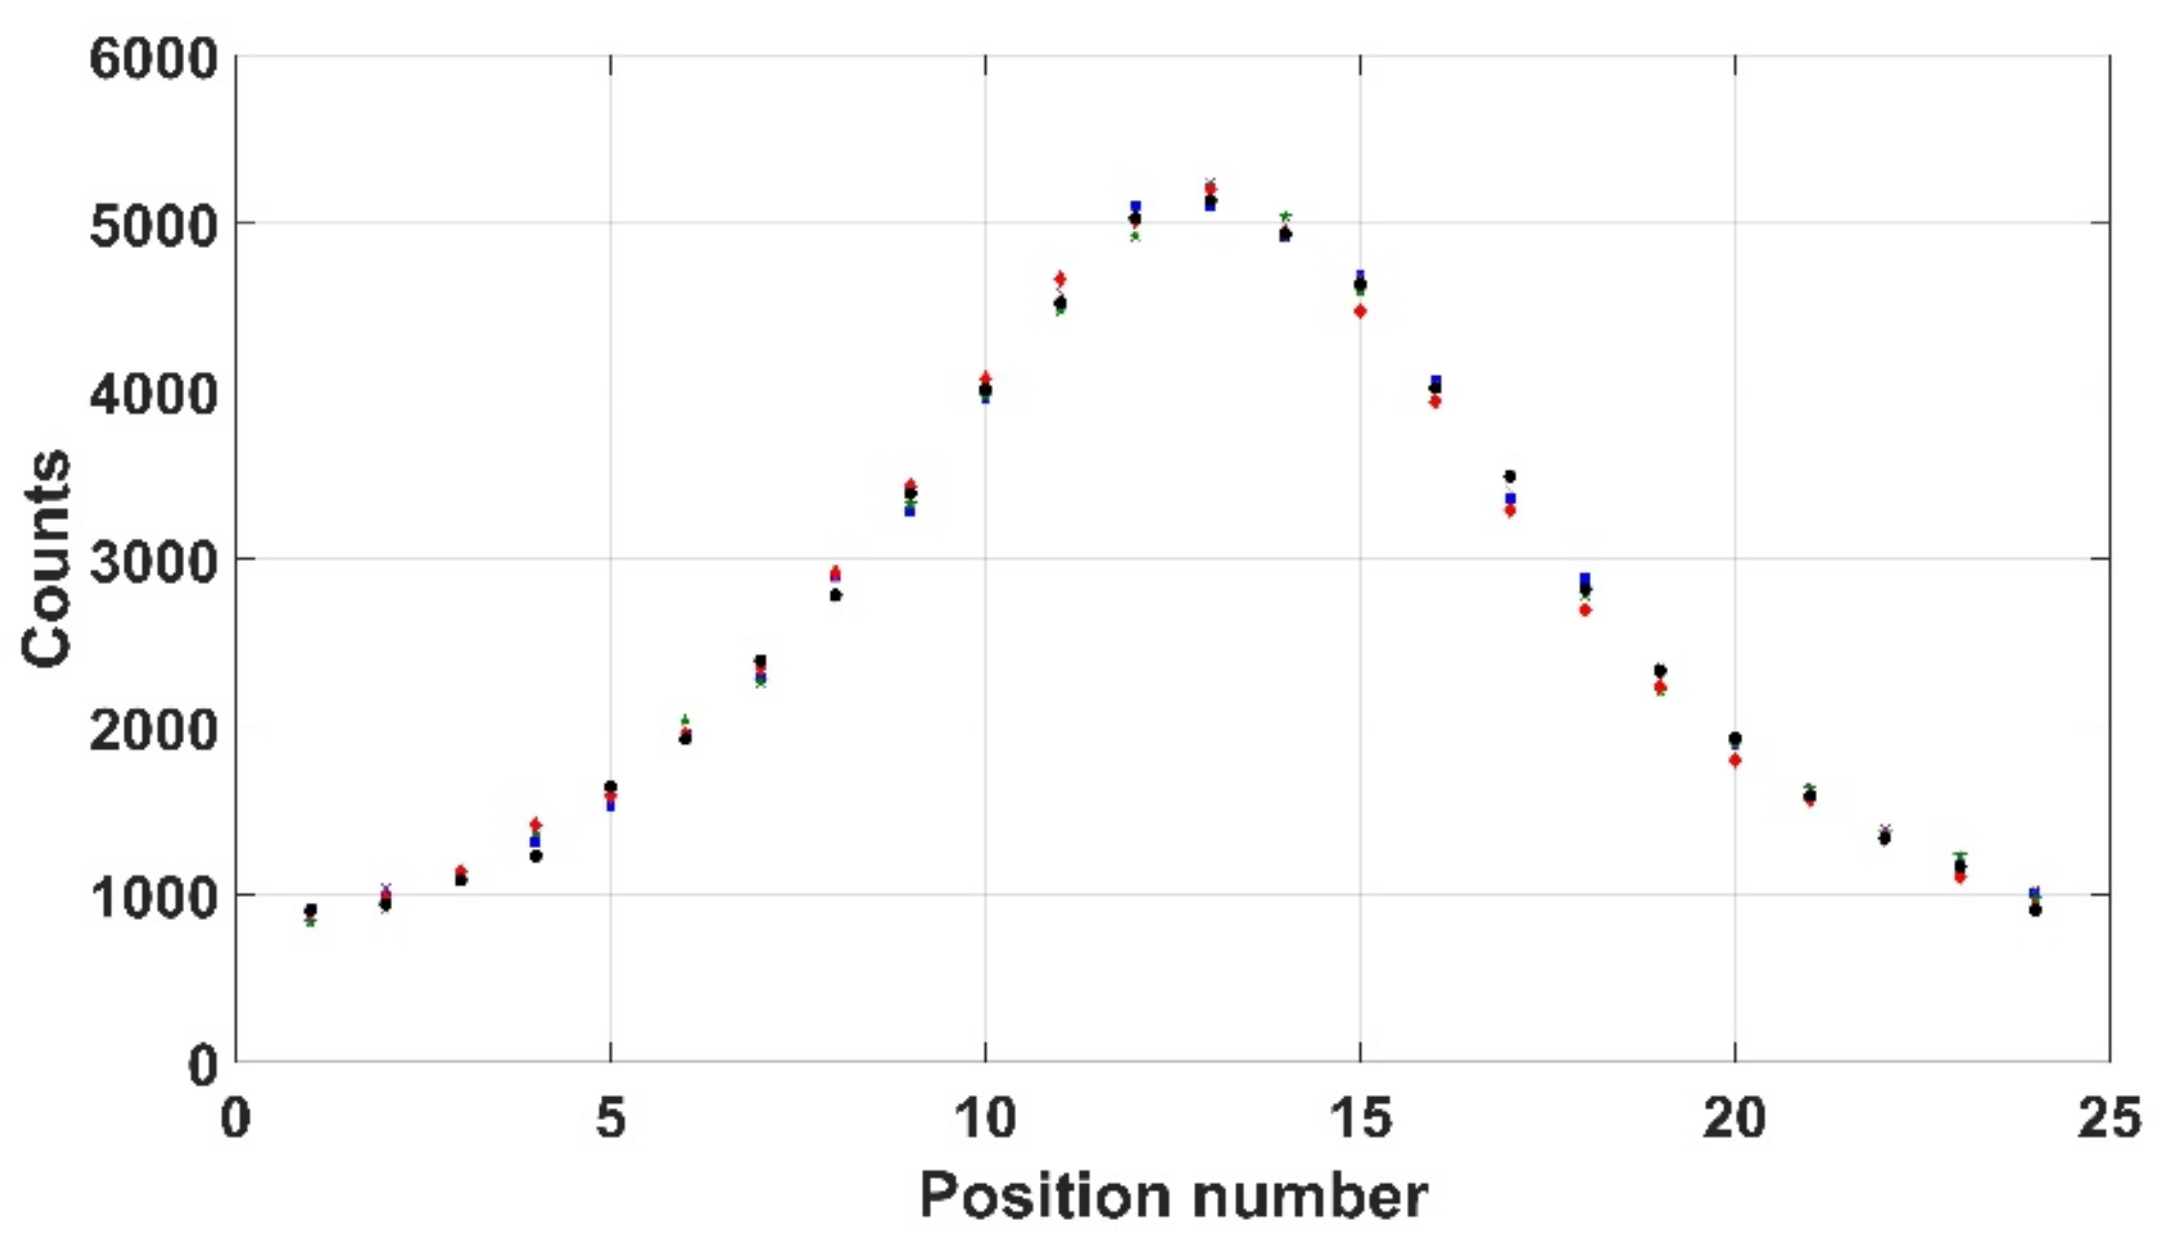
In order to investigate consistency, three measures of repeatability were evaluated. Firstly, the Kromek RadAngel sensor was scanned over a user-defined 24 positions across a 309 kBq 137Cs source, each for 30 s—an operation that was undertaken five times. The results, as shown in Figure 13, indicate an average of 2674 counts and an average standard error of 24.4. Another way to look at it is that there is an average of 1.98% between each of the count values and the average indicating that the repeatability of the Kromek RadAngel is sufficient for this application.
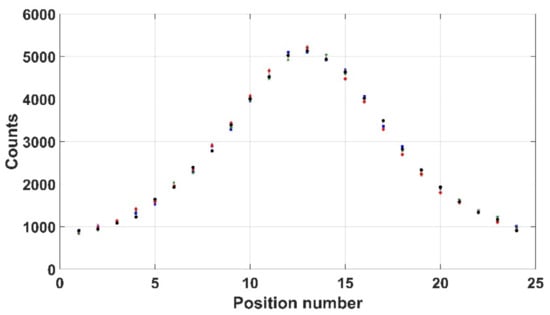
Figure 13.
5 sets of radiation counts to determine repeatability of Kromek RadAngel.
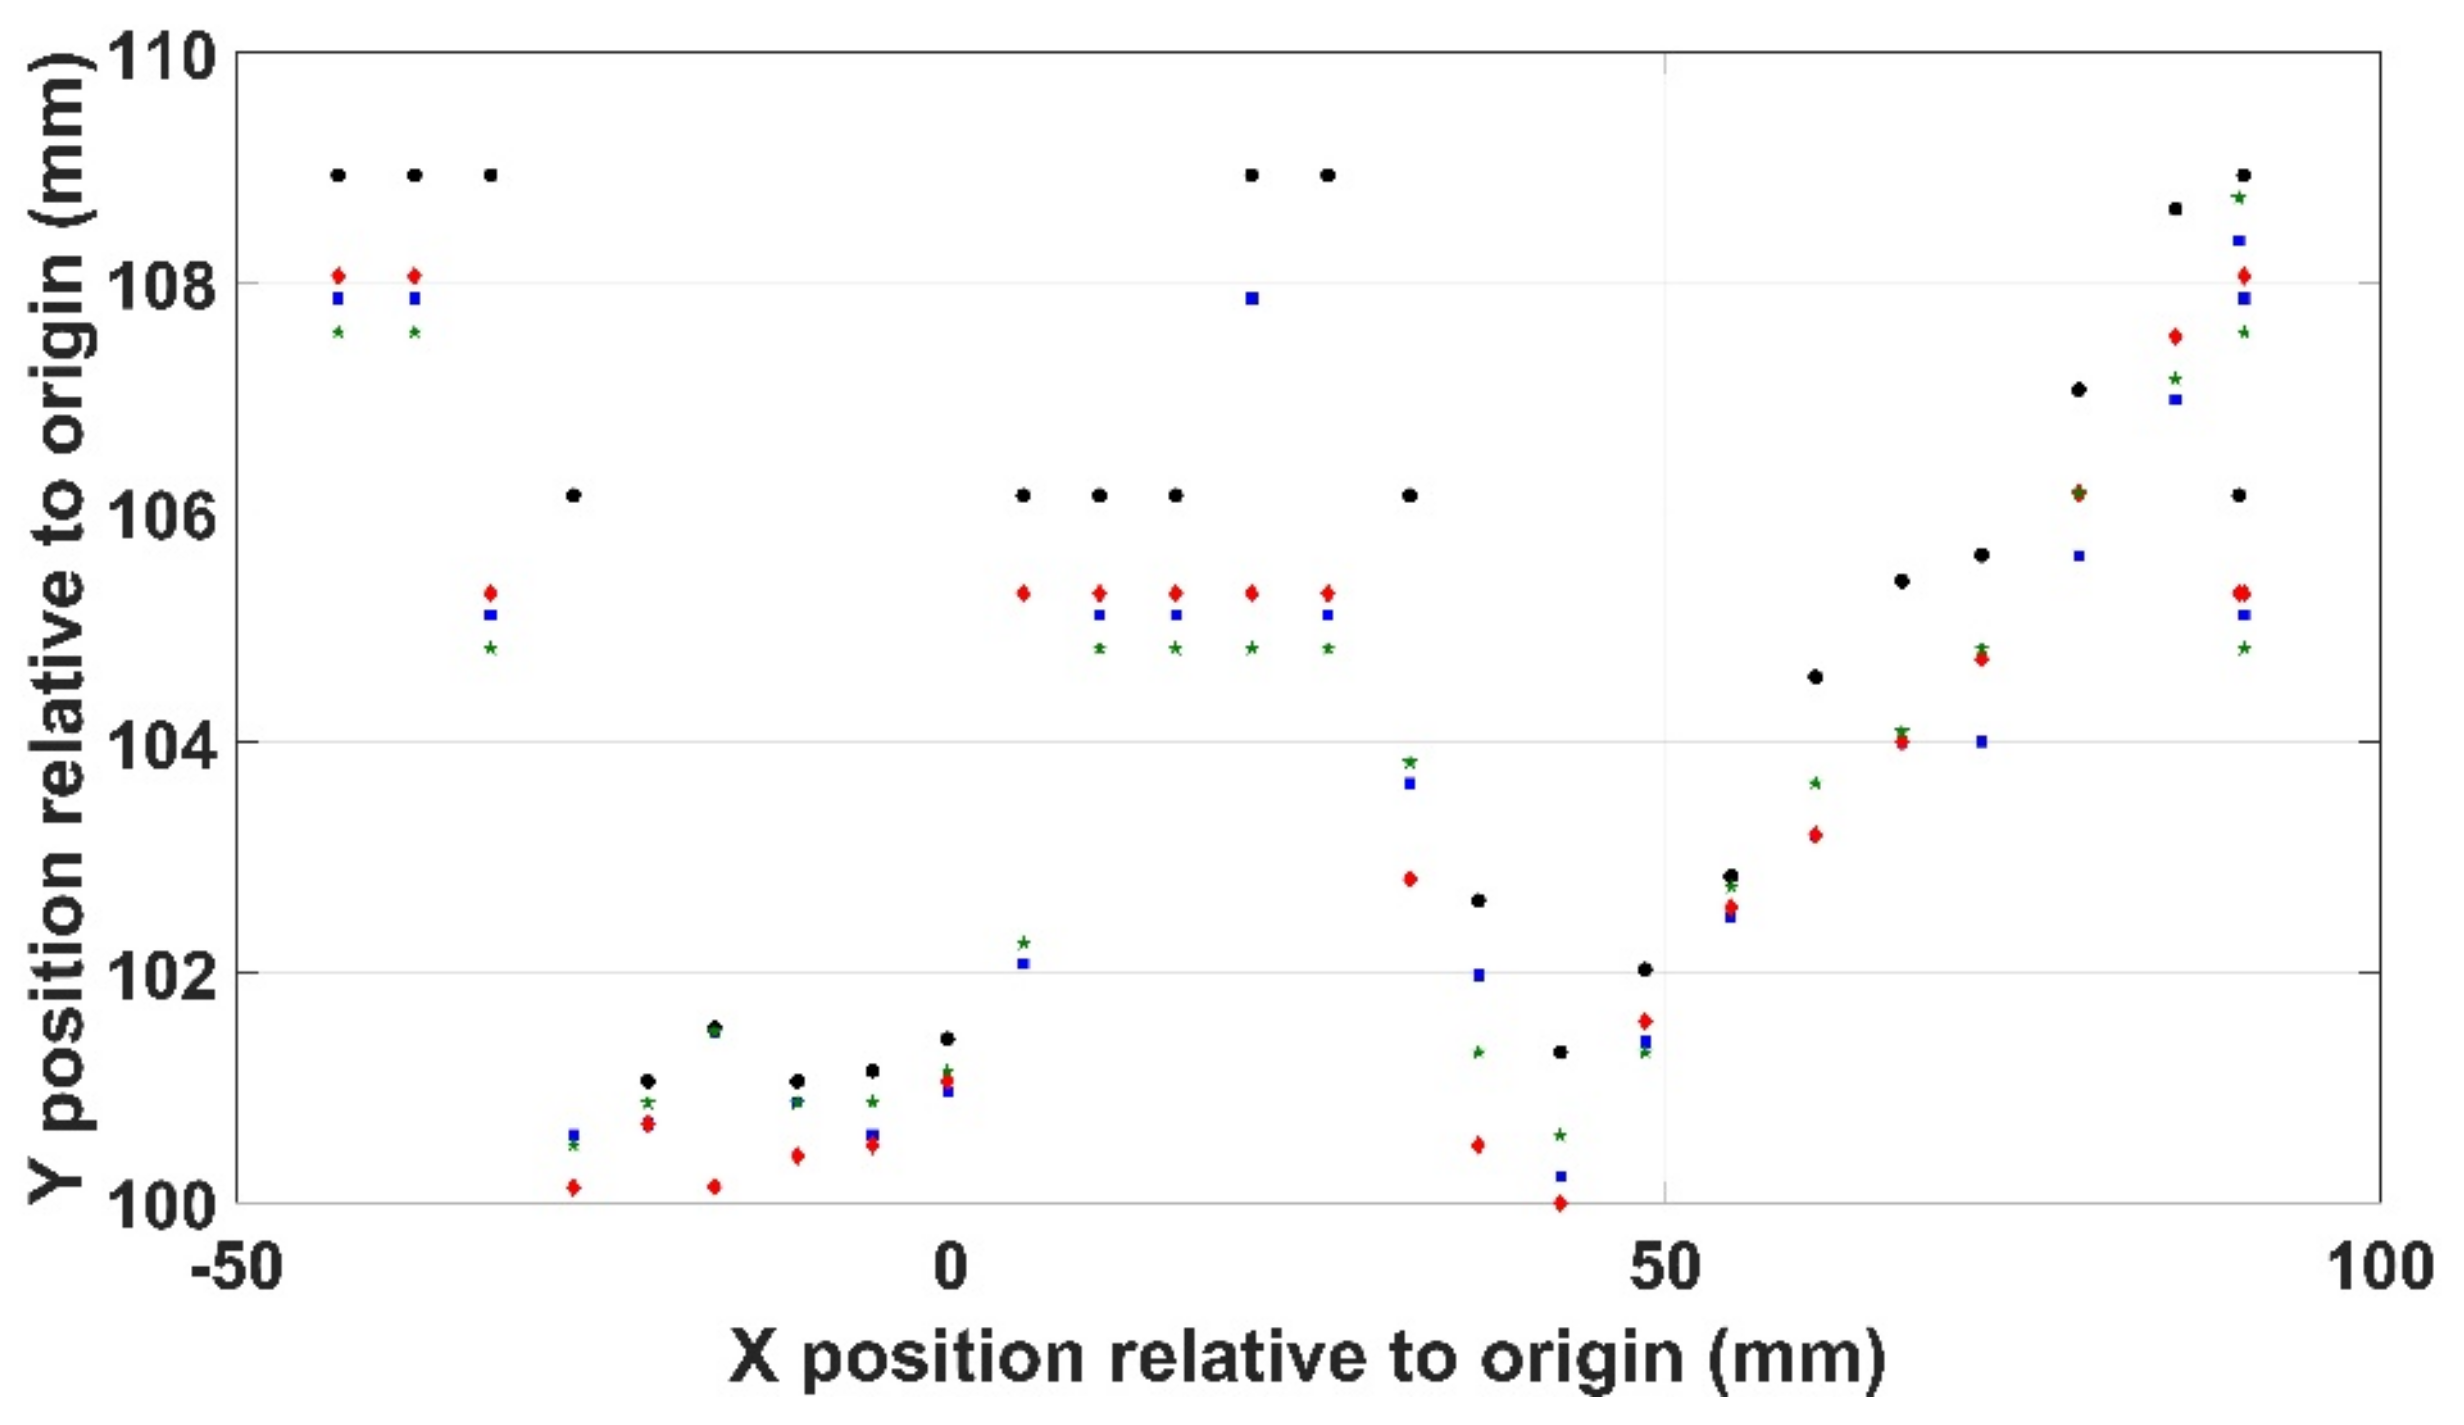
The second measure of repeatability was in the use of the Kinects depth sensor to determine the Y values of the scene used to determine the correct robot pose. Here, the sensor was used four times to physically characterise a typical scenario involving an irregularly shaped object, with the determined positions shown in Figure 14 with the average standard error shown to be 0.476 on an average value of 104.24.
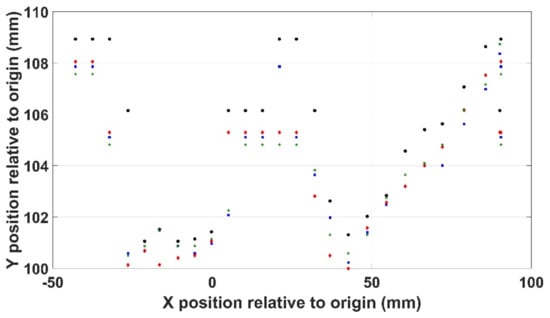
Figure 14.
Positional repeatability in the XY axis.
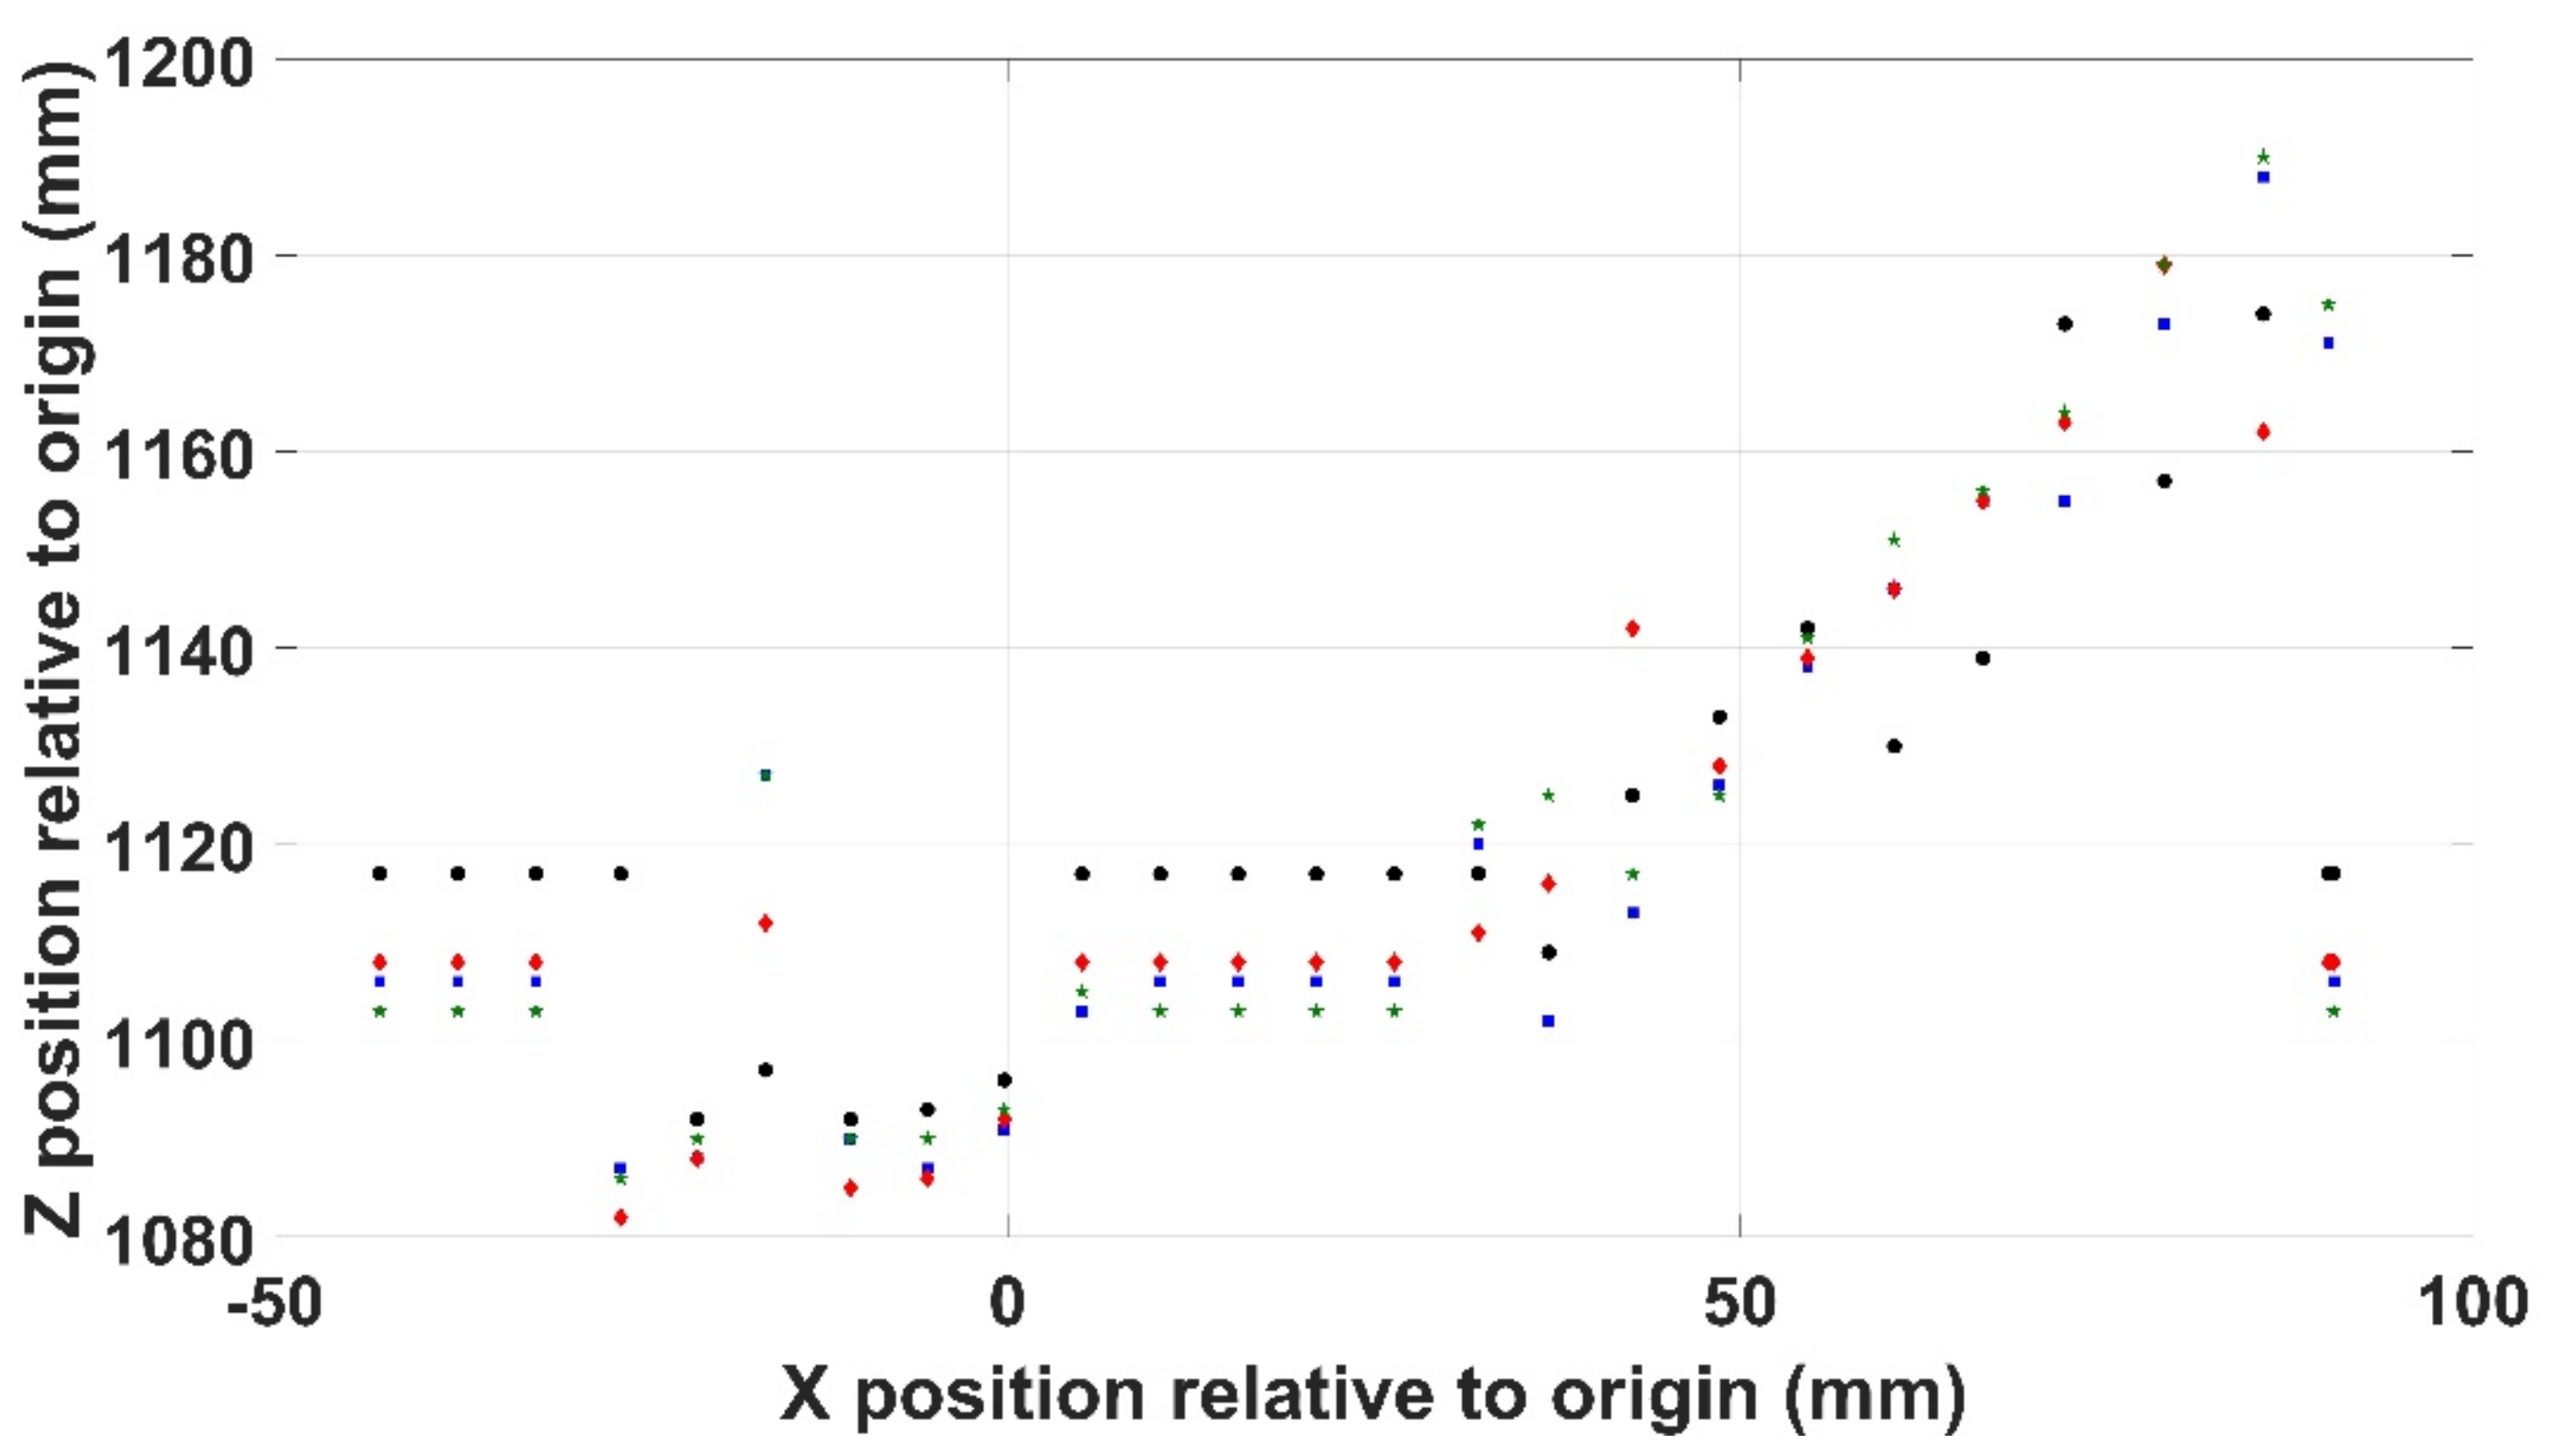
Repeating this for the Z position data reveals a less consistent output as shown in Figure 15 where the average standard error is 4.03 on an average value of 1119. This is obviously a less satisfactory level of repeatability than that demonstrated by the Kromek RadAngel.
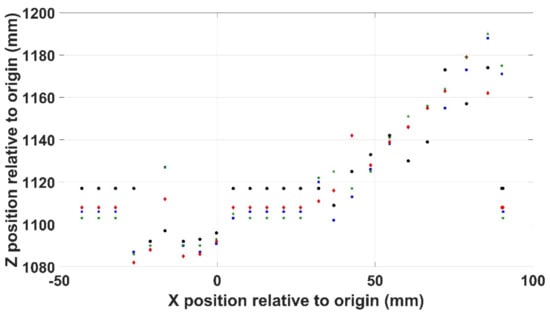
Figure 15.
Positional repeatability in the XZ axis.
5.2. Multi-Coloured Orthogonal Box and Irregular Object Using Mode 3
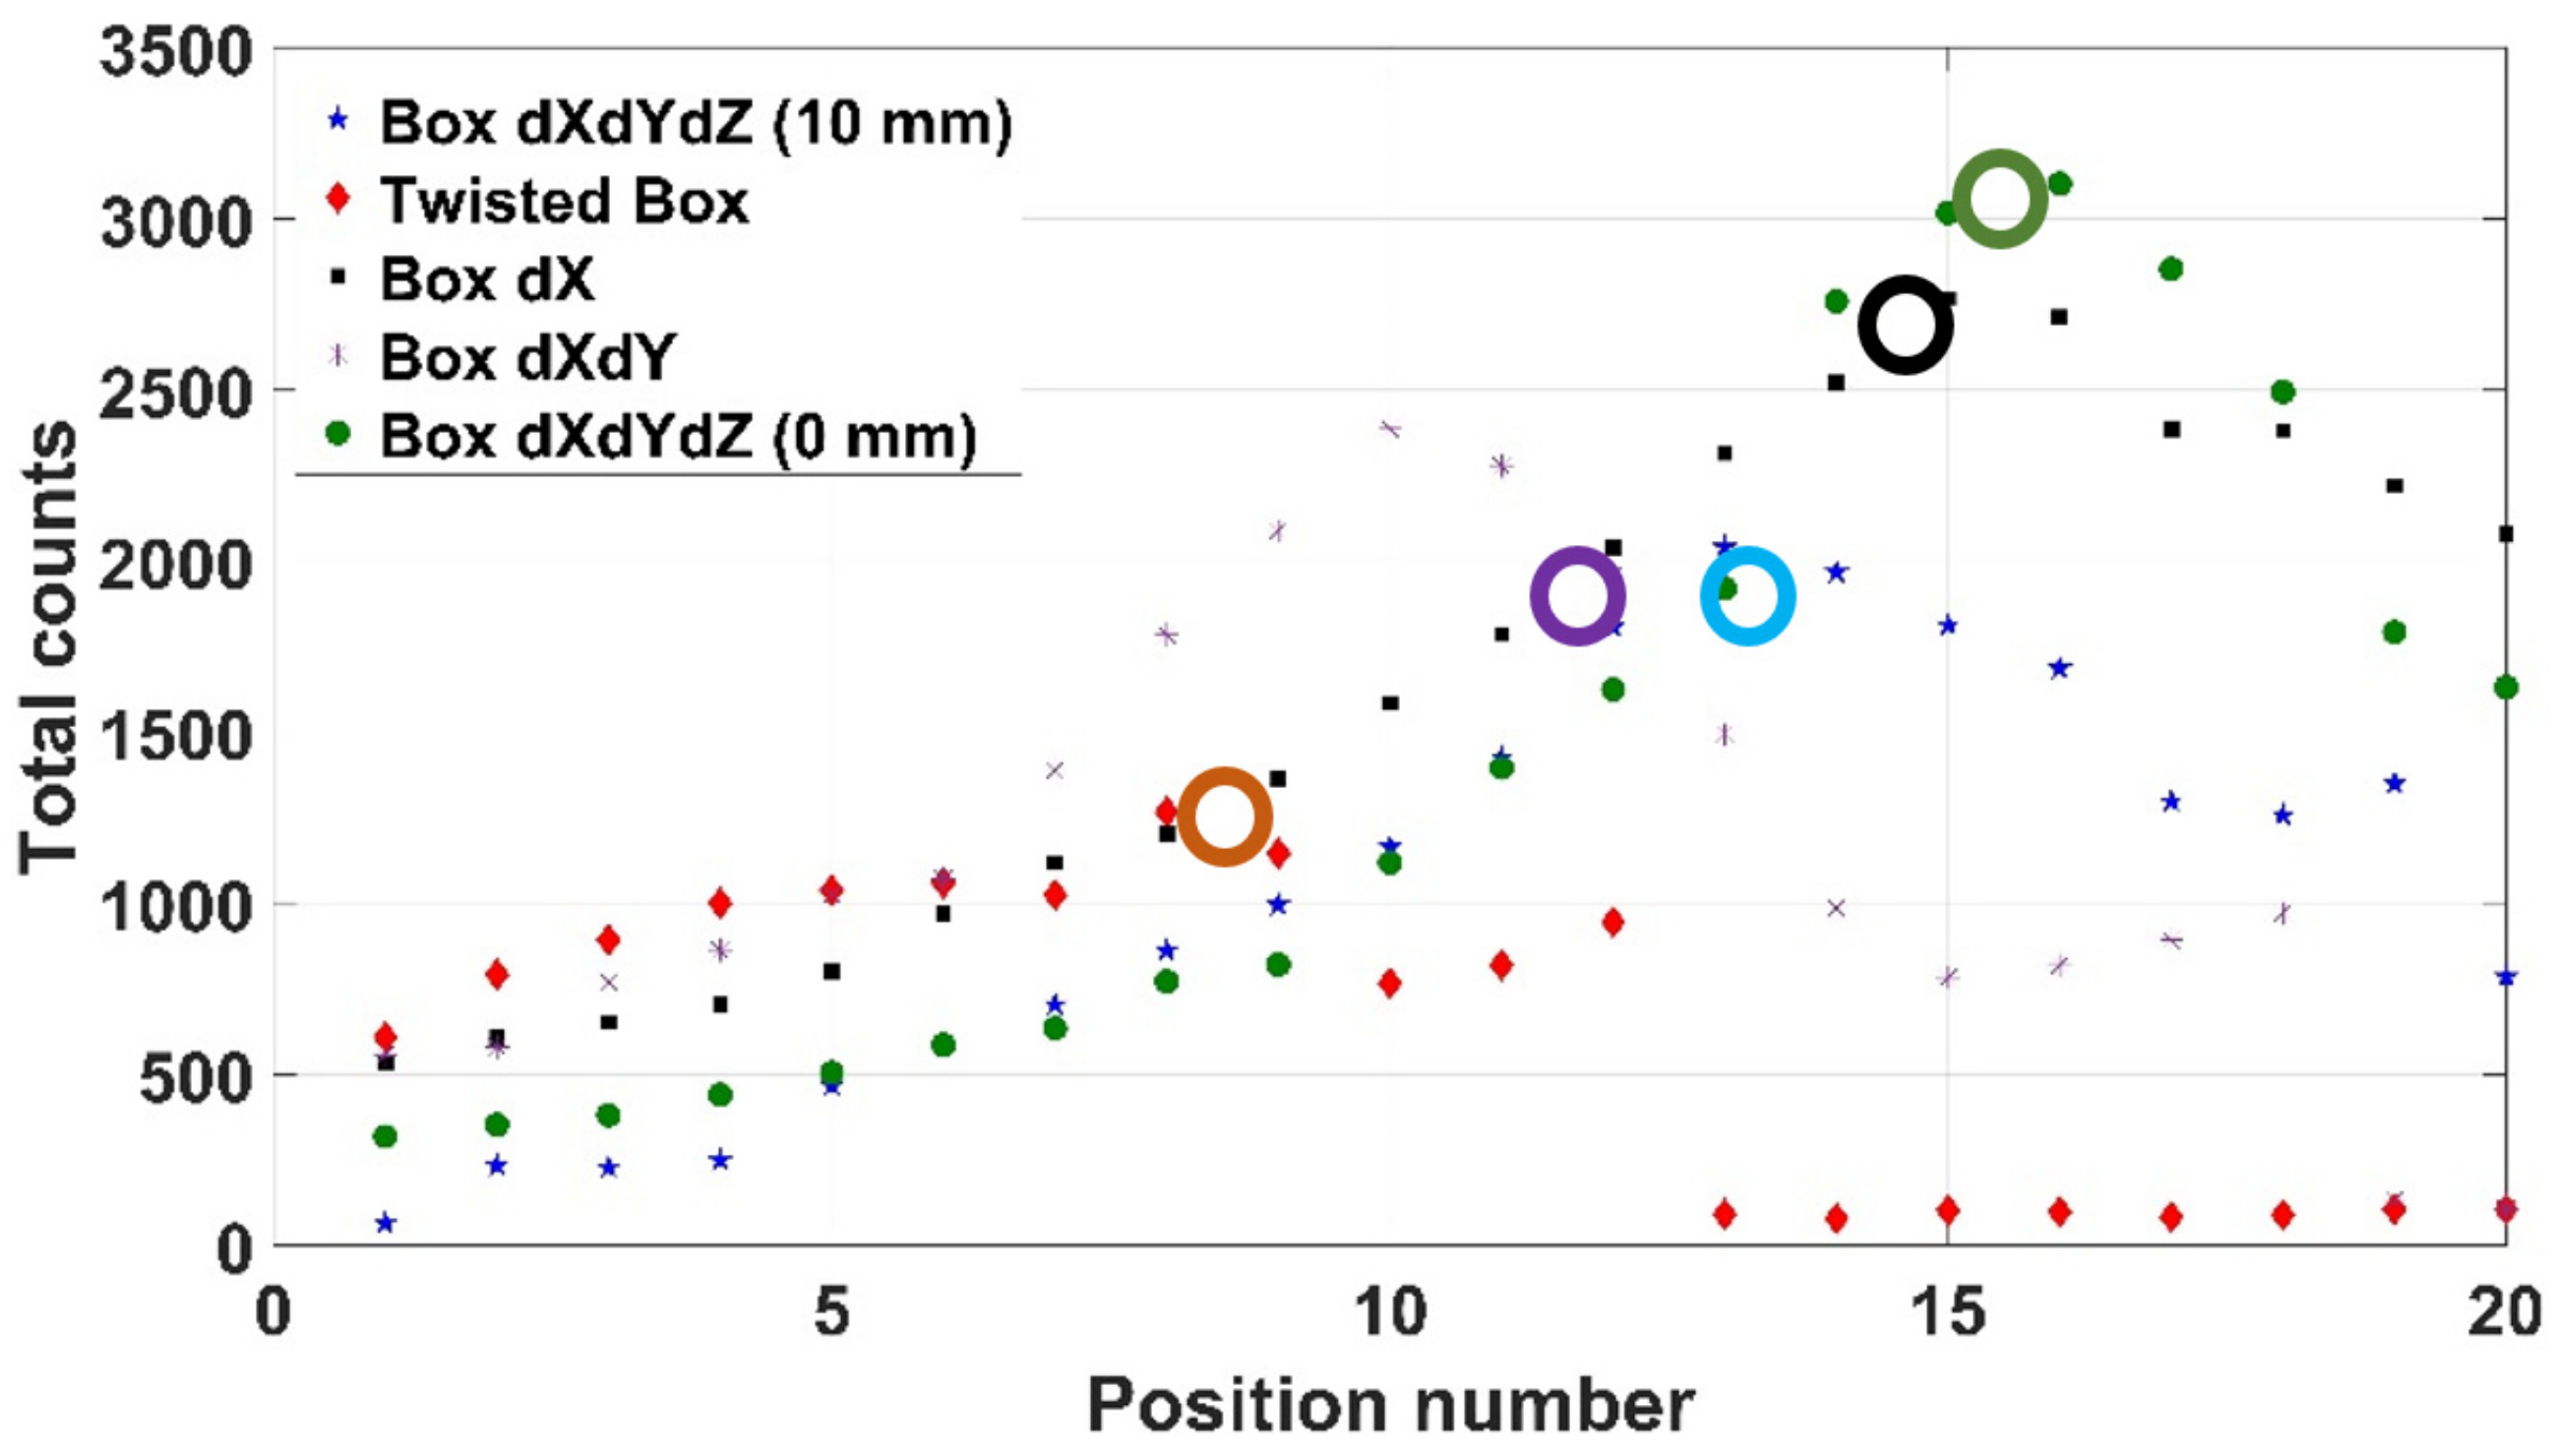
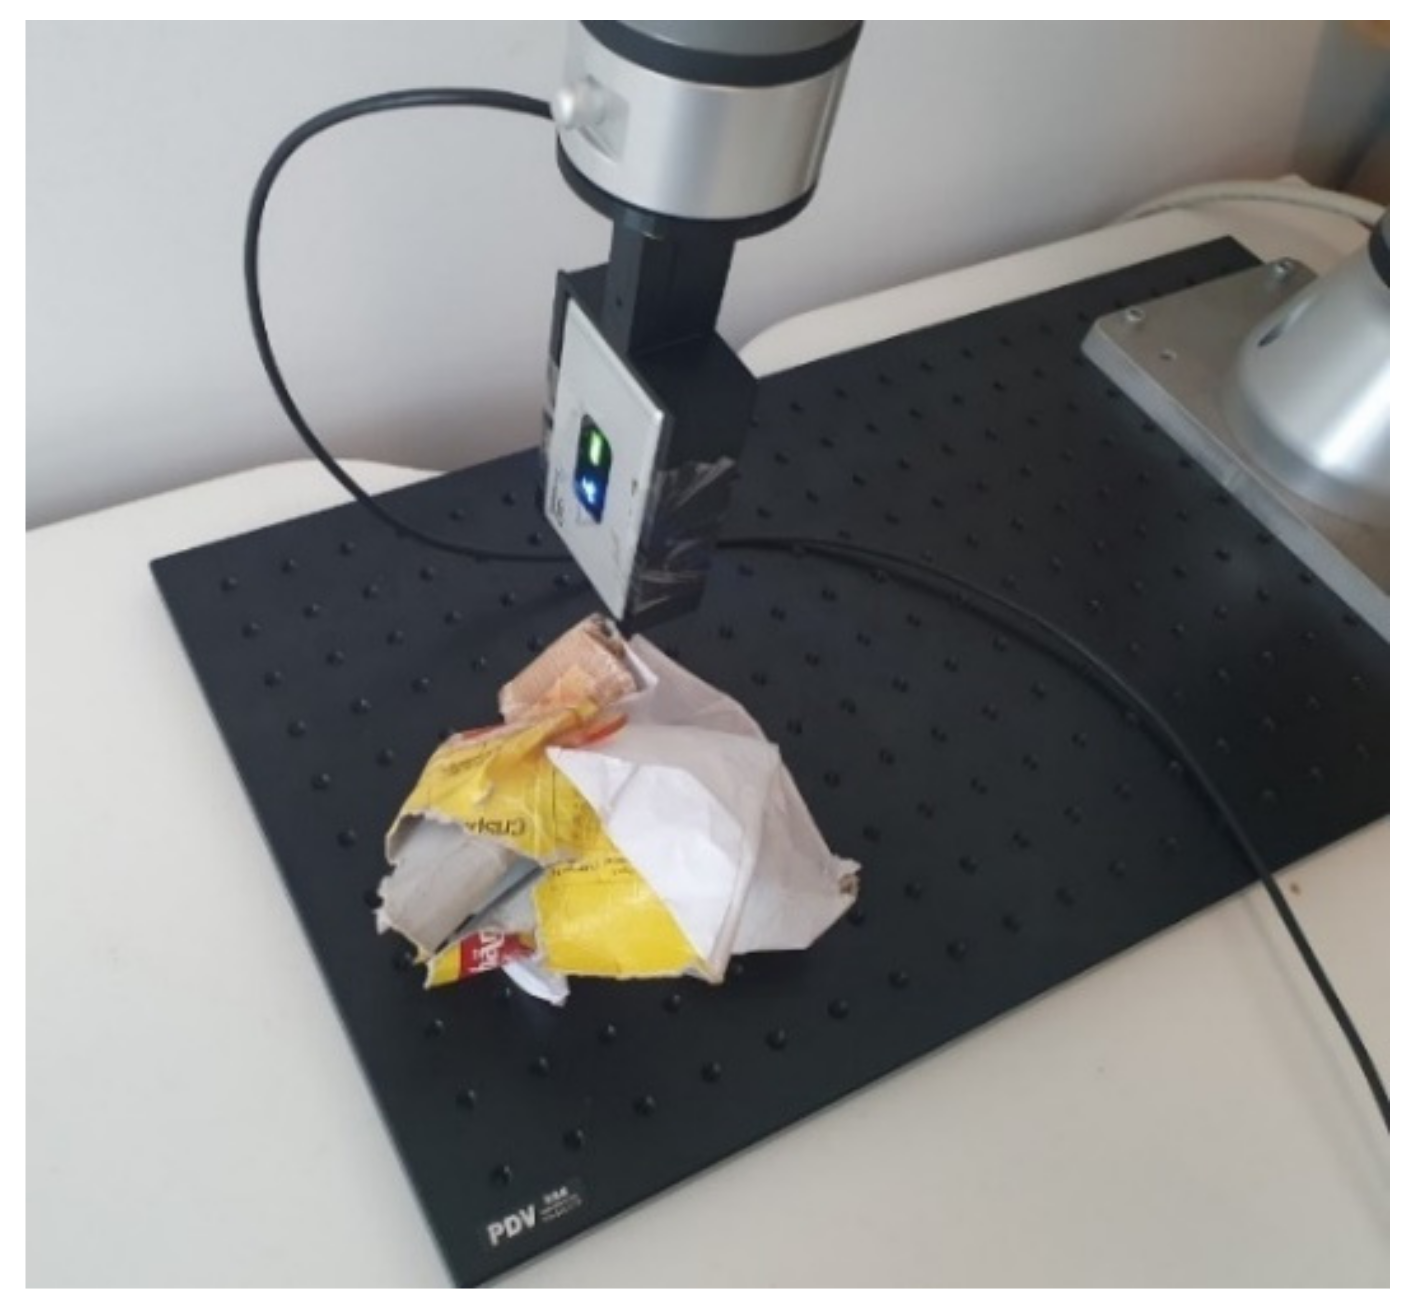
Mode 3 (i.e., using the depth sensor) was used here to scan over an irregularly orientated orthogonal box, as shown in Figure 16, with the depth sensor producing an erroneous Canny algorithm output shown as in Figure 17a, where the object has been conflated with the end effector and Kromek RadAngel sensor itself. The same setup was processed using the RGB mode (Figure 17b), but this did not operate as hoped due to numerous colour interfaces upon the object itself. The operation was successfully repeated in mode 3 with the box moved slightly, although this error indicates a consistency limitation to the system. This box was scanned twice, once with a safety margin of 10 mm and once with no safety margin. In Figure 18, these results are shown as “Box dXdYdZ (10 mm)” and “Box dXdYdZ (0 mm)”. Two further box orientations were tested here too, one where only X changes (“Box dX”), and once where just X and Y change (“Box dXdY”). Finally, a crushed-up, and thus irregularly shaped, multi-coloured box, as shown in Figure 19, was scanned with a 309 kBq 137Cs source hidden in one of the cardboard folds. In each case, the scanning system successfully located the source as shown in Figure 18. As would be expected, the results achieved with no safety margin indicate the highest count rate. The Box dX results concern a flat box facing normal to the sensor and robot system and thus there is no angle error, as discussed in Section 4.
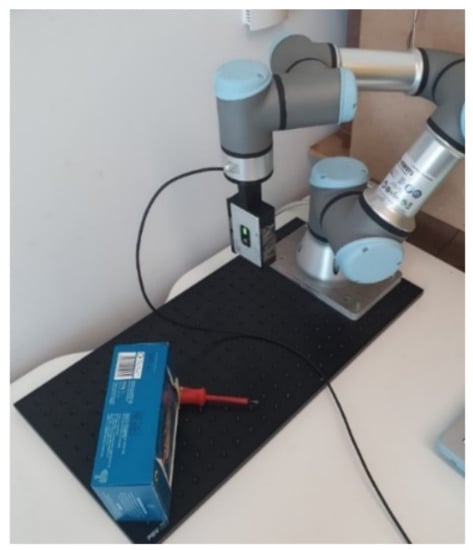
Figure 16.
Box with varying X, Y and Z.

Figure 17.
Canny algorithm incorrectly determining the box shape (a) using the LIDAR based algorithm; (b) using the RGB algorithm.
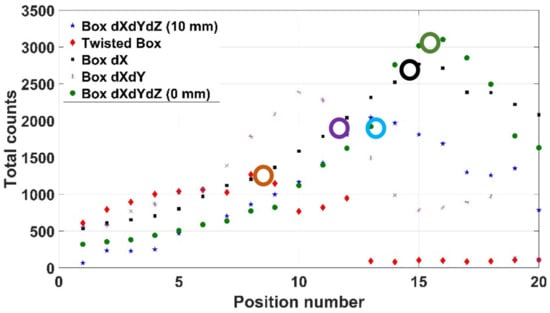
Figure 18.
Box results using mode 3. The real source positions are noted with circles upon the lines.
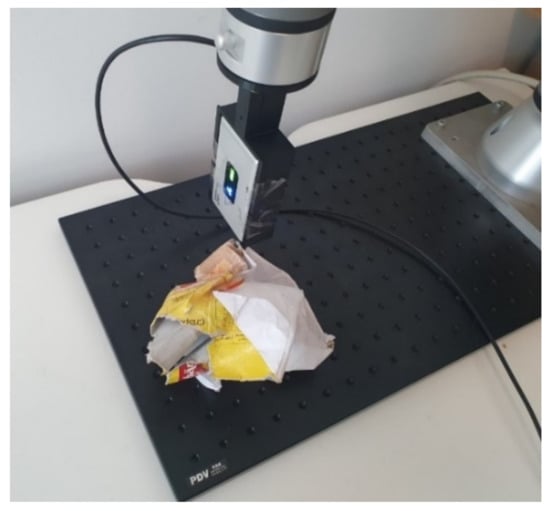
Figure 19.
The irregular and multi-coloured box.
5.3. Scanning Personal Protection Equipment (PPE) Using Modes 2 and 3
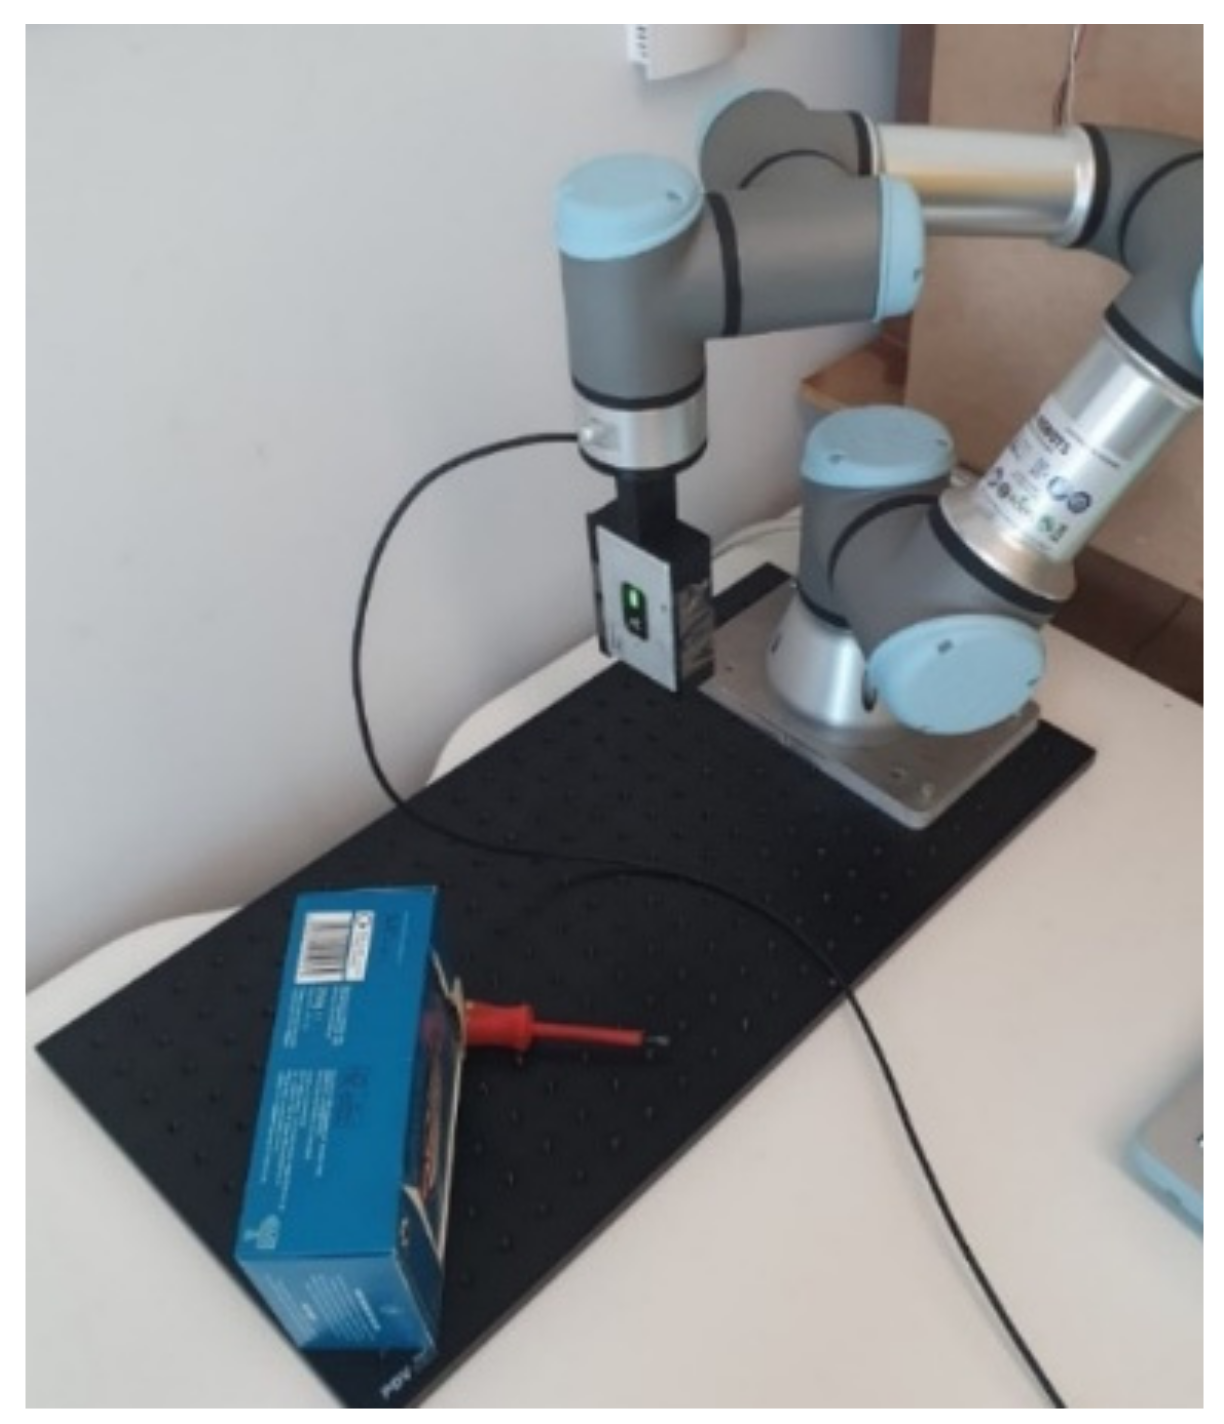
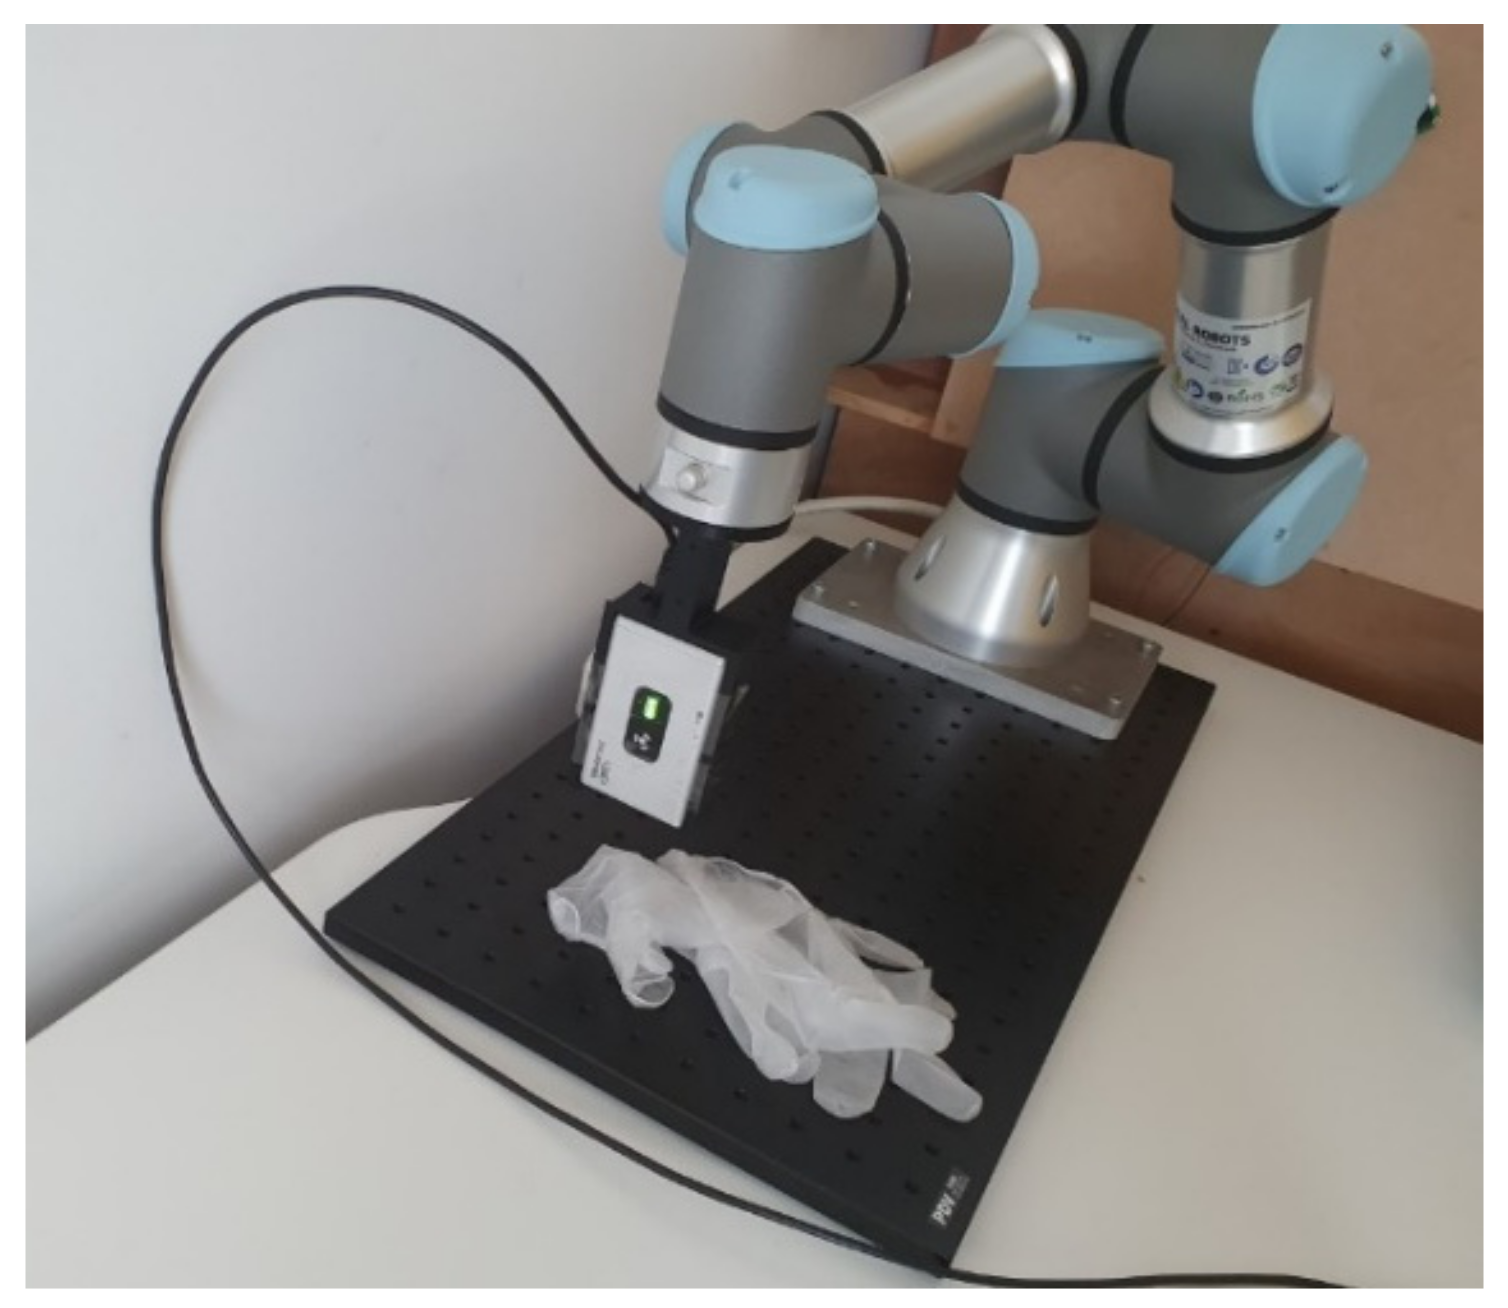
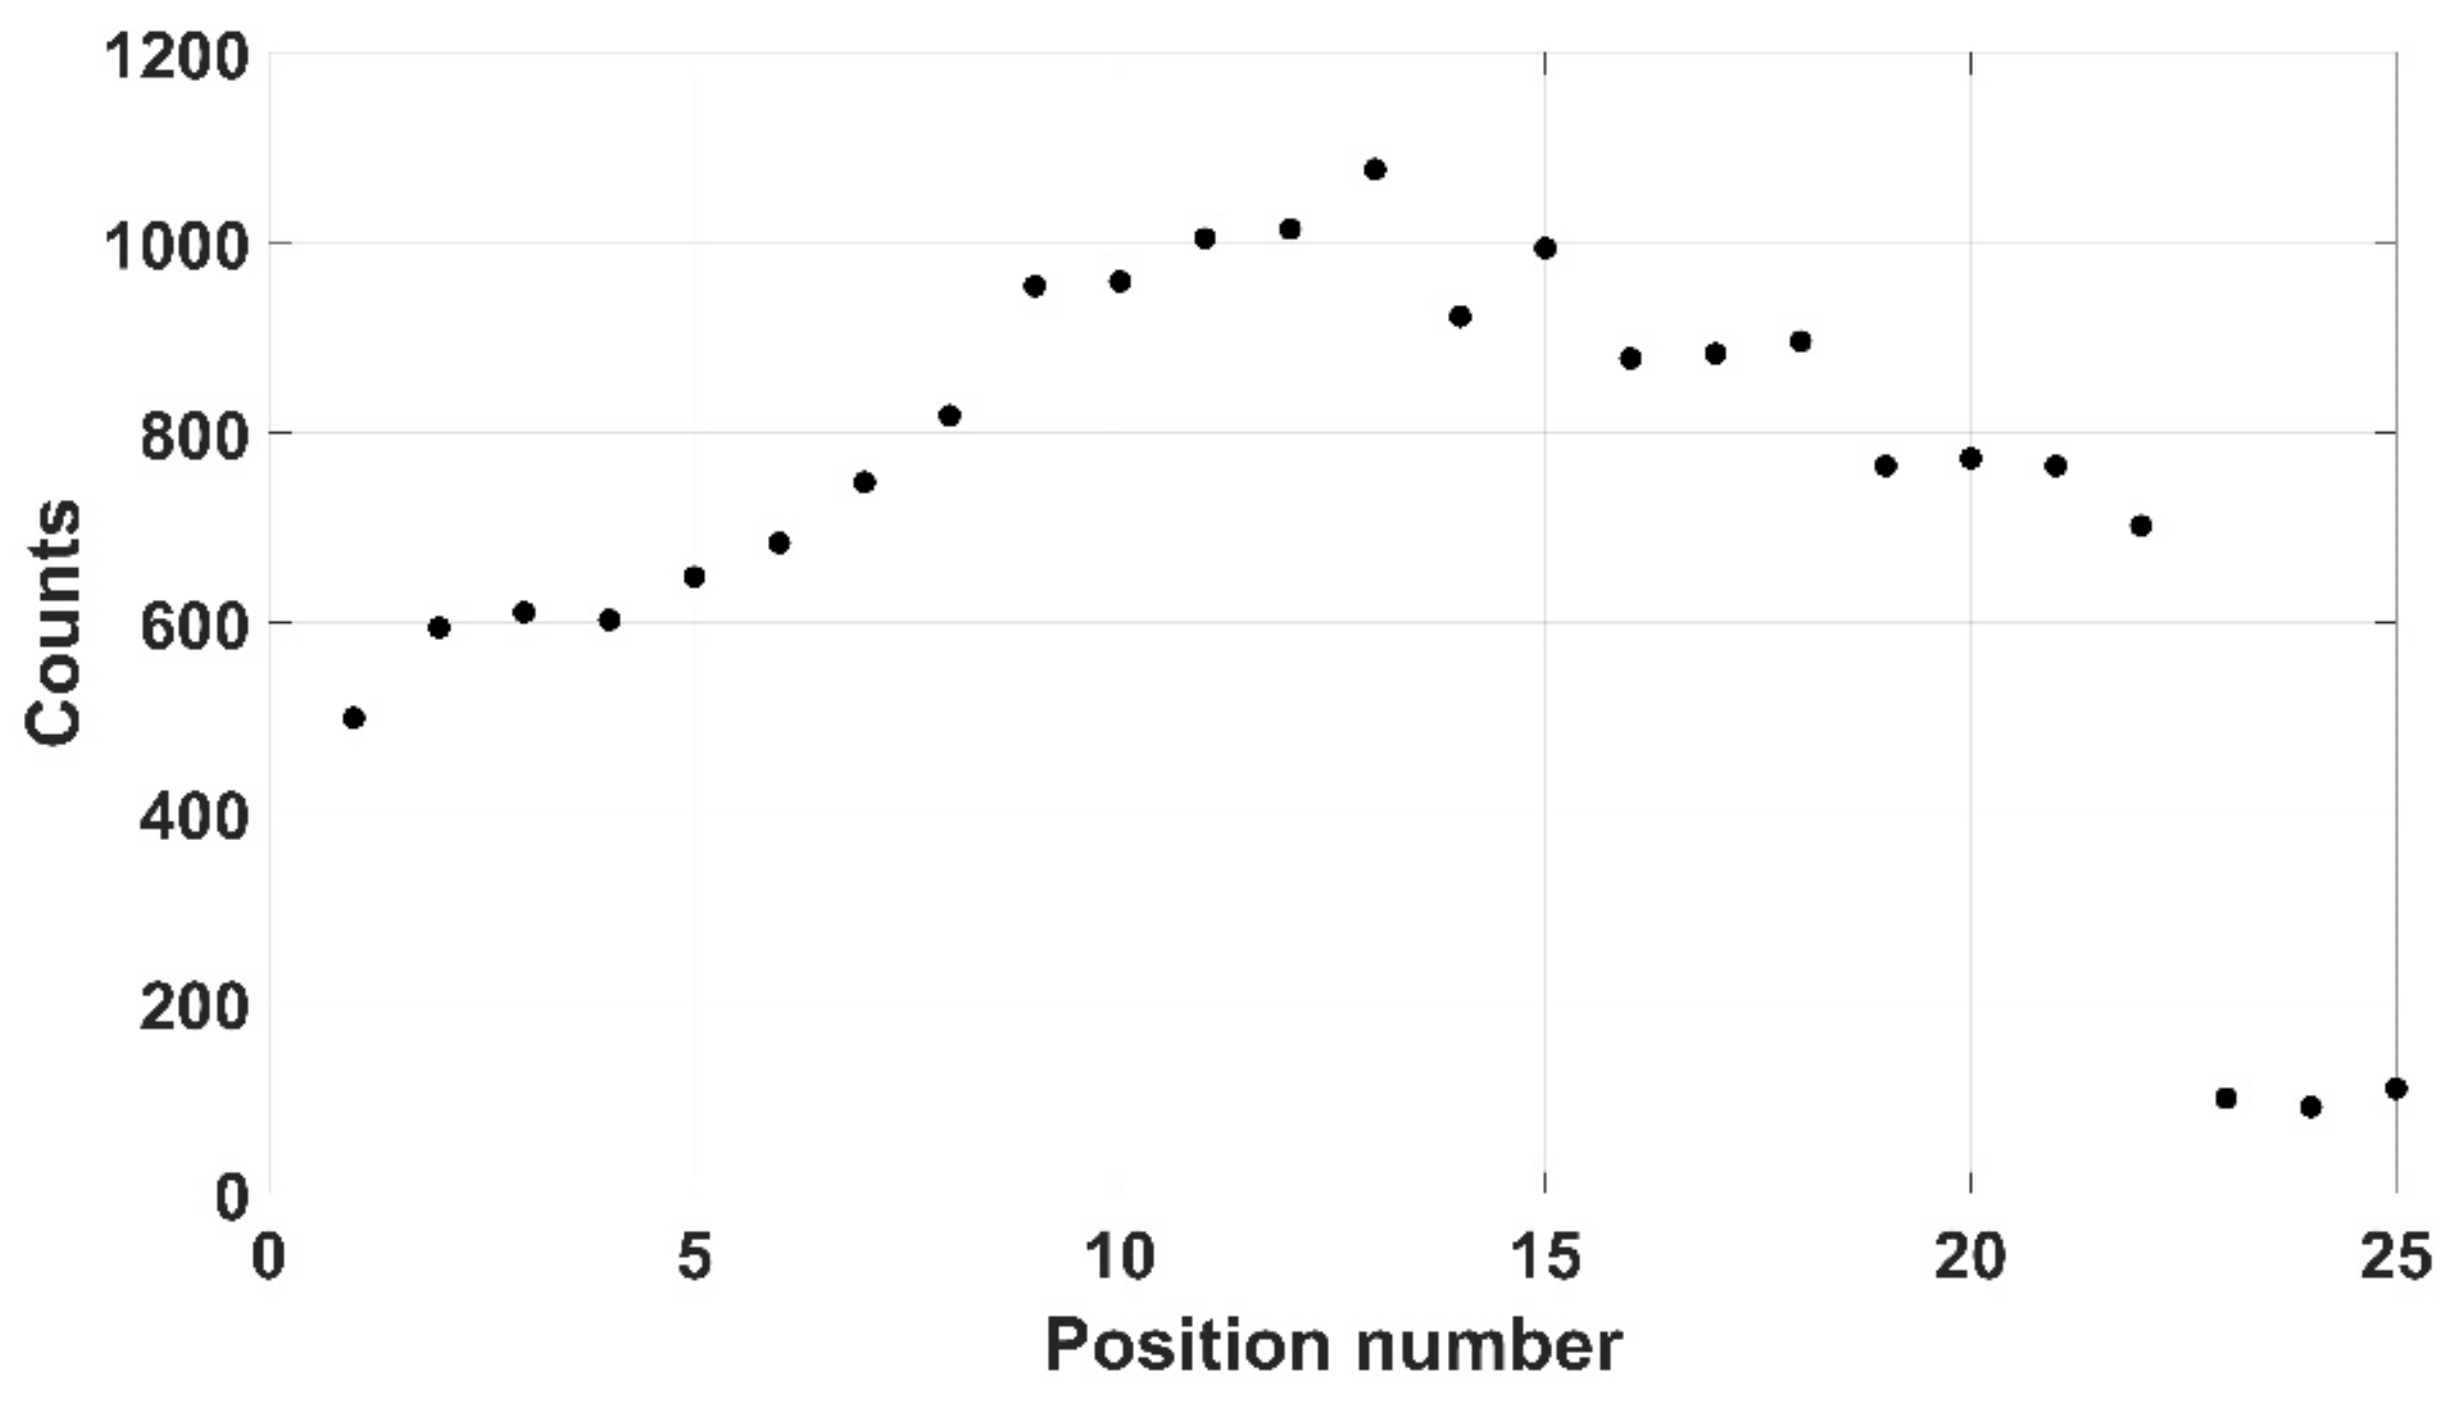
Three pieces of typical PPE used in the nuclear industry were selected here: disposable gloves, overshoes and a lab coat. The disposable gloves (mass of 6 g), were initially chosen as a realistic form of PPE and a 309 kBq 137Cs source was placed between the gloves. Both mode 2 and mode 3 were able to successfully scan the gloves, as shown in Figure 20, although mode 3 was selected as it ensured that the process would not be affected by colour similarity. A safety margin of 10 mm was chosen to ensure any theoretical contamination on the gloves could not impinge on the detector itself. Twenty-five positions were taken up by the instrument with 10 s spent at each, indicating a total scan time of 250 s (results shown in Figure 21).
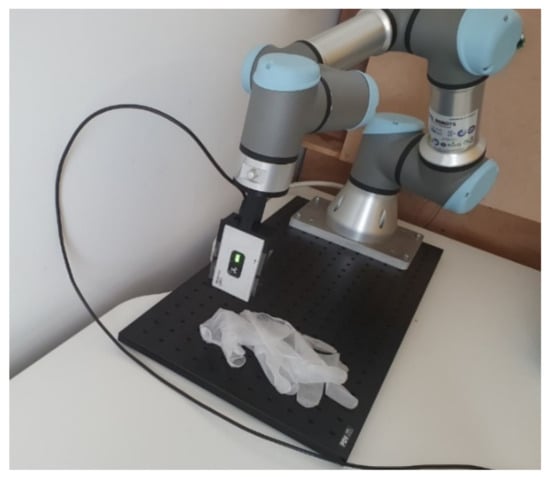
Figure 20.
Gloves being scanned by the Kromek RadAngel and UR3 manipulator.
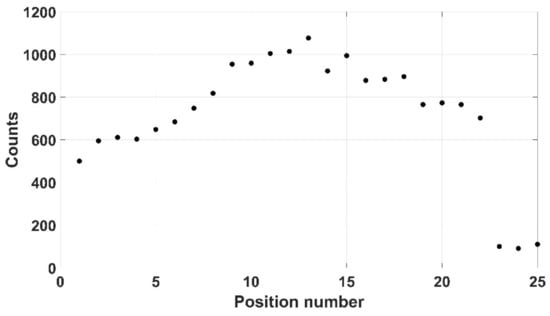
Figure 21.
Counts recorded when scanning over the protective gloves.
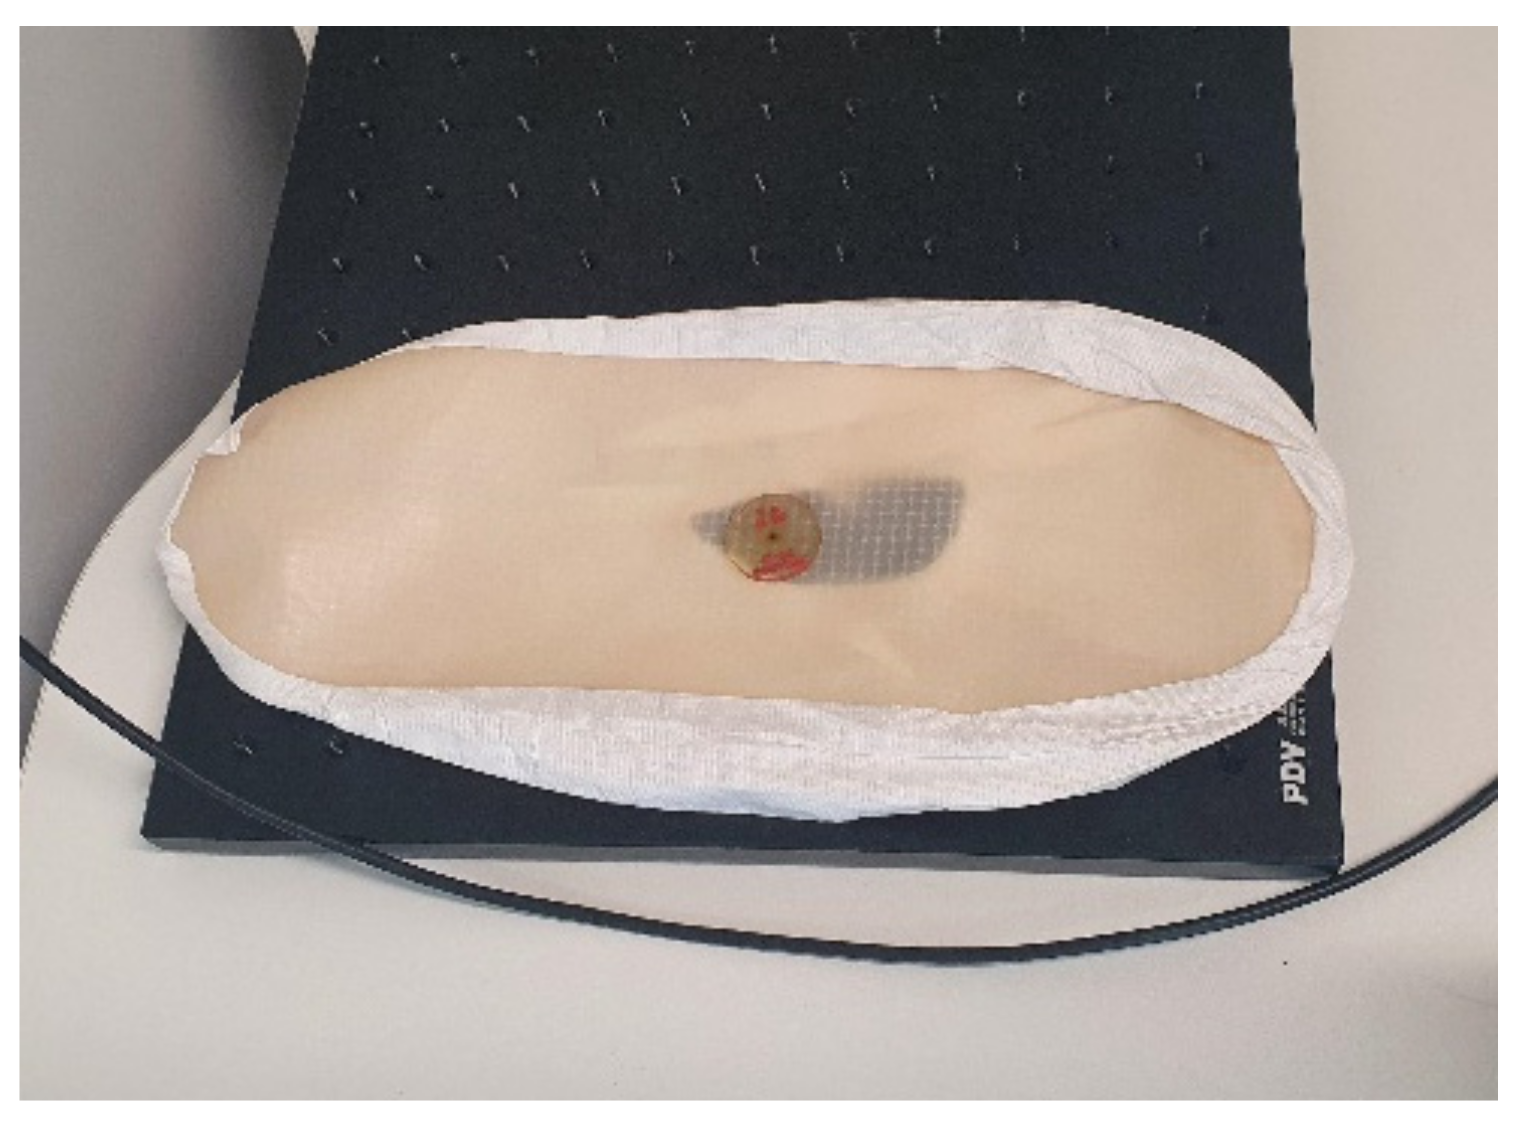
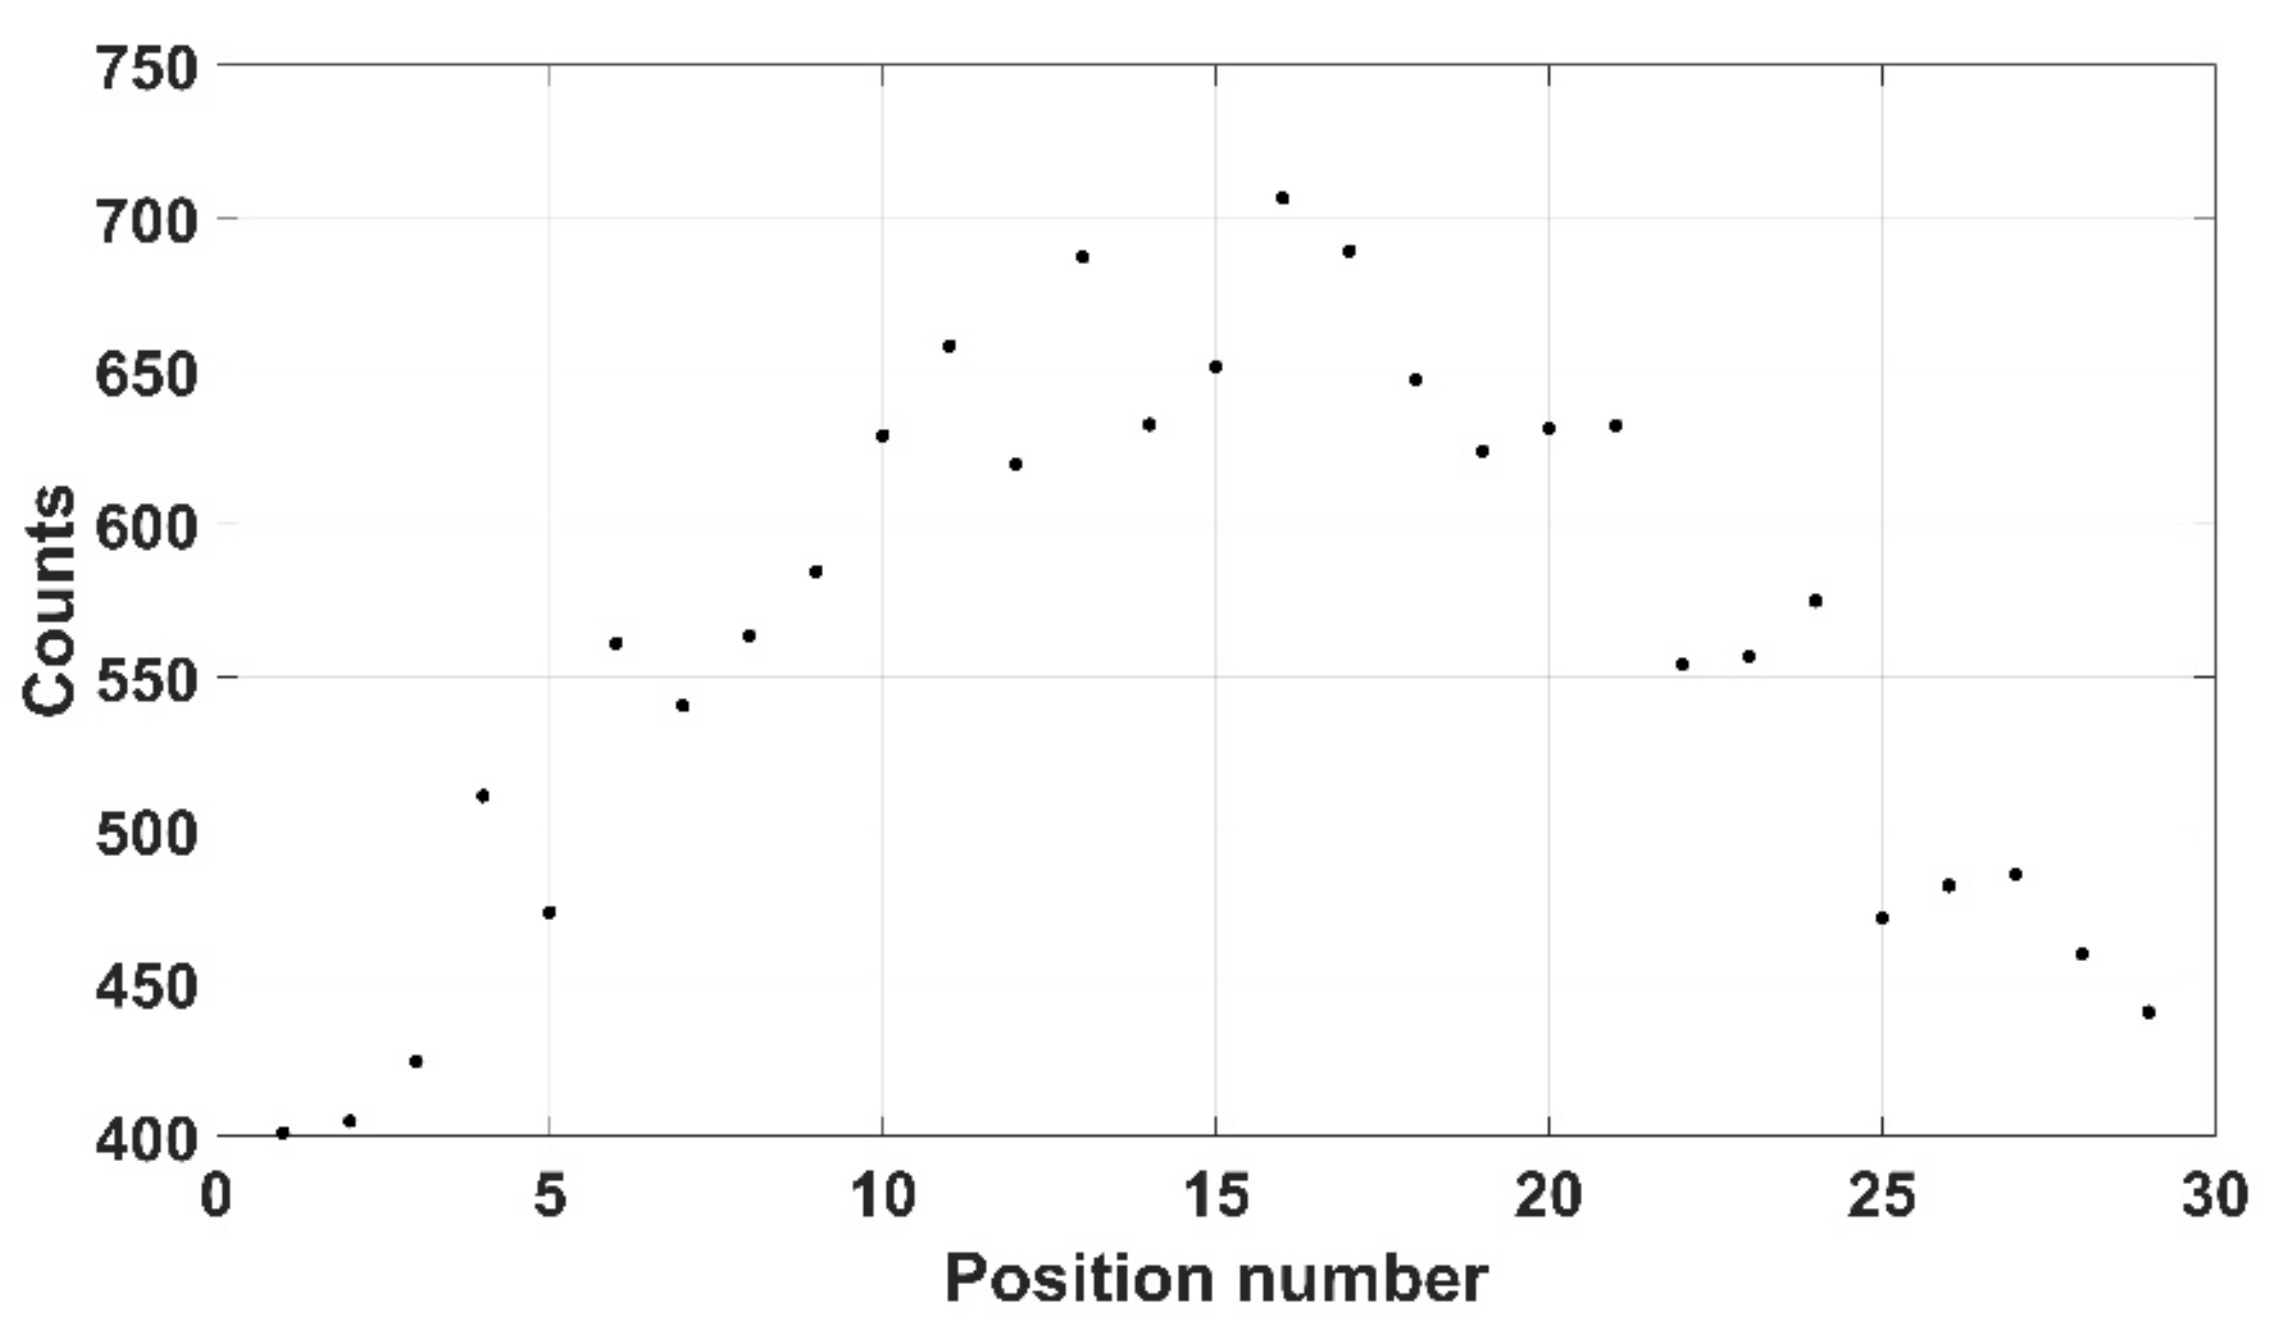
Overshoes worn in the laboratory are potentially a problem due to attachment to the sole as a worker inadvertently stands on a stray radionuclide. Here, a 309 kBq 137Cs source was placed upon a used 27 g overshoe, as shown in Figure 22. Here, mode 3 was not viable due to the thinness of the shoe and so mode 2 was used instead, with Figure 23 showing the counts recorded. Here, only 5 s per position was taken, with a safety margin of 5 mm—i.e., a total of 22 mm between crystal and source.
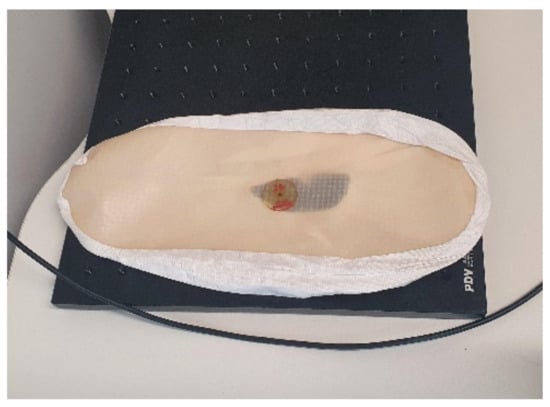
Figure 22.
Shoes with artificial contamination.
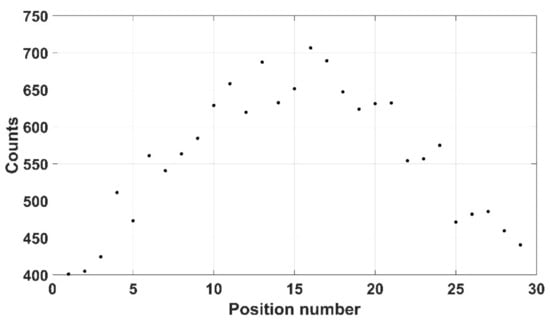
Figure 23.
Lab shoe counts.
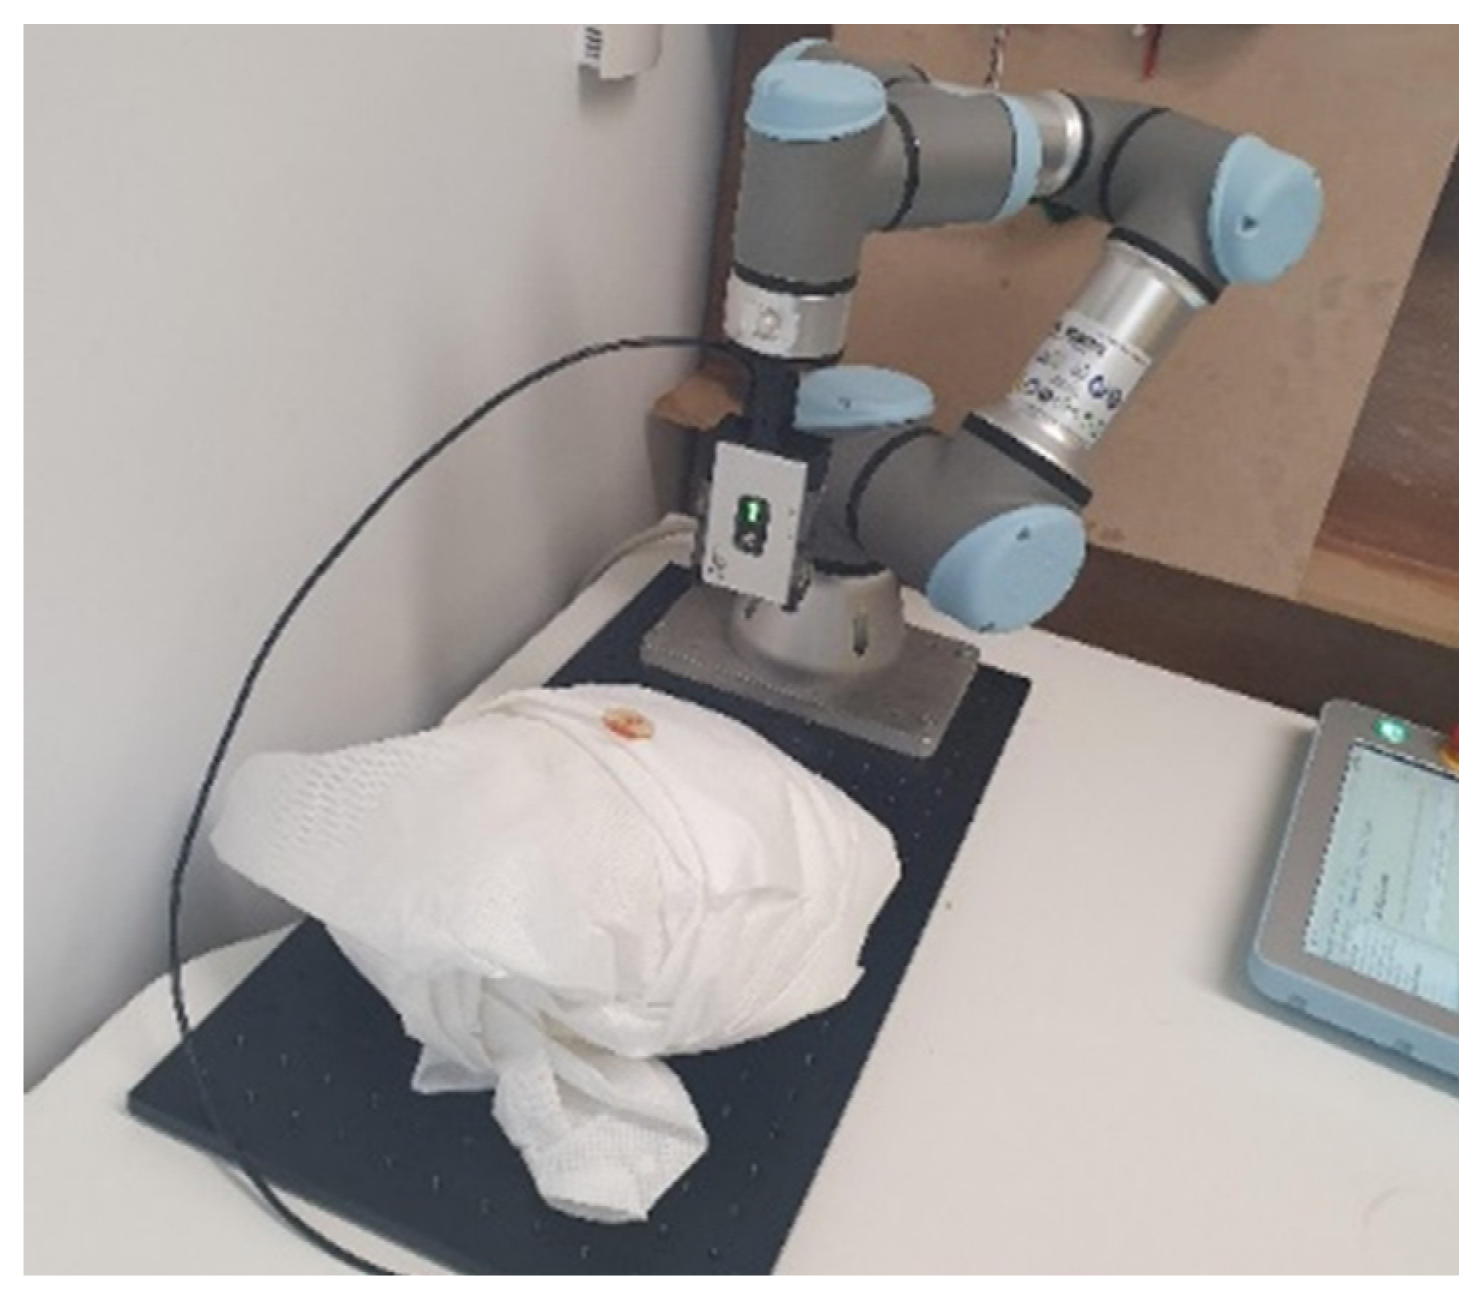
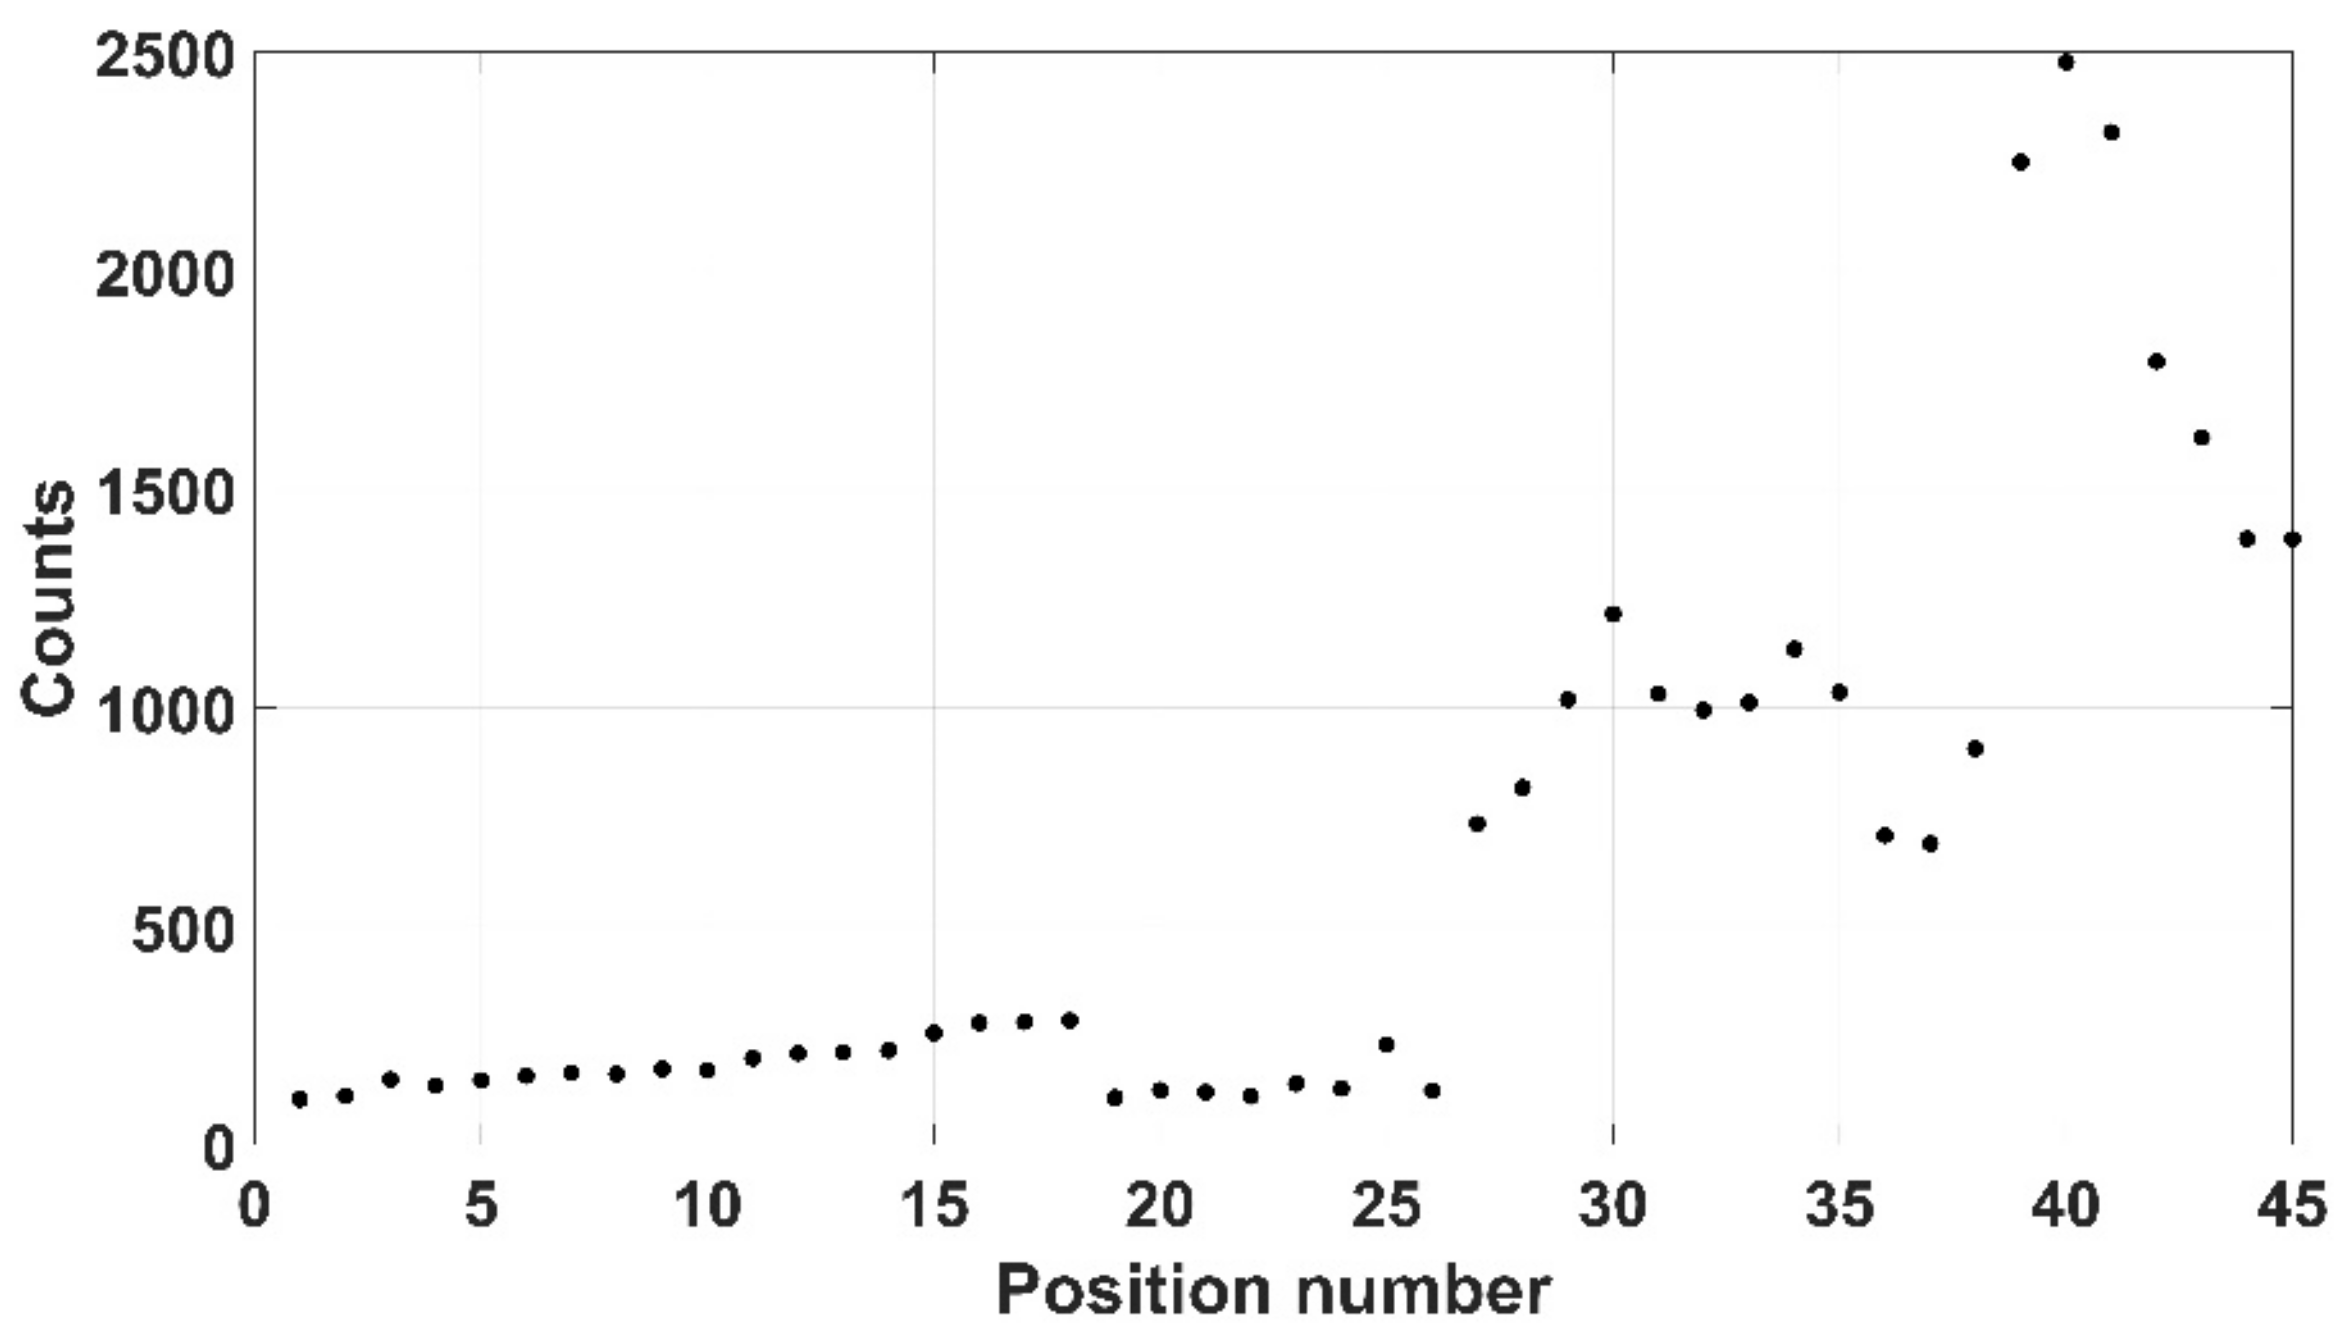
Finally, a 500 g tightly folded lab coat was used with a source located on the top of the garment, as shown in Figure 24. Here, due to the larger size of the item, 45 positions were chosen with the source hidden within one of the folds of the jacket. A 10 mm safety margin was again selected, indicating a distance of 27 mm between crystal and source. Further, a larger scan time per position was chosen (30 s) equating to a significantly longer scan time of 1350 s. The results shown in Figure 25, indicate a maximum recorded count rate of 83.33 cps.
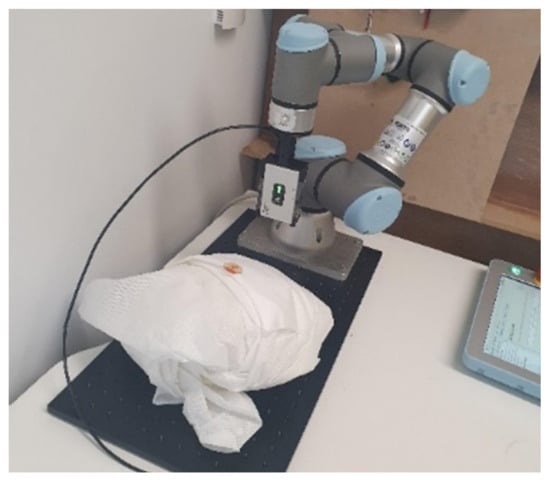
Figure 24.
Folded lab coat.
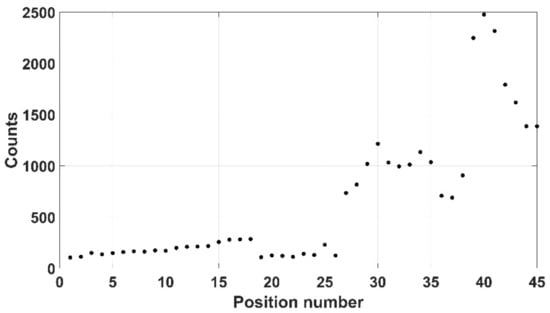
Figure 25.
Folded lab coat counts at each position.
6. Discussion
A series of commercially available devices have been utilised to develop a three-mode novel radiological scanning system capable of semi-autonomously inspecting various objects for possible contamination and determining whether the item should be characterised as LLW or ILW. The cost to dispose of different waste categories varies significantly depending on the physical composition of the waste, and thus exact costs are hard to ascertain. However, rough costs are ~GBP 3000/m3 for LLW, ~GBP 50,000/m3 for ILW and ~GBP 500,000/m3 for HLW [1,2,3]. Thus, there is a desire to not only determine the counts recorded by the detector, but also the specific activity of the item. In beta/gamma terms, the boundary between what is considered to be LLW and ILW occurs at 12 GBq/t or 12 kBq/g. With some assumptions, it is possible to determine the category the items here would be in. The specific activity of the source, α, in bq/g is given by (19), where A is the surface area of the sensor volume perpendicular to the incoming radiation (in mm2), L the distance between source and sensor (in mm), E the intrinsic efficiency of the sensor (i.e., ratio of radiation recorded to radiation incident), M the mass of the item (in g) and R the number of counts recorded per second (in cps).
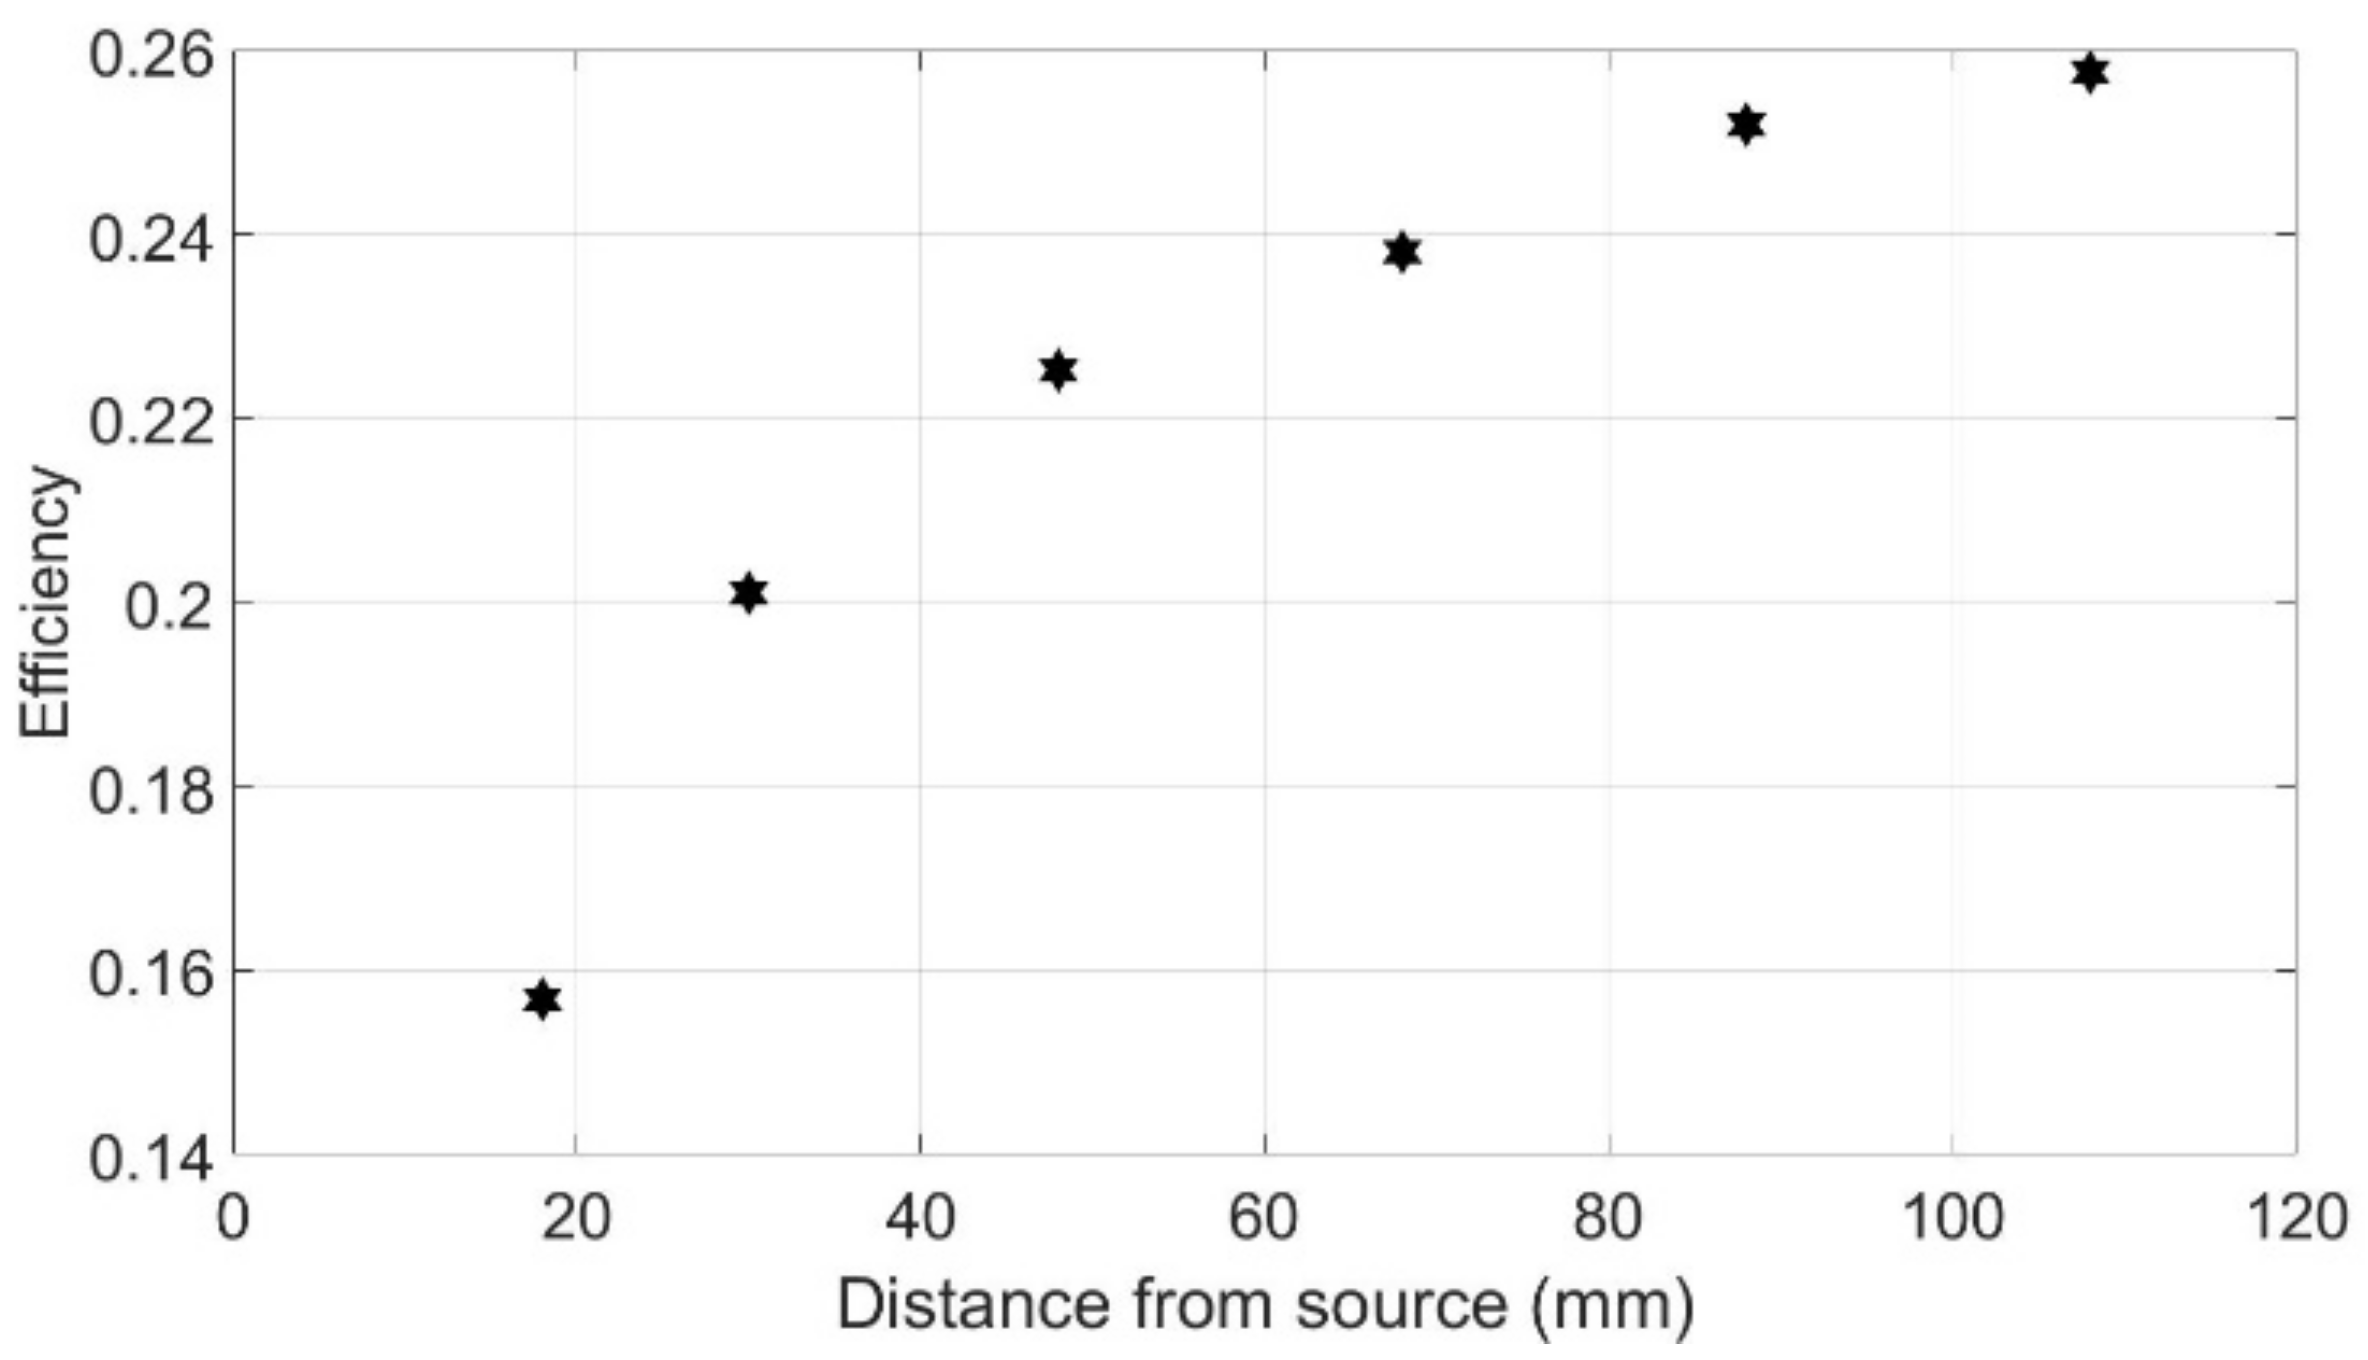
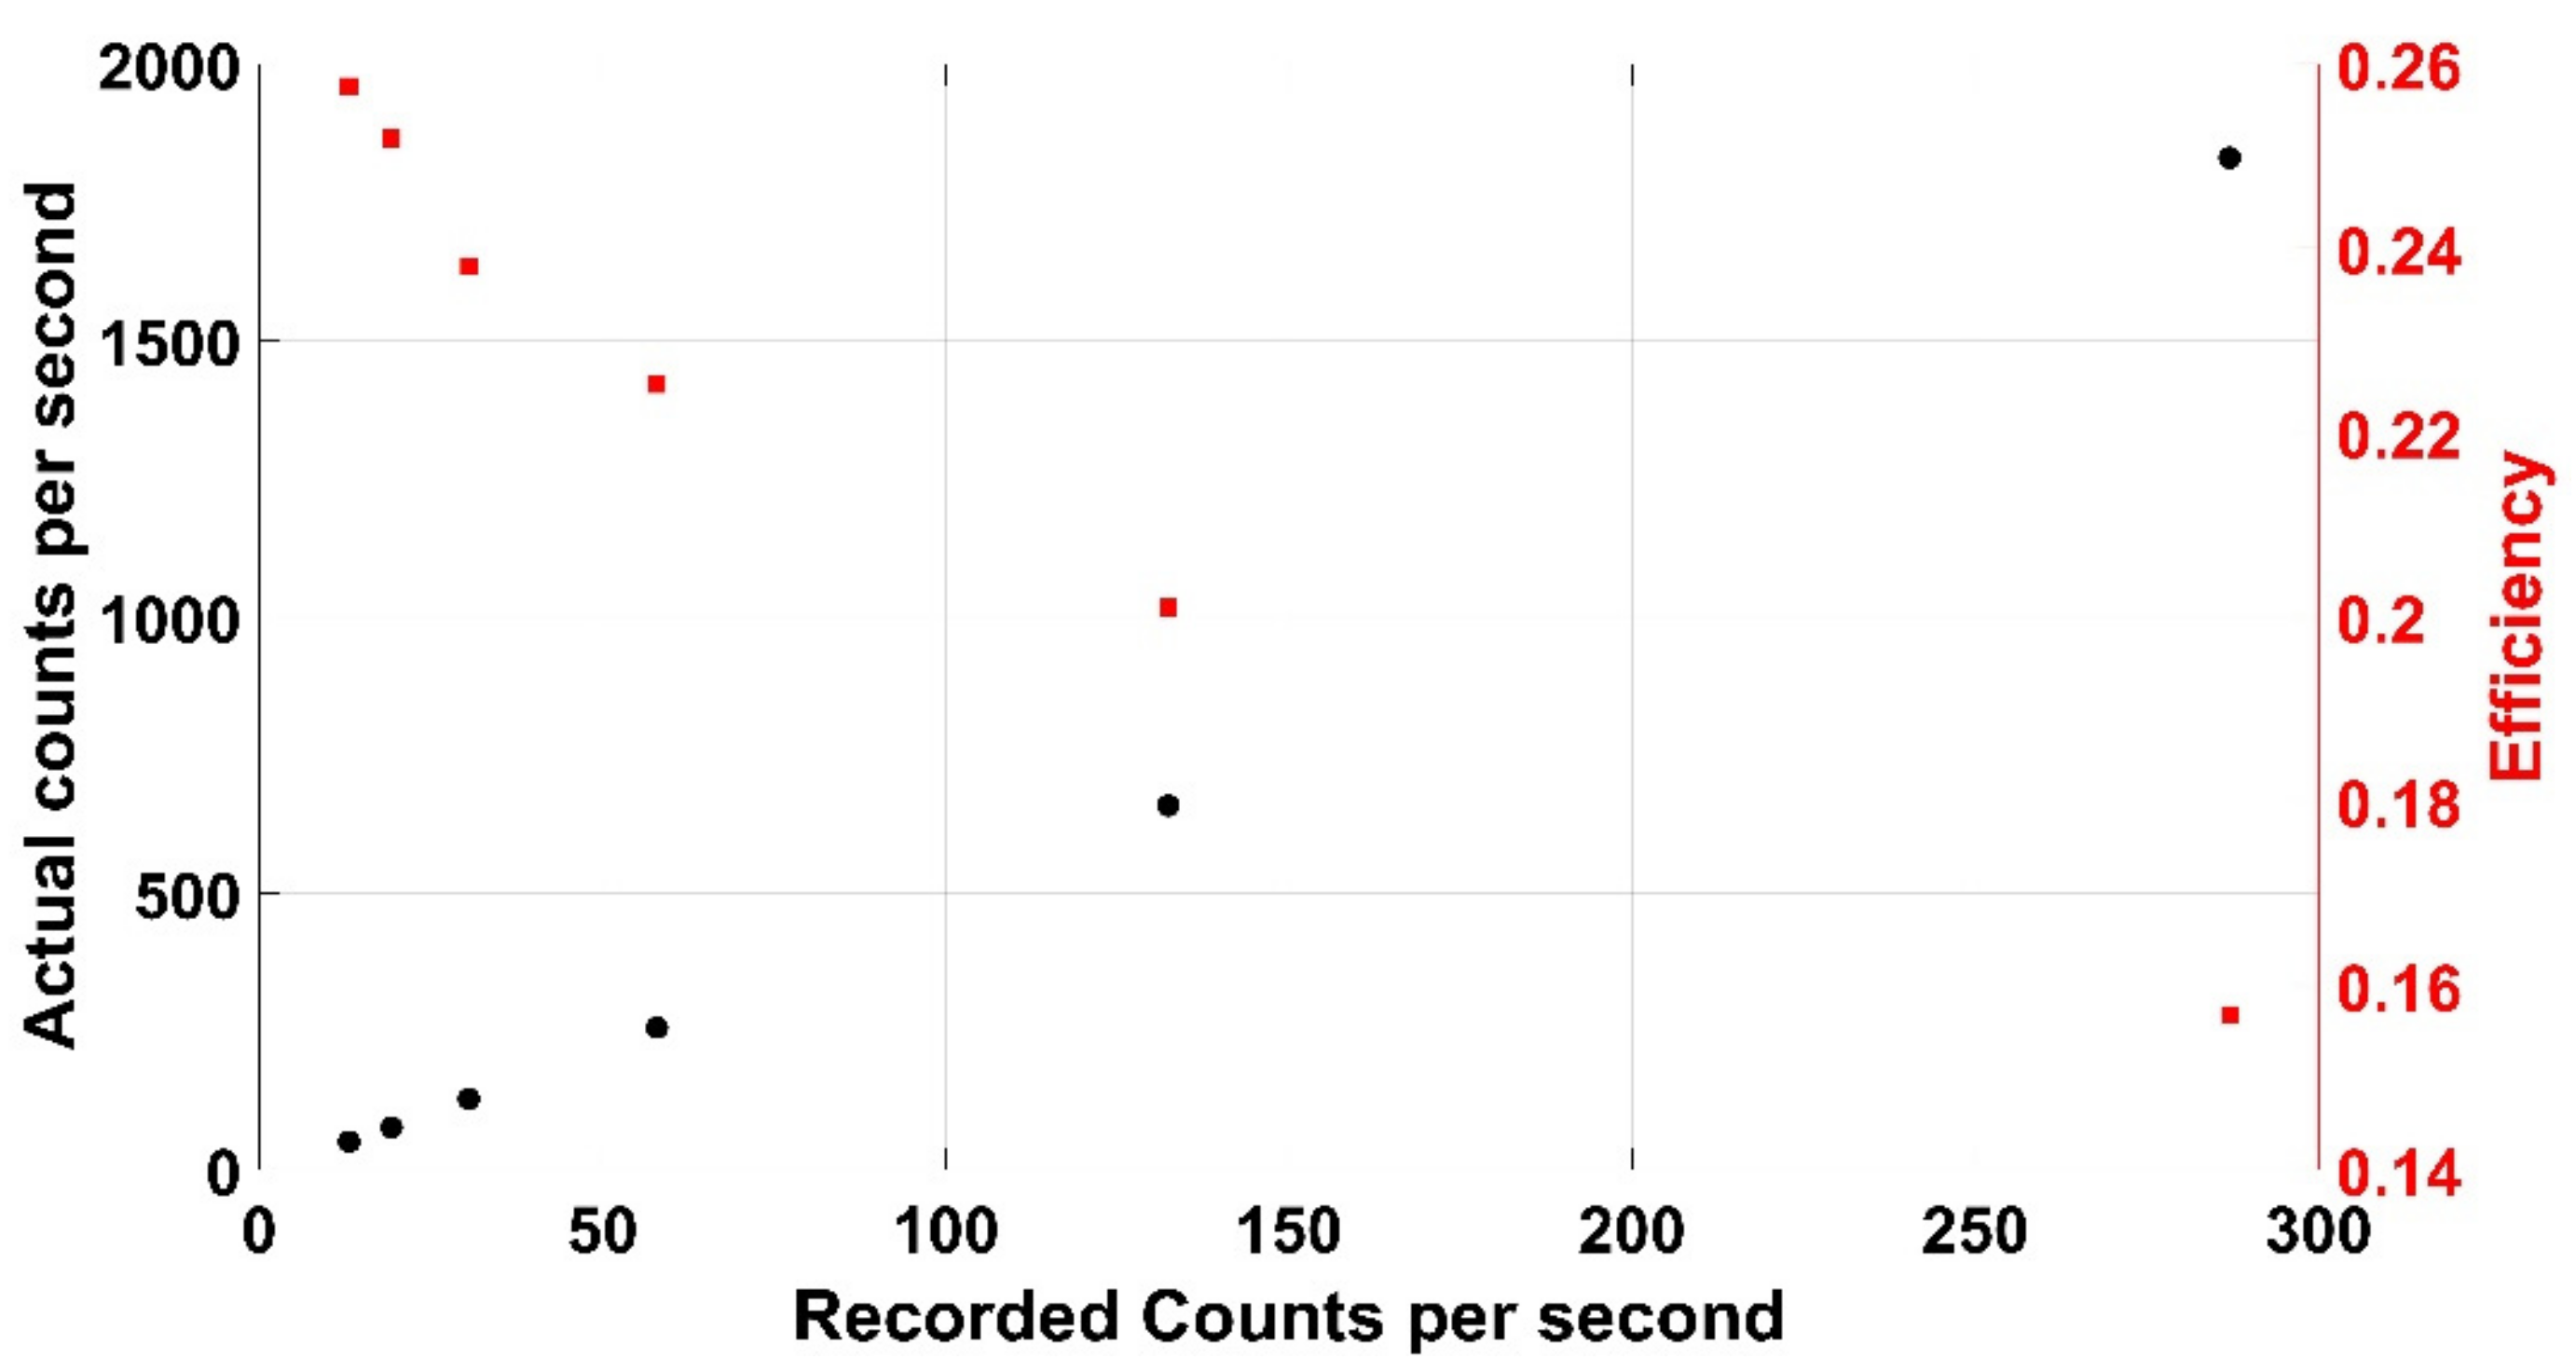
The Kromek RadAngel detector features a cubic CZT crystal with a side length of 5 mm. Although the radiation may not always be incident normal to the crystal, in the context of this work this is an acceptable approximation (as long as L >> A) and thus A is accepted as 25 mm2 here. A 298 kBq 137Cs source was placed at six different distances between 18 and 108 mm from the crystal allowing a figure of intrinsic efficiency to be determined using (18). The figure calculated was found to be dependent on distance from the source and therefore counts, as shown in Figure 26. This same information is presented in Figure 27, where actual count rate and efficiency are plotted against recorded count rate. This variation in efficiency is likely to be due to saturation effects via pulse pile-up. This information can further remove the need for an efficiency figure in Equation (19) as a simple polynomial can be calculated to relate counts recorded to actual counts incident on the crystal as shown in Equation (20) where the 4π in Equation (19) has been folded into the bracket.
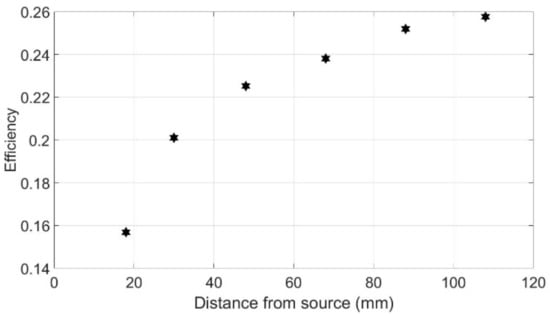
Figure 26.
How the efficiency of the detector varies with distance from a 298 kBq Cs-137 source.
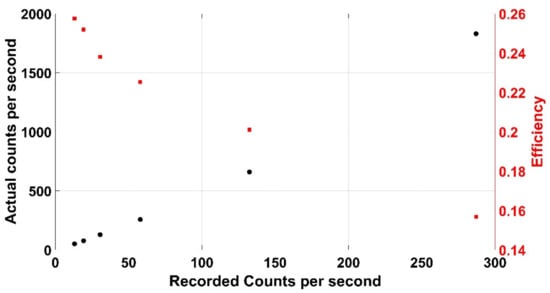
Figure 27.
How the efficiency and number of counts incident varies with recoded counts from a 298 kBq 137Cs source.
A set of kitchen scales was further used to determine the mass of the PPE used and thus allow a calculation of approximate specific activity. An obvious extra complication here is in the exact definition of specific activity. The lab coat in section C above for example, has a mass of 500 g. If a 500 kBq radionuclide contaminated the cuff of the jacket, this would mean the entire item had a specific activity of 1 kBq/g. However, if the arm of the jacket (mass 60 g) was separated, then this would have a more significant specific activity of 8.3 kBq/g. This discrepancy ensures that there may be two values to consider, one obviously significantly easier to ascertain than the other.
The laboratory gloves were scanned over 25 positions for 10 s (total scan time 250 s). The results showed a maximum reading of R = 107 cps showing the specific activity of the source to be 31,177 Bq/g from Equation (19). This is obviously above the 12,000 Bq/g threshold for ILW and if this simulant were a real object, then it would have to be disposed as such. In the case of the lab shoes, a reduced safety margin was selected and thus a faster scanning time could be achieved—150 s as opposed to 250. A maximum of R = 142 cps was recorded, and using an efficiency figure of 0.17, Equation (19) gives the specific activity as 6497 Bq/g.
This is below the 12,000 Bq/g limit and thus would be recorded and disposed of as LLW. The same 309 kBq 137Cs source was used within the lab jacket producing a specific activity of 279 Bq/g (R = 93.33 cps) where a mass of 500 g has been used. This value is obviously lower than the rest as the lab coat is significantly heavier than either the gloves or lab shoes.
Each of the three software modes has its own strengths and drawbacks. The higher resolution of the RGB camera, as opposed to the time-of-flight-based depth sensor, indicates greater accuracy in terms of optimum end effector orientation and position. However, some weaknesses in this camera mean that, in certain circumstances (e.g., object similar colour to background, multi-coloured object or bright sunshine), this algorithm was not suitable. The depth sensor was also shown to exhibit significant limits, with Figure 11, for example, indicating that the depth sensor does not always operate flawlessly.
The inverse Jacobian-based kinematics model implemented within the MATLAB environment was successful in its operations, although the time required to calculate the inverse Jacobian was sometimes significant. In these scenarios, an alternative method was used, involving use of the ikunc function, available within Peter Corke’s robotics MATLAB toolbox [33]. Either method worked successfully, however, with only the time taken to calculate the required joint angles varying between the two.
The bespoke Python-based software algorithm developed by the authors within a ROS environment allows the operator access to the radiological spectra shape over several locations across the object with number of positions and time spent at each being user selectable (usually to match that determined by the vision algorithm).
Repeatability of counts acquired by the Kromek RadAngel sensor were proven where there was a similarity of around 98% recorded between the results achieved over 5 identical scans. The repeatability boasted by the MS Kinect V2 was less so, however. The determination of Y position using the depth sensor yields a maximum deviation of around 1 mm observed across four scans and a standard error of 0.476. Repeatability in the Z axis (depth) has a deviation of 16 mm (1.5%) observed in the same scenario and a standard error of 4.03. These conclusions are broadly in agreement with Bonnechere et al. [39], with the Kinect providing relatively good repeatability, especially considering the price paid in comparison to other, more advanced options. However, it can be concluded in this work that the vision system was the weak point of the three constituent systems. The Kromek RadAngel sensor and the UR3 manipulator operated successfully consistently throughout this work, while the Kinect vision system would quite often operate incorrectly, either by conflating two different depths into one or failing to consistently show the interfaces between colours or depths. As mentioned above, there are numerous other OTS vision-based systems available which could be used to help address this issue following further research.
Results indicate that the system can successfully semi-autonomously scan most objects, subject to certain restrictions. Relatively large objects, for example, are difficult to physically characterise within this particular physical system, although the limited lab space available is also a factor. The UR3 robot has only a reach of 500 mm and thus scanning an object with a large bulk may not be possible, especially as the vision system can be confused by objects such as the sensor head being at the same depth as the object and thus a depth interface may not be evident. However, operating in a larger physical area and using a larger robot (e.g., Universal robots UR5 or UR10), this vision system would be anticipated to operate more successfully.
Another significant limitation in the current system is in the inability to determine the thickness of the object. Initial work was undertaken with an orthogonal cardboard box with a depth of 72 mm, with this value assumed throughout the rest of the work. The most obvious way to overcome this limitation would be to install a second vision sensor located orthogonally to the work area, with the depth data acquired from this. If the field of view of the two sensors were perpendicular to each other, then the mathematical transform to create genuine depth data would be relatively simple.
Success in scanning typical PPE was demonstrated, although the scanning of perfectly placed items with conveniently located sources is only part of a realistic scanning scenario. Realistic PPE items which have been placed in waste disposal bins are unlikely to be so conveniently orientated.
There is obviously future development potential in this work with several improvements which could be implemented. Firstly, an improved OTS vision system could be utilised in order to improve determination of optimum manipulator pose. The market is currently flooded with advanced vision systems of this nature and this would not be a prohibitive step for financial reasons. A further development would also to feature two or more vision systems in order that vision from all angles could be implemented into the software algorithm. A physically larger manipulator would also be an option with several options available such as the hydraulically actuated KUKA KR180. Finally, an improved radiation detector could be used which would allow a lower detection threshold when assessing more distributed sources. Here we have only considered objects with discrete hotspots due to the ease of testing (sealed sources have no associated disposal costs, and are far safer due to lack of risk of inhalation, for example). However, more distributed contamination would produce a lower emission rate but over a greater area, and thus a detector with a larger sensitive area than 5 mm × 5 mm may be preferred.
7. Conclusions
Here, we have demonstrated a semi-autonomous triple-mode scanning system, which incorporates a Microsoft Kinect V2 vision system, a Universal robots UR3 robot manipulator, and a Kromek RadAngel radiation sensor. The aim of the work was to aid in the reduction in disposal costs of items such as PPE by roughly determining the specific activity of items. Determining that several items have a specific activity of less than 12 kBq/g could reduce the disposal cost from GBP 10,000/m3 to GBP 1000/m3. The system is controlled via MATLAB with an inverse Jacobian kinematics model developed and implemented here. The exception is the Kromek RadAngel, which operates via a bespoke algorithm written in Python within a ROS operating system, allowing a bespoke number of scanning positions and scanning times to be selected. A relationship was determined to link the specific activity of the source with the determinable parameters; counts recorded by the Kromek RadAngel were the distance between the source and the sensor and the mass of the item. It was observed that the efficiency of the Kromek RadAngel varied with count rate and thus this polynomial dependence has been folded into this dependence. Three typical items of PPE (gloves, shoes and coat) were tested using this system with 137Cs coin sources embedded amongst them. The system was successful in each case with the coat and the shoes determined to be in the LLW category while the gloves were ILW. Experimental results have helped to identify several weaknesses in the prototype system developed to date. The Kromek RadAngel was found to exhibit excellent repeatability with a similarity of 98% recorded when a source was scanned five times. However, this level of repeatability was not observed in the Kinect V2 vision system where a variance of 80.1 was observed when again a scenario was scanned five times. The use of only one sensor to determine the optimum robotic pose was also a limiting factor although this could easily be solved by implementing an extra vision system. Further, the UR3 robot only has a range of 500 mm and so this limits the items which can be scanned. However, either the UR5, UR10 or even larger robots such as a KUKA KR180 could obviously remedy this.
Author Contributions
Conceptualization, S.D.M.; methodology, S.D.M.; software, S.D.M., C.W., M.B. and N.D.; validation, S.D.M.; formal analysis, S.D.M.; writing—original draft preparation, S.D.M.; writing—review and editing, all; funding acquisition, D.C. and C.J.T. All authors have read and agreed to the published version of the manuscript.
Funding
This work was funded by the UK Engineering and Physical Sciences Research Council (EPSRC) grants EP/R02572X/1 and EP/V027379/1.
Institutional Review Board Statement
Not applicable.
Informed Consent Statement
Not applicable.
Data Availability Statement
Not applicable.
Acknowledgments
Thanks to Jess Fisher and Ashley Jones for supplying the PPE used in this work and Kromek for information and for supplying the drawings presented here.
Conflicts of Interest
The authors declare no conflict of interest.
References
- Assessment of the Geological Disposal Facility Implications for the Products of Reprocessing Compared to the Direct Disposal of the Spend Fuel, NDA Technical Note Number 16518861; Nuclear Decommissioning Authority: Cumbria, UK, 2012.
- White, S.R.; Megson-Smith, D.A.; Zhang, K.; Connor, D.T.; Martin, P.G.; Hutson, C.; Herrmann, G.; Dilworth, J.; Scott, T.B. Radiation Mapping and Laser Profiling Using a Robotic Manipulator. Front. Robot. AI 2020, 7, 9056. [Google Scholar] [CrossRef]
- Waste Transfer Pricing Methodology for the Diposal of Higher Activity Waste from New Nuclear Power Stations; Department of Energy and Climate Change: London, UK, 2011.
- RoMaNs Project. Available online: https://cordis.europa.eu/project/id/645582 (accessed on 19 August 2021).
- Sun, L.; Zhao, C.; Yan, Z.; Liu, P.; Duckett, T.; Stolkin, R. A Novel Weakly-Supervised Approach for RGB-D-Based Nuclear Waste Object Detection. IEEE Sens. J. 2018, 19, 3487–3500. [Google Scholar] [CrossRef] [Green Version]
- Marturi, N.; Rastegarpanah, A.; Rajasekaran, V.; Ortenzi, V.; Bekiroglu, Y.; Kuo, J.; Stolkin, R. Towards Advanced Robotic Manipulations for Nuclear Decommissioning. In Robots Operating in Hazardous Environments; InTech: Vienna, Austria, 2017. [Google Scholar]
- Ortenzi, V.; Marturi, N.; Mistry, M.; Kuo, J.; Stolkin, R. Vision-Based Framework to Estimate Robot Configuration and Kinematic Constraints. IEEE/ASME Trans. Mechatron. 2018, 23, 2402–2412. [Google Scholar] [CrossRef] [Green Version]
- Talha, M.; Ghalamzan, E.A.M.; Takahashi, C.; Kuo, J.; Ingamells, W.; Stolkin, R. Towards robotic decommissioning of legacy nuclear plant: Results of human-factors experiments with tele-robotic manipulation, and a discussion of challenges and approaches for decommissioning. In Proceedings of the 2016 IEEE International Symposium on Safety, Security, and Rescue Robotics (SSRR), Lausanne, Switzerland, 23–27 October 2016; pp. 166–173. [Google Scholar]
- Okada, S.; Hirano, K.; Jp, P.E.; Kobayashi, R.; Kometani, Y. Development and Application of Robotics for Decommissioning of Fukushima Daiichi Nuclear Power Plant. Hitachi Rev. 2020, 69, 562–563. [Google Scholar]
- Kawabata, K. Toward technological contributions to remote operations in the decommissioning of the Fukushima Daiichi Nuclear Power Station. Jpn. J. Appl. Phys. 2020, 59, 050501. [Google Scholar] [CrossRef]
- Yamada, T.; Kawabata, K. Development of a Dataset to Evaluate SLAM for Fukushima Daiichi Nuclear Power Plant Decommissioning. In Proceedings of the 2020 IEEE/SICE International Symposium on System Integration (SII), Honolulu, HI, USA, 12–15 January 2020; pp. 7–11. [Google Scholar]
- Kawatsuma, S.; Mimura, R.; Asama, H. Unitization for portability of emergency response surveillance robot system: Experiences and lessons learned from the deployment of the JAEA-3 emergency response robot at the Fukushima Daiichi Nuclear Power Plants. ROBOMECH J. 2017, 4, 706. [Google Scholar] [CrossRef] [Green Version]
- Tsitsimpelis, I.; Taylor, C.J.; Lennox, B.; Joyce, M.J. A review of ground-based robotic systems for the characterization of nuclear environments. Prog. Nucl. Energy 2018, 111, 109–124. [Google Scholar] [CrossRef]
- Irobot at Fukushima. Available online: https://www.asianscientist.com/2011/04/topnews/remote-controlled-robots-investigate-fukushima-nuclear-plant/ (accessed on 19 August 2021).
- Kawatsuma, S.; Fukushima, M.; Okada, T. Emergency response by robots to Fukushima-Daiichi accident: Summary and lessons learned. Ind. Robot. Int. J. 2012, 39, 428–435. [Google Scholar] [CrossRef]
- Watanabe, H.; Kikuchi, S.; Narui, K.; Toyoshima, K.; Suzuki, H.; Tokita, N.; Sakai, M. Japan’s Fukushima Daiichi nuclear power plant accident. In An International Perspective on Disasters and Children’s Mental Health; Springer: Cham, Switzerland, 2019; pp. 167–190. [Google Scholar]
- Bandala, M.; West, C.; Monk, S.; Montazeri, A.; Taylor, C.J. Vision-Based Assisted Tele-Operation of a Dual-Arm Hydraulically Actuated Robot for Pipe Cutting and Grasping in Nuclear Environments. Robotics 2019, 8, 42. [Google Scholar] [CrossRef] [Green Version]
- West, C.; Monk, S.D.; Montazeri, A.; Taylor, C.J. A Vision-Based Positioning System with Inverse Dead-Zone Control for Dual-Hydraulic Manipulators. In Proceedings of the 2018 UKACC 12th International Conference on Control (CONTROL), Sheffield, UK, 5–7 September 2018; pp. 379–384. [Google Scholar]
- West, C.; Montazeri, A.; Monk, S.; Taylor, C. A genetic algorithm approach for parameter optimization of a 7DOF robotic manipulator. IFAC-Pap 2016, 49, 1261–1266. [Google Scholar] [CrossRef]
- Montazeri, A.; West, C.; Monk, S.D.; Taylor, C.J. Dynamic modelling and parameter estimation of a hydraulic robot manipulator using a multi-objective genetic algorithm. Int. J. Control. 2016, 90, 661–683. [Google Scholar] [CrossRef] [Green Version]
- West, C.; Montazeri, A.; Monk, S.; Duda, D.; Taylor, C. A new approach to improve the parameter estimation accuracy in robotic manipulators using a multi-objective output error identification technique. In Proceedings of the 2017 26th IEEE International Symposium on Robot and Human Interactive Communication (RO-MAN), Lisbon, Portugal, 28 August–1 September 2017; pp. 1406–1411. [Google Scholar]
- Marturi, N.; Rastegarpanah, A.; Takahashi, C.; Adjigble, M.; Stolkin, R.; Zurek, S.; Kopicki, M.; Talha, M.; Kuo, J.A.; Bekiroglu, Y. Towards advanced robotic manipulation for nuclear decommissioning: A pilot study on tele-operation and autonomy. In Proceedings of the 2016 International Conference on Robotics and Automation for Humanitarian Applications (RAHA), Amritapuri, India, 18–20 December 2016; pp. 1–8. [Google Scholar]
- Nancekievill, M.; Watson, S.; Green, P.R.; Lennox, B. Radiation Tolerance of Commercial-Off-The-Shelf Components Deployed in an Underground Nuclear Decommissioning Embedded System. In Proceedings of the 2016 IEEE Radiation Effects Data Workshop (REDW), Portland, OR, USA, 11–15 July 2016; pp. 1–5. [Google Scholar]
- Montazeri, A.; Ekotuyo, J. Development of dynamic model of a 7DOF hydraulically actuated tele-operated robot for decommissioning applications. In Proceedings of the 2016 American Control Conference (ACC), Boston, MA, USA, 6–8 July 2016; pp. 1209–1214. [Google Scholar]
- Tsiligiannis, G.; Touboul, A.; Bricas, G.; Maraine, T.; Boch, J.; Wrobel, F.; Michez, A.; Saigne, F.; Godot, A.; Etile, A.; et al. Evaluation and Analysis of Technologies for Robotic Platforms for the Nuclear Decommissioning. In Proceedings of the 2020 15th Design & Technology of Integrated Systems in Nanoscale Era (DTIS), Marrakech, Morocco, 1–3 April 2020; pp. 1–6. [Google Scholar]
- Miller, A.; Machrafi, R.; Mohany, A. Development of a semi-autonomous directional and spectroscopic radiation detection mobile platform. Radiat. Meas. 2015, 72, 53–59. [Google Scholar] [CrossRef] [Green Version]
- Monk, S.D.; Cheneler, D.; West, C.; Bandala, M.; Dixon, N.; Montazeri, A.; Taylor, C.J. COTS vision system, radiation sensor and 6 DoF robot for use in identifying radiologically uncharacterised objects. In Proceedings of the 2020 Australian and New Zealand Control Conference (ANZCC), Gold Coast, QLD, Australia, 26–27 November 2020; pp. 193–198. [Google Scholar]
- KSpect Software Download. Available online: https://www.kromek.com/product/free-gamma-spectroscopy-software/ (accessed on 19 August 2021).
- Amon, C.; Fuhrmann, F.; Graf, F. Evaluation of the spatial resolution accuracy of the face tracking system for kinect for windows v1 and v2. In Proceedings of the 6th Congress of the Alps Adria Acoustics Association, Graz, Austria, 15–16 October 2014; pp. 16–17. [Google Scholar]
- Lun, R.; Zhao, W. A Survey of Applications and Human Motion Recognition with Microsoft Kinect. Int. J. Pattern Recognit. Artif. Intell. 2015, 29, 1555008. [Google Scholar] [CrossRef] [Green Version]
- Kromek Rad Angel. Available online: https://www.kromek.com/product/radangel-czt-gamma-ray-spectrometer/ (accessed on 19 August 2021).
- Python Software. Available online: https://github.com/bidouilles/kromek-prototype/blob/master/radangel.py (accessed on 19 August 2021).
- Robotics Toolbox for MATLAB. Available online: http://petercorke.com/wordpress/toolboxes/robotics-toolbox (accessed on 19 August 2021).
- Matlabcontroljoint.urp Github Repository. Available online: https://github.com/qian256/ur5_setup/find/master (accessed on 19 August 2021).
- Denevit Hartenberg Parameters for the UR3 Robot. Available online: https://www.universal-robots.com/articles/ur/parameters-for-calculations-of-kinematics-and-dynamics/ (accessed on 19 August 2021).
- Canny, J. A computational approach to edge detection. In IEEE Transactions on Pattern Analysis and Machine Intelligence; IEEE: New York, NY, USA, 1986; pp. 679–698. [Google Scholar]
- MATLAB Guide to Canny Edge Detection. Available online: https://uk.mathworks.com/help/images/ref/edge.html (accessed on 19 August 2021).
- MATLAB Regionprops Function. Available online: https://uk.mathworks.com/help/images/ref/regionprops.html#d122e221325 (accessed on 19 August 2021).
- Bonnechère, B.; Sholukha, V.; Jansen, B.; Omelina, L.; Rooze, M.; Jan, S.V.S. Determination of Repeatability of Kinect Sensor. Telemed. E-Health 2014, 20, 451–453. [Google Scholar] [CrossRef] [PubMed]
Publisher’s Note: MDPI stays neutral with regard to jurisdictional claims in published maps and institutional affiliations. |
© 2021 by the authors. Licensee MDPI, Basel, Switzerland. This article is an open access article distributed under the terms and conditions of the Creative Commons Attribution (CC BY) license (https://creativecommons.org/licenses/by/4.0/).

