Abstract
Today’s research on fenceless human–robot collaboration (HRC) is challenged by a relatively slow development of safety features. Simultaneously, design recommendations for HRC are requested by the industry. To simulate HRC scenarios in advance, virtual reality (VR) technology can be utilized and ensure safety. VR also allows researchers to study the effects of safety-restricted features like close distance during movements and events of robotic malfunctions. In this paper, we present a VR experiment with 40 participants collaborating with a heavy-load robot and compare the results to a similar real-world experiment to study transferability and validity. The participant’s proximity to the robot, interaction level, and occurring system failures were varied. State anxiety, trust, and intention to use were used as dependent variables, and valence and arousal values were assessed over time. Overall, state anxiety was low and trust and intention to use were high. Only simulated failures significantly increased state anxiety, reduced trust, and resulted in reduced valence and increased arousal. In comparison with the real-world experiment, non-significant differences in all dependent variables and similar progression of valence and arousal were found during scenarios without system failures. Therefore, the suitability of applying VR in HRC research to study safety-restricted features can be supported; however, further research should examine transferability for high-intensity emotional experiences.
1. Introduction
Fenceless human–robot collaboration (HRC) is expected to enable the flexibility of increasingly complex production sites [1]. Aiming at a batch-size 1 production [2], referring to the production of single pieces, the combination of robots’ repetitive accuracy, and workers’ ability to solve ill-defined problems [3] HRC becomes an economic interest. Thereby, collaboration defines a simultaneously cooperative work task of the human and the robot within a shared collaborative space where safe physical contact is possible and often desired between the human and the robot [3]. Expected benefits for the production industry are majorly dependent on humans’ cognitive and emotional reactions to the collaboration with robots. It is thus necessary for research to develop and evaluate suitable workplace design guidelines for fenceless HRC. These can decrease the risk of robot rejections and sabotage due to a lack of acceptance in the workplace [4]. As a result, the implementation of new technological developments will benefit in the long term. Due to technical insufficiencies and current safety regulations, fenceless HRC with shared and concurrent workspace of humans and robots is still rare on the shop floor [5] and little is known about workers’ reactions to HRC in practice. Additionally, only a few applications designated as ‘HRC’ meet the criteria of a real collaboration between humans and robots [6]. An empirical study identified only 50 industrial applications of HRC with lightweight robots across Germany in 2016 [7]. Although this number has risen in the past years, applications of HRC with heavy-load robots remain in niche and pilot studies [8]. Robots come with a serious risk of physical harm as misconduct or technical problems can cause unintended physical contact with workers. Thus, the technical guideline ISO/TS 15066 [3] specifies strict safety regulations for HRC when deployed in a shared workspace. These contain strongly limited speeds of robots and limitations of moving loads within collaboration zones, increasing safety and likely lowering risk perceptions of workers. Concurrently, decreased speeds increase cycle times and can impede the efficient usage of HRC. The typical and regularly applied speed of fenceless robots outside collaboration zones is about 1500 mm/s [9]. Sensor-based distance-related adaptive speed control is still rare. To achieve robot forces permissible with biomechanical thresholds of human body parts, constant speeds of 250 mm/s are typically used within collaboration zones, which simultaneously marks the maximum speed limit in manual mode [10]. As a result, a huge gap between possible and permissible speeds arises. Therefore, close-distance interactions with robots moving at regular speeds that still comply with the limits of biomechanical threshold are conceivable within shared workspaces in the next years. Still, it is unknown if workers’ risk perception is adequately lowered by sensor-based adaptive speed control as trust in sensor capability is required. Even though a specific distance of a moving robot is objectively safe, subjective cognitive and emotional reactions may differ. In human–human interactions, the first impression of an interaction partner has major importance and influence on further interactions. The same is true for human–robot interactions [11], especially in mandatory workplace situations where negative personal experiences should be prevented. The question arises of how these reactions can be studied in advance to ensure the availability of adequate design recommendations prior to robust technology development in the real world. In this paper, virtual reality (VR) technology is presented to be a promising and, especially, safe, and low-cost methodology for studying human factors during safety-restricted interactions, and a first step toward proving the transferability and validity of VR research results in the field of HRC is undertaken.
1.1. Human Factors Research in HRC
Despite safety concepts, workers could have concerns [12] that affect the safety and efficiency of fenceless HRC with industrial robots. Human factors research creates the groundwork to study the reactions of humans with the aim of safe and efficient HRC [13] and for an efficient combination of the abilities of humans and robots. Important concepts of human factors in HRC research include emotional experience and stress [12], trust in automation [14], and acceptance [15]. A significant effect of trust on acceptance was found in the context of industrial HRC [16]. Also, [17] summarizes that emotional reactions seem to be a critical contributor to trust although the relationship of emotional experience and trust in automation is rarely studied [18]. Therefore, several outcome criteria should be included in HRC studies. Apart from other emotions like frustration [17], anxiety as one specific negative emotion is important in the context of HRC. Various experiments studied anxiety resulting from direct cooperation with a robot in the shared workplace [12,19]. State anxiety is defined by negative, conscious feelings of tension and dread and measurable physiological arousal [20]. Behavioral reactions of anxiety include bending forward and running for cover to escape from danger [21]. These sudden movements can lead to unintended physical contact with robots. [22] found that being injured by a robot is one of the key anxieties in industrial workplaces. In an extensive review, [23] concluded that there is no ‘gold standard’ regarding the measurement of emotions as none of the available measurements cover the subjective experience as well as physiological and behavioral responses. Still, it is summarized that measures of emotions should use a dimensional approach, covering valence and arousal as core dimensions of emotions and that the measurement concurrent to any relevant events is important for valid measurement. Still, studies measuring emotional states in the progression of time and temporally associated with events are rare in HRC.
Automation psychology studies the concept of trust in automation which in the subarea of human–robot interaction is specified as trust in robots or human–robot trust [24]. It is defined as “the reliance by an agent that actions prejudicial to their well-being will not be undertaken by influential others” [24] (p. 24). In HRC, the robot stands for the influential other. To ensure an efficient and safe collaboration, an appropriate level of trust is needed that neither contains under- nor over-trust [14]. Under-trust is related to a rejection of automation and over-trust to misuse and overreliance on the system [25] resulting in reduced situation awareness [14]. Over-trust, defined as a trust level exceeding the system’s capabilities [25], may again result in physical harm to workers during events of system malfunction or automation failure. Studies have shown that people expect good system performance prior to interaction, even without any detailed information on the automated system (‘positivity bias’; [26]). Additionally, failures of automated systems affect trust [27] and the first-failure effect [28] studied in early automated systems research has shown a reduction of trust level following system failures [28,29]. Effects of failures were also observed in human–robot interaction. According to literature, even an effect of the temporal position of failures was observed. An early automation failure in interactions caused a greater reduction of real-time trust than a late event in a study of [30] but the contrary effect was found for HRC with an industrial robot in [31]. So, the effect of the temporal position of failures in HRC remains unclear. In most literature, failures are simulated as software-conditioned automation breakdowns. People miss the occurrence of an automation breakdown due to overreliance and reduced situation awareness [14], resulting in performance loss. Combining fenceless interactions with a reduced situation awareness while working with automated systems, robot malfunction can increase the risk of unintended physical contact between robot and worker or at least result in negative emotional reactions. Studying the effects of automation failure in research that concurrently ensures the safety of study participants is hard to achieve in the context of heavy-load robots.
Human factors research further aims to identify predictors of technology usage. The underlying theoretical concept is technology acceptance and several theoretical models, for example, the unified theory of acceptance and use of technology (UTAUT) [32], arose. Actual system usage as a core outcome of acceptance models can only be applied in longitudinal studies. Additionally, workers’ usage of robots at workplaces is mandatory rather than personally decided. Therefore, the direct preceding stage of actual usage, called intention to use, is a more reliable outcome criterion to measure technology acceptance in HRC research.
Previous research on human factors found that specific characteristics of robots’ visual appearance and behavior are related to humans’ cognitive and emotional experiences [14]. Some features of robot movement like speed [12,30] and predictability of movements [30,33] have been studied extensively in real-world studies. A comprehensive model identified predictors of intention to use in the field of robots but focused on internal factors of workers rather than characteristics of the robotic systems [34]. In subjective reports asking representatives of manufacturing companies, the reliability of the robot, trust during operation, predictability of movements, and appropriate speed were significant success factors for the acceptance of collaborative robots in the production industry [5].
Still, these studies are limited to studying the effects of technically feasible and permissible features or, due to the slow technological development of safety features, rely on survey studies. Given the fact that technological standards are rapidly changing and developing, the loosening of safety requirements for HRC in the near future can be assumed. To ensure the availability of design recommendations at that time, research should apply safe simulation studies including real-world restricted features of HRC. This raises our research question (RQ) 1:
RQ1: How do HRC features affect the emotional experience, trust, and intention to use in VR-simulated interactions with a heavy-load robot?
Focusing on real-world restricted features, this paper studies the effects of different interaction levels, close interactions with the robot, and system failures.
Hypothesis 1.
It is hypothesized that negative emotional experiences will increase and trust and intention to use will decrease with increasing interaction levels.
For fenceless collaboration, a classification of four interaction levels in HRC with heavy-load robots was introduced by [35], structured by the specification of the shared task. The overview is given in Table 1. Current industrial applications and real-world research studies (e.g., [19]) are limited to HRC-level 2 interactions, where the robot is not moving during cooperation and simply acts as a third arm while assembling. Due to insufficient safety engineering, systematic variation of the interaction level is currently impeded in the real world.

Table 1.
Classification of interaction levels in HRC.
From the classification, it can be concluded that the higher the interaction level, the higher the task dependency between humans and robots. Thus, subjective risk perception is expected to increase in HRC even if safety standards increase with interaction level. Additionally, the physical distance to the robot decreases as a result of direct interaction, so humans have explicit control of the robot.
Hypothesis 2.
Considering that a collision with these robots would result in serious physical harm, it can be hypothesized that anxiety is increased while trust and intention to use are reduced in close interactions with heavy-load robots.
In general, studies with heavy-load robots fall short and the effects of proximity on trust and intention to use are unknown. [12] used a small industrial robot moving at regular speed prior to collaboration and found that anxiety increased significantly for a distance of one meter to the approaching robot in comparison to 1.5 or 2 m. As speed and proximity to the robot seem to be significantly related to anxiety [12], remaining in the collaboration zone during regular speeds of the robot should result in different emotional experiences. As adaptive speed control of heavy-load robots is rarely implemented, robots usually move at a fixed low speed as long as the worker is inside the collaboration zone or even more often, workers completely leave the collaboration zone. Therefore, reactions to regular speed at close distances are unknown.
Hypothesis 3.
It can be hypothesized that real-world restricted safety-critical failures go along with higher negative emotional experience, lower trust, and lower intention to use.
Hypothesis 4.
Effects mentioned in hypothesis 3 are stronger the more a system failure could harm a worker.
As mentioned, the simulation of safe real-world failures or malfunctions of robotic systems is hard to achieve. Therefore, failures resulting from motion planning mistakes or a sensor breakdown resulting in unintended physical contact during interactions with robots are unknown, likely because of ethical concerns as the safety of participants cannot be assured. So, simulations of system failures in research currently often remain on the breakdown of automation [29,36]. A first study with a humanoid robot compared the effects of a technical error and an information processing error [37]. Both workers’ cognitive and emotional reactions are dependent on personal experiences. Therefore, personal experience must be evoked to study the effects of loosened safety restrictions on workers’ reactions in HRC. To overcome research gaps by applying VR technology, the suitability and transferability of VR results for real-world applications have to be examined.
1.2. Virtual Reality in HRC Research
Virtual reality (VR) simulations allow to neglect real-world physical constraints and enable think ahead of future technical developments. VR is cost-efficient and ensures safety for human participants, all contributing to an appropriate ethical responsibility in research. Nevertheless, applying VR technology in research in HRC to derive design recommendations, especially to simulate scenarios beyond real-world restrictions, is only appropriate if the transferability of results to the real world can be assured. Otherwise, this would obstruct ethical responsibility including that research is only acceptable if valid and appropriate methods are applied to tare subject’s effort of participation. This raises our research question 2:
RQ2: Are experimental results from VR simulations transferable to real-world interactions and therefore, are VR studies an appropriate methodology to estimate the effects of features beyond real-world safety restrictions in HRC?
VR is being used increasingly to study human–machine interactions and social interactions since it has been demonstrated that neural mechanisms in humans are comparable to those in the real world when immersed in a virtual environment [38]. In this context, [39] introduced the term ‘virtual presence’ and defined the concept as the “sense of being physically present with visual, auditory, or force displays generated by a computer” (p. 120). In this regard, [40] states that presence is essentially a cognitive or perceptual parameter. Thus, presence can be quantified only by the individual who encounters the virtual world [41] and participants who are highly present should experience the virtual environment as the engaging reality rather than the world surrounding them and view the environment provided by the displays as places visited rather than images seen. Therefore, behaviors in the virtual environment should be consistent with behaviors that would occur in reality under similar circumstances. As a result, presence has been used as a control variable to interpret results in most of the studies including VR scenarios ever since.
Although participants often report that the experience felt real, it is not known whether identical reactions would be observed in the same scenario performed in the real world [42]. It should be considered that VR simulation is always limited as a reduction of information to a presentable level takes place. This creates different levels of immersion, an objective specification of technology that refers to the sensory information provided, for the viewer which conveys presence [41]. High intensity of presence does ensure that participants’ interactions are as they would be in the real world [41]. However, there are exceptions. For example, it was shown that participants with previous VR experience sometimes did not react as strongly as inexperienced participants in risky situations in HRC [43]. This is further amplified by a lack of physical feedback, which reduces reactions in the context of HRC. Also, some participants without previous experience with VR technology did not show an appropriate reaction because they were distracted by the virtual environment and did not notice dangerous situations [43]. In addition, it should be noted that although VR enables rapid development and testing of unique (HRC) scenarios while maintaining the safety of all participants and eliminating physical risk, it also renders interactions artificial. Despite this reduction and artificialization, VR scenes have been shown to increase both experimental control and experienced realism, which increases participants’ engagement and thus increases experimental validity [44,45]. In the context of emotional reactions in VR, several studies have shown a positive correlation between presence and emotions, especially for negative emotions like anxiety, although the causal direction of that relationship remains unresolved [46].
Assuming these fundamentals, immersive VR simulations have been used in several studies to investigate HRC (e.g., [45,47,48]. For example, [47] used VR to evaluate the end user’s perception of a robot and its movement. Measurements like the accuracy of an entry, users’ experience, and perception of input methods or perceived workload show no significant differences in VR and real-world studies. This implies that users’ perception of difficulty is not influenced by the virtual environment [49,50]. Research of [51] in architecture also shows no difference in task performance and experience between a real-world scenario and a VR scene. Those confirmed the transferability of VR studies to the real world and findings are described as one of the first to use VR scenarios as a convenient and methodologically valid medium for testing various human behaviors related to building design tasks [51]. Further research in risk-taking assessment or crowd behavior during high stress also confirmed the transferability of the results of a VR and the real world. Perceived presence was cited as a quality factor of transferability (e.g., [52,53]). Still, studies validating an equivalent evoking of emotional experience like anxiety by comparing VR and real-world experiments are unknown.
Hypothesis 5.
Based on before mentioned study results, it can be hypothesized that the results of VR and real-world experiments are comparable and transferable.
To verify the transferability of virtual scenarios, it is often recommended to compare the virtual to a real-world scenario. This leads to results that are specific to the particular application and thus provide more detailed information to practitioners (e.g., [48,54]. Considering the use of VR in HRC, as well as the studies in other fields, it can likely be assumed that VR scenarios have the potential to be representative of real-world scenarios in which HRC takes place [43].
To answer research question 1 (simulation beyond restrictions), the subsequently described VR experiment was conducted in study 1, containing the simulation of HRC with a heavy-load robot. The methodology and results are reported in the following Section 3 and Section 4. The VR experiment was designed as a scale-to-scale replication of the HRC testing field from a recently published real-world experiment [31]. Therefore, to answer research question 2 (transferability), the results of the VR experiment are compared to the results of equivalent scenarios of the real-world experiment in study 2. Hence, the comparison of results examines the validity of data obtained from VR scenarios which is the precondition to interpreting results of scenarios that cannot be studied in the real world. The methodology and results of study 2 are reported in Section 5 and Section 6. The paper closes with an overall discussion of the results and implications for further research and practice. Due to the scale-to-scale replication of the test field in both studies, the following section describes it covering both experiments.
2. Specification of a VR Environment as Scale-to-Scale Reproduction of a Real-World Test Field
A VR scene was created in the 3D engine Unity. To display the VR scene, HTC’s head-mounted display VIVE PRO EYE was used with the corresponding handheld controllers in combination with a powerful PC equipped with an Intel i5-12500 and a GeForce RTX 2080. The simulation consisted of a human–robot collaboration scenario that reflects a real assembly task in the automotive industry ([31], see Figure 1).
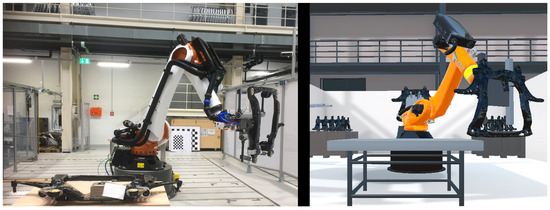
Figure 1.
Comparison of real-world setting (left) and VR scenario (right).
The demo task contained the assembling of eight small parts on a front axle carrier. An industrial robot (Manufacturer: KUKA; Model: Quantec prime KR 180, Augsburg, Germany), classified as a heavy-load robot, was used in the test field which included a flexible layout [35] to perform two different interaction levels. HRC-level 1 contained an assembling table in the robot cell which also acted as a physical barrier and distance so that participants were not directly assembling at the robot. The robot moved to a waiting position after placing a front axle carrier on the table. In contrast, HRC-level 3 was realized by direct assembling at the front axle carrier located at the robot flange (see Figure 2).
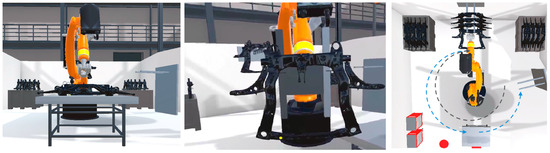
Figure 2.
Visualization of HRC-level 1 (left) and HRC-level 3 (middle) during assembling position and top view (right). The path of component delivery (phase 1) and path to storage position are shown by blue arrows and returning to component admission (phase 3) is shown by grey arrows.
The real-world application enabled the adjustment of assembling height for better ergonomics via gesture control and without applied forces. Thus, the robot could be controlled by humans during collaboration and move slowly at a close distance from the human. Due to safety reasons, the collaboration zone inside the robot cell had to be left before the robot moved at a regular speed of 1000 mm/s in the real-world test field. Each assembling cycle contained three robot phases: component admission and delivery (phase 1), collaboration with assembling time (phase 2), and component removal (phase 3). In the area, the robot: (i) picked up the front axle carrier in the back from a rack; (ii) approached towards assembling position in the front; (iii) held in the assembling position in the front for collaboration; iv) moved to component removal position at the right side and returned to home position in the back by passing assembling position again (270° horizontal rotation).
For scale-to-scale replication in VR, the real-world test environment was modeled in detail, together with the surrounding machines and other factory elements. To integrate the industrial KUKA robot into the virtual scene, CAD data was used to represent the robot in its entirety, which also allows for true-scale animations. To make the virtual scene look as realistic as possible, different features of Unity were used for visual optimization. High-resolution material textures and realistic shaders were applied to ensure a detailed object representation. Furthermore, realistic real-time lighting of the virtual scene with dynamic point and directional light sources and soft shadows was performed. In general, all quality settings were set to maximum, and functions like anti-aliasing were used to increase the quality of the visual representation (see Figure 1). A typical soundscape of a large factory floor and the robot’s engine sounds were also added to the scene to make the virtual recreation even more realistic. To turn the static 3D model of the KUKA robot into an animated one, keyframe animations were created to represent the robot’s real movements. The keyframe animations were first used to define the start and end points of motion sequences. From the sequential order of these keyframes, Unity automatically computes intermediate frames that form the illusion of smooth motion. Using Unity’s Animator Controller and a script, these created animation clips were provided and played in a controlled manner, making the robot appear to interact with the participant on its own. All modeling and shaping actions were intended to ensure comparability to the real-world test field and maximum presence which is especially important for equivalent emotional attachment and experience.
3. Methodology Study 1—Simulation beyond Restrictions
3.1. Participants
Forty subjects (24 female, 16 male) participated in the experiment. The participants’ mean age was M = 28.0 years (SD = 6.48) and overall, the sample can be described as medium technique affine (see Section 3.2, measured with [55]; M = 4.11, SD = 1.04). Only three participants had interacted with an industrial robot before and 20% of participants had ever worked in or were working in production at the time of the study. The participants received financial compensation for the effort.
3.2. Measurements
Demographics: Demographic information like sex, age, experience with industrial robots and production work, and Affinity for Technology Interaction (ATI; [55]; scale range 1 to 7) were captured in the pre-survey.
VR-specific measures (post-experiment): Due to possible confounding of physiological and subjective reactions to the VR environment itself and actual reactions to the content of scenarios, a German translation of the Virtual Reality Sickness Questionnaire (VRSQ; [56]; scale range 1 to 4) was used. To validate experienced realness in VR, presence was measured via a German version of the Igroup Presence Questionnaire (IPQ; [57]; scale range 1 to 5).
Time progression measures of emotional experience: Specific emotions are intensive, object-directed, and fleeting [58]. As each collaboration with a robot contains alternating phases of activities performed separately or cooperatively and robots are alternately approaching and departing in relation to humans, various emotional states can occur. In accordance with [23], a dimensional self-report measure of emotions over time was used as these were argued to be sensitive for changes in valence and arousal while physiological measurements like heart rate or skin conductance were shown to be sensitive, especially for arousal. For example, the Circumplex–Model [59] describes anxiety as an emotion characterized by strong negative valence and high arousal. Therefore, it is possible to show a tendency towards specific emotions based on valence and arousal values. The Feeling Scale (FS; [60]; scale range −5 to 5) and Felt Arousal Scale (FAS; [61]; scale range 1 to 12) were used to quantify self-reported emotional experience. Combined single-item scales were also applied in other studies as a continuous measurement of affect over time [62]. In a pretest, different time intervals (5, 10, 15, and 30 s) were tested and it was found that a verbal report of valence and arousal every 10 s was possible for participants without distraction from the main task. As detecting quickly fleeting emotional reactions was the target, valence, and arousal were assessed every 10 s. Also due to the pretest, the original scale of FAS was doubled to 12 points due to limited variance in values.
Outcome measures (post-scenario): Dependent variables were collected after each interaction with the robot. Trust in automation was measured via a German translation of the Jian-Scale [63] by [64] (scale range 1 to 7). The subscale measuring state anxiety in State–Trait Anxiety Inventory (STAI-S; [65]; scale range 1 to 8) was used. As suggested, the STAI-S raw score was transformed to a scale from 0 to 100 to allow an interpretation as a percentage of agreement [66]. Additionally, a German translation of the subscale ‘Intention to Use’ [16] was applied (scale range 1 to 5) to measure overall willingness to interact with the robot in the future (see UTAUT Model; [16]) as the preconditional stage of actual usage and an indicator for technology acceptance.
3.3. Experimental Design
A 2 × 2 × 2 × 2 mixed design was conducted. It included variations in interaction level, participants’ proximity to the robot, temporal position of failure, and type of failure. Within-factor interaction level was used for block randomization. VR technology allows neglecting technological insufficiencies. Still, a simulation of HRC-level 4, containing the physical forces of workers on the robot or assembling component, is impeded in VR. The simulation of an immersive perception of weight and forces in the research field of haptics is presently limited to single solutions and it is even argued that full-body perception of haptic feedback cannot be achieved by external devices [67]. For this reason, a comparison of the effects of HRC levels 1 and 3 as the most different and feasible levels was applied. Participants performed one block with assembling on a component placed on the table (HRC-level 1—further abbreviated as ‘HRC1’) and one block with direct assembling at the robot (HRC-level 3—further abbreviated as ‘HRC3’). Before each block, a baseline (‘BL’) without robot movement in the assembling position was conducted. Within-factor proximity was equally operationalized in both interaction levels and not randomized within each experimental block. Similar to the study of [12], participants first kept a distance of 2 m to the moving component at the robot flange during component delivery in robot phase 1 and removal in robot phase 3 (‘with distance’—further abbreviated as ‘WD’). Afterward, they remained at the assembling position, resulting in a distance of one meter to the moving component at the robot flange at a speed of 1000 mm/s (‘close’). The temporal position of system failure (after block 1 vs. block 2) was conducted as a between-subject factor. The type of system failure determined the second between-subject factor. One part of the participants experienced the sound of a defective compressed air cylinder to simulate mechanical malfunction. The failure event was triggered by assembling the first small part of the component while the robot did not move (‘sound’; low risk). The other part experienced a robot path causing a virtual collision with the robot during component delivery (‘collision’, high risk) if participants did not intentionally get out of the way of the robot. Table 2 illustrates the experimental design for exemplary scenario orders. Each participant completed seven interactions.
Table 2.
Experimental Variations and Design—Example Orders (BL = baseline, WD = with distance).
3.4. Experimental Procedure
In advance, participants were informed about the procedure of the study. At the beginning of the experiment, participants were welcomed, a declaration of consent was signed, and a pre-survey was completed. Subsequently, participants watched two videos for the cover story (enlargement of the existing workplace through HRC). Video 1 showed the real work environment with a handling device before the enlargement by HRC. Video 2 was taken from a pretest showing an exemplary robot movement to lower the possible excitement of participants due to personal anticipation of robot actions. Participants learned the combined FS and FAS items by reading instructions with examples. Afterward, they needed to complete a ten-item check for understanding.
The head-mounted device (HMD) was given to the participants, and they were able to get used to the VR environment for a while. Afterward, instructions including the assembling task and gesture control via upward and downward movements (only in HRC-level 3) of a VR controller were given. Two controllers were used, the controller in the dominant hand enabled component assembling as well as gesture control and the second controller contained a storage box with small parts for component assembling. To help participants remember the FS and FAS scales, the combined emotion scale was virtually tagged to the assembling controller. Participants verbally answered the FS and FAS scale following an acoustic beep every 10 s. Subject to any further instructions by the experimenter, participants were told that they were only allowed to leave the start position (marked by a red circle) and consequently enter the robot zone when the robot stopped its movement. Participants completed seven scenarios, each containing three assembling cycles (except for scenario ‘failure’ ending after the failure occurred in assembling cycle 1) and paused by post-scenario questionnaire. At the end of the experiment, participants completed a post-experiment questionnaire (see Section 3.2).
3.5. Data Analysis
A Statistic Software R (R version 4.0.5; [68]) was used for data analysis. In the case of non-symmetric distribution of data, median values are reported. Authors’ suggestions in reference papers for the calculation of scores for scales or subscales (means of item values) were applied. If the distribution of scores was skewed, median values of scores are used to report results across participants. Consequently, nonparametric significance testing was applied. If not specified otherwise, the independent or paired Wilcoxon Signed-Rank Test was used, according to experimental design. As test statistics V from paired Wilcoxon is not comparable between different tests, Z-scores calculated from p-values are reported and effect size r is used according to [69]. Package ‘ggplot2′ [70] was used to visualize data over time. To smooth data curves, a generalized additive model (GAM; [71]) was used. According to the relatively low number of data points, the adaption of the GAM model in [71] was applied and the function parameter ‘formula = y ~ s(x, bs = “cs”, fx = T, k = 10)’ was used within the function geom_smooth() by setting k value to 10 for all graphs aiming at visual comparability.
4. Results—Study 1—Simulation beyond Restrictions
4.1. Participants’ Perception of the VR Scene
Scales to examine VR sickness and presence were included to ensure that emotional experience was related to the content of the VR scenarios in contrast to relatedness to participants’ discomfort resulting from the VR environment. The mean of all nine items of the VRSQ was used as a score (positively skewed distribution) to measure VR sickness. On a scale from 1 to 4, results across participants showed Mdn = 1.44 (MAD = 0.22, Min = 1.00, Max = 2.44). Fatigue and strained eyes were the most likely symptoms, showing low median values of Mdn = 2.0 on a scale from 1 to 4. Overall, VR sickness was at a low level.
The Igroup Presence Questionnaire was used to measure the presence within the virtual environment with a scale range of 1 to 5. The overall item ‘In the computer-generated world I had a sense of “being there”’ showed an M = 4.08 (SD = 0.86) which indicates an overall high presence across participants. Across all 14 items of the IPQ (inverted items recorded), results showed M = 3.31 (SD = 0.33). Subscale values are reported in Table 3. The authors of the IPQ provide reference data for the comparison of research data (IPQ Database, http://www.igroup.org/pq/ipq/data.php) which has been filtered for stereo video and audio data as well as the perspective from the first person. For the 38 revealing reference cases, the overall item shows M = 3.21, and across all 14 items M = 2.92. In a comparison of both data, a medium to high presence for the presented experiment can be concluded which is comparable to previous studies using the IPQ.
Table 3.
Descriptive results of the IPQ (subscales and overall, scale 1 to 7).
4.2. Simulation beyond Restrictions: Effects of Experimental Variations
To answer research question 1, results for state anxiety (STAI-S), trust (Jian scale [63]), and intention to use (from the UTAUT model) are reported. Figure 3 visualizes effects and Table 4 shows descriptive statistics on the dependent variables state anxiety, trust, and intention to use across scenarios.
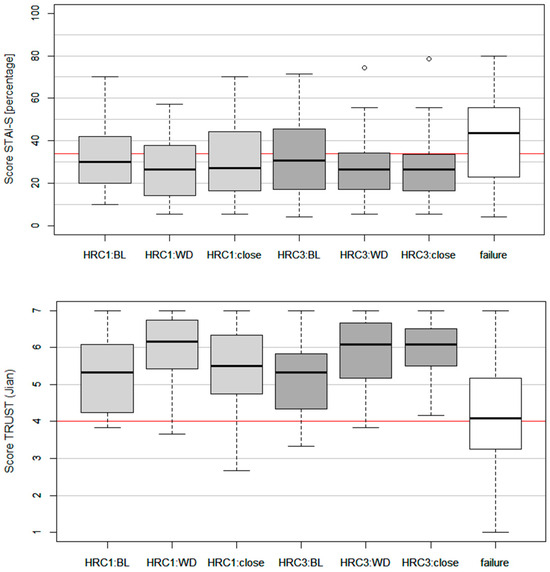
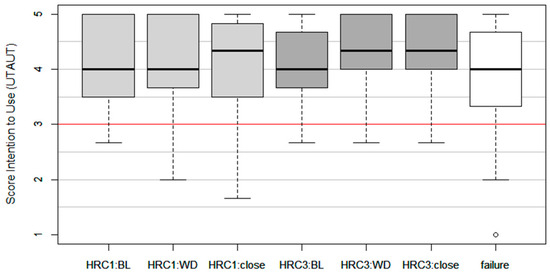
Figure 3.
Results of dependent variables across scenarios (BL = baseline, WD = with distance). The red line for state anxiety shows the reference value from [19] as well as the scale mean for trust and Intention to Use. The lower and upper boundary of the y-axes represents the scale range.
Table 4.
Descriptive Statistics for Dependent Variables Across Scenarios.
The state anxiety was low across all conditions with a mean value of around 30 percent but showed a significant increase in failure scenario (Z > −2.17, p < 0.030, r > 0.34) in comparison to all other scenarios. Trust was medium to high across scenarios without simulated failure. Failure scenarios resulted in a visible dropdown of trust values and significant differences in comparison to all other scenarios (Z > −3.38, p < 0.001, r > 0.53) Intention to Use was also high across scenarios. Failure scenario resulted in a significant decrease only in comparison to ‘HRC3: WD’ (Z = −3.31, p < 0.001, r = 0.52) and ‘HRC3: close’ (Z = −3.72, p < 0.001, r = 0.59).
4.2.1. Effects of Interaction Level and Proximity to the Robot
Close interactions resulted in significantly increased state anxiety (Z = −2.00, p = 0.045, r = 0.32), significantly reduced trust (Z = −2.85, p = 0.004, r = 0.45) but a non-significant difference for intention to use (Z = −1.35, p = 0.176, r = 0.21) in comparison to interactions with distance in HRC-level 1. Likewise, for HRC-level 3, no significant effects of proximity occurred for State Anxiety, Trust, and Intention to Use. Due to a lack of nonparametric ANOVA with a two-factorial repeated-measure design, a parametric ANOVA was used to utilize the likely interaction effect of both independent variables. Besides all the non-significant main effects, non-significant interaction effects of proximity and interaction level were found for state anxiety (F = 0.506, p = 0.478, ηP2 < 0.01) and trust (F = 0.597, p = 0.441, ηP2 < 0.01). For Intention to Use, ANVOA showed a significant main effect for interaction level (F = 9.05, p = 0.003, ηP2 = 0.06), a non-significant main effect for proximity (F = 0.09, p = 0.770, ηP2 < 0.01) and a non-significant interaction effect (F = 0.07, p = 0.787, ηP2 < 0.01). Therefore, Intention to Use was higher for HRC-level 3 compared to HRC-level 1.
4.2.2. Effects of Type and Temporal Position of Failure
The type and temporal position of system failure were used as between-subject factors. The two subsamples of participants with conditions ‘sound’ (NS = 20) and ‘collision’ (NC = 20) did not significantly vary regarding age or affinity to technology. Due to the violation of the normal distribution assumption, non-parametric tests were applied. Comparison of independent groups revealed a non-significant difference of the type of system failure neither for state anxiety (MdnS = 44.29, MdnC = 38.57, W = 186.5, p = 0.725, r = 0.08) nor trust (MdnS = 4.17, MdnC = 4.00, W = 159.5, p = 0.279, r = 0.24) or Intention to Use (MdnS = 4.00, MdnC = 4.00, W = 189, p = 0.774, r = 0.06). The position of system failure was used as a between-subject factor. Comparison of independent groups with early failure (after block 1, N1 = 20) and late failure (after block 2, N2 = 20) revealed a significant difference for state anxiety (Mdn1 = 53.57, Mdn2 = 34.29, W = 273, p = 0.050, r = 0.44) but non-significant difference for trust (Mdn1 = 3.92, Mdn2 = 4.33, W = 178.5, p = 0.570, r = 0.13) and Intention to Use (Mdn1 = 4.00, Mdn2 = 4.00, W = 195.5, p = 0.913, r = 0.02).
4.2.3. Effects of Interaction Time on Dependent Measures
To further evaluate the effects of interaction time with the robotic system, valence and arousal values based on the circumplex model were analyzed depending on the scenario. To evaluate the progression of emotional experience, each assembling cycle was divided into three robot phases: Component delivery (phase 1), assembling time (phase 2), and component removal (phase 3).
Figure 4 shows the time progression of valence and arousal values in different selected scenarios. Timelines show actual real-time robot periods (phase 1 and phase 3) and normalized assembling time (phase 2; visualized green in Figure 4) towards the median assembling time across all included participants. Additionally, the valence and arousal values of each participant were normalized as deviation from initial values queried prior to each scenario starting at t0. A decrease in valence and a simultaneous increase in arousal values indicate the occurrence of negative emotional experiences.
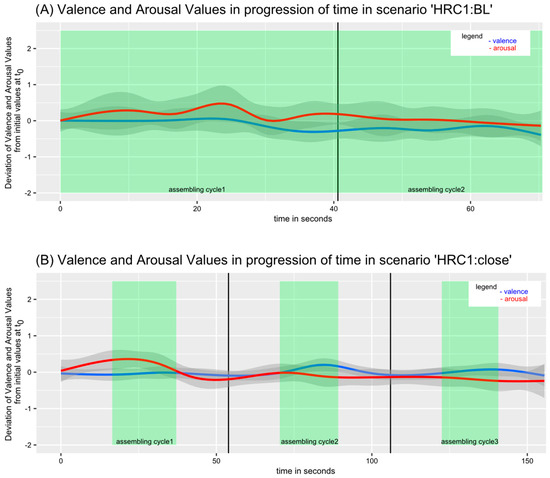
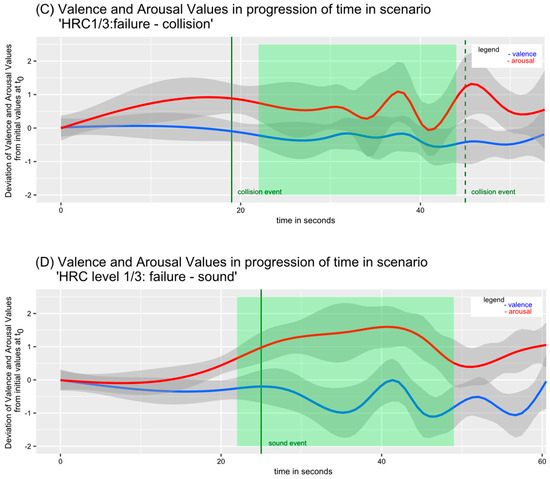
Figure 4.
Time progression of valence and arousal values dependent on scenario. Assembling time (robot phase 2) is highlighted in light green. The standard error (SE) is highlighted in grey. t0 = initial values queried prior to each scenario.
Baseline scenarios (see Figure 4A) without robot movements show an initial, slight increase in arousal, followed by a slow decrease. Overall, valence and arousal values did not change decisively in the progression of time. The same tendency was visible in both scenarios with a greater distance to the robot. In scenarios with close interaction see Figure 4B), assembling cycle 1 shows an increase in arousal during the approaching of the robot relative to the participant in phase component delivery (phase 1) and assembling time (phase 2). This increase is not visible in the following assembling cycles. Failure scenarios contained only one assembling cycle (as explained in Section 3.4). In the failure scenario with failure type ‘collision’ (see Figure 4C), a strong increase in arousal is visible while the robot approaches relative to participants (phase 1) until the collision event. During assembling (phase 2), valence is increasing, and arousal is decreasing again but remains on levels indicating the occurrence of negative emotional experience compared to initial values. Due to the close distance in the collision scenario, a second collision after the assembling phase occurred while the robot picked up the component again. Therefore, another strong increase in arousal values is visible. The same progression is observable in the failure scenario with failure type ‘sound’ (see Figure 4D). Valence and arousal values remain constant until the sound event occurs, triggered by the assembling of the first out of eight small parts on the component. It causes a strong decrease in valence and an increase in arousal, indicating a negative emotional experience. Until the end of a scenario, arousal remains high whereas valence is slowly recovering to initial values.
5. Methodology Study 2—Transferability
5.1. Participants
Participants included the sample from Study 1 (‘VR sample’, see Section 3.1). To examine transferability, results are compared to a recently published study with 25 participants (10 female, 15 male) [31] (‘real-world sample’). Sample statistics of this comparative sample of 25 participants can be found there as well. Independent t-tests showed non-significant differences in age (MVR = 27.8, Mreal = 30.2, t = −1.39, p = 0.169) or affinity for technology usage (ATI; MVR = 4.11, Mreal = 4.17, t = −0.21, p = 0.838). In both samples, only three participants had interacted with an industrial robot before and previous or current work in the production industry at the time of the study was slightly higher in real-world experiments (23% in the VR sample, 32% in the real-world sample).
5.2. Measurements & Experimental Design
Equivalent demographics, time progression measures of emotional experience, and outcome measures were applied in the VR and real-world experiments (see Section 3.2). Scenarios replicated scale-to-scale in the VR experiment (Study 1) and real-world experiment [31] were used to examine transferability. For testing hypothesis 5, Scenario ‘HRC1: WD’ was the most comparable condition in the VR and real-world experiment. In addition, the means of baseline conditions were comparable. For testing hypothesis 6, scenario ‘HRC1/3: failure–sound’ was used to show the non-equivalence of the VR and real-world results.
5.3. Data Analysis
Equivalent statistical data analysis compared to study 1 (see Section 3.5) was applied. Additionally, function ttestBF() from the R package ‘BayesFactor’ [72] was used to compare independent groups. According to the authors, a parameter value of 0.707 for ‘rscale’ was defined as ‘medium’ [72]. With the aim of equivalence testing, in this paper, unless otherwise specified, ‘rscale’ was set to 0.3 to test the null hypothesis against a rather small effect and BF01, showing the evidence of the null hypothesis over the alternative hypothesis, was reported.
6. Results
Table 5 shows the comparison of means of dependent variables for the VR and real-world experiment. The Bayes factor (see Section 5.3) was calculated for comparable conditions to test the equivalence of the VR and real-world results (hypothesis 5). For scenario ‘HRC1: WD’, a value of BF01 = 2.07 ± 0% resulted in state anxiety, showing that the null hypothesis is two times likelier than the alternative. The Bayes factor for trust showed BF01 = 2.09 ± 0%, showing the null hypothesis to be two times likelier. Finally, for intention to use, the Bayes factor was BF01 = 1.73 ± 0%; therefore, the null hypothesis was 1.7 times likelier. The effects are in line with hypothesis 5 and are visualized in Figure 5.
Table 5.
Mean Comparison for Dependent Variables Across Scenarios in Comparison of VR and Real-world Experiment.

Figure 5.
Comparison of VR and real-world experimental results for dependent measures in scenario ‘HRC1: WD’ (with distance).
Furthermore, the Bayes factor was used to compare the results of simulated failures in the VR and real-world experiment to test equivalence in scenario ‘failure–sound’. The Bayes factor returned BF01 = 0.62 ± 0% for state anxiety, BF01 = 0.82 ± 0.01% for trust, and BF01 = 1.47 ± 0% for intention to use. Therefore, the Bayes factor only favored the null hypothesis for intention to use while, contrary to hypothesis 5, favored the alternative hypothesis for state anxiety and trust. Therefore, tests were repeated by testing against a ‘wide’ effect (rscale = 1, [73]). The Bayes factor returned BF01 = 0.81 ± 0.01% for state anxiety and BF01 = 0.82 ± 0.01% for trust. Therefore, the Bayes factor still favored the alternative hypothesis for state anxiety and trust even when testing against a wide effect, showing a non-equivalence which is also shown by the mean scores in scenario ‘failure—sound’ in Table 5.
Figure 6 compares the subjectively reported valence and arousal values based on the circumplex model for the VR and real-world experiments in equivalent scenarios. Measurement of valence and arousal was analogous in both experiments. The assembling time of VR and real-world data was normalized according to the median assembling time of the VR experiment. Additionally, only the first assembling cycle is displayed to ensure detailed visual comparison. In scenario ‘HRC1: BL’, valence and arousal values in both experiments show an equivalent progression (see Figure 6A). The same holds true for the scenario ‘HRC1: WD’ (see Figure 6B) but the VR experiment misses a visible decisive increase in arousal values at the beginning of the scenario during robot phase 1 (component delivery and approaching). In scenario ‘failure—sound’, the sound event (highlighted in dark green) could be triggered individually in the VR experiment by the first assembling action of the participant. In contrast, it was attached to the arrival of the robot at the assembling position in the real-world experiment (dashed line), explaining slightly different temporal occurrences of failures. A stronger increase in arousal and a stronger decrease in valence values is visible in VR in comparison to the real-world scenario. Arousal in the VR experiment continues at a high level until assembling time ends while arousal quickly recovers to a medium level in the real-world experiment.
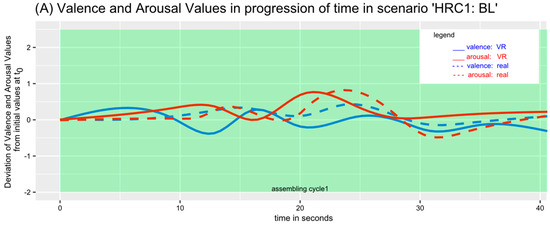
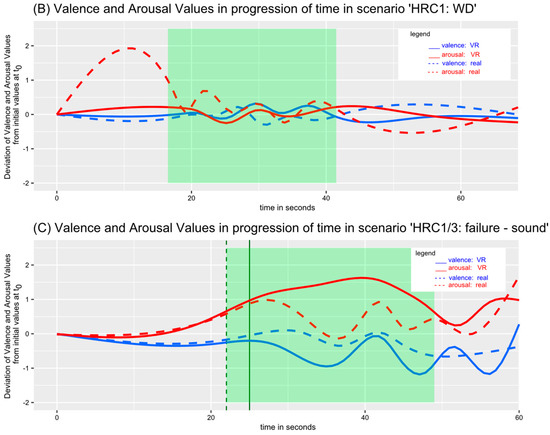
Figure 6.
Time progression of valence and arousal values dependent on scenario in comparison of VR and real-world experiment. Assembling time (robot phase 2) is highlighted in light green. The sound event in ‘HRC1/3: failure—sound’ in the VR experiment (solid line) and real-world experiment (dashed line) is highlighted in dark green. t0 = initial values queried prior to each scenario.
7. Overall Discussion
7.1. Summary of Study Results and Interpretation
To answer research question 1, real-world restricted robot features in HRC with heavy-load robots and their effects on the cognitive and emotional experience of participants were studied in VR. VR sickness for participants remained at a low level and presence was high across participants. Hence, effects on cognitive and emotional experience can be overall attributed to the content of the VR experiment.
Overall, state anxiety was low and trust and intention to use were high in all conditions without system failure. Equally, emotional experience quantified by valence and arousal values did not decisively change over time. Contrary to the hypothesis, HRC-level 1 resulted in significantly higher state anxiety and lower trust, but only in close interactions. Hypothesis 1 cannot be supported by the data. Close distance of participants to the robot moving at regular speed resulted in significantly reduced state anxiety and increased trust but only in HRC-level 1. Therefore, hypothesis 2 can only partly be supported. One possible explanation for inconsistent effects of proximity and interaction level is differing robot motion trajectories. [33] distinguish between the so-called ‘predictable’ and ‘legible’ robot paths. In HRC-level 3, the robot followed a straight path in all robot phases, resulting in a quick inferring of the robot’s target destination and can therefore be assigned to legible paths. In contrast, the robot trajectory of HRC-level 1 was characterized by placing the component on the assembling table and picking up the component after assembling. Whereas the assembling table as the target destination of the robot was obvious, various robot paths are conceivable to approach the table and place the component as well as pick up the component. Therefore, robot paths in HRC-level 1 can be assigned to predictable paths. In literature, legible paths were preferred and associated with higher trust [33]. Due to the legible robot path in HRC-level 3, the proximity to the quickly moving robot could have been of smaller relevance as participants always felt safe. As a result, closer interactions increase anxiety and lower trust in HRC-level 1 but not in HRC-level 3. Inconsistently, intention to use was significantly higher in close interactions compared to interactions with distance in HRC-level 1 which cannot currently be explained by theory.
In line with expectations, failure scenarios caused anxiety to significantly increase and trust to decrease, despite the intention to use was not affected. Therefore, hypothesis 3 can partly be supported by the data. It can still be implied that the VR scene generates sufficient presence to evoke real reactions. This is confirmed by the generally high value of presence measured among participants. The ceiling effect of presence measurement likewise explains the weak correlations with the dependent measures. Additionally, valence and arousal values indicated the occurrence of negative emotional experience for both failures but stronger effects occurring for failure ‘sound’. Arousal values already increased prior to the collision event in scenario failure ‘collision’, indicating that participants were aware of the unusual event already prior to occurrence due to monitoring of the robot, again supporting high presence in the VR scene. Still, the type of system failure did not significantly affect post-scenario measures and hypothesis 4 cannot be supported by the data. Also, the position of system failure did not significantly affect dependent measures.
To study the transferability of the results from VR scenarios and answer research question 2, results showed the superiority of the null hypothesis for state anxiety, trust, and intention to use in a scale-to-scale replication of one specific scenario (‘HRC1: WD’) in the VR and real-world experiment. Additionally, the time progression of valence and arousal values were comparable. Therefore, hypothesis 5 (transferability) can be supported by the data. Still, time progression data in the VR experiment misses an initial increase in arousal while the robot approaches the participants for the first time in the scenario, probably indicating lower risk perception in VR compared to real-world interactions. A comparison of ‘HRC3: WD’ was not possible due to technical problems of gesture control in the real-world experiment (see [31]), explicitly showing an advantage of VR studies in human factors research as VR allows the simulation of perfect technical capabilities of automated systems that are error-prone and not robust in reality. Comparing the results of scenario ‘failure—sound’ in the VR and real-world experiment, the superiority of the null hypothesis was shown for intention to use, but contrary to hypothesis 5, not for state anxiety and trust. State anxiety was higher, and trust was lower in the VR experiment (see Table 5). As it was shown that participants experienced a good level of presence in the VR experiment, differences in means can be explained by a more impressive simulation of failure ‘sound’ in the VR experiment, further supported by a stronger decrease in valence and increase in arousal values in VR over time compared to the real-world scenario (see Figure 6C). Failure event ‘sound’ was individually triggered during the assembling of the first small part of the component in VR. Failure occurrence directly during collaboration can explain stronger reactions as participants were attached to the situation. This further adds an advantage of VR studies as failure simulation was equal for all participants, increasing standardization. Additionally, in contrast to the real-world experiment, participants did not visually perceive the attendance of the experimenter during practical HRC tasks, further enhancing the realness of the situation. All in all, research question 2 can be answered by supporting the transferability of VR results in the field of emotional experience.
7.2. Limitations of Study Results and Transferability for Real-World Industrial Settings
The simplified representation of the real world in the applied VR scene is a limiting factor. For example, environmental factors like noise or airflow of the robot during its movement cannot be simulated. Although the real sound of the robot was integrated into the VR scene, spatial orientation was not possible from records. Still, participants’ presence was medium to high. Another factor is the omission of an assessment of participants’ prior experiences with VR. This introduces a limitation, as varying levels of familiarity with virtual environments may impact the participants’ interaction and performance. Nevertheless, as VR technology in the home sector was still very limited at the time of data collection, we assume that this effect is rather small.
A methodological factor was the design of the demo assembling task. Participants were free in assembling time. Therefore, no external factors like time pressure were present but it is plausible that time pressure through pacing is resulting in different emotional experiences than without [73]. Additionally, scenario-based design with post-scenario measurement is probably impeding a subjective experience of workflow which could lower the emotional attachment to the situation. Each scenario consisted of three assembling cycles that together lasted for around three minutes. As a result of post-scenario measurement and laboratory setting, it could be assumed that participants were aware of experimental variations and expected some sort of manipulation. Although pre-study has shown that participants were able to simultaneously concentrate on a task and report valence and arousal, it is possible that workload raised due to the dual task and participants anchored to previous answers on valence and arousal or they got saturated from answering the scales. Still, both effects are expected to lower the variance in valence and arousal measurements. This is a reasonable explanation for the little alternating course during scenarios without relevant events (see Figure 4A,B), but also implies that small quantitative changes in valence and arousal should represent significant changes in emotional experience like it was found during failure scenarios (see Figure 4C,D). Also, developments in the long term cannot be estimated and both experiments took place in a laboratory setting. [37] summarized that ecological validity, especially in case of error simulation, is low in laboratory settings as participants perceive the setting as artificially controlled and therefore safe.
7.3. Relevance for Further Research
The measurement of valence and arousal values to assess negative emotional experience during interaction with an industrial robot showed great potential in the presented studies. Participants were able to report valence and arousal values every 10 s while performing an HRC task. Consistent with expectation, valence and arousal did not decisively alternate in baseline conditions without robot movement but showed changes after system failures occurred. As emotions are fleeting [58], the possibility of directly associating emotional experience with specific robot motions or behavior arises.
Overall high values of trust in scenarios without failure in both the VR and real-world experiments are in line with previous findings on over-trust. This tendency was found in HRC research [74] and human–automation interaction in general (e.g., [25,75]). This ‘positivity bias’ [26] should be considered when HRC workplaces are designed and implemented. As over-trust is related to reduced situation awareness [14], objective sensor-based monitoring of workers’ behavior due to robot actions can increase safety in HRC. The transferability of results for real-world implementation in actual workplaces has to be researched in case of sufficient technological development. Although this over-trust could also result from the artificial, laboratory setting, it can be assumed that workers equally trust in guaranteed safety due to safety-related authorization processes prior to the technical release of work equipment. Still, longitudinal field studies should be conducted to investigate ecological validity in the case of technological functioning.
Overall, emotional experiences did not show high intensities. A lack of strong negative emotional experience is a promising result for future widespread adoption of HRC in the workplace. Still, showing similar and strong fluctuation of valence and arousal values in VR and real-world scenarios is preferable to further support the transferability of VR results. Therefore, further experiments should include events evoking positive and negative emotional experiences. In the present study, presence was measured via self-report at the end of the experiment after participants experienced a failure scenario that was hypothesized to evoke strong emotional experience and be related to state anxiety. The hypothesis was supported by the data and participants showed an increase in arousal and state anxiety. Current research states that emotional reactions possibly cause presence rather than inversely. In detail, the personal perception of own arousal, for example when experiencing a system failure, results in the perception of a situation as ‘real’ [46]. To further study this causality, applying presence measures multiple times in experiments prior to, during, and following an evoking of strong emotional experience is desirable.
Inconsistent effects for interaction level and proximity should be further studied systematically with heavy-load robots. In the scope of methodology, information about the applied distances from humans to the robot and the respective reference points for distance measuring (e.g., component versus robot flange or robot base) are rarely reported. Reporting reference points needs to be mandatory when studying the effects of proximity to ensure a comparison of results across studies.
8. Conclusions
The paper presents an experimental study on workers’ reactions to real-world safety-restricted features of HRC with heavy-load robots. Therefore, a VR scene was created as a scale-to-scale replication of a real-world test field. Additionally, to post-scenario measurements, emotional experience operationalized by valence and arousal values was studied over time to examine the effects of different phases of interaction and robot behavior. Collaborations without simulated failures resulted in overall low state anxiety, high trust, and intention to use. Also, valence and arousal values did not decisively change. Inconsistent effects were found for the independent variables’ interaction level and proximity to the robot, indicating significantly higher state anxiety and trust in close interactions with the robot moving at high speeds in HRC-level 1 (component assembling on the table after robot placed the component, no direct interaction) but not for HRC-level 3 (direct control of robot via gesture control and assembling directly at the component on robot flange). Still, no significant interaction effect was found for proximity and interaction level and absolute differences in means of dependent measures were low. In contrast, simulated failures revealed a significant increase in state anxiety and a significant decrease in trust. The non-significant effects were found for the type of system failure (sound vs. collision) and temporal position of system failure (early failure vs. late failure) in all dependent measures. Equally, emotional experience showed a decisive decrease in valence and increase in arousal values following a simulated failure, indicating negative emotional experience in accordance with results for state anxiety in post-scenario measurement. The comparison of the results of the VR and a previous real-world experiment revealed non-significant differences in scenarios for all dependent measures. Likewise, valence and arousal values showed comparable progression curves over time. Both results support the transferability of VR scenarios and the suitability of applying VR technology to study workers’ cognitive and emotional reactions in HRC beyond real-world safety restrictions. The ecological validity of laboratory studies in HRC is discussed and methodological recommendations for HRC research and applying VR scenarios are deduced from study results.
Author Contributions
Conceptualization, F.L., D.L. and J.T.; methodology, F.L. and D.L.; software, J.T., validation, F.L. and D.L.; formal analysis, F.L.; investigation, F.L. and D.L.; resources, F.L., D.L., J.T. and A.C.B., data curation, F.L.; writing—original draft preparation, F.L. and J.T.; writing—review and editing, D.L., M.B., A.D. and A.C.B.; visualization, F.L.; supervision, D.L. and A.C.B.; project administration, D.L., A.D., and A.C.B.; funding acquisition, A.D. and A.C.B. All authors have read and agreed to the published version of the manuscript.
Funding
This research was funded by the German Federal Ministry of Education and Research, project 3DIMiR, grant number 03ZZ0459D. The article processing charges for open access publication were funded by the Deutsche Forschungsgemeinschaft (DFG, German Research Foundation) project number 491193532 and the Chemnitz University of Technology.
Data Availability Statement
The data presented in this study are available on request from the corresponding author. The data are not publicly available due to restricted consent provided by subjects on the use of personal data pursuant to the General Data Protection Regulation in the European Union and the European Economic Area (EU General Data Protection Regulation).
Acknowledgments
The authors acknowledge the financial support by the German Federal Ministry of Education and Research. We thank our research partners from FSU Jena for providing CAD data representing the industrial robot and our research partners of the Department of Cognitive Human–Machine-Systems at Fraunhofer IWU Chemnitz for providing detailed information on the real-world robot cell necessary for VR scale-to-scale replication. Furthermore, we thank Sebastian Schweinberger (member of the project consortium) for ethical application and the Ethical Commission of the Faculty of Social and Behavioral Sciences at FSU Jena for ethical approval.
Conflicts of Interest
The authors declare no conflict of interest. The funders had no role in the design of the study; in the collection, analyses, or interpretation of data; in the writing of the manuscript; or in the decision to publish the results.
References
- Oubari, A.; Pischke, D.; Jenny, M.; Meißner, A.; Trübswetter, A. Mensch-Roboter-Kollaboration in der Produktion. Z. Wirtsch. Fabr. 2018, 113, 560–564. [Google Scholar] [CrossRef]
- Lasi, H.; Fettke, P.; Kemper, H.-G.; Feld, T.; Hoffmann, M. Industrie 4.0; Wirtschaftsinformatik; Springer: Wiesbaden, Germany, 2014; Volume 56, pp. 261–264. [Google Scholar]
- ISO/TS 15066:2016; Robots and Robotic Devices–Collaborative Robots. International Organization for Standardization: Geneva, Switzerland, 2016.
- Nelles, J.; Kohns, S.; Spies, J.; Bröhl, C.; Brand, C.; Mertens, A.; Schlick, C.M. Best-Practice Approach for a Solution-Oriented Technology Assessment: Ethical, Legal, and Social Issues in the Context of Human-Robot Collaboration. In Advances in Ergonomic Design of Systems, Products and Processes, Proceedings of the Annual Meeting of GfA, Aachen, Germany, 2–4 March 2016; Springer: Berlin/Heidelberg, Germany, 2017. [Google Scholar]
- Kopp, T.; Baumgartner, M.; Kinkel, S. Success factors for introducing industrial human-robot interaction in practice: An empirically driven framework. Int. J. Adv. Manuf. Technol. 2021, 112, 685–704. [Google Scholar] [CrossRef]
- Messe München GmbH. Heavy-Duty Robots Become Team Players. Available online: https://automatica-munich.com/en/newsroom/news/men-machines/heavy-duty-robots-become-team-players/ (accessed on 29 October 2023).
- Bauer, W.; Bender, M.; Braun, M.; Rally, P.; Scholtz, O. Lightweight Robots in Manual Assembly-Best to Start Simply; Frauenhofer-Institut für Arbeitswirtschaft und Organisation IAO: Stuttgart, Germany, 2016. [Google Scholar]
- Grüling, B. Neue Fertigungsstraßen im Autobau: Mein Kollege, der Roboter. 2014. Available online: https://www.spiegel.de/wissenschaft/technik/roboter-sollen-menschen-an-fertigungsstrassen-arbeit-abnehmen-a-974088.html (accessed on 29 October 2023).
- Matthias, B.; Ding, H.; Miegel, V. Die Zukunft der Mensch-Roboter Kollaboration in der industriellen Montage. In Proceedings of the Internationales Forum Mechanik (IFM), Augsburg, Germany, 30–31 October 2013. [Google Scholar]
- DIN EN ISO 10218-1; Safety Requirements for Robot Systems in an Industrial Environment—Part 1: Robots. German Institute for Standardization: Berlin, Germany, 2020.
- Xu, J.; Howard, A. The impact of first impressions on human-robot trust during problem-solving scenarios. In Proceedings of the 2018 27th IEEE International Symposium on Robot and Human Interactive Communication (RO-MAN), Nanjing, China, 27–31 August 2018; pp. 435–441. [Google Scholar]
- Arai, T.; Kato, R.; Fujita, M. Assessment of operator stress induced by robot collaboration in assembly. CIRP Ann. 2010, 59, 5–8. [Google Scholar] [CrossRef]
- Kirlik, A. An Overview of Human Factors Psychology. In The Oxford Handbook of Organizational Psychology, Volume 2; Oxford University Press: Oxford, UK, 2012. [Google Scholar]
- Hancock, P.A.; Kessler, T.T.; Kaplan, A.D.; Brill, J.C.; Szalma, J.L. Evolving trust in robots: Specification through sequential and comparative meta-analyses. Hum. Factors 2020, 63, 1196–1229. [Google Scholar] [CrossRef] [PubMed]
- Dwivedi, Y.K.; Rana, N.P.; Tamilmani, K.; Raman, R. A meta-analysis based modified unified theory of acceptance and use of technology (meta-UTAUT): A review of emerging literature. Curr. Opin. Psychol. 2020, 36, 13–18. [Google Scholar] [CrossRef] [PubMed]
- Brauer, R.R. Akzeptanz Kooperativer Roboter im Industriellen Kontext; Fakultät für Human-und Sozialwissenschaften der Technischen Universität Chemnitz: Chemnitz, Germany, 2019. [Google Scholar]
- Weidemann, A.; Russwinkel, N. Investigation of frustration. In Proceedings of the Mensch und Computer 2019, Hamburg, Germany, 8–11 September 2019; pp. 819–824. [Google Scholar]
- Stokes, C.K.; Lyons, J.B.; Littlejohn, K.; Natarian, J.; Case, E.; Speranza, N. Accounting for the human in cyberspace: Effects of mood on trust in automation. In Proceedings of the 2010 International Symposium on Collaborative Technologies and Systems, Chicago, IL, USA, 17–21 May 2010; pp. 180–187. [Google Scholar] [CrossRef]
- Brending, S.; Khan, A.M.; Lawo, M.; Müller, M.; Zeising, P. Reducing anxiety while interacting with industrial robots. In Proceedings of the 2016 ACM International Symposium on Wearable Computers, Heidelberg, Germany, 12–16 September 2016; pp. 54–55. [Google Scholar] [CrossRef]
- Endler, N.S.; Kocovski, N.L. State and trait anxiety revisited. J. Anxiety Disord. 2001, 15, 231–245. [Google Scholar] [CrossRef]
- Grezes, J.; Pichon, S.; de Gelder, B. Perceiving fear in dynamic body expressions. Neuroimage 2007, 35, 959–967. [Google Scholar] [CrossRef]
- Lotz, V.; Himmel, S.; Ziefle, M. Youre my mate-acceptance factors for human-robot collaboration in industry. In Proceedings of the International Conference on Competitive Manufacturing, Stellenbosch, South Africa, 30 January 2019–1 February 2019; pp. 405–411. [Google Scholar]
- Mauss, I.B.; Robinson, M.D. Measures of emotion: A review. Cogn. Emot. 2009, 23, 209–237. [Google Scholar] [CrossRef]
- Hancock, P.A.; Billings, D.R.; Schaefer, K.E. Can You Trust Your Robot? Ergon. Des. 2011, 19, 24–29. [Google Scholar] [CrossRef]
- Lee, J.D.; See, K.A. Trust in automation: Designing for appropriate reliance. Hum. Factors 2004, 46, 50–80. [Google Scholar] [CrossRef]
- Dzindolet, M.T.; Peterson, S.A.; Pomranky, R.A.; Pierce, L.G.; Beck, H.P. The role of trust in automation reliance. Int. J. Hum. Comput. Stud. 2003, 58, 697–718. [Google Scholar] [CrossRef]
- Parasuraman, R.; Manzey, D.H. Complacency and bias in human use of automation: An attentional integration. Hum. Factors 2010, 52, 381–410. [Google Scholar] [CrossRef] [PubMed]
- Wickens, C.D.; Hellenberg, J.; Xu, X. Pilot maneuver choice and workload in free flight. Hum. Factors 2002, 44, 171–188. [Google Scholar] [CrossRef] [PubMed]
- Beggiato, M.; Krems, J.F. The evolution of mental model, trust and acceptance of adaptive cruise control in relation to initial information. Transp. Res. Part F Traffic Psychol. Behav. 2013, 18, 47–57. [Google Scholar] [CrossRef]
- Desai, M.; Kaniarasu, P.; Medvedev, M.; Steinfeld, A.; Yanco, H. Impact of robot failures and feedback on real-time trust. In Proceedings of the 2013 8th ACM/IEEE International Conference on Human-Robot Interaction (HRI), Tokyo, Japan, 3–6 March 2013; pp. 251–258. [Google Scholar]
- Legler, F.; Langer, D.; Dittrich, F.; Bullinger, A.C. I don’t care what the robot does! Trust in automation when working with a heavy-load robot. In Proceedings of the Human Factors and Ergonomics Society Europe Chapter 2019 Annual Conference: Understanding Human Behaviour in Complex Systems; de Waard, D., Toffetti, A., Pietrantoni, L., Franke, T., Petiot, J.-F., Dumas, C., Botzer, A., Onnasch, L., Milleville, I., Mars, F., Eds.; Human Factors and Ergonomics Society: Washington, DC, USA, 2019; pp. 239–253. Available online: https://www.hfes-europe.org/largefiles/proceedingshfeseurope2019.pdf (accessed on 17 October 2023).
- Venkatesh, V.; Thong, J.Y.L.; Xu, X. Unified theory of acceptance and use of technology: A synthesis and the road ahead. J. Assoc. Inf. Syst. 2016, 17, 328–376. [Google Scholar] [CrossRef]
- Dragan, A.D.; Bauman, S.; Forlizzi, J.; Srinivasa, S.S. Effects of robot motion on human-robot collaboration. In Proceedings of the 2015 10th ACM/IEEE International Conference on Human-Robot Interaction (HRI), Portland, OR, USA, 2–5 March 2015; pp. 51–58. [Google Scholar] [CrossRef]
- Bröhl, C.; Nelles, J.; Brandl, C.; Mertens, A.; Nitsch, V. Human-robot collaboration acceptance model: Development and comparison for Germany, Japan, China and the USA. Int. J. Soc. Robot. 2019, 11, 709–726. [Google Scholar] [CrossRef]
- Bdiwi, M.; Pfeifer, M.; Sterzing, A. A new strategy for ensuring human safety during various levels of interaction with industrial robots. CIRP Ann. 2017, 66, 453–456. [Google Scholar] [CrossRef]
- de Visser, E.; Parasuraman, R. Adaptive aiding of human-robot teaming: Effects of imperfect automation on performance, trust, and workload. J. Cogn. Eng. Decis. Mak. 2011, 5, 209–231. [Google Scholar] [CrossRef]
- Flook, R.; Shrinah, A.; Wijnen, L.; Eder, K.; Melhuish, C.; Lemaignan, S. On the impact of different types of errors on trust in human-robot interaction: Are laboratory-based HRI experiments trustworthy? Interact. Stud. 2019, 20, 455–486. [Google Scholar] [CrossRef]
- Goldhammer, F.; Scherer, R.; Greiff, S. Advancements in technology-based assessment: Emerging item formats, test designs, and data sources. Front. Psychol. 2020, 10, 3047. [Google Scholar] [CrossRef]
- Sheridan, T.B. Musings on telepresence and virtual presence. Presence Teleoperators Virtual Environ. 1992, 1, 120–126. [Google Scholar] [CrossRef]
- Kalawsky, R.S. The validity of presence as a reliable human performance metric in immersive environments. In Proceedings of the 3rd International Workshop on Presence, Delft, The Netherlands, 27–28 March 2000; pp. 1–16. [Google Scholar]
- Slater, M.; Linakis, V.; Usoh, M.; Kooper, R. Immersion, presence and performance in virtual environments: An experiment with tri-dimensional chess. In Proceedings of the ACM Symposium on Virtual Reality Software and Technology, Hong Kong, 1–4 July 1996; pp. 163–172. [Google Scholar]
- Fratczak, P.; Goh, Y.M.; Kinnell, P.; Justham, L.; Soltoggio, A. Virtual Reality Study of Human Adaptability in Industrial Human-Robot Collaboration. In Proceedings of the 2020 IEEE International Conference on Human-Machine Systems (ICHMS), Rome, Italy, 7–9 September 2020; pp. 1–6. [Google Scholar]
- Oyekan, J.O.; Hutabarat, W.; Tiwari, A.; Grech, R.; Aung, M.H.; Mariani, M.P.; López-Dávalos, L.; Ricaud, T.; Singh, S.; Dupuis, C. The effectiveness of virtual environments in developing collaborative strategies between industrial robots and humans. Robot. Comput. -Integr. Manuf. 2019, 55, 41–54. [Google Scholar] [CrossRef]
- Blascovich, J.; Loomis, J.; Beall, A.C.; Swinth, K.R.; Hoyt, C.L.; Bailenson, J.N. Immersive virtual environment technology as a methodological tool for social psychology. Psychol. Inq. 2002, 13, 103–124. [Google Scholar] [CrossRef]
- You, S.; Kim, J.-H.; Lee, S.; Kamat, V.; Robert, L.P., Jr. Enhancing perceived safety in human-robot collaborative construction using immersive virtual environments. Autom. Constr. 2018, 96, 161–170. [Google Scholar] [CrossRef]
- Diemer, J.; Alpers, G.W.; Peperkorn, H.M.; Shiban, Y.; Mühlberger, A. The impact of perception and presence on emotional reactions: A review of research in virtual reality. Front. Psychol. 2015, 6, 26. [Google Scholar] [CrossRef] [PubMed]
- Weistroffer, V.; Paljic, A.; Callebert, L.; Fuchs, P. A methodology to assess the acceptability of human-robot collaboration using virtual reality. In Proceedings of the 19th ACM Symposium on Virtual Reality Software and Technology, Singapore, 6–9 October 2013; pp. 39–48. [Google Scholar]
- Koppenborg, M.; Nickel, P.; Naber, B.; Lungfiel, A.; Huelke, M. Effects of movement speed and predictability in human-robot collaboration. Hum. Factors Ergon. Manuf. Serv. Ind. 2017, 27, 197–209. [Google Scholar] [CrossRef]
- George, C.; Khamis, M.; Buschek, D.; Hussmann, H. Investigating the third dimension for authentication in immersive virtual reality and in the real world. In Proceedings of the 2019 IEEE Conference on Virtual Reality and 3D User Interfaces (VR), Osaka, Japan, 23–27 March 2019; pp. 277–285. [Google Scholar]
- Mathis, F.; Vaniea, K.; Khamis, M. Replicueauth: Validating the use of a lab-based virtual reality setup for evaluating authentication systems. In Proceedings of the 2021 CHI Conference on Human Factors in Computing Systems, Yokohama, Japan, 8–13 May 2021; pp. 1–18. [Google Scholar]
- Heydarian, A.; Carneiro, J.P.; Gerber, D.; Becerik-Gerber, B.; Hayes, T.; Wood, W. Immersive virtual environments versus physical built environments: A benchmarking study for building design and user-built environment explorations. Autom. Constr. 2015, 54, 116–126. [Google Scholar] [CrossRef]
- Moussa, M.; Kapadia, M.; Thrash, T.; Sumner, R.; Gross, M.; Helbing, D.; Hölscher, C. Crowd behaviour during high-stress evacuations in an immersive virtual environment. J. R. Soc. Interface 2016, 13, 20160414. [Google Scholar] [CrossRef] [PubMed]
- de-Juan-Ripoll, C.; Soler-Dom, J.L.; Guixeres, J.; Contero, M.; Álvarez Gutiérrez, N.; Alcañiz, M. Virtual reality as a new approach for risk taking assessment. Front. Psychol. 2018, 9, 2532. [Google Scholar] [CrossRef]
- Etzi, R.; Huang, S.; Scurati, G.W.; Lyu, S.; Ferrise, F.; Gallace, A.; Gaggioli, A.; Chirico, A.; Carulli, M.; Bordegoni, M. Using virtual reality to test human-robot interaction during a collaborative task. In Proceedings of the International Design Engineering Technical Conferences and Computers and Information in Engineering Conference, Anaheim, CA, USA, 18–21 August 2019. [Google Scholar] [CrossRef]
- Franke, T.; Attig, C.; Wessel, D. A Personal Resource for Technology Interaction: Development and Validation of the Affinity for Technology Interaction (ATI) Scale. Int. J. Hum. Comput. Interact. 2018, 35, 456–467. [Google Scholar] [CrossRef]
- Hyun, K.K.; Jaehyun, P.; Yeongcheol, C.; Mungyeong, C. Virtual reality sickness questionnaire (VRSQ): Motion sickness measurement index in a virtual reality environment. Appl. Ergon. 2018, 69, 66–73. [Google Scholar] [CrossRef]
- Schubert, T.; Friedmann, F.; Regenbrecht, H. The experience of presence: Factor analytic insights. Presence Teleoperators Virtual Environ. 2001, 10, 266–281. [Google Scholar] [CrossRef]
- Werth, L.; Förster, J. Regulatorischer Fokus. Z. Sozialpsychologie 2007, 38, 33–42. [Google Scholar] [CrossRef]
- Russell, J.A. A circumplex model of affect. J. Personal. Soc. Psychol. 1980, 39, 1161–1178. [Google Scholar] [CrossRef]
- Hardy, C.J.; Rejeski, W.J. Not what, but how one feels: The measurement of affect during exercise. J. Sport Exerc. Psychol. 1989, 11, 304–317. [Google Scholar] [CrossRef]
- Svebak, S.; Murgatroyd, S. Metamotivational dominance: A multimethod validation of reversal theory constructs. J. Pers. Soc. Psychol. 1985, 48, 107–116. [Google Scholar] [CrossRef]
- Murray, E.G.; Neumann, D.L.; Moffitt, R.L.; Thomas, P.R. The effects of the presence of others during a rowing exercise in a virtual reality environment. Psychol. Sport Exerc. 2016, 22, 328–336. [Google Scholar] [CrossRef]
- Jian, J.; Bisantz, A.M.; Drury, C. Foundations for an empirically determined scale of trust in automated systems. Int. J. Cogn. Ergon. 2000, 4, 53–71. [Google Scholar] [CrossRef]
- Pöhler, G.; Heine, T.; Deml, B. Itemanalyse und Faktorstruktur eines Fragebogens zur Messung von Vertrauen im Umgang mit automatischen Systemen. Z. Arbeitswissenschaft 2016, 70, 151–160. [Google Scholar] [CrossRef]
- Spielberger, C.D. State-Trait Anxiety Inventory: Bibliography; Consulting Psychologists Press: Palo Alto, CA, USA, 1989. [Google Scholar]
- Grimm, J.; State-Trait-Anxiety Inventory nach Spielberger. Deutsche Lang-und Kurzversion. Methodenforum der Universität Wien: MF-Working Paper. 2009. Available online: https://empcom.univie.ac.at/fileadmin/user_upload/p_empcom/pdfs/Grimm2009_StateTraitAngst_MFWorkPaper2009-02.pdf (accessed on 29 October 2023).
- Slater, M.; Sanchez-Vives, M.V. Enhancing Our Lives with Immersive Virtual Reality. Front. Robot. AI 2016, 3, 74. [Google Scholar] [CrossRef]
- R Core Team. R: A Language and Environment for Statistical Computing. In R Foundation for Statistical Computing; Chapman and Hall/CRC: Vienna, Austria, 2021; Available online: https://www.R-project.org/ (accessed on 16 December 2021).
- Tomczak, M.T.; Tomczak, E. The need to report effect size estimates revisited. An overview of some recommended measures of effect size. Trends Sport Sci. 2014, 21, 19–25. [Google Scholar]
- Wickham, H. ggplot2: Elegant Graphics for Data Analysis; Springer: New York, NY, USA, 2016; ISBN 978-3-319-24277-4. Available online: https://ggplot2.tidyverse.org (accessed on 1 April 2023).
- Wood, S.N.; Pya, N.; Säfken, B. Smoothing parameter and model selection for general smooth models. J. Am. Stat. Assoc. 2016, 111, 1548–1563. [Google Scholar] [CrossRef]
- Morey, R.D.; Rouder, J.N. BayesFactor: Computation of Bayes Factors for Common Designs, R Package Version 0.9.12-4.2; 2018. Available online: https://CRAN.R-project.org/package=BayesFactor (accessed on 1 April 2023).
- Cœugnet, S.; Naveteur, J.; Antoine, P.; Anceaux, F. Time pressure and driving: Work, emotions and risks. Transp. Res. Part F Traffic Psychol. Behav. 2013, 20, 39–51. [Google Scholar] [CrossRef]
- Robinette, P.; Wagner, A.R.; Howard, A.M. Investigating human-robot trust in emergency scenarios: Methodological lessons learned. In Robust Intelligence and Trust in Autonomous Systems; Mittu, R., Sofge, D., Wagner, A., Lawless, W., Eds.; Springer: Boston, MA, USA, 2016. [Google Scholar] [CrossRef]
- Manchon, J.B.; Bueno, M.; Navarro, J. Calibration of Trust in Automated Driving: A Matter of Initial Level of Trust and Automated Driving Style? Hum. Factors 2021. [Google Scholar] [CrossRef]
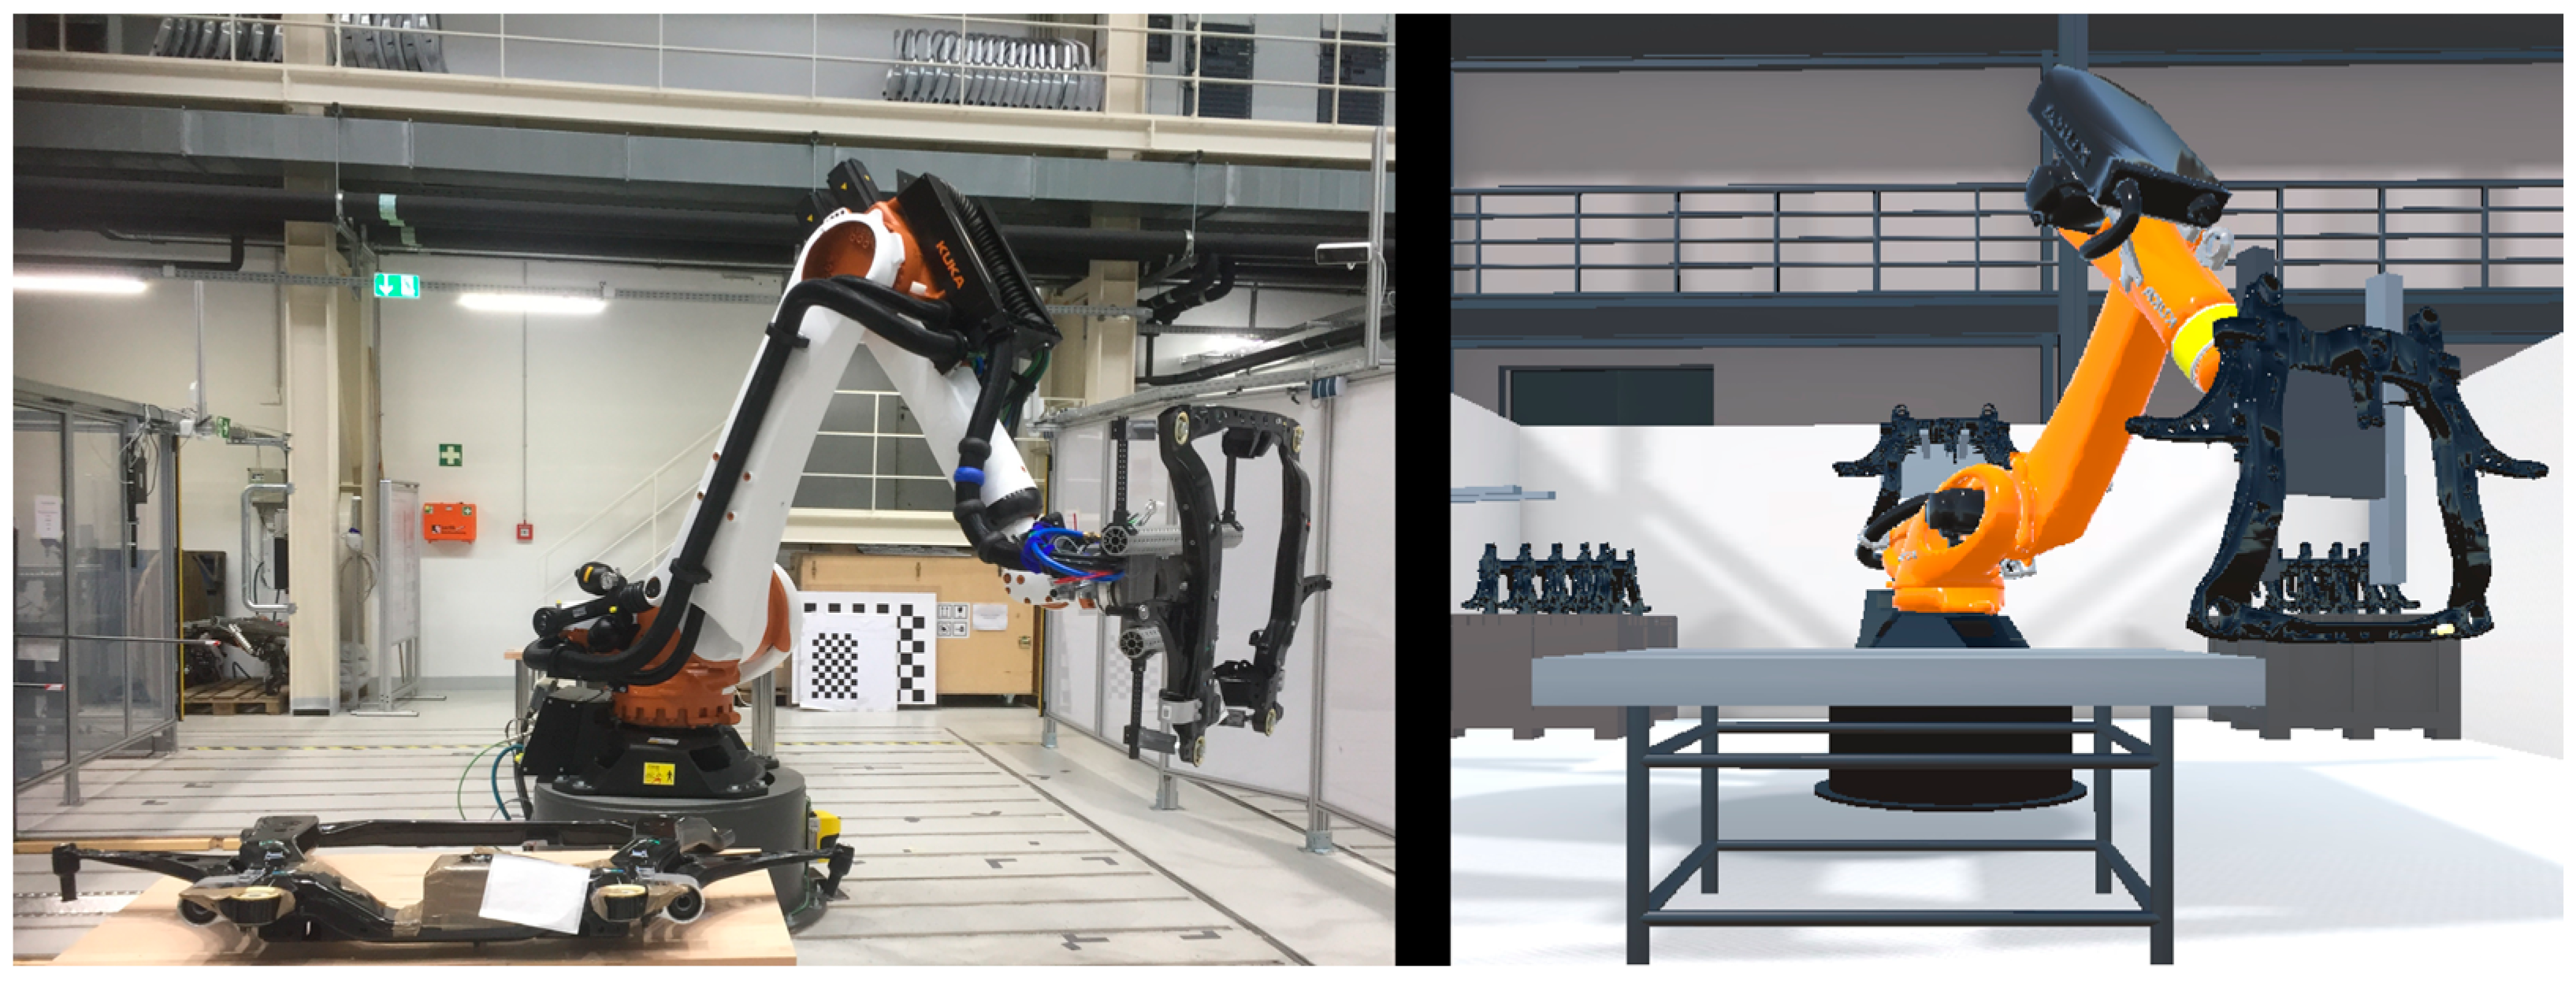

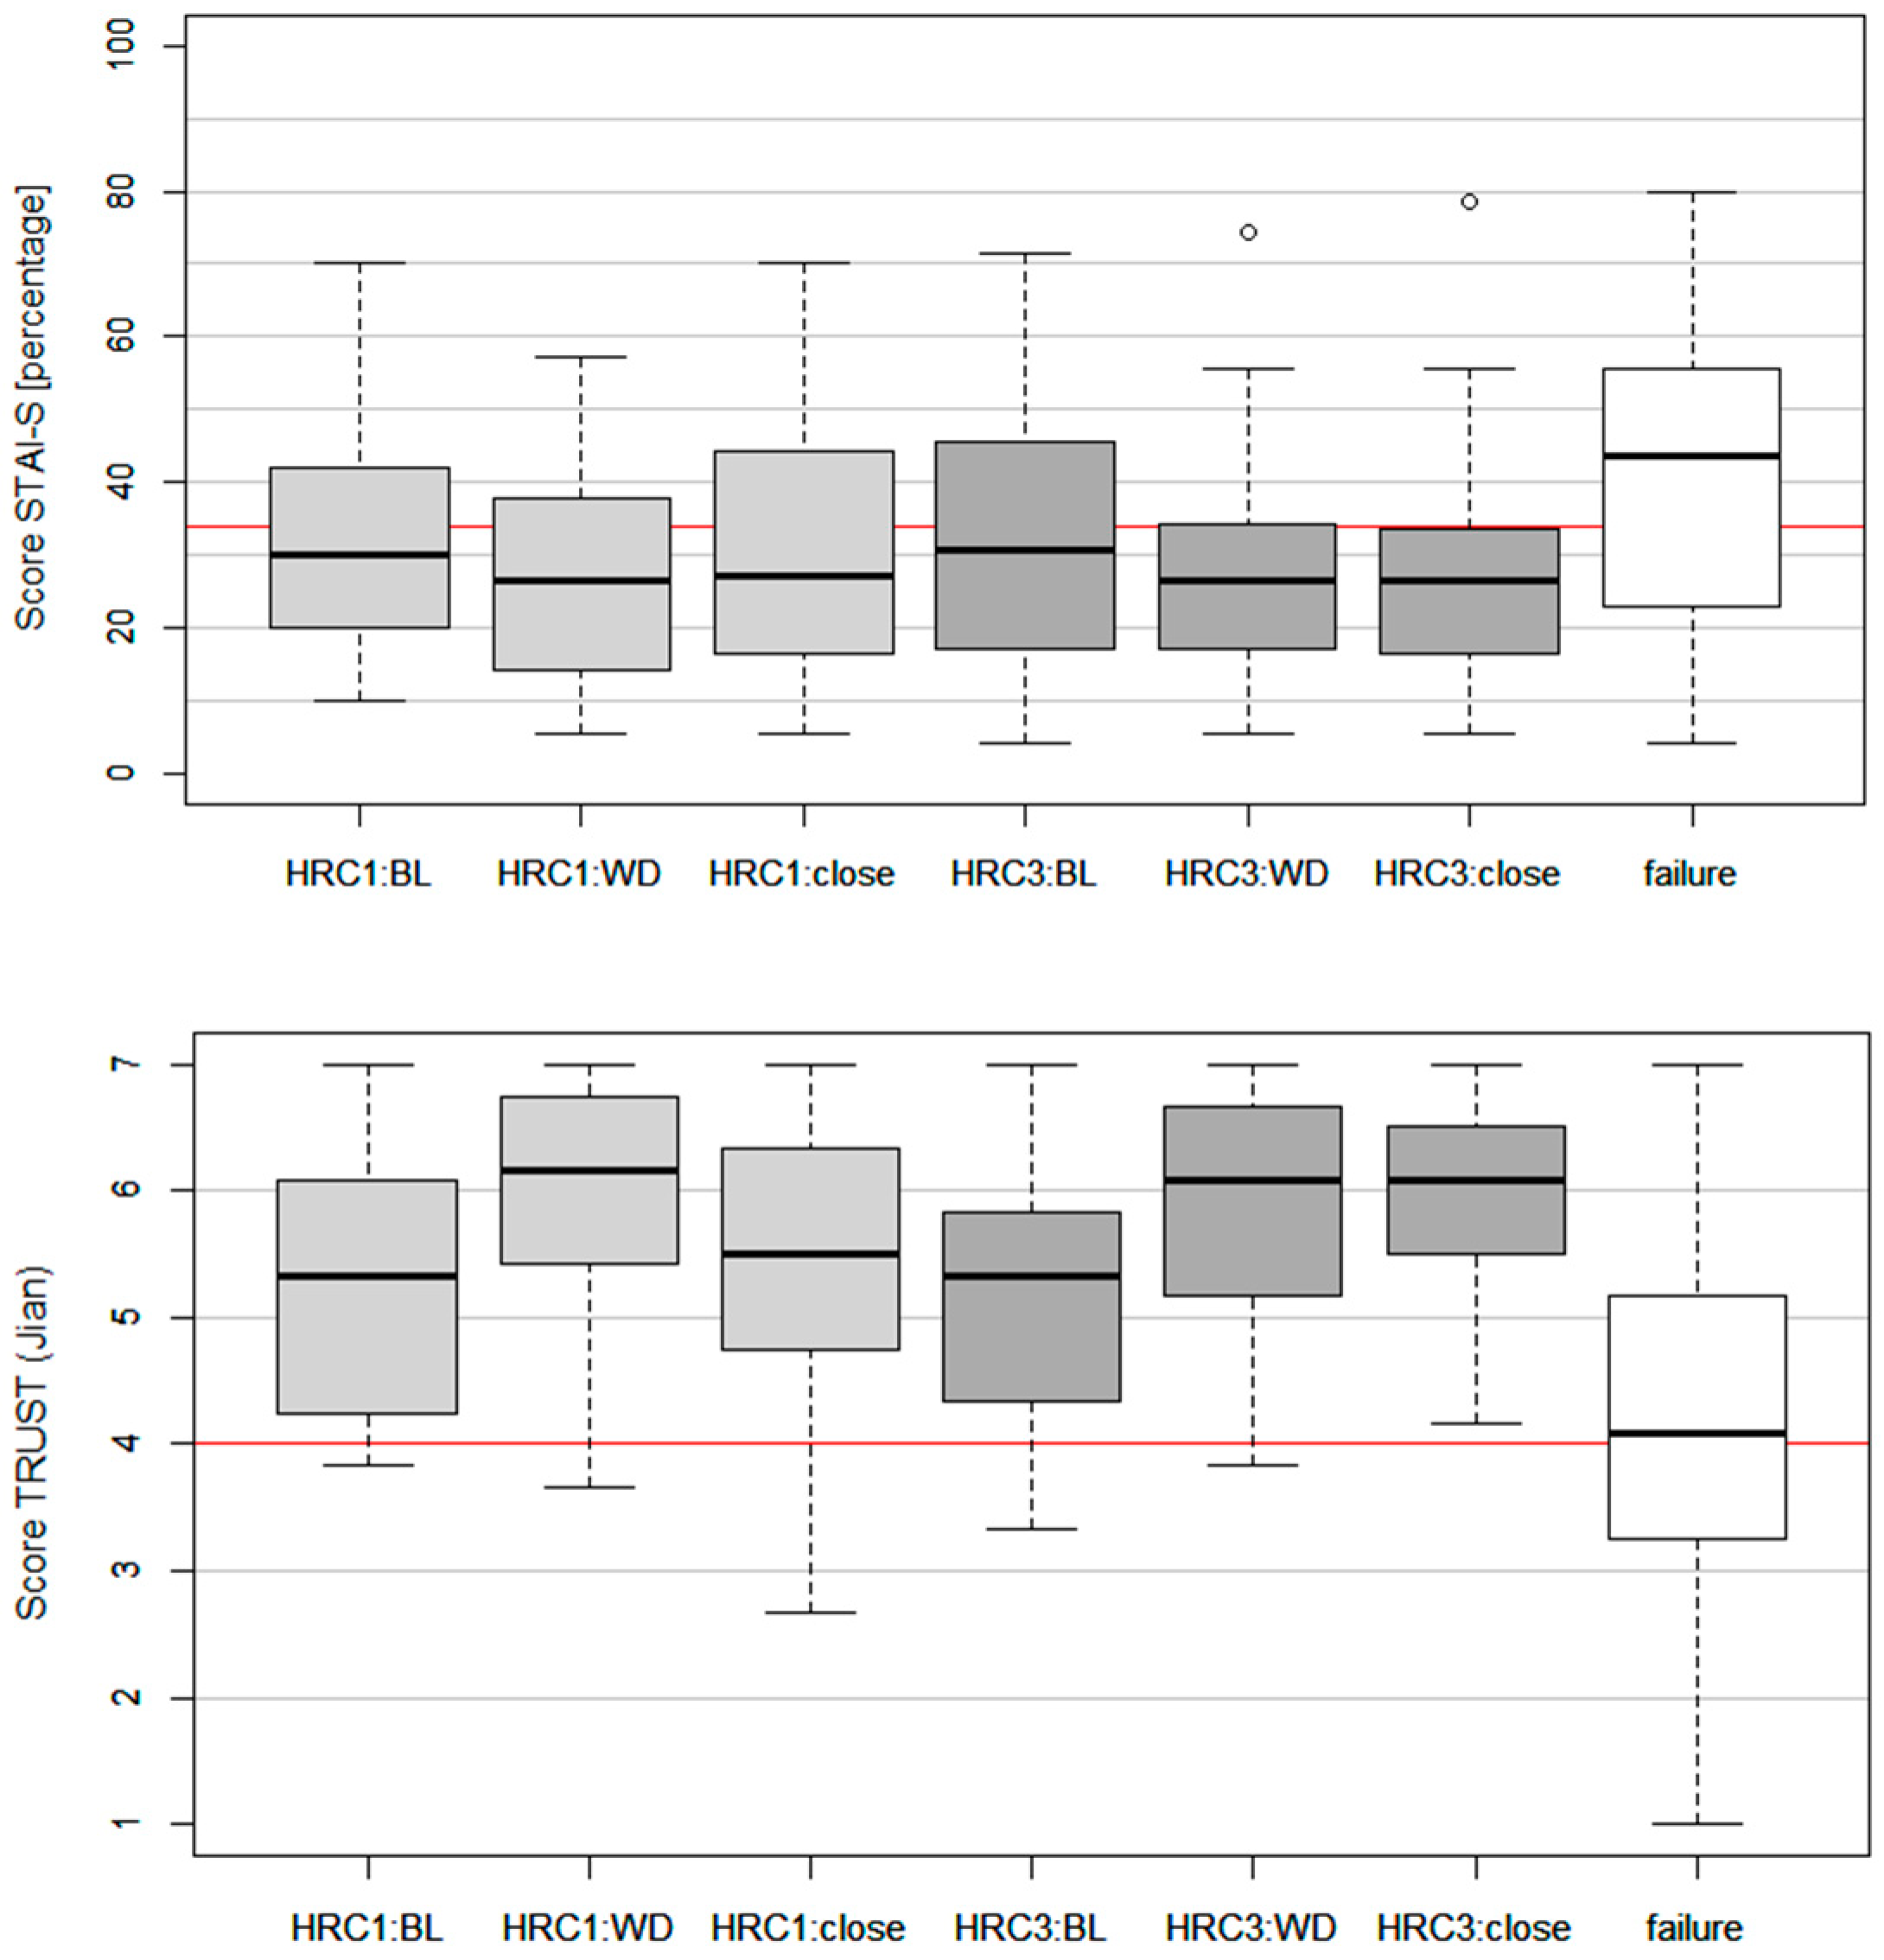
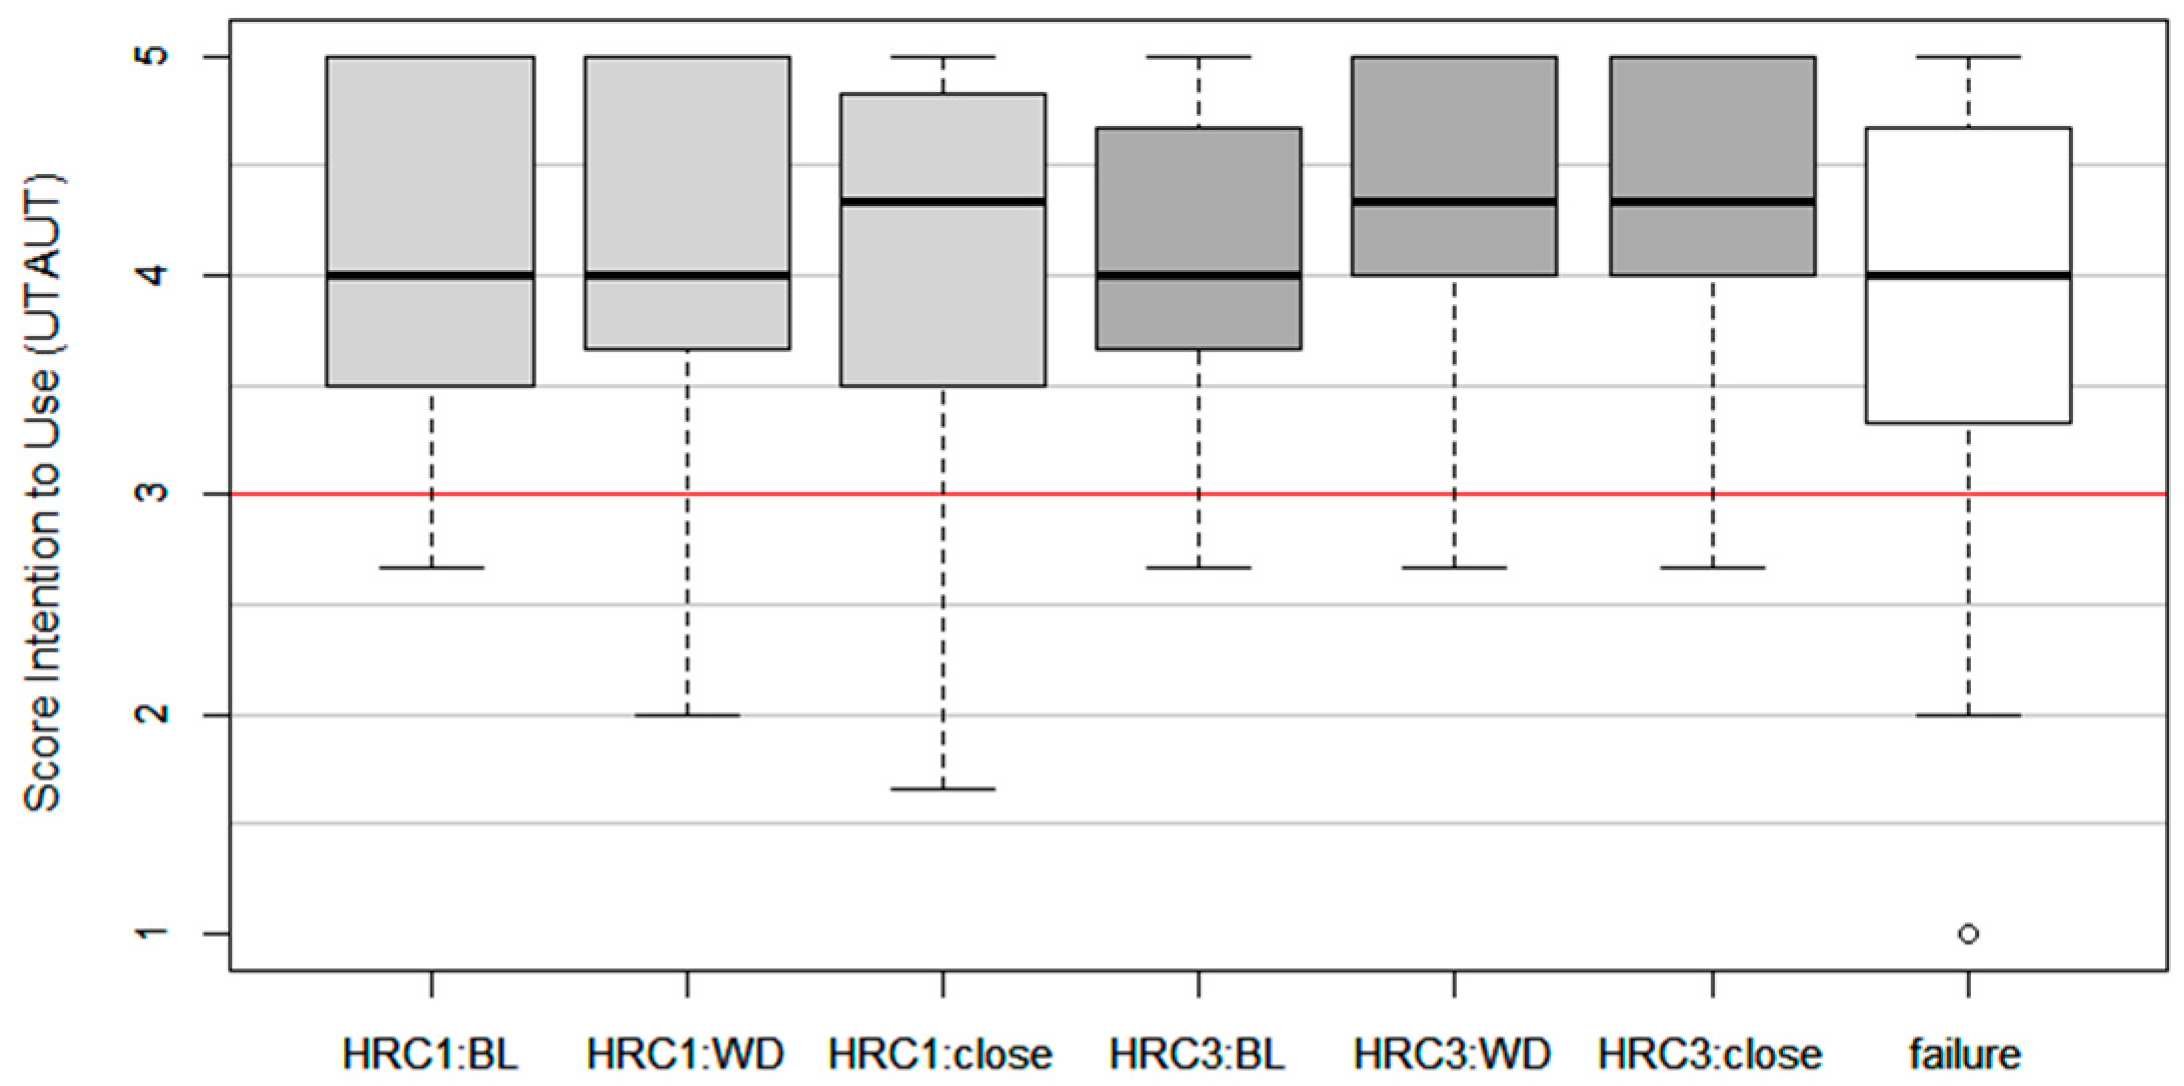

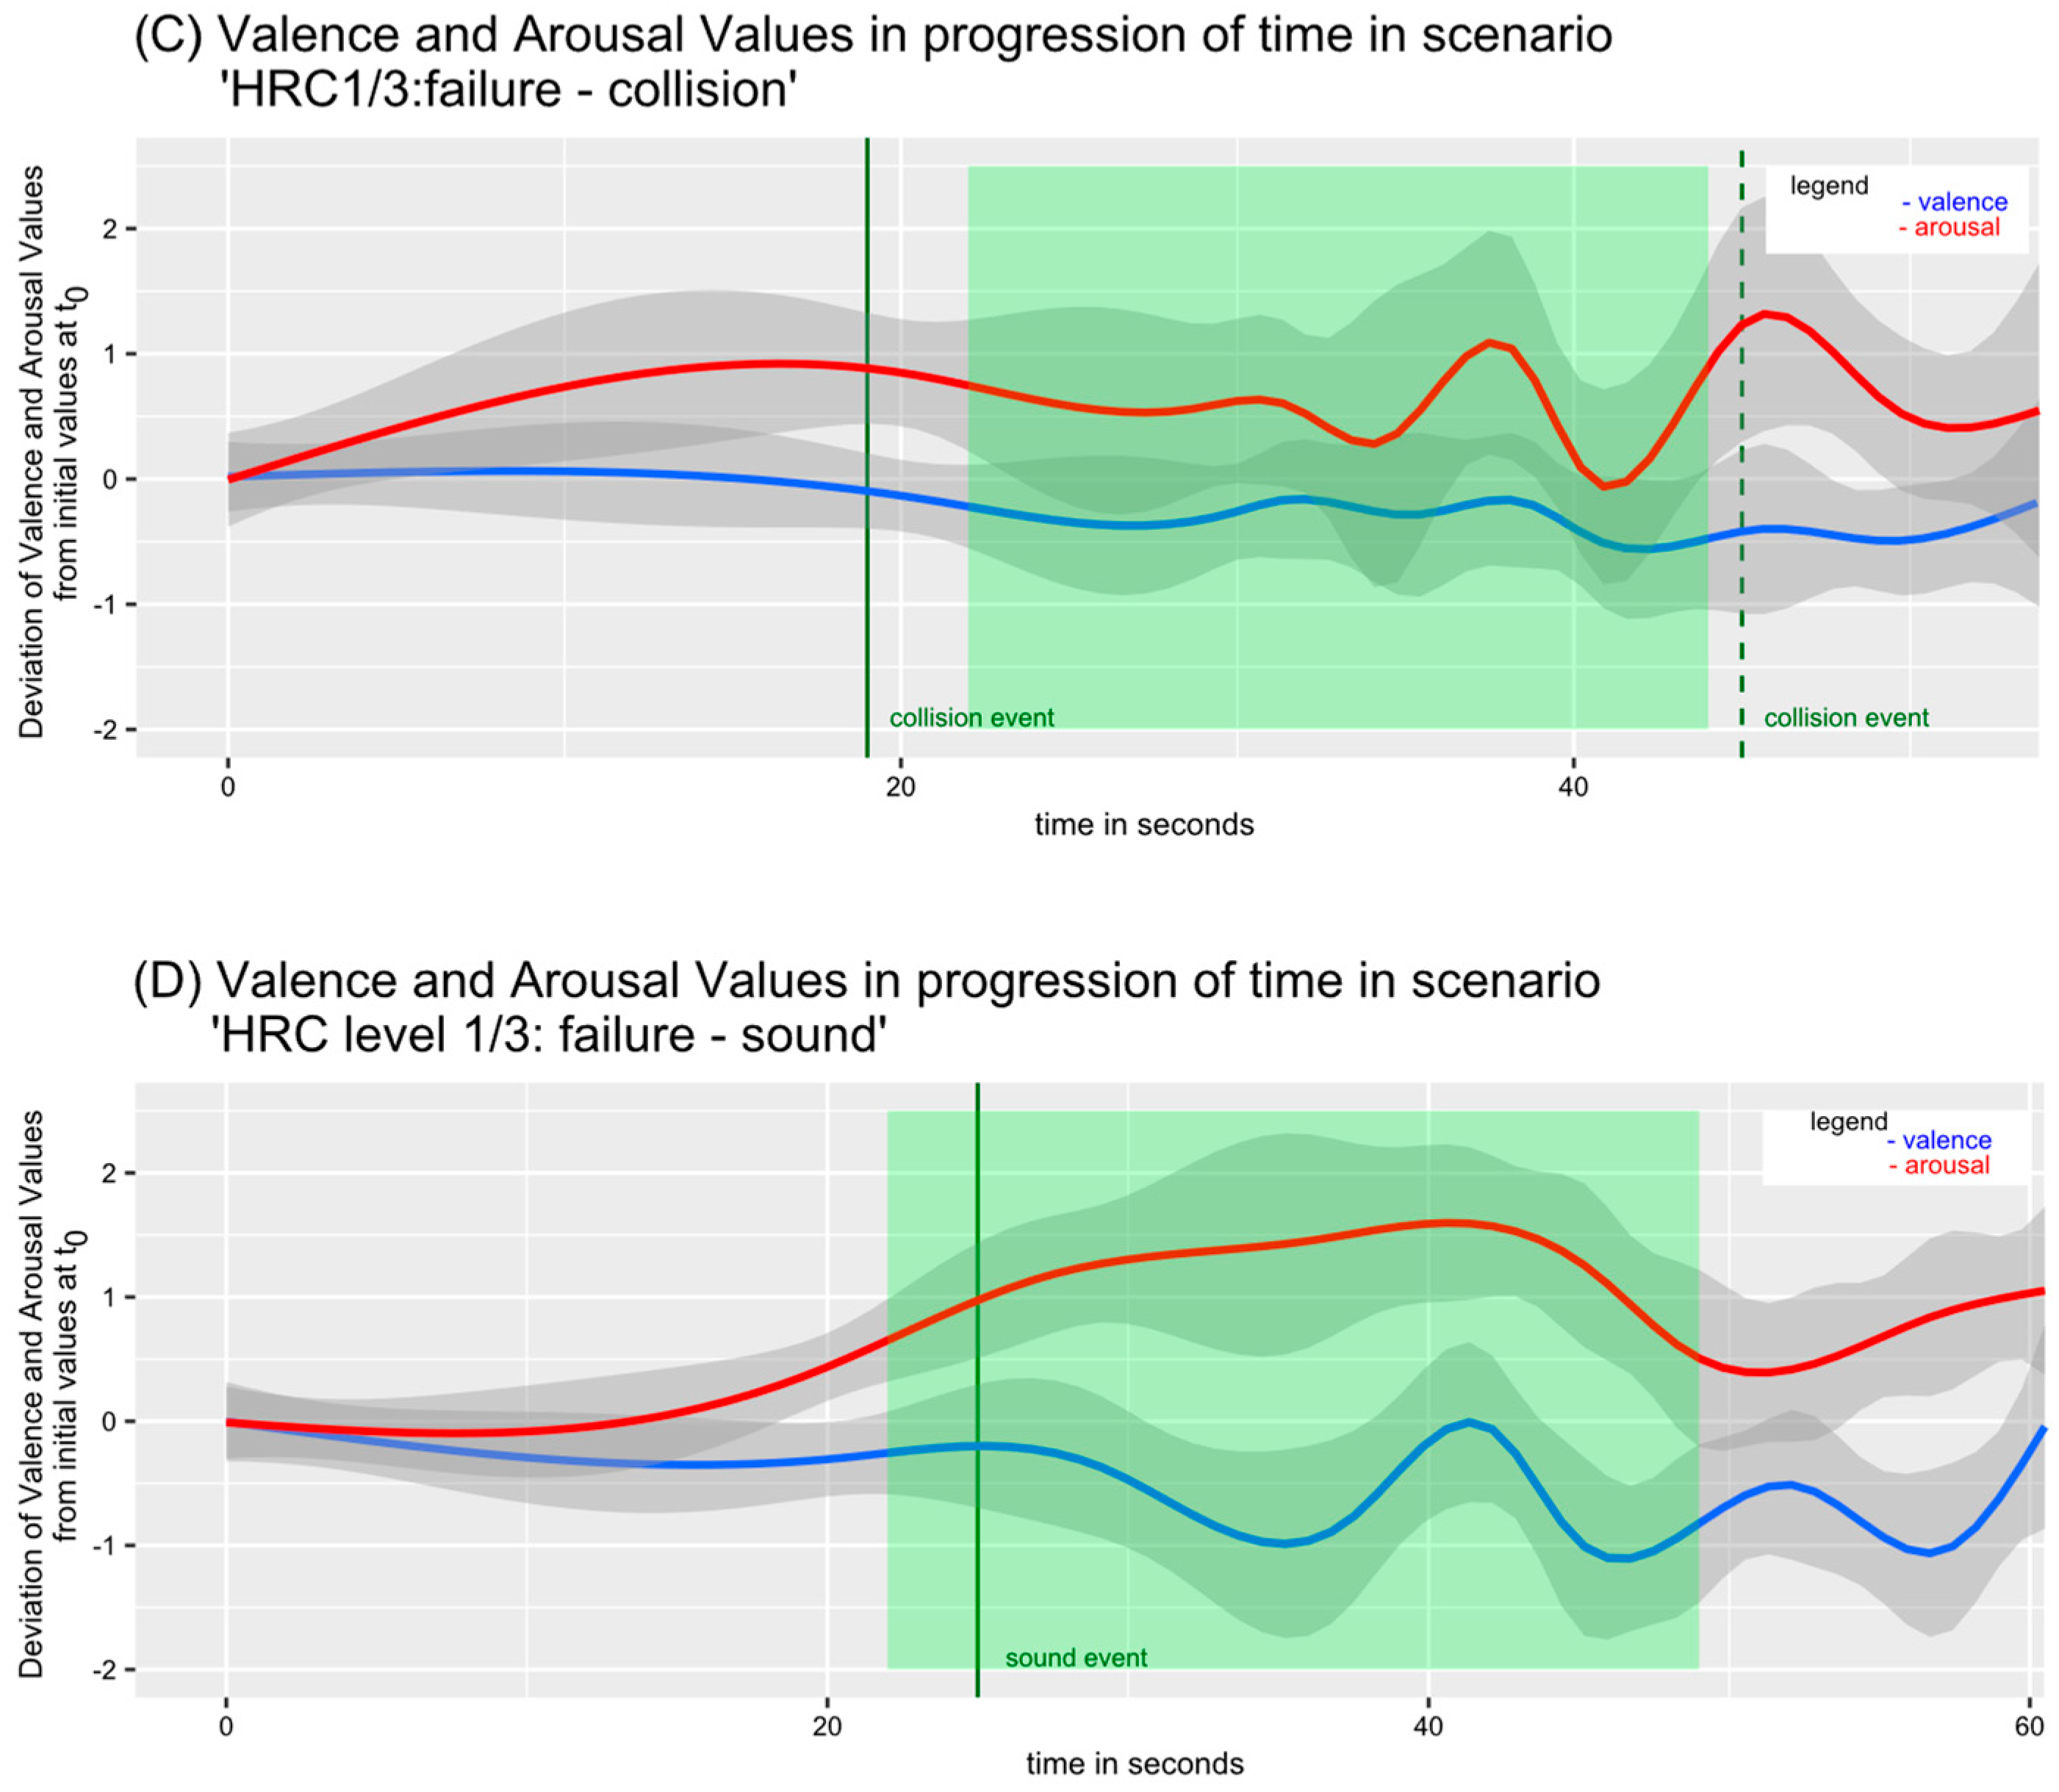
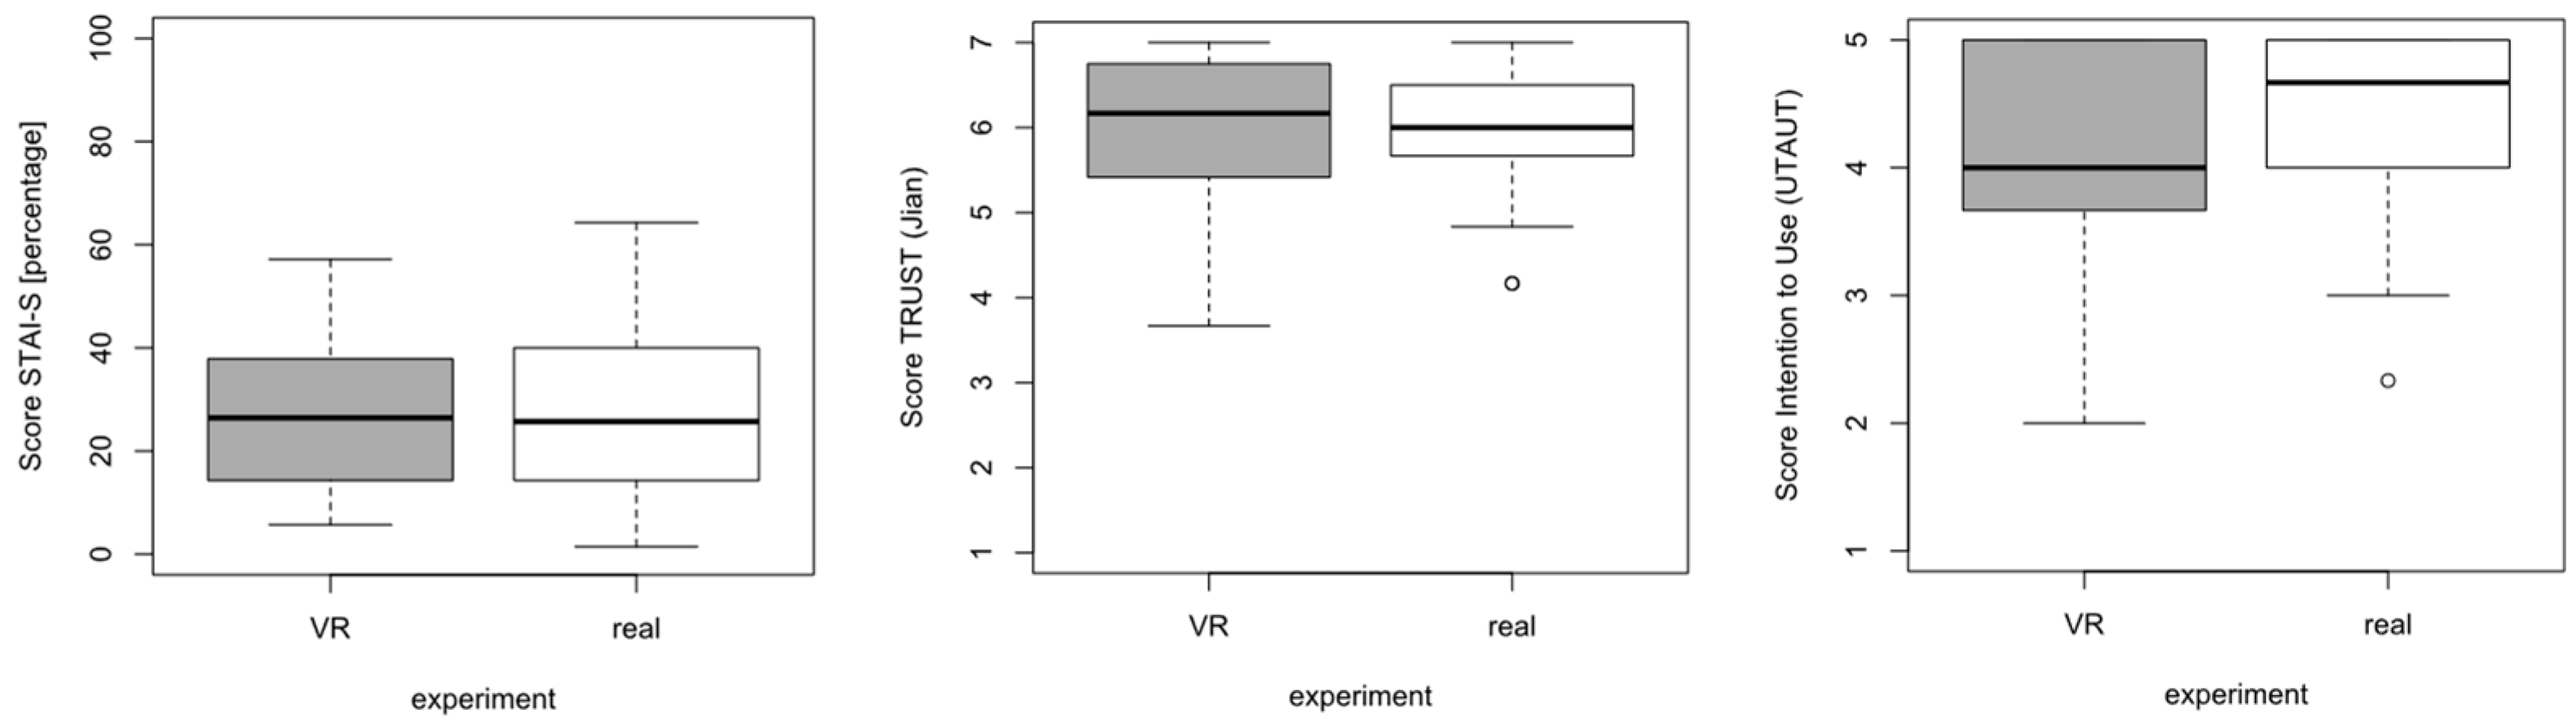
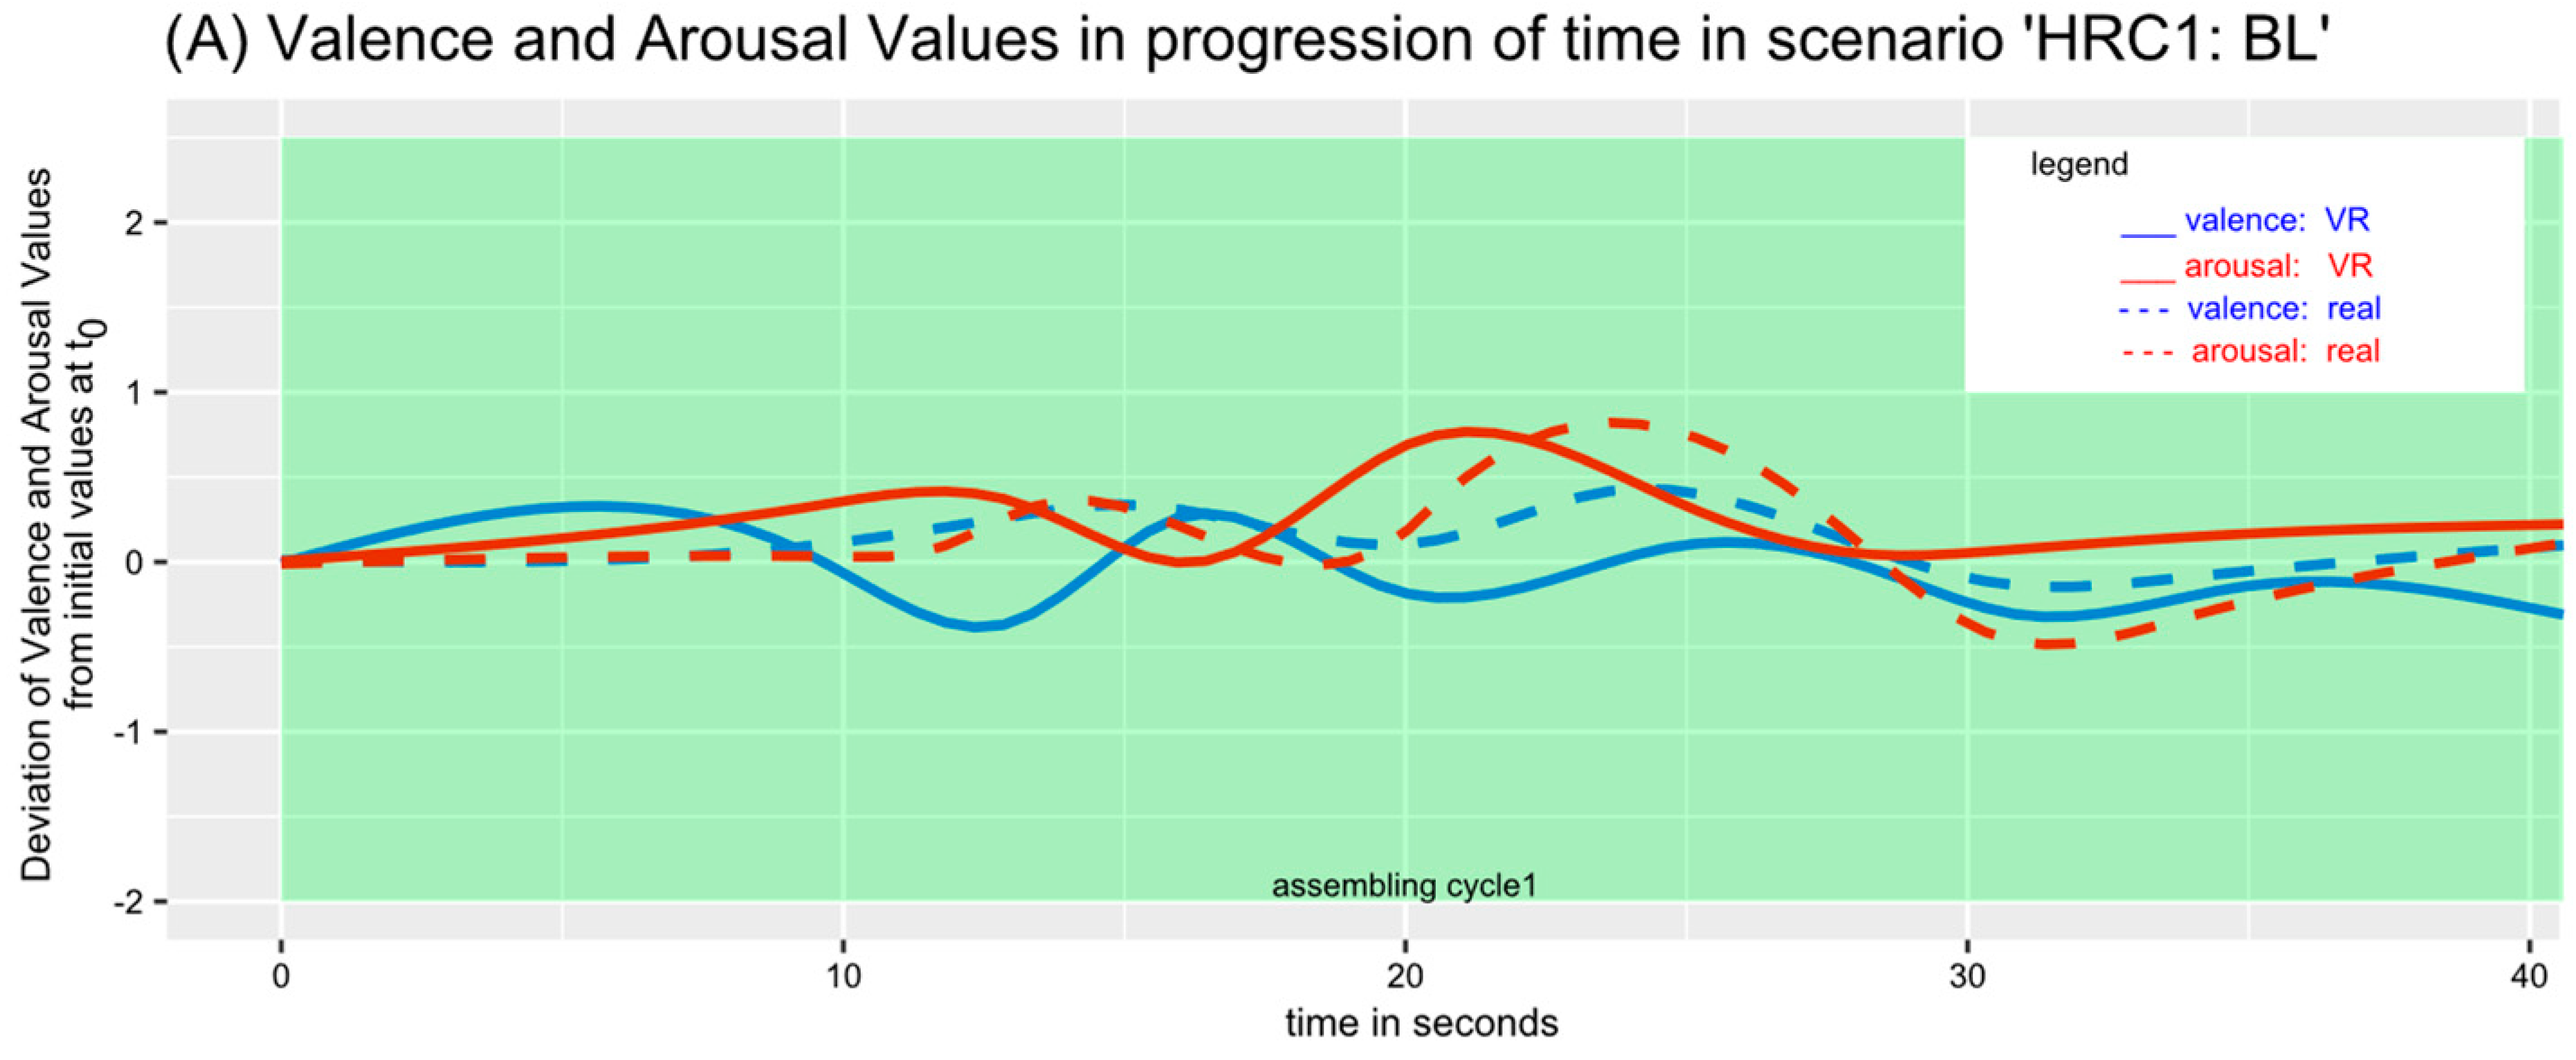
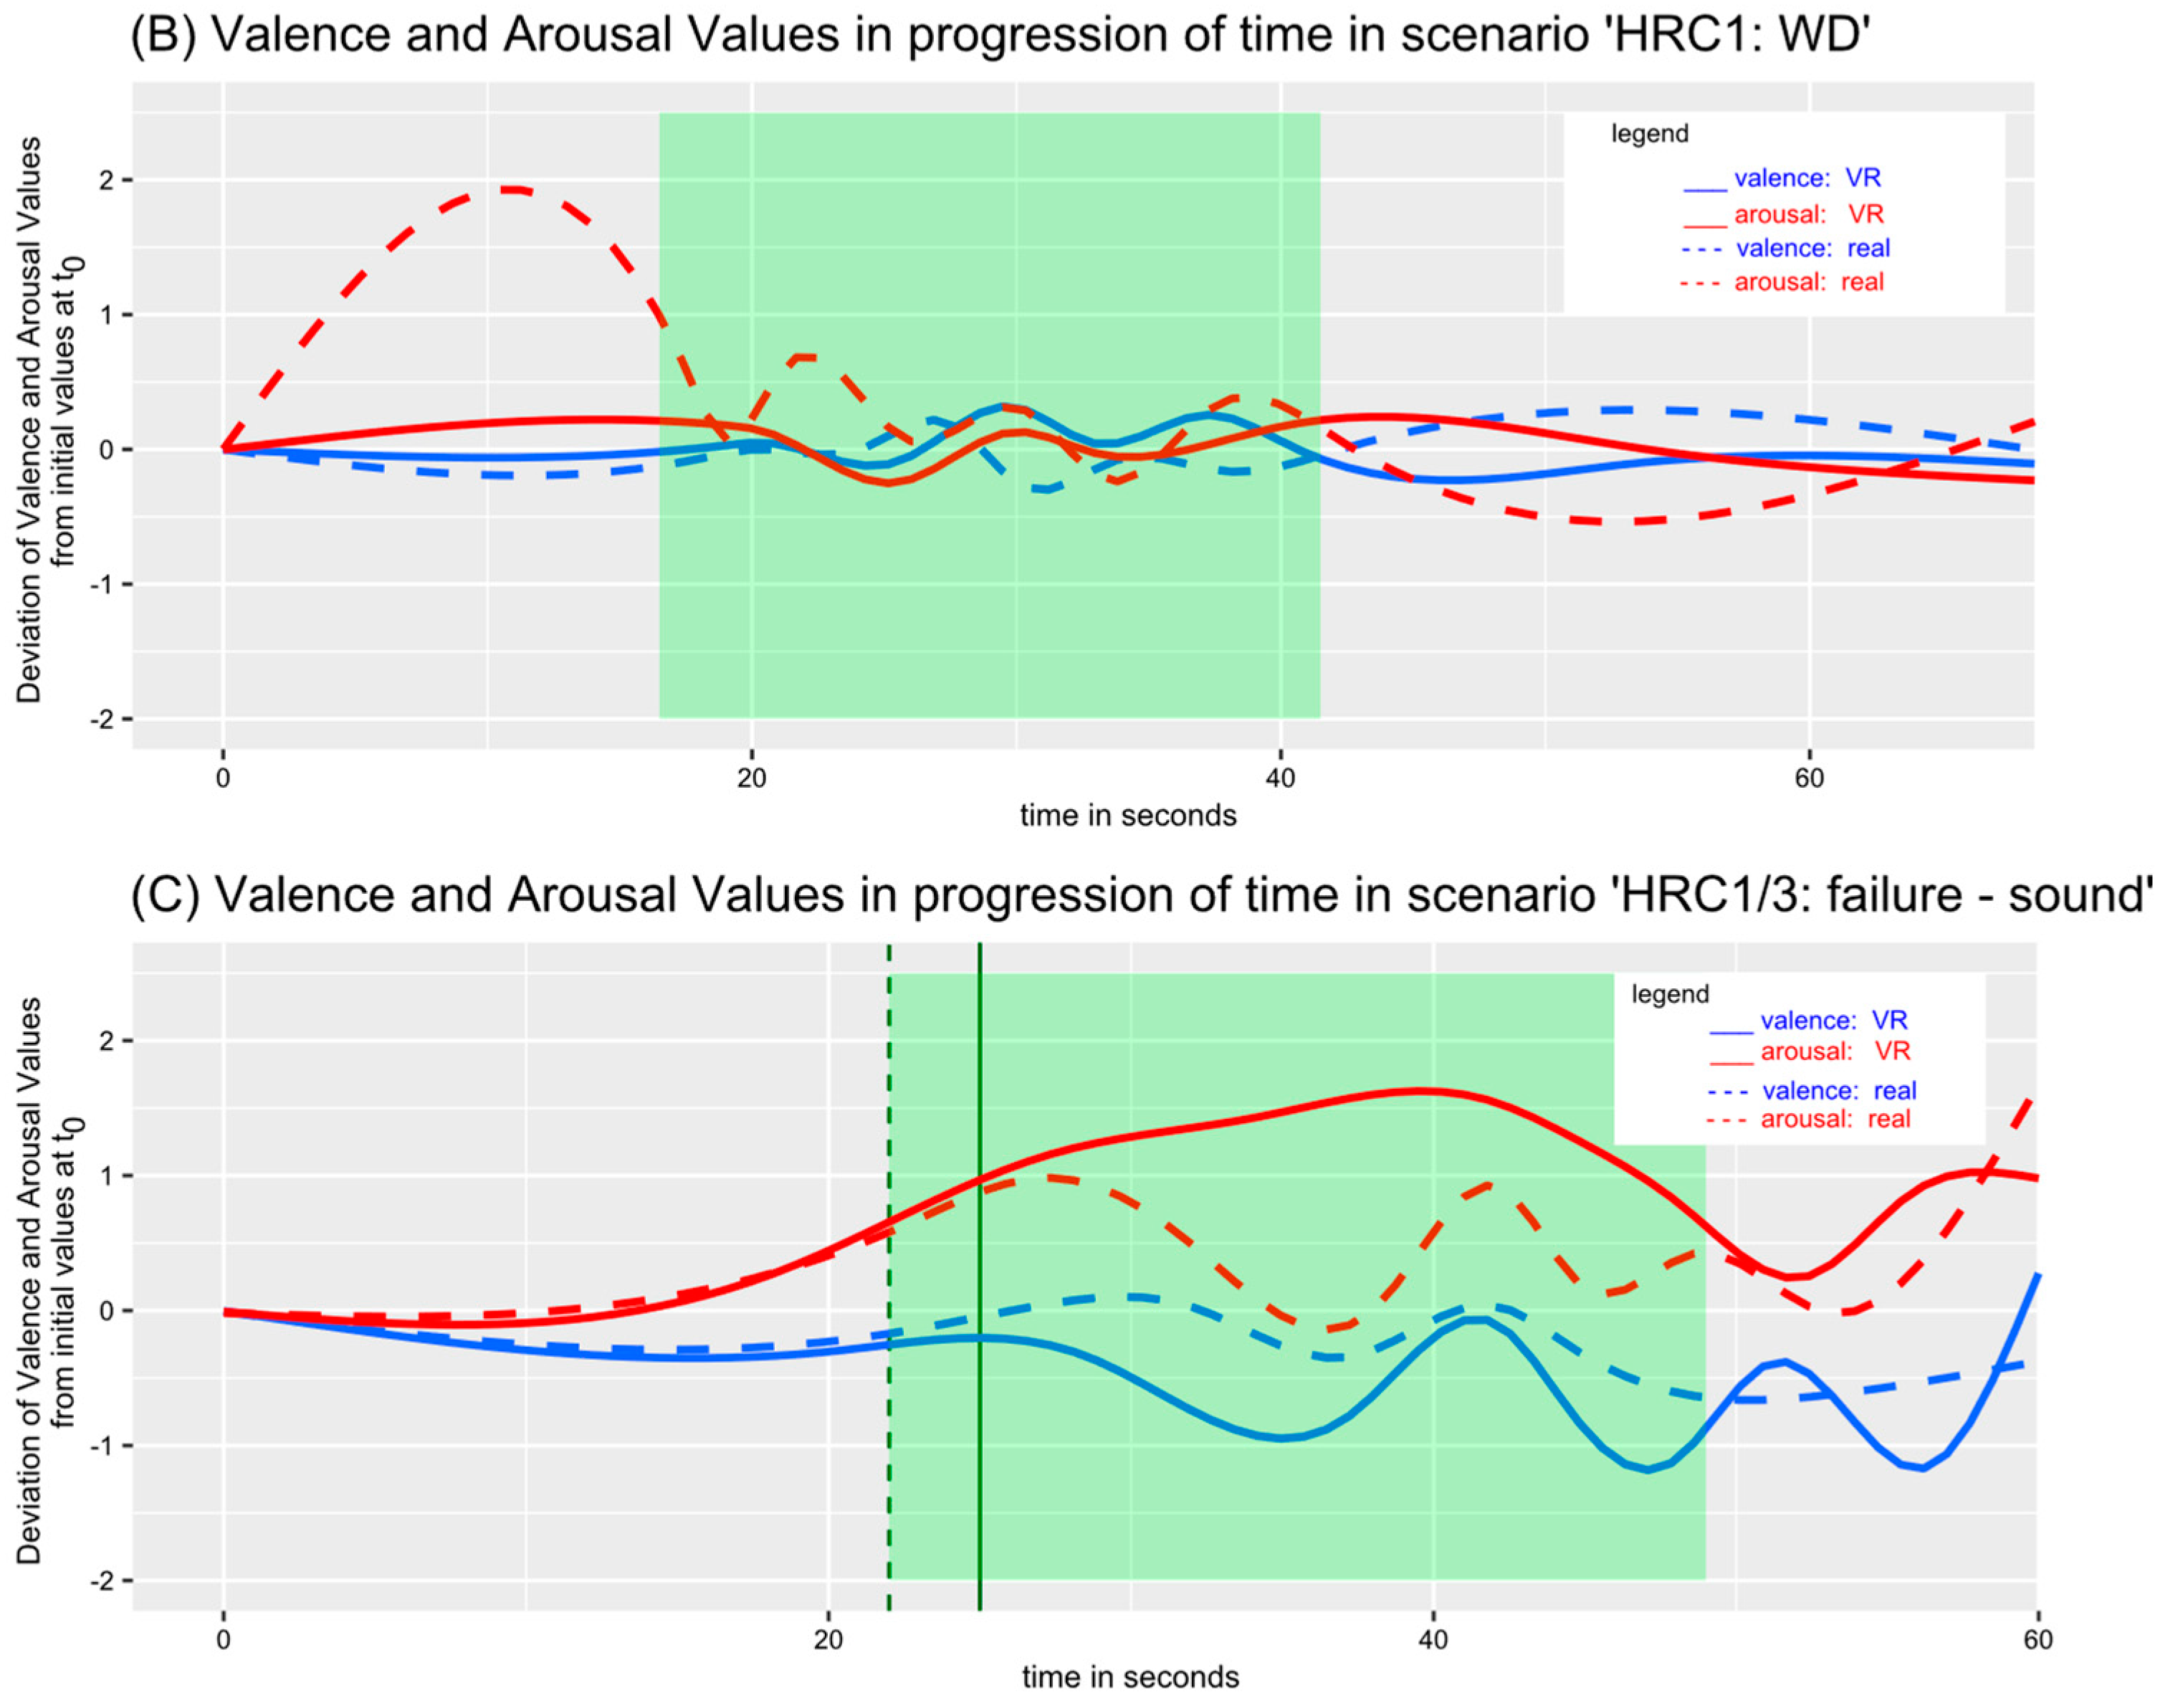
Disclaimer/Publisher’s Note: The statements, opinions and data contained in all publications are solely those of the individual author(s) and contributor(s) and not of MDPI and/or the editor(s). MDPI and/or the editor(s) disclaim responsibility for any injury to people or property resulting from any ideas, methods, instructions or products referred to in the content. |
© 2023 by the authors. Licensee MDPI, Basel, Switzerland. This article is an open access article distributed under the terms and conditions of the Creative Commons Attribution (CC BY) license (https://creativecommons.org/licenses/by/4.0/).