Next Article in Journal
The Cyberdivisions Produced by the Design of VGI under the Platform Economy: The Case of the Restaurant Sector in TripAdvisor
Previous Article in Journal
A Novel Robust Approach for Computing DE-9IM Matrices Based on Space Partition and Integer Coordinates
 
 
Correction published on 8 December 2022, see ISPRS Int. J. Geo-Inf. 2022, 11(12), 613.
Article

A Study on the Spatio-Temporal Land-Use Changes and Ecological Response of the Dongting Lake Catchment

1
Laboratory of Key Technologies of Digital Urban-Rural Spatial Planning of Hunan Province, College of Architecture & Urban Planning, Hunan City University, Yiyang 413000, China
2
Key Laboratory of Forestry Remote Sensing Based Big Data & Ecological Security for Hunan Province, Central South University of Forestry and Technology, Changsha 410004, China
3
Key Laboratory of Agro-Ecological Processes in Subtropical Region, Institute of Subtropical Agriculture, Chinese Academy of Sciences, Changsha 410125, China
4
Dongting Lake Station for Wetland Ecosystem Research, Institute of Subtropical Agriculture, Chinese Academy of Sciences, Changsha 410125, China
5
Hydrology & Water Resource Bureau of Hunan Province, Changsha 410004, China
*
Author to whom correspondence should be addressed.
ISPRS Int. J. Geo-Inf. 2021, 10(11), 716; https://doi.org/10.3390/ijgi10110716
Submission received: 6 October 2021 / Revised: 16 October 2021 / Accepted: 19 October 2021 / Published: 21 October 2021 / Corrected: 8 December 2022

Abstract

:
Catchments support the survival and development of humans in a region and investigating the mechanism of land-use changes and ecological responses in catchments is of great significance for improving watershed ecological service functions. Taking the Dongting Lake catchment as the study area, this study used spatial analysis, an ecosystem service value (ESV)-equivalent factor method, grid method, and other spatial analysis methods to explore land-use changes and the corresponding ecological service value response from 1990 to 2015, to provide an important theoretical reference for ecological service management, regional planning and ecological service function improvement in the Dongting Lake Basin. Our findings are as follows: (1) apart from a trend of notable expansion in construction land, the land-use types in the Dongting Lake catchment did not change significantly. (2) Grassland had the fastest transfer-out rate; forest land were cultivated land comparably transferred to each other with a larger area, where both were simultaneously and continuously transferred out as construction land; water areas, wetlands, and construction land were all transferred in, where construction land had the fastest transfer rate. (3) The total ESV of the watershed first increased and then decreased, but the overall change was small; spatially, the wetlands and water areas had a higher ESV, whereas construction land and cultivated land had lower ESVs. (4) Soil protection, gas exchange, climate regulation, biodiversity, and water conservation are always the main ecosystem service functions of a catchment, where the service function of the catchment ecosystem is greater than the productive function. The increase in construction land was the main factor for the increased differences between the spatial distributions of the soil, raw materials, biodiversity protection, and gas exchange.

1. Introduction

Spatial quantification and collaborative research on land use/cover change (LUCC) are important methods for examining global changes, which have become a research hotspot in geography and ecology [1,2,3]. LUCC affects the structure, quality, process and other aspects of ecosystems and promotes changes in ecosystem services [4,5,6,7,8]. Ecosystem services include products and services provided by ecosystems that facilitate human survival and maintain the life support system of Earth. Ecosystem services can be expressed through an ecosystem service value (ESV) [9,10], which is the representation of economic value assessments on the environmental commodities and resources provided by an ecosystem, which has complex links with LUCC. Recently, complex human activity has led to changes across half of the Earth’s land surface while threatening two-thirds of Earth’s ecosystem services [11], where the conversion of natural surfaces to urban land has one of the most irreversible human impacts on Earth’s biosphere, causing farmland loss, affecting local climates, and destroying biological habitats and diversity [12]. Therefore, exploring the impact that the evolution of LULC has on the ESV is particularly important. Currently, many studies on LUCC and ESV have primarily focused on spatial and temporal comparative analyses of LUCC, evaluations of ecosystem services, and quantitative expressions of the spatial characteristics of two areas [13,14,15]. For quantitative descriptions, the selection of reasonable research scales and evaluation units is essential. These also allow a seamless connection between territorial spatial planning and ecological compensation policies, which is an important proposition in LUCC and ESV studies using spatial characteristics. The scales for ESV evaluation mainly involve geographic grid units, administrative divisions, and watershed scales [10,13,16,17]. Considering the dependence that the evaluation units have on the scales, many studies have examined the grid size or evaluation scale of a region and determined an appropriate method before performing investigations. Currently, there are many methods to evaluate the ESV traditionally, such as a market value method, an alternative cost method, a conditional value method, and so on [18,19,20], and, based on this, the energy value method, material quantitative method and equivalent factor methods were developed and expanded [21,22,23]. Notably, Xie, et al. (2003) proposed the equivalent factor method with a unit area value equivalent table, which has been applied widely in ESV with a 1 km grid in China [23]. Thus, the study used the quantitative factor method to quantize the ESV of Dongting Lake Basin.
The Dongting Lake Basin is an important sub-basin of the Yangtze River Basin. The rich resources in the basin have important ecological functions, such as water storage, flood regulation, water conservation, biodiversity protection, and water vapor regulation, as well as supporting the survival and development of the regional inhabitants. Recently, however, owing to the influence of multiple factors such as natural disasters and unreasonable human development and resource utilization, the structures and processes of local ecosystems have changed to varying degrees and the ecosystem quality has deceased, which is urgent to identify areas where ecosystem service function weakens within the watershed to optimize ecosystem service management [24,25]. More importantly, the prominent contradiction between humans and nature has posed a significant threat to the balance between natural ecosystems and the continuous economic development inherent in society. Since the 1980s, many studies have been conducted on the Dongting Lake Basin, including studies in rural areas, towns, cities, lakes, rivers, and watersheds. Various perspectives have involved the use of ecological service functions; most studies have discussed the natural laws associated with the relationships between the water, air, and land surfaces in the river basin [26,27,28]. However, studies have rarely evaluated the relationship between LUCC and ESV response in the entire region. Therefore, in this study, we investigated LUCC and the ecological response in the Dongting Lake Basin at the basin-scale.
Based on land-use data, the study used the 1-km grid method, geological overlay analysis, correlation analysis, and other methods to measure the temporal and spatial changes of LUCC in the Dongting Lake Basin, to analyze the response characteristics of the ESV, and to explore the driving mechanism of spatial differentiation. The results may help to strengthen the ecological management, protection, and local spatial planning of the Dongting Lake basin.

2. Materials and Methods

2.1. Study Area

The Dongting Lake Basin is located in the southern part of central China (ranging from 24°38′–30°26′ N and 107°13′–114°18′ E) and includes the Hunan, Hubei, Guangxi, Guizhou, and Chongqing provinces (Figure 1). It covers a total area of approximately 26.28 km2, of which Hunan Province accounts for 78%, Guizhou Province accounts for 11.6%, and Guangxi, Chongqing, and Hubei provinces together account for 10.4%. The basin is surrounded by mountains to the east, south, and west; the northern part of the basin is the Dongting Lake Plains; and the central area consists of hills and basin, forming a unique “horseshoe-shaped” pattern. The basin has a typical subtropical monsoon climate zone with alternating winter and summer monsoons. The precipitation in the basin is unevenly distributed with large inter-annual variability and a high frequency of floods and droughts. The water system in the basin is complex, including four large rivers: the Xiangjiang, Zijiang, Yuanjiang, and Lishui rivers. Dongting Lake is the second largest lake in China and plays an important role in ecosystem protection of the entire Yangtze River Basin.

2.2. Data Resources and Processing

The data used in this study mainly include three types of data, including basic geographic data, meteorological data, and socio-economic data.
(1)
The basic geographic data included administrative division data, land-use data, and digital elevation models (DEM), which were mainly obtained from the Resource and Environment Science and Data Center of the Chinese Academy of Sciences (https://www.resdc.cn/, accessed on 27 July 2021). The administrative division data were the 2015 national, provincial, and municipal vector boundaries. The 1:100,000 land-use data were obtained from the interpretation of Landsat series images and included six years: 1990, 1995, 2000, 2005, 2010, and 2015. The land-use data were divided into two levels. The first level was divided into six categories: cultivated land, forest land, grassland, water area, construction land, and unused land; the second level was divided into 26 categories [29]. This set of data has been extensively applied in relevant studies with a higher classification accuracy [30,31,32,33]. To study land-use in the Dongting Lake Basin, we adjusted for the first-level classification structure that merges the second level tidal flats, beaches, and marshes into wetlands, together with the other six first-level categories. Referring to the relevant literatures [34,35,36], compared with other DEM data, the application effect of SRTM DEM was relatively good; thus, the 30 m resolution DEM of SRTM 3 was mosaicked and clipped to provide the DEM data for the Dongting Lake Basin area.
(2)
Meteorological data, including rainfall and temperature, were obtained from the National Meteorological Information Centre of China (http://www.nmic.cn/, accessed on 27 July 2021).
(3)
The socio-economic data included 10 indicators: GDP; population; output values of the primary, secondary, and tertiary industries; fixed asset input; per capita income; agricultural product output; retail sales of social goods; and fiscal expenditure. These were all obtained from the Hunan Province Statistical Yearbook.

2.3. Methods

2.3.1. Land-Use Change

The study aimed at quantifying the ESV of Dongting Lake Basin and to explore the mechanism of its response to LUCC. Thus, we first analyzed the land use changes, and then adopted the 1 km grid method to spatially quantify the ESV of the study area, and associate its spatiotemporal change process with the LUCC changes. The methods used in the study mainly included land cover dynamic index, conversion matrix, ESV-equivalent factor method, etc., which almost were implemented in ArcGIS10.4 software.

Land Cover Dynamic Index

The land cover dynamic index (LCDI) and bilateral LCDI (BLCDI) are good indicators of the intensity of land-use change, in which LCDI can characterize the direction and speed of land-use change effectively and BLCDI can quantize the comprehensive speed of land-use change well [37]. These are calculated as follows:
L C D I i = ( U i a U i b ) U i a × 1 T × 100 %
B L C D I i = ( U i j + U j i ) U i × 1 T × 100 %
where Uia is the area of land cover type i at the beginning of the study period in the study area, Uib is the area of type i at the end of the period in the study area, ∑Uij is the total area of type i converted into other types, ∑Uji is the total area of type j converted from other types, T is the study period, and LCDIi and BLCDIi are the dynamic index and bilateral dynamic index of land cover type i, respectively [37,38].

Conversion Matrix

A conversion matrix is the main quantitative approach for examining the number and direction of different types of converted land-use. It can specifically reflect the structural characteristics of land-use change and the corresponding directions of conversion. Table 1 expresses the mathematical formulas for the conversion matrix.
In Table 1, T1 and T2 represent the land-use types at the beginning and end of the study period, respectively, Pnn represents the unchanged area of land type n during the study period, Pn+ represents the area of land-use type n at the beginning of the study period, P+n represents land-use type n at the end of the study period, Pn+Pnn represents the reduction in the area of land type n during the study period, and P+nPnn represents the increase in the area of land type n during the study period.

2.3.2. Ecosystem Service Value

Costanza et al. clarified the principle and method for ESV calculation [39] while Xie et al. improved the model based on expert knowledge [23,40]. We used the ESV equivalent per unit area of the Chinese ecosystem as estimated by Xie et al. [23] to evaluate the ecosystem services of the study area. To reflect the regional differences, we calculated the ESV equivalent as follows [41,42]:
V C 0 = 1 7 × P × 1 n i = 1 n Q i × 100
where V C 0 is the value of the ESV-equivalent factor (RMB·km−2·a−1), P is the national average food price (RMB·kg−1), Q is the unit grain output in the study area (kg·km−2), and n is the number of years. To facilitate comparison, the national grain unit price in 2015 was selected as 2.36 RMB·kg−1. The unit grain output in Dongting Lake Basin was calculated as 527,156 kg·km−2 by multiplying the average annual grain yield and the area proportion of Hunan, Guizhou, Hubei, Guangxi, and Chongqing. After regional correction, the value of the equivalent factor was 303,346 RMB·km−2·a−1. The equivalent coefficients are shown in Table 2. The value of each ecological service function of the construction land was set to 0.
The ESV was calculated as follows:
E S V = k = 1 n ( A k × V C k )
E S V f = ( A k × V C f k )
where the ESV is the ecosystem service value, A k is the area of land-use type k (km2), V C k is the ecological value coefficient (RMB·km−2·a−1), E S V f is the value of the f-th ecosystem service function, and V C f k is the f-th ecological value coefficient of land-use type k (RMB·km−2·a−1). Owing to the advantages of using the 1 km grid [43], the above ESV calculations were combined with a 1 km grid for spatialization. Finally, the 1 km grid data for the ESVs of Dongting Lake Basin were obtained, which was used to analyze the spatio-temporal changes of ESVs and to compare with an analysis results of land-use changes through spatial analysis function of ArcGIS 10.4 to explore the driving mechanism of ESV changes.

2.3.3. Principal Component Analysis

Principal component analysis (PCA) is a class of mathematical statistical means to remove data redundancy by transforming the relevant multivariate spatial data into a few unrelated comprehensive indicators through the rotation of the original spatial axis to simplify the data structure [44]. Based on the principle of variance maximization, PCA can use as few principal components as possible to replace the original index while retaining as much information of it as possible, simplifying the complex problem. Through PCA, the information is concentrated into the first few principal components, usually with a cumulative contribution rate above 95%, which can be used as representatives to reflect the original information. In this study, the PCA is used to explore and identify the main drive factors to the spatial differences of ESVs with IBM SPSS 23.0.

3. Results and analysis

3.1. Land-Use Change

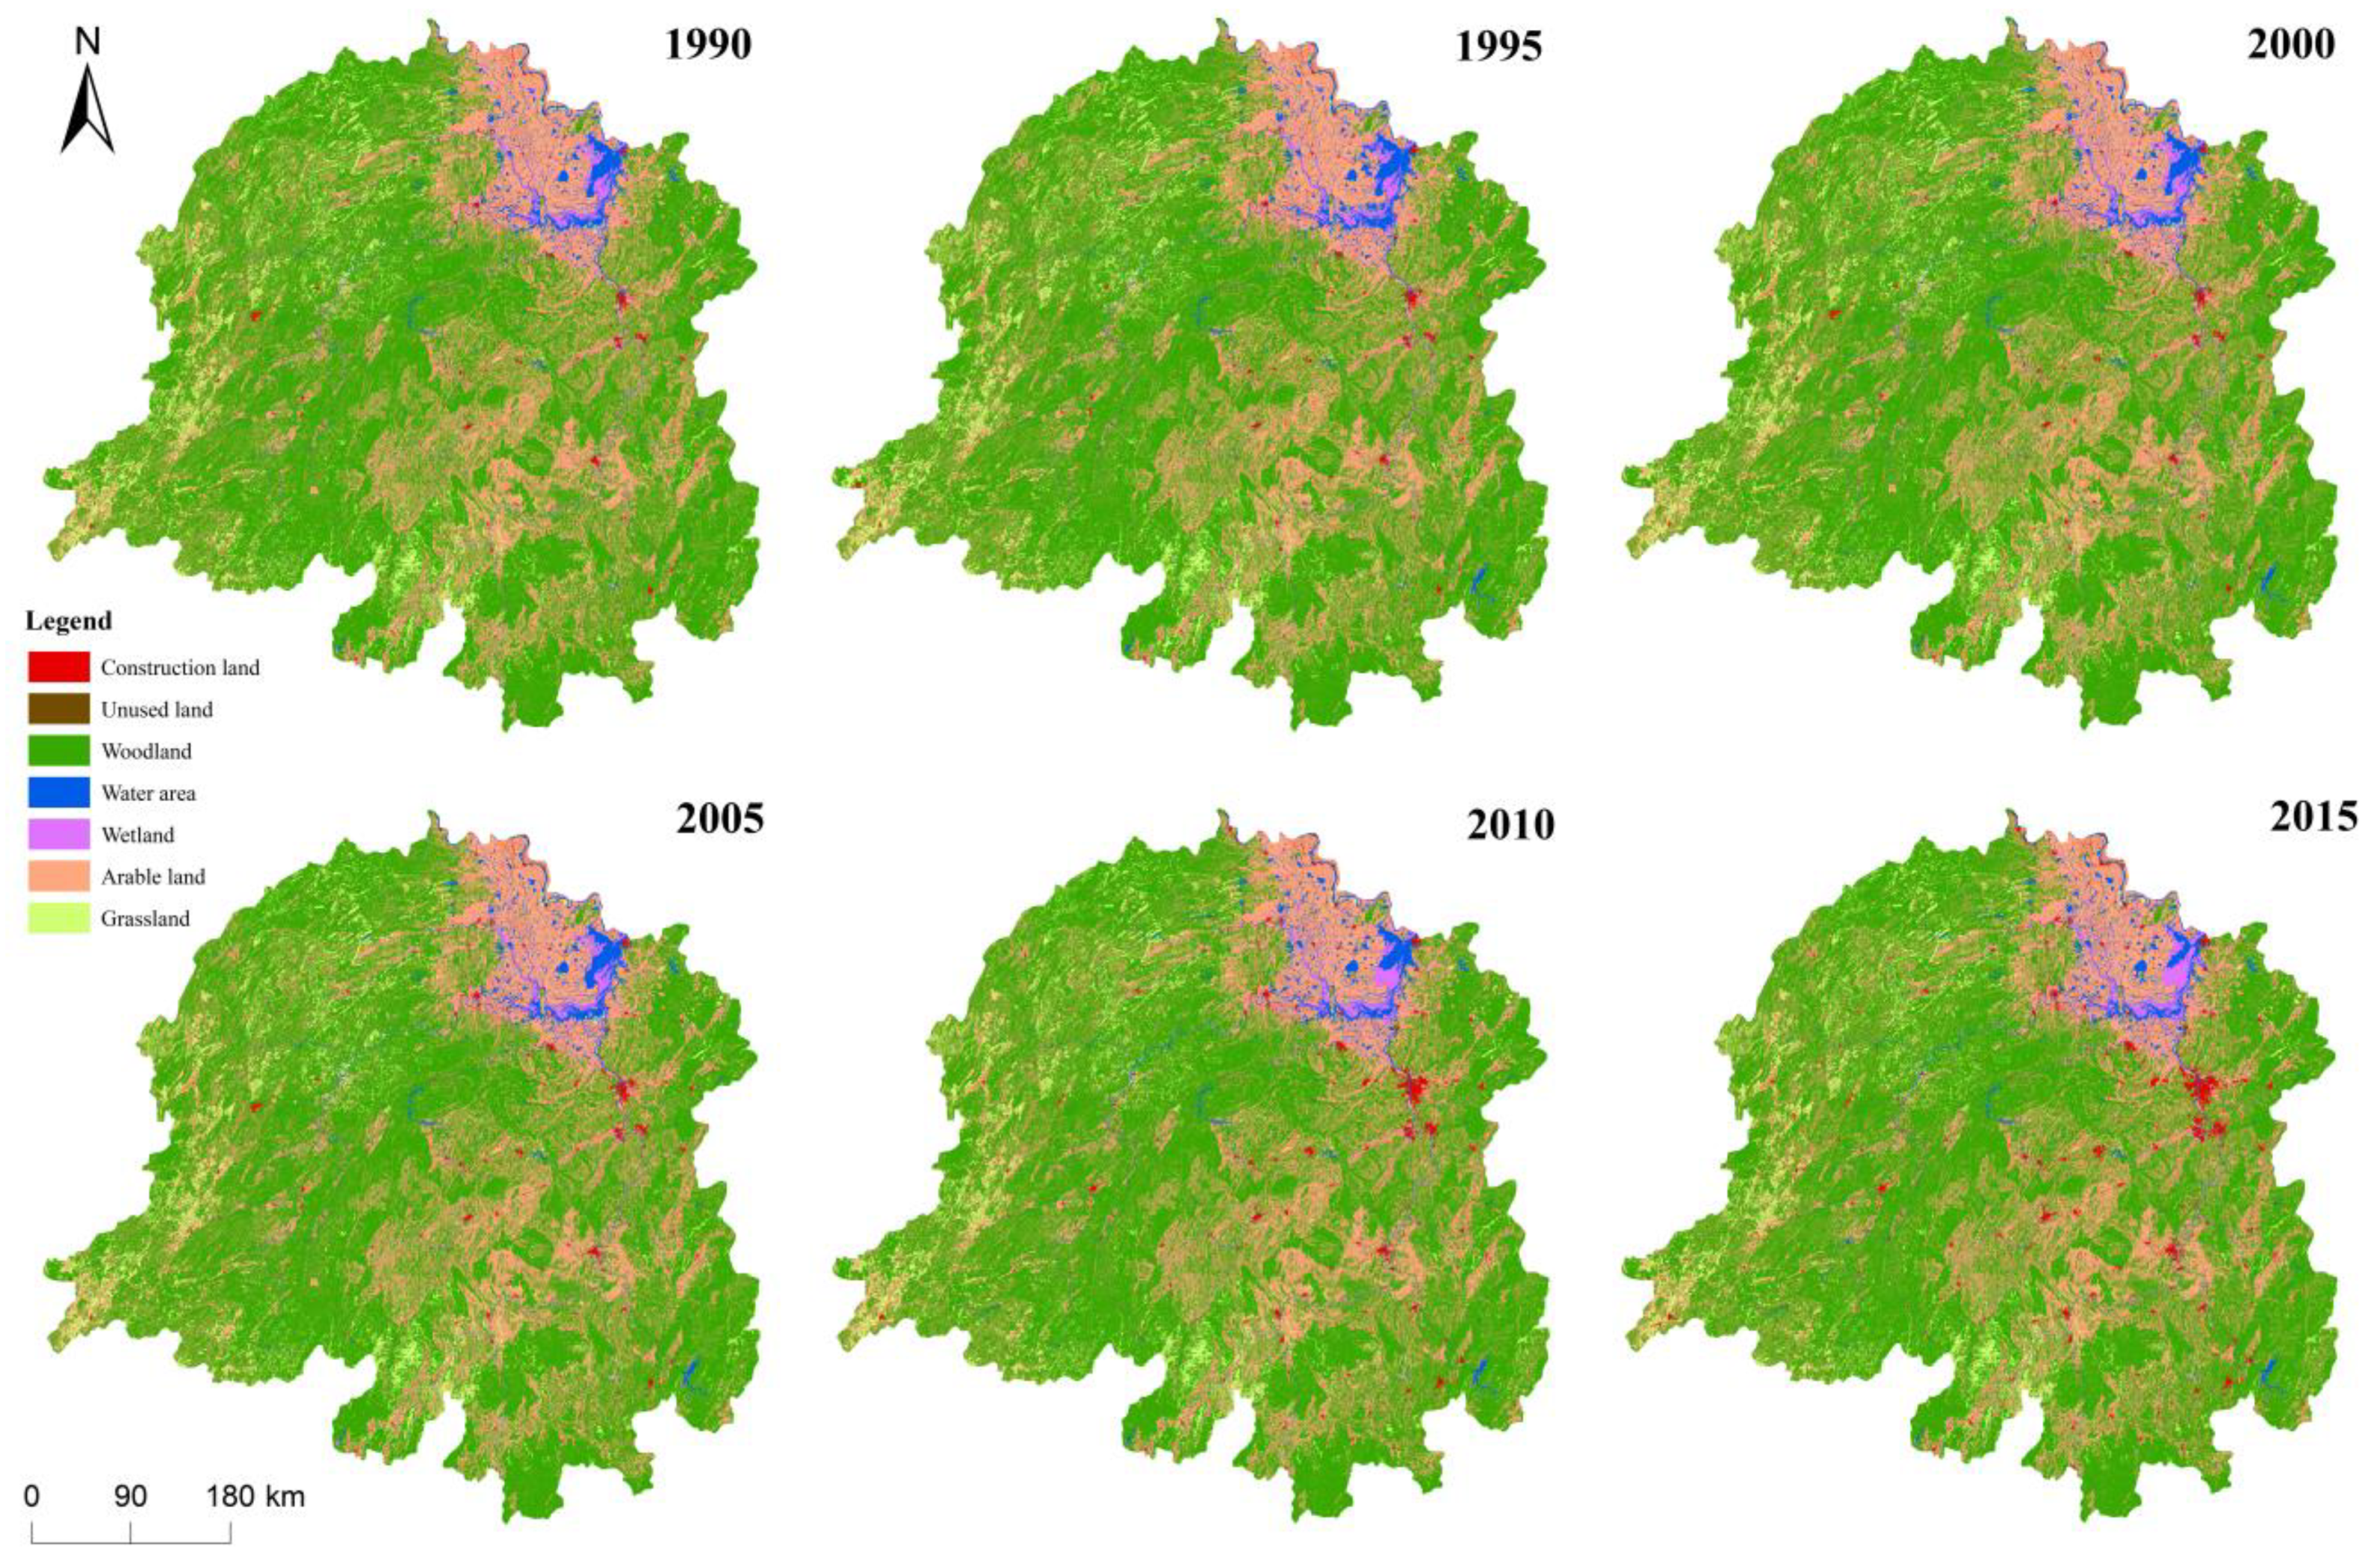
3.1.1. Spatio-Temporal Analysis

Damages to the ecosystem functions of land caused by LUCC is the main reason for regional ecological and environmental effects [45,46]. The results were divided into time-series and spatial-series analyses. The time-series analysis (Table 3) showed a decrease in the area of arable land, forest land, and grassland in the basin. Among these, the area of arable land decreased the most (0.88%). The areas of construction land, water area, and wetlands increased, where construction land had the largest increase (1.23%). As the proportion of unused land was only 0.1% of the area, it was calculated without a specific analysis. Based on the spatial-series analysis (Figure 2), forest land was found to be the main land type in Dongting Lake Basin, with an area proportion of more than 60%. Forest land was widely distributed and concentrated in the hilly and mountainous areas to the west and south of the study area. The distribution of arable land was relatively concentrated, mainly in the hinterland plains in the middle of the study area and the plains near Dongting Lake in the northeast. Grassland was mainly distributed in the mountainous areas of the west, northwest, and southwest. The vast and mixed water system was distributed throughout the basin; the largest water body was Dongting Lake in the northeast. Compared with the other land types, construction land was relatively scattered; the trend of outward expansion was relatively notable. Large patches were mainly concentrated in the eastern and central areas of the basin.

3.1.2. Land-Use Transfer Matrix Analysis

The land-use transfer matrix can quantitatively analyze important information such as the direction and speed of changes in each land-use type, which is conducive to further understanding the mechanism of land-use change. Combined with the land cover dynamic index (Formulas (4) and (5)), the land-use transfer matrix was calculated based on land-use data from 1990 to 2015 (Table 4, Figure 3), which characterizes the changed laws of land-use more effectively. The results showed that arable land was mainly transferred out, with the largest area being transferred to construction land, followed by forest land, and compared to spatial distribution, the reduced area of arable is closed to urban areas, especially Changsha, Zhuzhou and Xiangtan (Figure 3a). Forest land was also mainly transferred out with an LCDI degree of −0.01%; the area converted to construction land was also the largest, followed by that converted to arable land; in spatial, as shown in Figure 3b, the eastern cities, such as Yiyang, Yueyang, Changsha, Zhuzhou, Xiangtan, Loudi, Shaoyang, and Hengyang, have many reduced areas of forest land, and many western cities, like Zhangjiajie, Xiangxi, Huaihua and so on, have many increased areas, so the differences between east and west changes in forest land are more obvious. In a word, during the study period, the forest and arable land were transformed into each other; meanwhile, the transfer to construction land was always prominent, mainly in the suburbs and adjoining areas. The grassland was mainly transferred out with an LCDI degree of −0.28%, indicating the fastest decrease, and the areas with a significant decrease were mainly in the western regions (Figure 3c), such as Huaihua and Zhangjiajie. The water area and wetland were mainly transformed into each other; part of the area was converted to arable land, especially in the Dongting Lake area, which is closely related to agricultural economic development (Figure 3d,e). The trend of external expansion of construction land was obvious based on the central urban area of each city (Figure 3f), and it was mainly transferred in with an LCDI degree of 4.28%, having the fastest increased speed with an BLCDI degree of 4.79%. The increase in construction land was significantly greater in the eastern part of the study area than in the western part. The reasons for this include the influence of the topography—high west and low east—and the differences in economic development between the east and west. Overall, the forest land and arable land transform to each other comparably from 1990 to 2015 and both also transferred out as construction land with a larger area. Grassland was transferred out at the highest rate, and water areas and wetlands were transformed into each other. The expansion of construction land was obvious and had the fastest conversion speed.

3.2. Analysis of ESV of the Dongting Lake Basin

Although the overall land-use changes in Dongting Lake Basin were not significant during the time-series, the spatial differences were substantial. It is worth noting that land-use changes can only indirectly reflect certain mechanisms of change in the ecological environment of a basin; the ESV best reflects the final response result. The ESV is one of the most important means to quantitatively analyze the service functions of regional ecosystems and is a relatively mature technique. Thus, this study evaluated the changes in the ecosystem functions of the basin at two levels: the overall ESV and individual ESV.

3.2.1. Time Change Characteristics of the Total ESV

We combined Formula (4) with land-use data to calculate the ESV of Dongting Lake Basin (Table 5). The results showed that the total ESV of Dongting Lake Basin presented an initial increase followed by an overall decrease, in which the ESV reached its maximum in 2010 while the minimum was in 2015 and the changing amplitude of ESV between 2010 and 2015 was the largest. Compared with the ESV of various land-use types, the total ESV of arable land and forest land accounted for approximately 90% of that of the entire basin. Thus, these were the main bodies supporting the ecosystem services of Dongting Lake Basin. During the study period, the ESV of arable land, forest land, and grassland decreased to varying degrees, which was consistent with the corresponding changes in the land-use area; the ESV of grassland had the largest reduction. The water areas and wetlands accounted for only 3.5% of the study area, but their ESVs accounted for over 10% of the total, and compensated for the loss in the ESV caused by reductions in the arable land, forest land, and grassland. Since the implementation of the Program to Return Farmland to Forests in 2000, the ESV of arable land has decreased and the ESV of woodland has partially increased to a certain degree. Moreover, except for grassland, the ESVs of the water areas and wetlands have also significantly increase, especially wetlands, which had the largest increase (17.42%). Overall, the ESV of the basin decreased; in the other words, in terms of the time-series, land-use changes in the basin were not conducive to the maintenance of the ecological service function and ESV.

3.2.2. Spatial Pattern Characteristics of ESV

Based on Formula (4), a 1 km grid was used to spatialize the ESV of the Dongting Lake Basin, and the ESV of each period from 1990 to 2015 was averaged to obtain the average distribution across the study area. Combined with the natural break point method, the ESV of the Dongting Lake Basin was divided into five levels: the low value area (0–3.72 × 10⁶ RMB), lower value area (3.72 × 10⁶–5.58 × 10⁶ RMB), medium value area (5.58 × 10⁶–7.73 × 10⁶ RMB), higher value area (7.73 × 10⁶–11.28 × 10⁶ RMB), and high value area (11.28 × 10⁶–14.38 × 10⁶ RMB) (Table 2, Figure 4). The contribution of different land-use types to the regional ESVs varied significantly. The ESV-equivalent coefficients of the water areas and wetlands were relatively large and the ESVs were notably higher, thus indicating that these are high-value areas. The ESV-equivalent coefficient of construction land was small and the ESV was low, indicating a low-value area. The ESV-equivalent coefficient of arable land was slightly higher than that of construction land, indicating a lower value area. The ESV-equivalent coefficient of forest land and grassland was intermediate between that of water and arable land, and the coverage was wide, indicating a generally higher value area. Overall, the areas to the northeast of the basin near Dongting Lake, southwestern areas, and central urban areas of various cities had low ESVs. The mountainous areas to the west of the middle of the basin, the northwestern and southeastern margins, and the lake areas such as Dongting Lake had relatively high ESVs. The spatial difference of total ESV may be closely related to the topography and regional economic development level. In general, farmland and construction land are located in plain areas, which often have lower ESVs due to smaller ESV-equivalent coefficients. At the same time, forest land and grassland are often in mountainous areas, such that these areas generate higher ESVs with larger ESV-equivalent coefficients. Moreover, the expansion of construction land has direct links to the regional economic development level, i.e., the more developed the regional economy, the lower the regional ESV. In the study area, the development level of cities surrounding Dongting Lake is better than other cities, especially the western cities, and the ESVs of these areas are relatively low. Thus, we need to consider more the ESV promotion in these developed cities or region.

3.2.3. Temporal and Spatial Changes in Individual ESVs

Temporal Characteristics of Individual Ecological Services

According to Formula (5), the value of individual ecological services can be calculated, as listed in Table 6. From the perspective of the value of an individual ecological service, soil formation and protection, water conservation, gas exchange, climate regulation, and biodiversity protection were the main ESVs of the basin, where the sum of the proportions exceeded 70% of the total value. The contributions of food production, entertainment, and leisure were small, whose sum was less than 10%. From 1990 to 2015, the value of the ecological services increased in functions such as climate regulation, water conservation, waste treatment, and entertainment, among which the greatest increase was in the water conservation function (0.16%), followed by waste treatment (0.12%). Since the large flood in 1998, the ecological function of Dongting Lake has received increasing attention. The protection of water resources in the lake area has continuously increased, and various lake and wetland resources have been repaired and protected by policies, especially the implementation of the Program to Return Farmland to Forests in 2000 and Rural Environmental Remediation, which effectively promoted the function of water conservation and waste treatment. The ESVs decreased mainly in functions such as gas exchange, soil formation and protection, biodiversity protection, food production, and raw materials. Among these, the greatest decrease was in soil formation and protection (−0.15%), followed by gas exchange (−0.07%). This was mainly because the area of arable land and grassland—both with higher contributions to the two functions—had been significantly reduced, whereas construction land, with a lower contribution to the functions, had increased rapidly and could not effectively supplement the loss of its functional value. Moreover, the majority of the Dongting Lake Basin belong to the red soil region, and in recent years, frequent extreme climate events and an increased rainfall intensity have also reduced the soil protection function of soil formation to some extent. In a word, the service function of the basin ecosystem was higher than the productive function. At the same time, the value of the productive function showed a downward trend.

Spatial Variation of the Value of Individual Ecological Services

The value of each ecological service was significantly different from the spatial distribution (Figure 5). For gas exchange (Figure 5a), the high-value region of its ESV was mainly located in mountainous areas and closely associated with woodlands. For climatic regulation and headwaters conservation (Figure 5b,c), the high-value region was in Dongting Lake and its hydrographic net, respectively, which are affected by the water area. For soil formation and protection (Figure 5d), most of the high-value regions were located in woodlands. In waste disposal (Figure 5e), the high-value regions were also influenced by water bodies. For biodiversity protection (Figure 5f), the high-value regions were mainly distributed in woodlands and at the Dongting Lake, while the low-value regions were located on construction land and farmland. Farmland had the most significant effect on food production within the low-value regions located (Figure 5g). The ESVs of raw material were also dominated by woodlands (Figure 5h). Entertainment (Figure 5i), which mainly refers to providing opportunities for recreational, cultural, and artistic values, was affected by water areas and wetlands with high-value regions in the Dongting Lake region.
In general, water areas contributed the most to the ecological service function of water conservation, followed by wetlands. Simultaneously, water areas and wetlands also significantly contributed to waste treatment, climate regulation, and entertainment, ultimately leading to a correspondingly higher ESV with significant differences in the spatial distribution. Arable land contributed most to the food production ecological service function, and the unit value was considerably higher than that of the other land-use types. The ESVs of raw materials, biodiversity protection, and gas exchange were generally higher in forest land and were significantly lower in arable land and construction land. Therefore, differences in the spatial distribution of the value of individual ecological services were markedly related to the land-use type. The increase in construction land was the main factor associated with the increase in the spatial distribution of the ESVs, such as soil formation, raw materials, biodiversity protection, and gas exchange.

3.3. The Exploration of Drive Factors

Although the land-use patterns and changes have a decisive driving process for the ESVs in the study area, in a fundamental sense, the spatial difference of ESVs was the result of a comprehensive effect of natural and human activities. Therefore, based on data accessibility and spatialization, this study attempted to use the principal component analysis (PCA) method and to select relevant drivers from the scope of nature and social economy to further explore the drivers and mechanisms that caused the spatial differences in the ESVs.
We divided the factors into two categories: natural factors and socio-economic factors. Based on the typicality and comprehensiveness of the factors, the natural factors were the DEM, rainfall, and temperature, whereas the socio-economic factors were the population, GDP, and the output values of primary and secondary industries (Table 7). The average value of each factor for a total of six periods from 1990 to 2015 was calculated using the county as a unit. The spatial differences in the ESVs driving the natural and socio-economic factors were explored using the principal component factor method and regression analysis. The multiple regression model was as follows:
Y = 2.057 × 10 15 0.416 F 1 0.168 F 2 + 0.101 F 3     ( R 2 = 0.211 ,   P < 0.05 )
where Y represents the ESV after standardization, and F 1 , F 2 , and F 3 represent the three principal component factors extracted by PCA after the standardization of each factor. The cumulative contribution rate was 89.43%. Combined, the regression model and PCA (Table 7) showed that principal component F1 reflected the GDP, population, secondary and tertiary industries, per capita income, retail of social goods, and fiscal expenditure, among others; in other words, socio-economic information was more prominent. The coefficient of F 1 was negative, indicating that the social factors had a negative correlation with the ESV. Principal component F 2 reflected information regarding the output of the primary industry and agricultural products, characterized by a negative correlation with the ESV. Principal component F3 reflected information regarding natural factors, such as the temperature, DEM, and rainfall. The temperature and rainfall had a negative correlation with the ESV, whereas the DEM had a positive correlation. In conclusion, the socio-economic factors exerted more effects on the ESVs of Dongting Lake Basin than the natural factors.

4. Discussion

The Dongting Lake basin covers a wide area, and its ecological service function is of great significance to the whole middle and upper reaches of the Yangtze River. This study used a 1 km grid to conduct spatial quantitative research on the ESV of the Dongting Lake basin, which was conducive to explore the fundamental driving forces and to identify the weak area of ecological service function in the Dongting Lake Basin, having important reference significance for realizing watershed management and sustainable development.

4.1. The Determination of Evaluation Method and the Comparison of the Results

In fact, it is difficult to unify the results with so many evaluation methods of ESVs. Currently, the spatialized estimation methods of ESVs can be roughly divided into two categories: a “material quantitative method” and “equivalent factor method”. The material quantitative method is that the total value is derived from the material amount of ecosystem services and the unit price based on it. Through this method, a simulation of ecosystem service functions in study areas was performed by establishing production equations between a single service function and local eco-environmental variables. The method requires more parameters with a complex computational process, and the evaluation method and parameter criteria for each type of ESV are also difficult to unify. For example, Kong et al. (2019) evaluated five ecological service functions in the Dongting Lake catchment, namely water conservation, soil conservation, carbon fixation, flood regulation and biodiversity protection, and put forward suggestions for protection and restoration [25]. Ma et al. (2019) estimated the material amount of water yield, soil conservation, carbon storage and schistosomiasis prevention of Dongting Lake wetland, and valued them through the unit price [47]. Liu et al. (2019) evaluated the water conservation function in the upper reaches of the Minjiang River, and estimated its ecological service value by a market value method [48]. The equivalent factor method is a method to construct the value equivalent of various ecosystem service functions based on distinguishing different types of ecosystem service functions, and then evaluates them combined with the distribution area of each ecosystem. Compared with the material quantitative method, the equivalent factor method is applied widely due to the intuitive and small amount of the data required, and it is particularly suitable for the ESV evaluation at the regional and global scale [39,40]. Therefore, the equivalent factor method was chosen to evaluate the ESVs in this study. Obviously, even in the same region, the results are diverse and not comparable due to different methods. While comparing them with the results of the regions contained within the watershed by the same method, such as the evaluation results of ESVs in Hunan Province conducted by Xiong et al. (2018) [49] and the results of the Dongting Lake wetland studied by Deng et al. (2019) [50], the results of this study were small and the main reason for this was because the study revised per unit area yield with the area occupied by multiple provinces, which were relatively small, so the ESV of the whole basin is relatively low. Still, the changed laws of ESVs in the corresponding region are consistent, which was conducive to grasp the changed laws of ecological service function in local regions or to identify the weakened areas.

4.2. The ESV at the County Scale

In order to further explore the changed laws of the ESV in local regions, this study calculated the ESV in each county by spatial statistical analysis of ArcGIS 10.4, as shown in Figure 6. At the county scale, the counties within the Dongting Lake had the highest ESV, owing to influences from lakes and wetlands. Among the four major sub-basins, the ESVs of the counties adjacent to the Xiangjiang River Basin were relatively low, whereas those of counties adjacent to the Yuanjiang River were significantly higher. There were two reasons for this dichotomy. First, the topography of the Xiangjiang River Basin is lower than that of the Yuanjiang River Basin. Second, the Xiangjiang River flows through the central urban areas of many cities, such as Changsha and Zhuzhou, among others. These areas are economically developed, densely populated, and subject to a considerable interference from human activity. Therefore, we must focus on the protection and restoration of the ecological system in and around the Xiangjiang River Basin, especially in cities located in the upstream area. We must also strengthen the protection and restoration of high-ESV areas, such as wetlands, water areas, and forest lands, maintain and strengthen the continuity and integrity of ecosystem patterns, and guide the development of land-use in the direction of ESV preservation or appreciation.

4.3. Limitations of the Study

In this study, the factors selection is not enough and perfect due to the fact it only considers the availability of data. Thereinto, natural factors, such as evaporation and wind speed, need to be added in and social-economic factors can also include policy factors such as returning the farmland to forest land. Meanwhile, although the principal component analysis was used to preliminarily explore the driving factors of the ESV in the study area, the analysis of the internal driving mechanism process was far from enough, and at least the in-depth analysis of the social-economic factors was required, which also was closely related to the availability of other types of data. Moreover, the R2 was not sufficiently large enough, at only 0.211, possibly because the Dongting Lake Basin is too large. Thus, further subregional analyses on the Dongting Lake Basin should be performed in future research.

5. Conclusions

The Dongting Lake Basin is one of the most important sub-basins in the middle reaches of the Yangtze River. The ecological services of water conservation, biodiversity protection, food production, and other functions are highly important for regional development. In this study, we used land-use data from 1990 to 2015 and combined it with an ESV-equivalent exchange algorithm to analyze the temporal and spatial changes in the land use and ESVs in the Dongting Lake Basin. The results of this study can be a great reference point and could guide significance for watershed management, regional planning, and river basin ecological service function improvement of Dongting Lake Basin. The main conclusions are as follows:
(1)
Apart from construction land, the land-use changes in the Dongting Lake Basin did not show significant changes in other land-use types. The main land-use type in the basin was forest land, with an area proportion of ≥ 60%. Construction land had the largest increase at 1.23%, with a notable trend of outward expansion. The area of arable land decreased the most, at only 0.88%.
(2)
During the study period, the conversions of various land types were markedly different. Forest and arable land were transformed into each other with comparable area proportions. Construction land occupied most of the share of forest and arable lands that were transferred out, resulting in a change in these two land-use types. A large area of grassland was transformed to forest and arable land, which was characterized by a rapid conversion speed. Water areas and wetlands were mainly transformed in. Construction land was mainly transformed in with the fastest conversion speed.
(3)
The overall ESV of the basin first increased and then decreased. However, the magnitude of the change was small. Forest and arable lands have continuously supported the ecosystem services of the Dongting Lake Basin, but there was a small reduction (to varying degrees) during the study period. The ESVs of the water areas and wetlands increased significantly, partially compensating for the overall ESV loss. In terms of the spatial distribution, the ESV was higher in areas adjacent to wetlands and water areas and were lower in areas adjacent to construction and arable lands. The ESV differentiation was notable.
(4)
The main ecological service functions included soil formation and protection, water conservation, gas exchange, climate regulation, and biodiversity protection. The value of the ecological service functions was generally greater than that of the productive functions. The differences in the distribution of various ESVs were closely related to the land-use types. The increase in construction land was the main factor driving the increase in the spatial distribution of the ecological service functions, such as soil formation, raw materials, biodiversity protection, and gas exchange.
In this study, land-use data based on a Landsat data source has great advantages in spatial resolution, but the time resolution is poor. In the future, it is necessary to monitor the ecological service value of the basin from a higher temporal resolution, to dynamically grasp the ecological environmental changes of the Dongting Lake basin.

Author Contributions

Nan Yang devised the idea and wrote the paper; Wenbo Mo performed the analysis; Maohuang Li, Xian Zhang and Min Chen conducted the data processing; Feng Li and Wanchao Gao helped in data collection. All authors have read and agreed to the published version of the manuscript.

Funding

This research was sponsored by Hunan Provincial Key Research and Development Plan (2019SK2336), Hunan Provincial Hi-tech Industry Science and Technology Innovation Leading Plan (2020SK2019), National Sustainable Development Agenda Innovation Demonstration Zone Construction projects (2019SFQ21), Hunan Provincial Water Science and Technology Project (XSKJ2019081-31), the Joint Fund for Regional Innovation and Development of NSFC (U19A2051), the Youth Innovation Promotion Association of CAS (Y201861), the Water Conservancy Science Project of Hunan Province (XSKJ2021000-03) and Postgraduate Scientific Research Innovation Project of Hunan Province (CX20210861).

Institutional Review Board Statement

Not applicable.

Informed Consent Statement

Not applicable.

Data Availability Statement

The data presented in this study are available from the first author (N.Y.) on reasonable request.

Acknowledgments

The authors would like to thank the Institute of Subtropical Agriculture, Chinese Academy of Sciences for the support of the relevant data.

Conflicts of Interest

The authors declare no conflict of interest.

References

  1. Ma, K.; Huang, X.R.; Liang, C.; Zhao, H.B.; Zhou, X.Y.; Wei, X.Y. Effect of land use/cover changes on runoff in the Min River watershed. River Res. Appl. 2020, 36, 749–759. [Google Scholar] [CrossRef]
  2. Mo, W.B.; Wang, Y.; Zhang, Y.X.; Zhuang, D.F. Impacts of road network expansion on landscape ecological risk in a megacity, China: A case study of Beijing. Sci. Total Environ. 2017, 574, 1000–1011. [Google Scholar] [CrossRef] [PubMed]
  3. Kim, I.; Arnhold, S.; Ahn, S.; Le, Q.B.; Kim, S.J.; Park, S.J.; Koellner, T. Land use change and ecosystem services in mountainous watersheds: Predicting the consequences of environmental policies with cellular automata and hydrological modeling. Environ. Modell. Softw. 2019, 122, 103982. [Google Scholar] [CrossRef]
  4. Chen, S.R.; Feng, Y.J.; Tong, X.H.; Liu, S.; Xie, H.; Gao, C.; Lei, Z.K. Modeling ESV losses caused by urban expansion using cellular automata and geographically weighted regression. Sci. Total Environ. 2020, 712, 136509. [Google Scholar] [CrossRef]
  5. Yushanjiang, A.; Zhang, F.; Yu, H.Y.; Kung, H. Quantifying the spatial correlations between landscape pattern and ecosystem service value: A case study in Ebinur Lake Basin, Xinjiang, China. Ecol. Eng. 2018, 113, 94–104. [Google Scholar] [CrossRef]
  6. Luo, Q.; Zhou, J.; Li, Z.; Yu, B. Spatial differences of ecosystem services and their driving factors: A comparation analysis among three urban agglomerations in China’s Yangtze River Economic Belt. Sci. Total Environ. 2020, 725, 138452. [Google Scholar] [CrossRef]
  7. Tae, G.K.; Choi, K.S. A study on water quality change by land use change using HSPF. Environ. Eng. Res. 2020, 25, 123–128. [Google Scholar]
  8. Shahid, L.; Firuza, M. Parametric Vine Copula Construction for Flood Analysis for Kelantan River Basin in Malaysia. Civil. Eng. J. 2020, 6, 1470–1491. [Google Scholar]
  9. Negasi, S.; Segnon, A.C.; Birhane, E. Ecosystem Service Values Changes in Response to Land-Use/Land-Cover Dynamics in Dry Afromontane Forest in Northern Ethiopia. Int. J. Environ. Res. Public Health 2019, 16, 4653. [Google Scholar]
  10. Yao, H.; Liu, H.; Ni, T.H. Estimation of the Value of Aquatic Ecosystem Services in the Coastal Area of Jiangsu Province, China. Integr. Environ. Asses. 2019, 15, 1012–1020. [Google Scholar] [CrossRef] [PubMed]
  11. Zalasiewicz, J.; Williams, M.; Steffen, W.; Crutzen, P. The new world of the anthropocene. Environ. Sci. Technol. 2010, 44, 2228–2231. [Google Scholar] [CrossRef]
  12. Karen, C.S.; Michail, F.; Burak, G.; Michael, K.R. A meta-analysis of global urban land expansion. PLoS ONE 2011, 6, e23777. [Google Scholar]
  13. Zhai, J.; Sun, X.Y.; Liu, F.; Shan, R.F.; Zhang, W.J. Spatio-temporal variation of land use and ecosystem service values and their impact factors in an urbanized agricultural basin since the reform and opening of China. Environ. Monit. Assess. 2019, 191, 1–14. [Google Scholar]
  14. Nayak, A.K.; Shahid, M.; Nayak, A.D.; Dhal, B.; Moharana, K.C.; Mondal, B.; Tripathi, R.; Mohapatra, S.D.; Bhattacharyya, P.; Jambhulkar, N.N.; et al. Assessment of ecosystem services of rice farms in eastern India. Ecol. Process. 2019, 8, 1–16. [Google Scholar] [CrossRef]
  15. Huang, A.; Xu, Y.Q.; Sun, P.L.; Zhou, G.Y.; Liu, C.; Lu, L.H.; Xiang, Y.; Wang, H. Land use/land cover changes and its impact on ecosystem services in ecologically fragile zone: A case study of Zhangjiakou City, Hebei Province, China. Ecol. Indic. 2019, 104, 604–614. [Google Scholar] [CrossRef]
  16. Cao, S.X.; Zhang, J.Z.; Su, W. Difference in the net value of ecological services between natural and artificial forests in China. Conserv. Biol. 2019, 33, 1076–1083. [Google Scholar] [CrossRef]
  17. Hu, M.M.; Li, Z.T.; Wang, Y.F.; Jiao, M.Y.; Li, M.; Xia, B.C. Spatio-temporal changes in ecosystem service value in response to land-use/cover changes in the Pearl River Delta. Resour. Conserv. Recycl. 2019, 149, 106–114. [Google Scholar] [CrossRef]
  18. Zhao, X.D.; He, Y.J.; Yu, C.; Xu, D.Y.; Zou, W.T. Assessment of Ecosystem Services Value in a National Park Pilot. Sustainability 2019, 11, 6609. [Google Scholar] [CrossRef]
  19. Geng, J.X.; Liang, C.Z. Analysis of the Internal Relationship between Ecological Value and Economic Value Based on the Forest Resources in China. Sustainability 2021, 13, 6795. [Google Scholar] [CrossRef]
  20. Thapa, S.; Wang, L.H.; Koirala, A.; Shrestha, S.; Bhattarai, S.; Nye, W.N. Valuation of Ecosystem Services from an Important Wetland of Nepal: A Study from Begnas Watershed System. Wetlands 2020, 40, 1071–1083. [Google Scholar] [CrossRef]
  21. Sun, C.Z.; Wang, Y.Y.; Zou, W. The marine ecosystem services values for China based on the emergy analysis method. Ocean. Coast. Manag. 2018, 161, 66–73. [Google Scholar] [CrossRef]
  22. Mo, W.B.; Zhao, Y.L.; Yang, N.; Xu, Z.G.; Zhao, W.P.; Li, F. Effects of Climate and Land Use/Land Cover Changes on Water Yield Services in the Dongjiang Lake Basin. ISPRS. Int. J. Geo-Inf. 2021, 10, 466. [Google Scholar] [CrossRef]
  23. Xie, G.D.; Lu, C.X.; Leng, Y.F.; Zheng, D.; Li, S.C. Ecological assets valuation of the Tibetan Plateau. J. Nat. Resour. 2003, 18, 189–196. (In Chinese) [Google Scholar]
  24. Yuan, B.D.; Fu, L.N.; Zou, Y.A.; Zhang, S.Q.; Chen, X.S.; Li, F.; Deng, Z.M.; Xie, Y.H. Spatiotemporal change detection of ecological quality and the associated affecting factors in Dongting Lake Basin, based on RSEI. J. Clean. Prod. 2021, 302, 126995. [Google Scholar] [CrossRef]
  25. Kong, L.Q.; Zheng, H.; Ouyang, Z.Y. Ecological protection and restoration of forest, wetland, grassland and cropland based on the perspective of ecosystem services: A case study in Dongting Lake Watershed. Acta Ecol. Sin. 2019, 39, 8903–8910. (In Chinese) [Google Scholar]
  26. Wu, Y.B.; Xue, L.Q.; Liu, Y.H. Local and regional flood frequency analysis based on hierarchical Bayesian model in Dongting Lake Basin, China. Water Sci. Eng. 2019, 12, 253–262. [Google Scholar] [CrossRef]
  27. Zhang, Y.; Liu, C.M.; Liu, X.J.; Xu, X.; Wen, Z. Atmospheric nitrogen deposition around the Dongting Lake, China. Atmos. Environ. 2019, 207, 197–204. [Google Scholar] [CrossRef]
  28. Yin, G.Y.; Liu, L.M.; Jiang, X.L. The sustainable arable land use pattern under the tradeoff of agricultural production, economic development, and ecological protection—an analysis of Dongting Lake basin, China. Environ. Sci. Pollut. Res. 2017, 24, 25329–25345. [Google Scholar] [CrossRef]
  29. Zhang, J.H.; Feng, Z.M.; Jiang, L.G. Progress on Studies of Land Use/Land Cover Classification Systems. Resour. Sci. 2011, 33, 1195–1203. (In Chinese) [Google Scholar]
  30. Chen, W.X.; Zhao, H.B.; Li, J.F.; Zhu, L.J.; Wang, Z.Y.; Zeng, J. Land use transitions and the associated impacts on ecosystem services in the Middle Reaches of the Yangtze River Economic Belt in China based on the geo-informatic Tupu method. Sci. Total Environ. 2020, 701, 134690. [Google Scholar] [CrossRef] [PubMed]
  31. Han, X.J.; Yu, J.L.; Shi, L.N.; Zhao, X.C.; Wang, J.J. Spatiotemporal evolution of ecosystem service values in an area dominated by vegetation restoration: Quantification and mechanisms. Ecol. Indic. 2020, 131, 108191. [Google Scholar] [CrossRef]
  32. Ning, J.; Liu, J.Y.; Kuang, W.H.; Xu, X.L.; Zhang, S.W.; Yan, C.Z.; Li, R.D.; Wu, S.X.; Hu, Y.F.; Du, G.M.; et al. Spatiotemporal patterns and characteristics of land-use change in China during 2010–2015. J. Geogr. Sci. 2018, 28, 547–562. [Google Scholar] [CrossRef]
  33. Zhang, Y.Y.; Xia, J.; Yu, J.J.; Randall, M.; Zhang, Y.C.; Zhao, T.T.G.; Pan, X.Y.; Zhai, X.Y.; Shao, Q.X. Simulation and assessment of urbanization impacts on runoff metrics: Insights from landuse changes. J. Hydrol. 2020, 560, 247–258. [Google Scholar] [CrossRef]
  34. González-Moradas, M.D.R.; Viveen, W. Evaluation of ASTER GDEM2, SRTMv3. 0, ALOS AW3D30 and TanDEM-X DEMs for the Peruvian Andes against highly accurate GNSS ground control points and geomorphological-hydrological metrics. Remote Sens. Environ. 2020, 237, 111509. [Google Scholar] [CrossRef]
  35. Zhao, S.M.; Qi, D.N.; Li, R.P.; Cheng, W.M.; Zhou, C.H. Performance comparison among typical open global DEM datasets in the Fenhe River Basin of China. Eur. J. Remote Sens. 2021, 54, 145–157. [Google Scholar] [CrossRef]
  36. Mouratidis, A.; Ampatzidis, D. European Digital Elevation Model Validation against Extensive Global Navigation Satellite Systems Data and Comparison with SRTM DEM and ASTER GDEM in Central Macedonia (Greece). ISPRS Int. J. Geo-Inf. 2019, 8, 108. [Google Scholar] [CrossRef]
  37. Ji, W.; Wang, Y.; Zhuang, D.F.; Song, D.P.; Shen, X.; Wang, W.; Li, G. Spatial and temporal distribution of expressway and its relationships to land cover and population: A case study of Beijing, China. Transp. Res. Part D Transp. Environ. 2014, 32, 86–96. [Google Scholar] [CrossRef]
  38. Liu, J.Y.; Zhang, Z.X.; Xu, X.L.; Kuang, W.H.; Zhou, W.C.; Zhang, S.W.; Li, R.D.; Yan, C.Z.; Yu, D.S.; Wu, S.X.; et al. Spatial patterns and driving forces of land use change in China during the early 21st century. J. Geocr. Sci. 2010, 20, 483–494. [Google Scholar] [CrossRef]
  39. Costanza, R.; D’Arge, R.; Groot, R.D.; Farber, S.; Grasso, M.; Hannon, B.; Limburg, K.; Naeem, S.; O’Neill, R.; Paruelo, J.; et al. The value of the world’s ecosystem services and natural capital. Nature 1997, 387, 253–260. [Google Scholar] [CrossRef]
  40. Gaodi, X.; Caixia, Z.; Leiming, Z.; Wenhui, C.; Shimei, L. Improvement of the evaluation method for ecosystem service value based on per unit area. J. Nat. Resour. 2015, 30, 1243–1253. (In Chinese) [Google Scholar]
  41. Liu, Y.B.; Hou, X.Y.; Li, X.W.; Song, B.Y.; Wang, C. Assessing and predicting changes in ecosystem service values based on land use/cover change in the Bohai Rim coastal zone. Ecol. Indic. 2020, 111, 106004. [Google Scholar] [CrossRef]
  42. Di, X.H.; Hou, X.Y.; Xu, X.L.; Wu, L. Study on Spatial-Temporal Characteristics of Ecosystem Service Value in Shandong Province. Geogr. Geo-Inf. Sci. 2013, 29, 116–120. (In Chinese) [Google Scholar]
  43. Wei, S.; Deng, X.Z. Land use/land cover change and ecosystem service provision in China. Sci. Total Environ. 2017, 576, 705–719. [Google Scholar]
  44. Marsboom, C.; Vrebos, D.; Staes, J.; Meire, P. Using dimension reduction PCA to identify ecosystem service bundles. Ecol. Indic. 2018, 87, 209–260. [Google Scholar] [CrossRef]
  45. Wang, Y.H.; Dai, E.F.; Yin, L.; Ma, L. Land use/land cover change and the effects on ecosystem services in the Hengduan Mountain region, China. Ecosyst. Serv. 2018, 34, 55–67. [Google Scholar] [CrossRef]
  46. Jiao, M.Y.; Hu, M.M.; Xia, B.C. Spatiotemporal dynamic simulation of land-use and landscape-pattern in the Pearl River Delta, China. Sustain. Cities Soc. 2019, 49, 101581. [Google Scholar] [CrossRef]
  47. Ma, L.; Sun, R.; Kazemi, E.; Pang, D.; Zhang, Y.; Sun, Q.; Zhou, J.; Zhang, K. Evaluation of Ecosystem Services in the Dongting Lake Wetland. Water 2019, 11, 2564. [Google Scholar] [CrossRef]
  48. Liu, J.; Fu, B.; Zhang, C.H.; Hu, Z.P.; Wang, Y.K. Assessment of Ecosystem Water Retention and Its Value in the Upper Reaches of Minjiang River Based on InVEST Model. Resour. Environ. Yangtze Basin 2019, 28, 578–585. [Google Scholar]
  49. Xiong, Y.; Zhang, F.M.; Gong, C.A.; Luo, P. Spatial-temporal Evolvement of Ecosystem Service Value in Hunan Province Based on LUCC. Resour. Environ. Yangtze Basin 2018, 27, 1398–1408. (In Chinese) [Google Scholar]
  50. Deng, C.X.; Zhong, X.L.; XIE, B.G.; Wan, Y.L.; Song, X.W. Spatial and temporal changes of land ecosystem service value in Dongting Lake area in 1995–2015. Georaphical Res. 2019, 38, 844–855. (In Chinese) [Google Scholar]
Figure 1. Location of the study area.
Ijgi 10 00716 g001
Figure 2. Land-use pattern of the Dongting Lake Basin from 1990 to 2015.
Ijgi 10 00716 g002
Figure 3. Spatial distribution of the change in each land-use type. Thereinto, (a) was the change distribution of arable land; (b) was the change distribution of woodland; (c) was the change distribution of grassland; (d) was the change distribution of water area; (e) was the change distribution of wetland; (f) was the change distribution of construction land.
Ijgi 10 00716 g003
Figure 4. The 1-km grid ESV distribution of Dongting Lake Basin.
Ijgi 10 00716 g004
Figure 5. Spatial distribution of single ESVs in the Dongting Lake Basin.
Ijgi 10 00716 g005
Figure 6. ESVs of each county.
Ijgi 10 00716 g006
Table 1. Land-use conversion matrix.
T2Pi+Reduced
A 1 A 2 A n
T 1 A 1 P 11 P 12 P 1 n P 1 + P 1 + P 11
A 2 P 12 P 22 P 2 n P 2 + P 2 + P 22
A n P n 1 P n 2 P n n P n + P n + P n n
P + j P + 1 P + 2 P + n 1
Increased P + 1 P 11 P + 2 P 22 P + n P n n
Table 2. Ecological value coefficient corresponding to the land-use type (100 RMB·km−2).
Ecological Service FunctionForestGrass LandArable LandWetlandWater AreaUnused Land
Gas exchange10617.112426.771516.735460.2300
Climate regulation8190.342730.112699.7851872.171395.390
Water conservation9707.072426.771820.0847018.6361821.9191.00
Soil formation and protection11830.495915.254428.855187.2230.3360.67
Waste disposal3973.833973.834974.8755148.3055148.3030.33
Biodiversity9889.083306.472153.767583.657553.321031.38
Food production303.34910.043033.46910.038303.3530.33
Raw materials7887.00151.67303.346212.3430.330
Entertainment3882.83121.3430.334616835.7013165.2230.33
Table 3. Changes in the area proportions of the land-use types from 1990 to 2015 (%).
199019952000200520102015Changes from 1990 to 2015
Arable land28.7628.4828.6528.5428.1727.88−0.88
Forest 61.5961.7061.5061.5561.6361.37−0.22
Grassland 5.285.345.285.154.944.90−0.38
Water area2.482.602.582.652.682.590.11
Wetland 0.730.660.720.710.740.860.13
Construction land1.151.211.261.391.822.381.23
Unused land0.010.010.010.010.010.020.01
Table 4. Land-use transfer matrix (km2).
Arable LandForest LandGrasslandWater AreaWetlandConstruction LandUnused LandTotal
Arable land70,421.871499.35101.95717.61116.071831.122.8174,690.77
Forest land1190.20156,631.36363.23307.5519.151394.8225.32159,931.64
Grassland248.251052.2812,228.1133.7139.2997.910.9813,700.52
Water area255.8496.1619.695386.96640.7851.500.176451.10
Wetland197.5412.163.81265.341403.139.401.291892.67
Construction land79.7376.146.6825.673.862794.390.232986.71
Unused land1.452.851.220.660.202.4111.9420.72
Total72,394.88159,370.3012,724.696737.492222.486181.5542.74259,674.13
LCDI−0.12%−0.01%−0.28%0.18%0.70%4.28%-------------
BLCDI0.33%0.15%0.57%1.50%2.77%4.79%-------------
Note: LCDI, land cover dynamic index; BLCDI, bilateral land cover dynamic index.
Table 5. Changes in the ESV of each ecosystem in Dongting Lake Basin.
Land-Use TypeESV (1010 RMB)Relative Rate of Change from 1990 to 2015
199019952000200520102015
Arable land15.66 15.50 15.60 15.53 15.33 15.18 −3.07%
Forest land 106.01 106.19 105.85 105.94 106.07 105.63 −0.35%
Grassland3.01 3.05 3.01 2.94 2.82 2.79 −7.12%
Water area9.00 9.42 9.33 9.61 9.71 9.40 4.44%
Wetland3.60 3.25 3.58 3.49 3.68 4.23 17.42%
Total 137.27 137.42 137.37 137.51 137.62 137.23 −0.03%
Table 6. Value proportion and change in the individual ecological service function.
Individual Ecological Service Function1990199520002005201020151990~2015 (%)
Gas exchange13.5113.5113.4813.4713.4613.44−0.07
Climate regulation12.0711.9912.0412.0012.0112.100.03
Water conservation16.1016.1716.1716.2316.2716.260.16
Soil formation and protection16.8616.8416.8216.7816.7416.71−0.15
Waste treatment11.0911.1111.1511.1911.2011.210.12
Biodiversity protection13.4813.4913.4713.4613.4413.42−0.06
Food production2.122.102.112.102.082.07−0.05
Raw materials9.379.389.359.359.359.34−0.04
Entertainment 5.405.415.415.435.455.460.05
Table 7. Principal component factor loading matrix.
Socio-Economic FactorsNatural Factors
GDPPopulation Primary IndustrySecondary IndustryTertiated IndustryInvestment in Fixed Assets Per Capita IncomeAgricultural OutputSocial Merchandise RetailFiscal ExpenditureTemperatureDEMRainfall
F10.9790.7310.2550.9530.9530.9740.8970.1470.9200.9000.403−0.4580.428
F2−0.1490.4180.868−0.104−0.247−0.169−0.2290.888−0.302−0.2580.598−0.6370.399
F30.0320.4170.385−0.0530.0680.053−0.1710.4020.0730.163−0.5990.492−0.361
Publisher’s Note: MDPI stays neutral with regard to jurisdictional claims in published maps and institutional affiliations.

