Article

A Data-Driven Framework for Analyzing Spatial Distribution of the Elderly Cardholders by Using Smart Card Data

1
The Department of Land Surveying and Geo-Informatics, The Hong Kong Polytechnic University, Kowloon, Hong Kong 999077, China
2
College of Metropolitan Transportation, Beijing University of Technology, Beijing 100124, China
*
Author to whom correspondence should be addressed.
ISPRS Int. J. Geo-Inf. 2021, 10(11), 728; https://doi.org/10.3390/ijgi10110728
Submission received: 11 August 2021 / Revised: 19 October 2021 / Accepted: 23 October 2021 / Published: 27 October 2021

Abstract

:
In this era of population aging, it is essential to understand the spatial distribution patterns of the elderly. Based on the smart card data of the elderly, this study aims to detect the home location and examine the spatial distribution patterns of the elderly cardholders in Beijing. A framework is proposed that includes three methods. First, a rule-based approach is proposed to identify the home location of the elderly cardholders based on individual travel pattern. The result has strong correlation with the real elderly population. Second, the clustering method is adopted to group bus stops based on the elderly travel flow. The center points of clusters are utilized to construct a Voronoi diagram. Third, a quasi-gravity model is proposed to reveal the elderly mobility between regions, using the public facilities index. The model measures the elderly travel number between regions, according to public facilities index on the basis of the total number of point of interest (POI) data. Beijing is used as an example to demonstrate the applicability of the proposed methods, and the methods can be widely used for urban planning, design and management regarding the aging population.

1. Introduction

Population aging is a global trend, and it has become a challenge for many countries. According to the World Population Prospects 2019 [1], the world’s population will increase to 9.7 billion by 2050, with one out of six people aged 65 or over. In some European countries and North America, up to one out of four people will be aged 65 or over. With the continued improvements in quality of life and subsequent rise in life expectancy, most countries are paying strong attention to reduce the corresponding negative effects. Several solutions have been proposed, such as gradual or delayed retirement schemes [2,3], extension of working hours and encouragement for the elderly to form organizations with younger people to learn from each other and share their experiences. Urbanization should create many new job opportunities that attract the elderly working in cities. As indicated above, the study of the elderly distribution patterns has become a research topic of great interest to urban planners and policy makers [4].
Two main data sources are commonly used to explore human spatial patterns. The traditional survey questionnaire [5] is the most common method of collecting travel information. The interviewees answer several questions concerning movement behavior, such as travel mode, travel time and personal information. This information could contribute to the understanding of spatial and travel patterns. However, it is impossible to collect large data samples because of labor and time [6], and the location information accuracy cannot be guaranteed. With technological developments, big data has brought new innovations and insights. For example, positioning equipment can easily track location information in real time and provide greater accuracy in mobility pattern analysis. Smart card data record detailed stop locations and the times of card holders taking public transport. Not only is a huge volume of spatial information provided, but these data include high-quality location information. However, these data have a number of limitations. First, travel purpose is not very clear. Second, no socioeconomic data are included [7]. In this study, the smart card data of the elderly are collected as the dataset to detect spatial patterns. Beijing is one of the most highly developed cities, where 24.5% of the population is elderly [8]. Beijing is, thus, an ideal city for analyzing elderly mobility behavior.
The study systemically presents elderly cardholders’ spatial distribution patterns using smart card data. First, the home location distribution of the elderly cardholders in the city is analyzed and presented in a Voronoi diagram, which provides more detailed regions of the elderly cardholders’ distribution. The city is divided into a more detailed Voronoi diagram. The Voronoi diagram is a method to partition a plane into multiple polygons [9]. The basic idea is to link the perpendicular bisector of two adjacent seeds to have polygons. In this study, the seeds are the centers of clusters. To find these centers, the clustering method is used based on the number of the elderly boarding and alighting at bus stops. Second, the spatial mobility between regions is calculated based on the public facilities index of each polygon of the Voronoi diagram. The public facilities index is considered by five kinds of POI data: shops, parks, restaurants, hospitals and stops. A quasi-gravity model is developed to calculate the connectivity of these regions.
The rest of paper is organized as follows. Relative studies are reviewed and analyzed in the Section 2. Section 3 describes the study area and data sources. Section 4 provides the methodologies that we used for this study. Section 5 demonstrates the analysis results by using smart card data. Section 6 draws a summary of this study and proposes the future directions.

2. Literature Review

Many research topics are related with spatial distribution. The connectivity between places can be detected from human travel by means of different modes. Human trajectories have a high degree of regularity in certain spaces and times [10]. Many data sources can be used, such as smart card and mobile phone data [11,12,13,14,15]. They are valuable information that can help to understand human mobility patterns in a city [13,16,17]. The diversities of geography, population and culture affect the elderly population distribution and mobility behavior. For instance, in Europe, America and Australia, the private car is the main transportation tool [5,18,19]. These countries are sparsely populated areas, which is suited to develop highway transportation. This leads to elderly living dispersedly without high density as well as public facilities distribution. Mostly, their travels rely on private cars, and thus, they can have longer connectivity of distance of different regions.
With economic development and population growth, private cars are not the only major transportation tool used by the elderly. Walking, bicycles and public transport are population travel modes in China [20,21,22,23]. The connectivity of distance of different places is obviously shorter than many developed countries or regions. For example, Hong Kong has a highly developed and efficiently developed public transportation system [24] together with complete social welfare to encourage elderly in social activities. Public transportation facilities in most areas of Hong Kong have proved satisfactory in that quality service is provided [25]. The connectivity of short distance is more than that of long distance. In summary, elderly population distribution and connectivity of different places is influenced by urban structure and public services facilities distribution [26], such as public transportation.
Elderly population distribution and spatial connectivity are not only related to travel modes, but also related to activity areas and service facilities [27]. Many service facilities such as shops, hospitals and bus stops are influential lifestyle factors [28,29]; such factors can affect the connectivity of various regions. For example, the elderly like to take activities in local areas if there is a lack of public transport services [30,31,32,33]. If there is a strong connectivity between two places, the value of the total number and frequency is large, as the elderly are more easily enabled to take round trips between them [34]. The study results show that public service facilities have a strong impact on connectivity between different places. Statistics and analysis results show there are mainly 6 kinds of travel behaviors of the elderly, which include visiting and shopping [35].
Azevedo et al. [36] studied the impact of rainfall on the elderly and disabled people using public transportation. To improve the mobility of the elderly, many smart applications have been developed [37]. De Paiva et al. [38] investigated the impact factors of reduced mobility, such as sociodemographic characteristics and health conditions. Individual characters and the environment impact the mobility of the elderly [39]. For example, the elderly who live in rural areas far from larger cities have lower mobility than younger people [40,41].
A framework is built, and corresponding series of methods are proposed to explore the spatial distribution patterns of the elderly cardholders by using smart card data and POI distribution data in the city of interest. The results could provide assistance to urban planners making more relevant policies.

3. Study Area and Data Sources

In this study, Beijing is identified as the study area to demonstrate the applicability of the proposed method for elderly spatial distribution studies.

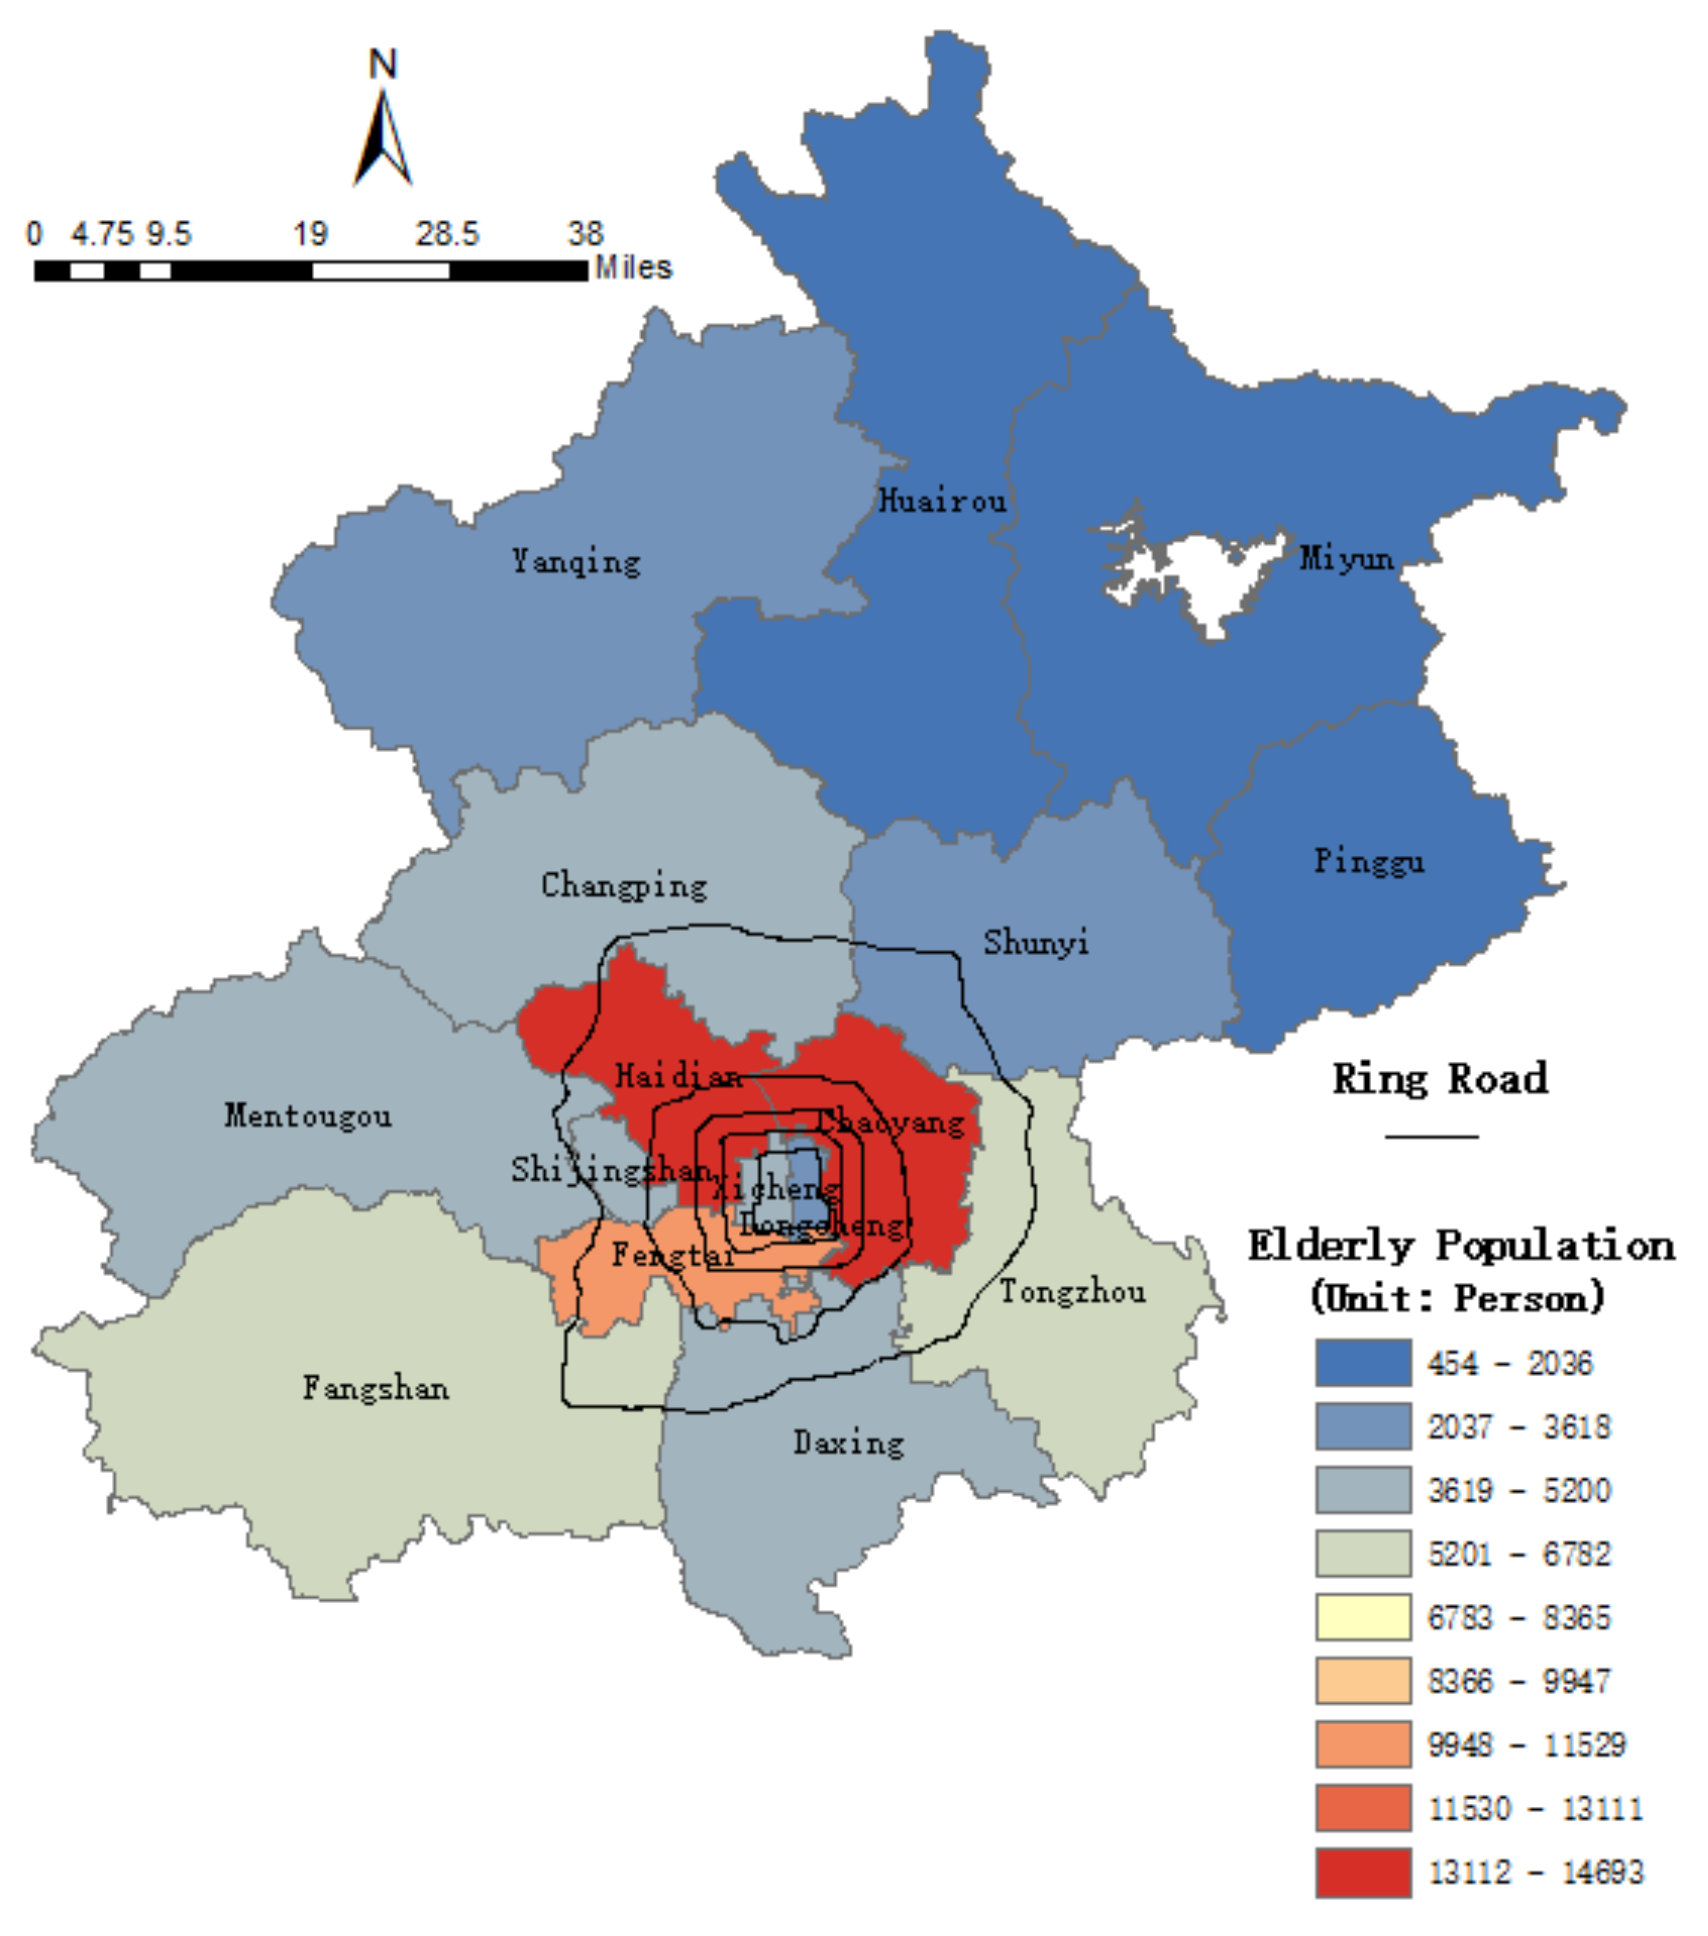
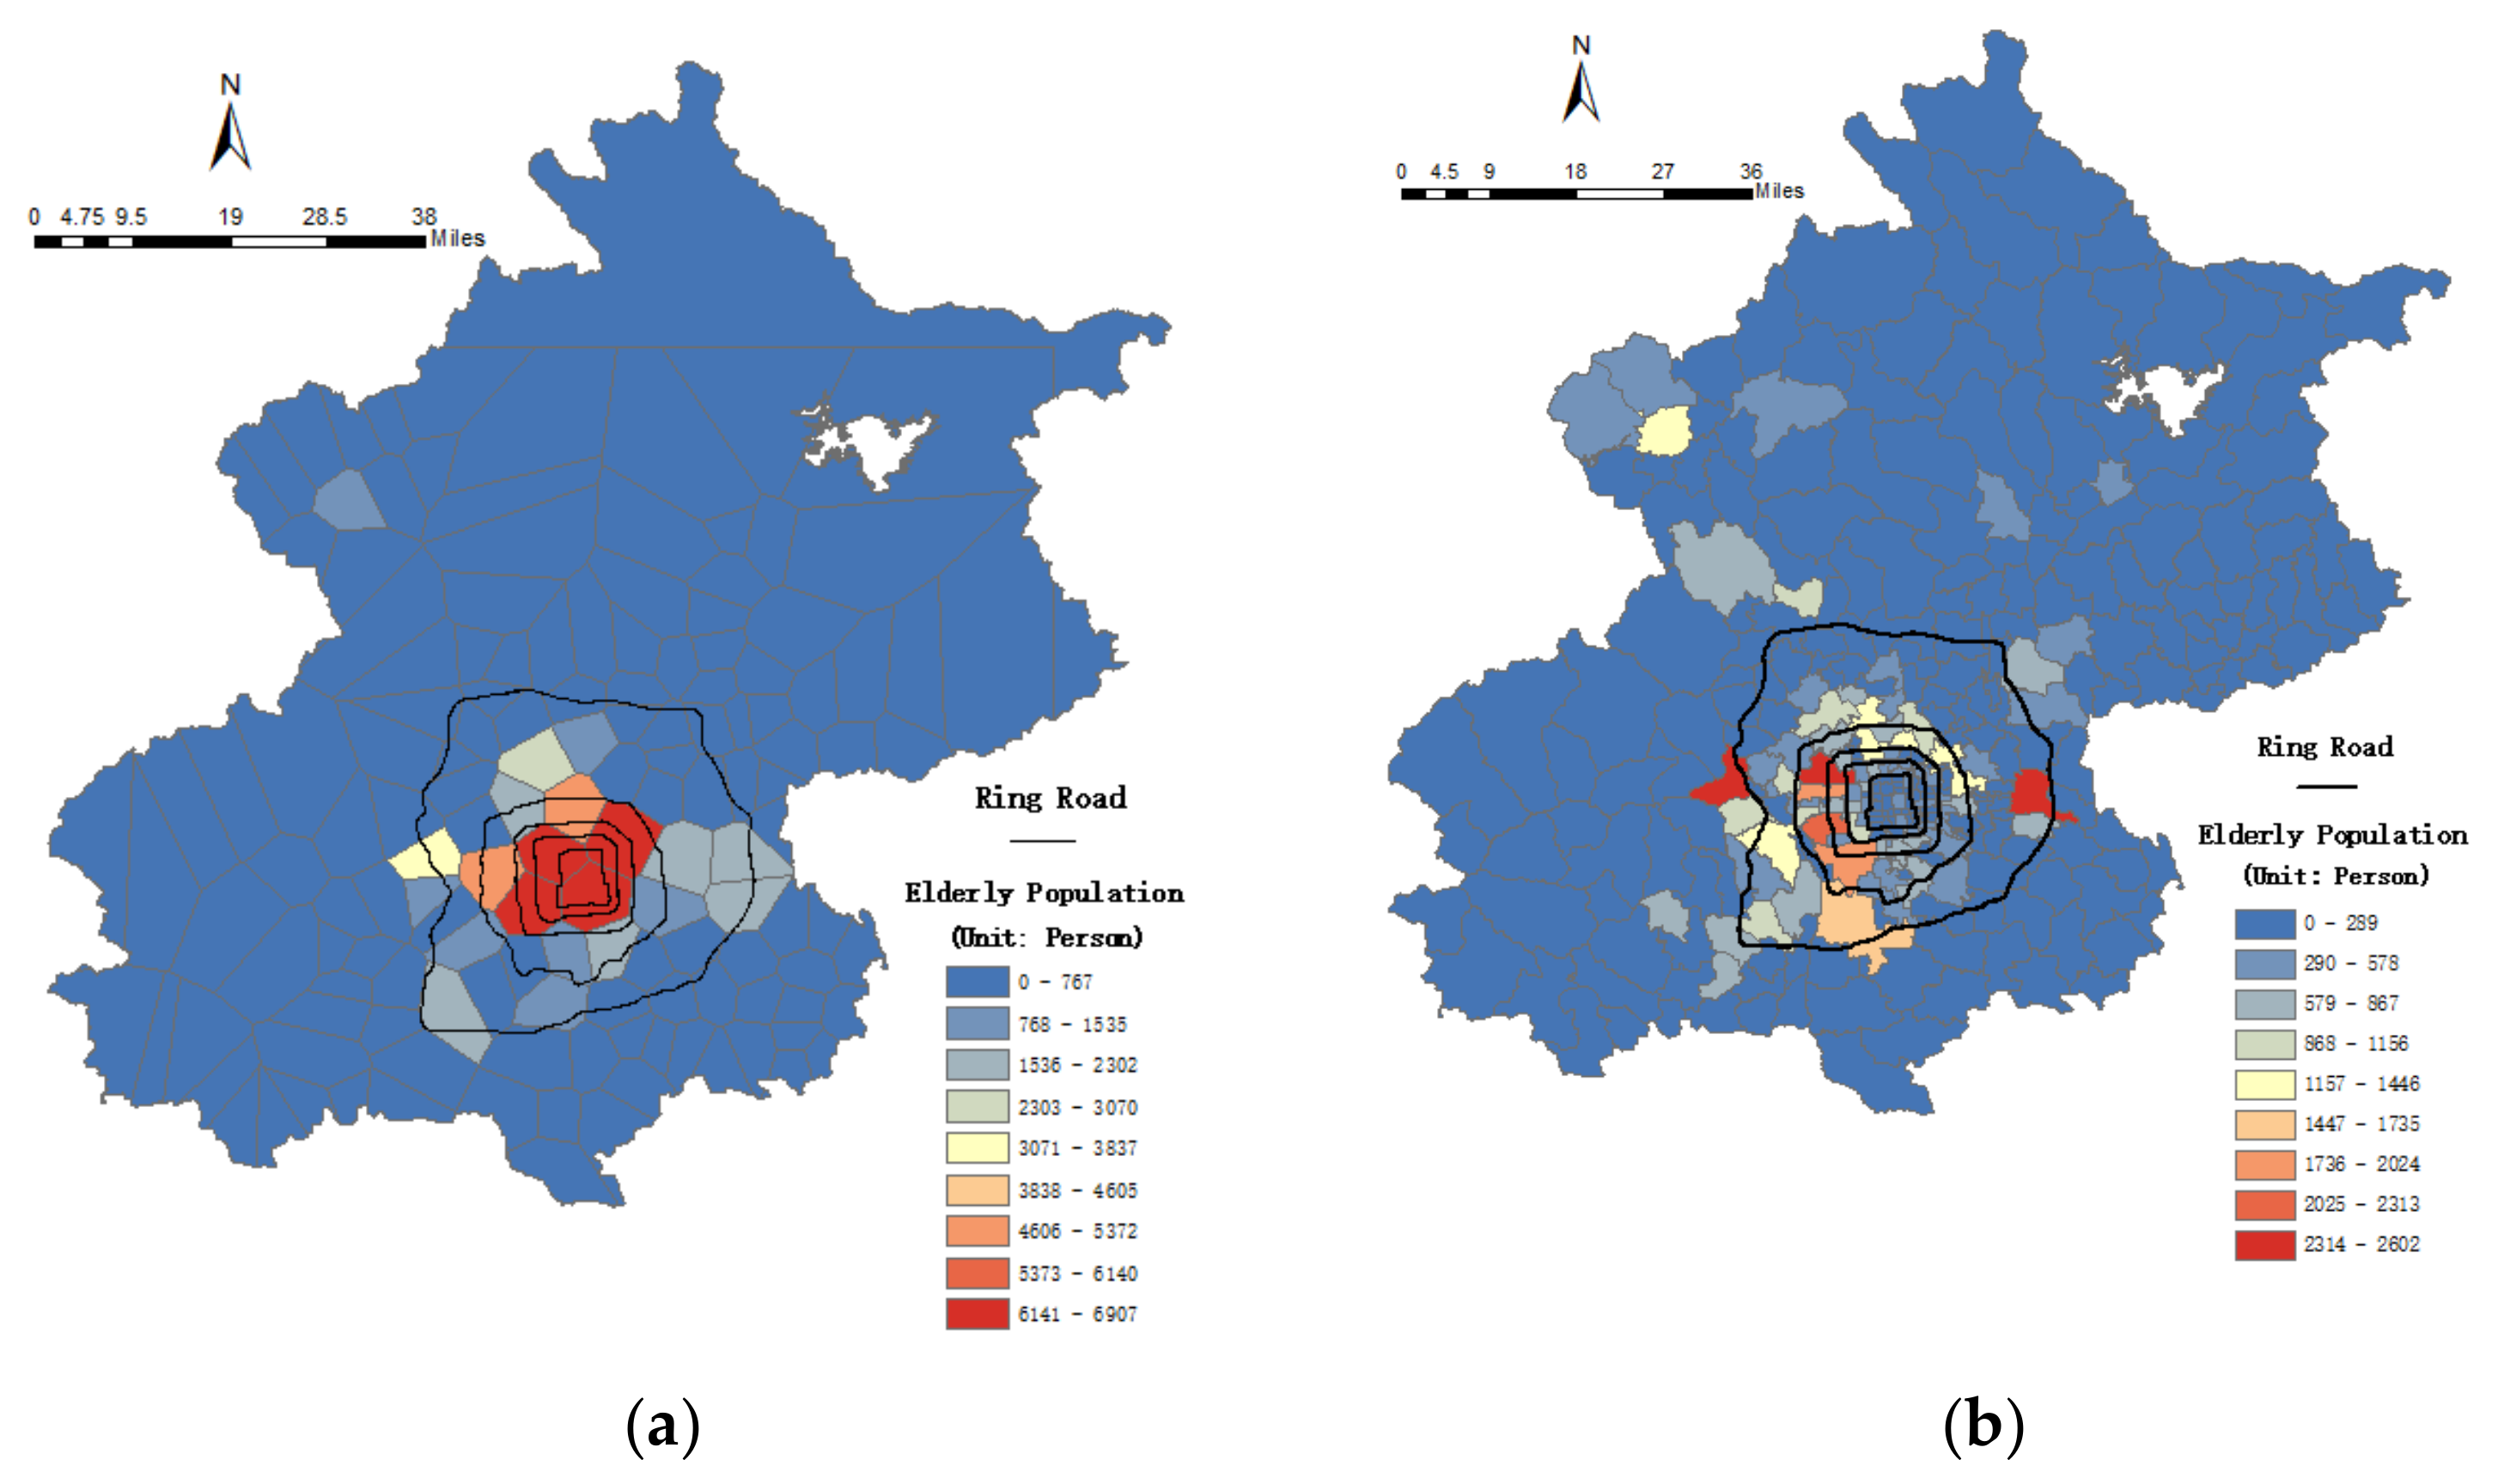
3.1. Statistical Distribution of the Elderly Population in Beijing

Beijing is the capital of China, which is located in the north of the country and covers a land area of 16,410.54 km2. With rapid economic growth, urbanization development and increased resident population, Beijing has become one of the most densely populated cities on the planet. By the end of 2017, the registered resident population of Beijing reached 13.59 million [8]. At the same time, the increasing elderly population caused a considerable problem for making suitable urban planning policies for city development. According to statistics data, the resident population of the elderly, aged 60 and above, was 3.33 million, which accounted for 24.5% of the total population.

3.2. Smart Card Data

In this study, one-week smart card data of the elderly cardholders from the Beijing Municipal Commission of Transport are used as the data source. The total number of records is around 3.3 million from 10 April 2017 to 16 April 2017. Since over 98 percent of the smart card data of elderly is generated by bus, this study focuses on the bus travel of the elderly cardholders. Eight kinds of attributes are used in this study; they are card ID, trip ID, departure stop name, departure stop longitude and latitude information, departure time, arrival stop name, arrival stop longitude and latitude information, and arrival time. Each smart card has a unique card ID for identification, and each ID stands for one elderly person. We assume each elderly person has only one smart card. The smart card ID is an important attribute in the following analysis. Each trip ID means that the elderly person finishes a process, from onboarding to offboarding. One elderly person could have many trips in one day or several days. Each card ID could contain more than one trip ID. To pay the reasonable fare, the elderly person must swipe their card twice: when getting on and getting off. The data include the time of swiping the card and the location information of stops. The location information of stops comprise the longitude and latitude of a stop.

3.3. Point of Interest Data
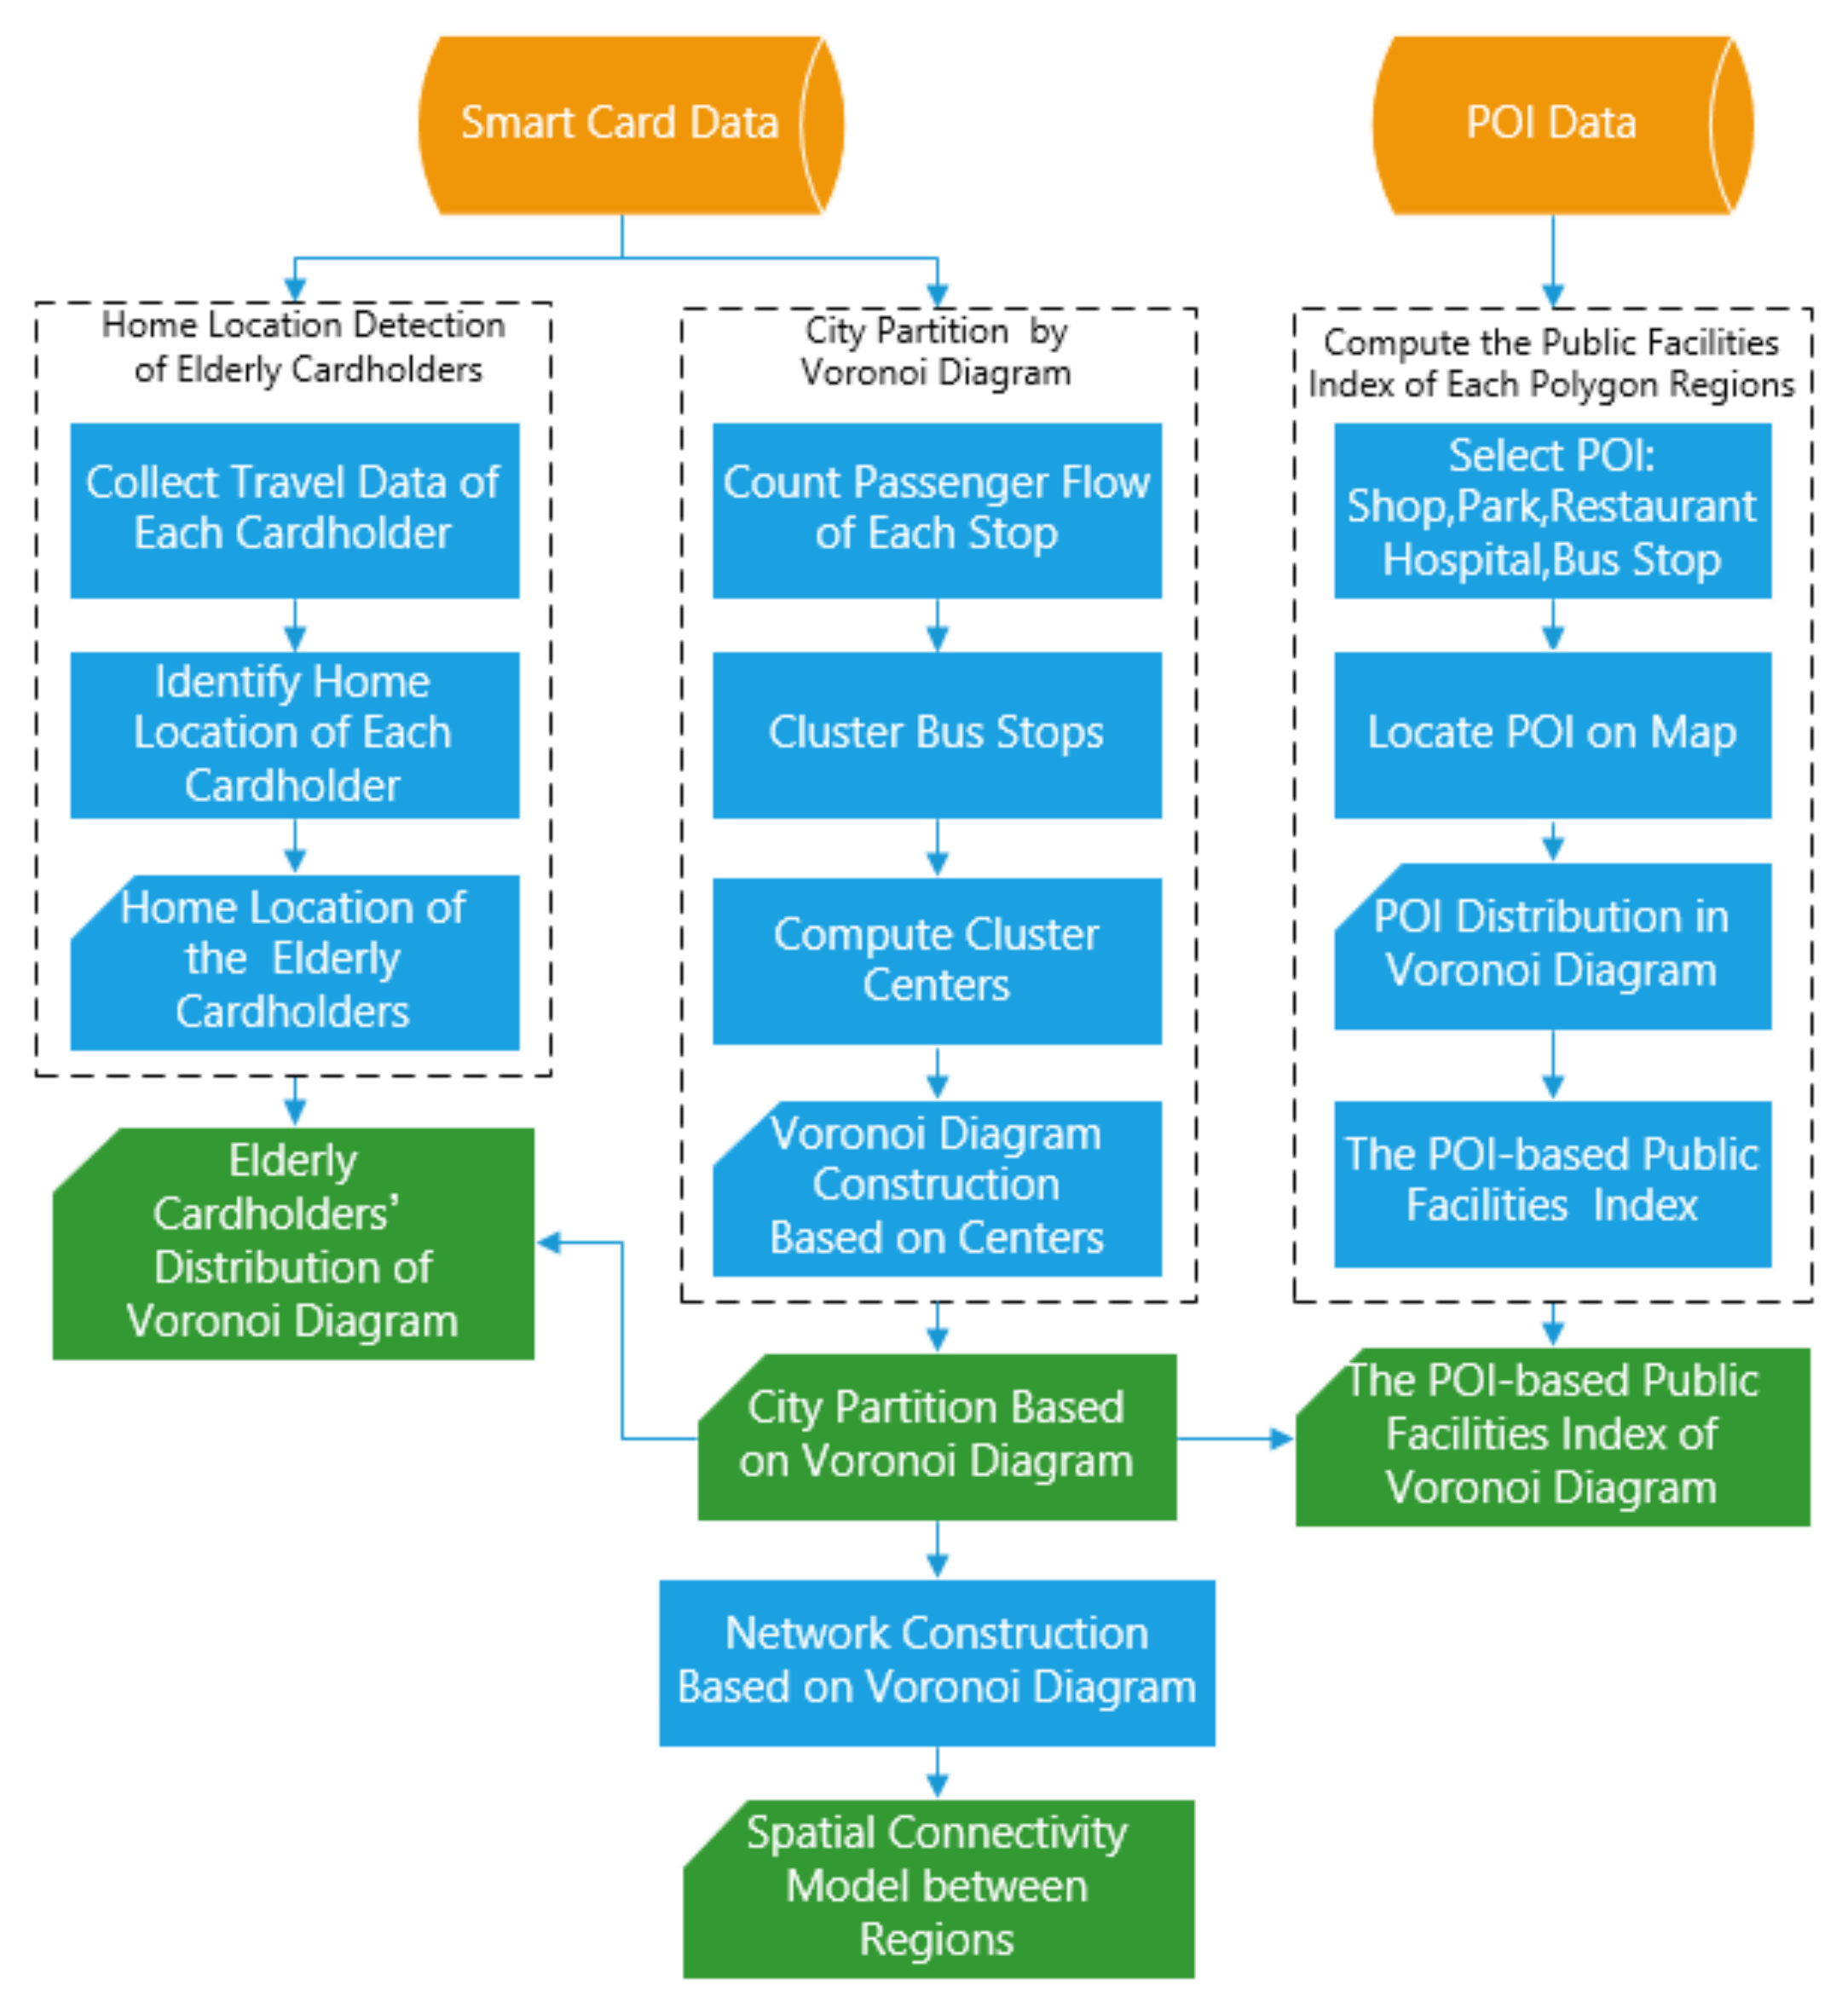
In this study, point of interest (POI) data are used to represent the distribution of public facilities and calculate the public facilities index of each polygon region. We collected more than 46.3 thousand data from the website of Beijing city, including five categories of POI data, namely, shops, parks, restaurant, hospitals and stops.

4. Methodologies

Figure 1 shows the analytics framework of the spatial distribution patterns of the elderly cardholders. Two data sources are mainly used in the data-driven methods: (a) smart card data, and (b) POI data. Three methods are proposed, which are home location identification of the elderly cardholders, city partition by a Voronoi diagram and the mobility model of the elderly cardholders. Two problems are solved using the above methods. First, the home location distribution of the elderly cardholders is represented by a Voronoi diagram. More detailed information of the spatial distribution pattern can be visualized. Second, elderly mobility in a city is modeled in terms of POI data. The model can measure the elderly mobility between regions.

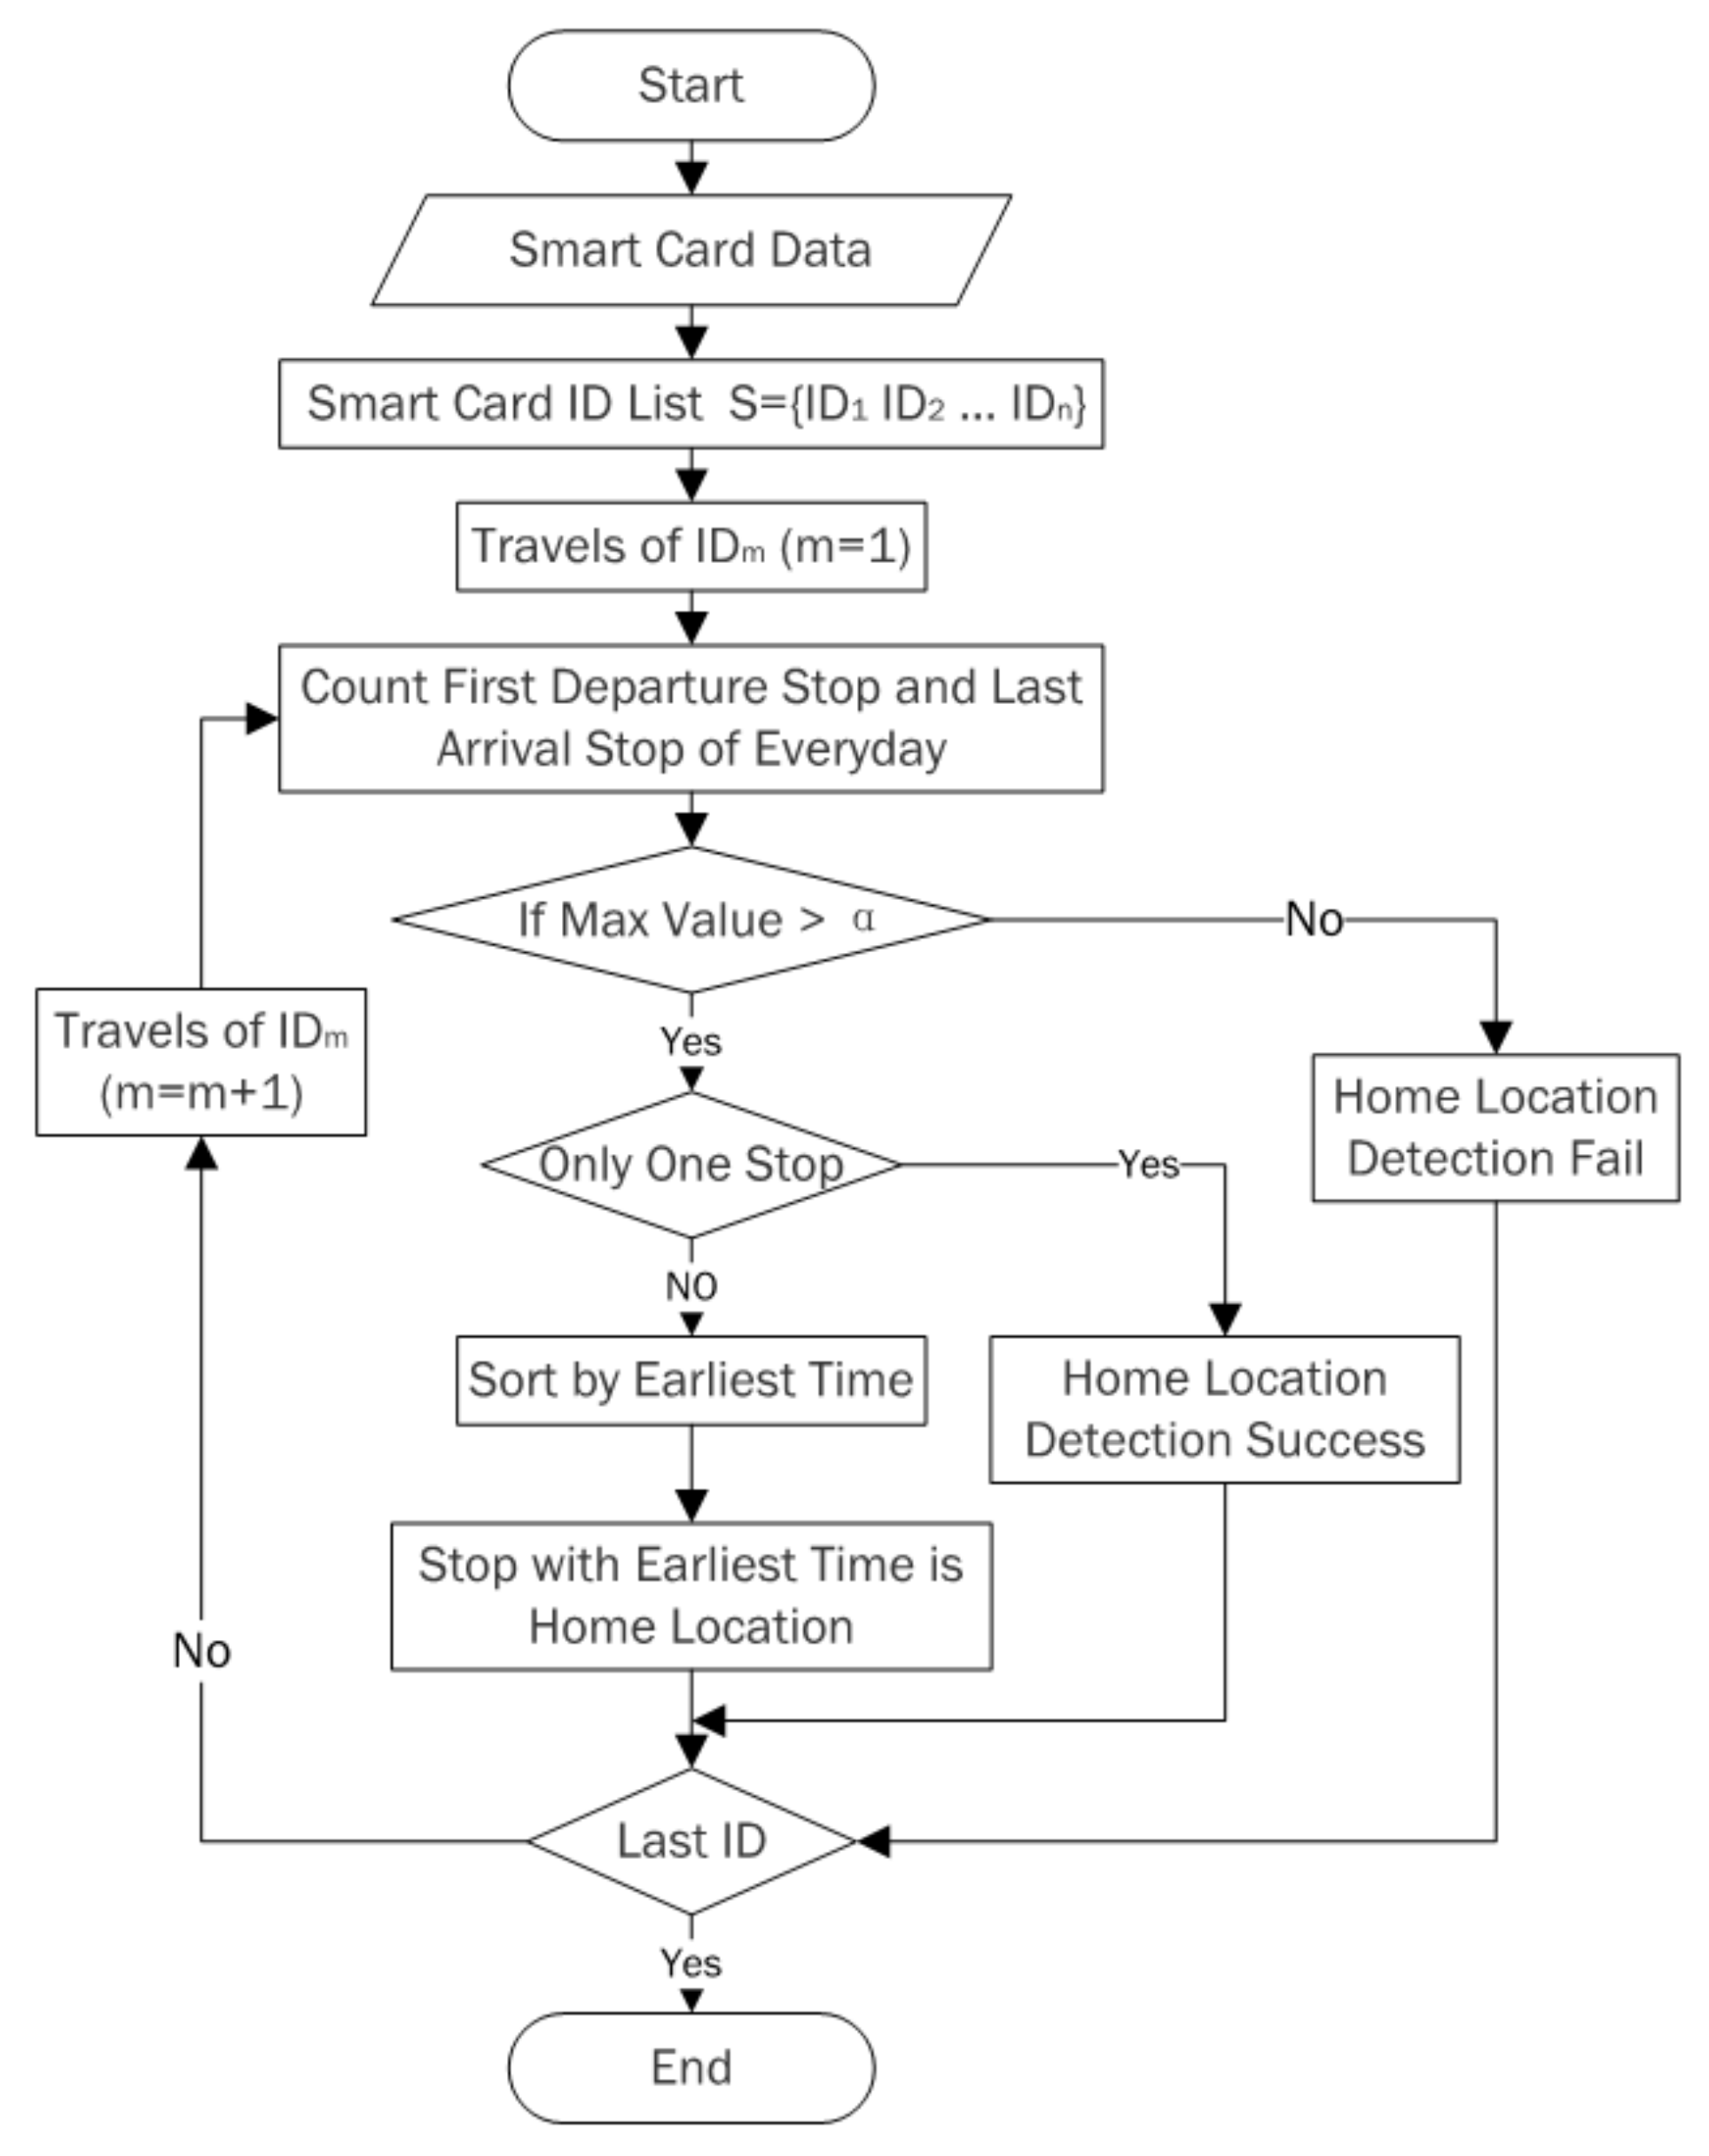
4.1. Home Location Identification of the Elderly Cardholders

In this study, a rule-based method is proposed, using smart card data to identify the home location of elderly cardholders based on the locations of the stops they use frequently. We make the following four assumptions.
Assumption (a): The home location is close to the most-used stop.
It is possible to estimate the home locations of the elderly cardholders by using the locations of the most frequently used stop. Normally, for a commuter, home and work are the two most frequent places in the daily itinerary of trips. Even though the elderly do not have a regular workplace, the home location is a high travel frequency origination and destination. It is highly likely that the home location of an elderly person is close to their most frequently used stop. More than 50% of people will return to a stop which is located within 1 km of their departure stop of the day (Chakirov and Erath, 2012). Normally, the walking distance of the elderly is about 400 m (Zhou, Shen, and Jiang, 2016). In general, the stop should be within walking distance from the home.
Some exceptions could exist in practice, although the percentage of such cases is not likely to be very high. For example, one may use different transportation modes, such as the subway, to finish the rest of trip. This is most likely when the stop is not near the home location of the traveler. However, the rate of interchange and changing from another public transport mode is very low. For example, in Beijing, only 0.3% interchanged and changed their transport mode, according to 502,165 records of smart card data from 12 April 2017.
Assumption (b): The stop of earliest departure or latest arrival during an elderly person’s daily trip has a very high chance of being the home location. Barry et al. [42] proposed similar assumptions for estimating original-destination trips, such as home–office trip.
Assumption (c): The stop of earliest departure for all the recorded days has the highest probability of being the home location. Based on Assumptions (b) and (c), frequency and time of day are the two main factors used for identifying stops as the home location.
Assumption (d): One elderly person uses one smart card mainly for his/her trip.
Figure 2 shows the flowchart of the elderly cardholders’ home location detection algorithm. The steps are as follows:
First, we filtered the dataset, listed all smart card IDs and confirmed that each corresponded to a different elderly person.
Second, we counted the total number of times that a stop was the first departure or last arrival stop each day. A minimum threshold α was set to four to filter the stops because most elderly are unable to take public transportation with a high frequency.
Third, if the total number of instances of any such stop was higher than the threshold, the home location of the smart card ID could be detected; otherwise, it could not be detected.
Fourth, if only one stop had a total number of instances larger than the threshold, the stop was identified as the home location of the smart card ID. If two or more stops met this criterion, the time of day was considered the deciding factor in the second step. We sorted the stops by the time of day, and the stop used at the earliest time was considered the home location.
The advantages of this home location identification method are that the home location detected reflects the latest and regular home location of an elderly person if his/her registered home location is not updated, or if he/she has more than one. The accuracy of the detected home location of the elderly would be much higher if accumulated smart card data are available for a longer period, such as several months.
Based on the above assumptions of the proposed method for home location identification, the home locations of most of the elderly cardholders were identified, using the smart card data. However, a minority could not be identified. In most of these cases, the total number of times that the elderly traveled from any stop was very low, or even zero, according to the smart card data. This is one limitation of the proposed method for elderly home location identification, due to the data quality of the smart card data. Fortunately, this small number of missing locations had no substantial effect on the overall spatial distribution analysis of the elderly population of the city and can, thus, be ignored.
According to our assumptions, the stop should be within walking distance of home. Some exceptions could exist in practice, although the percentage of such cases is not likely to be very high. For example, one may use other transportation modes from home, such as the subway, and then change to a bus for a subsequent trip. This is most likely when the stop is not near the home location of the traveler. However, in general, it is reasonable to assume that the departure stop is close to the home location of an elderly person because the rate of changing from another public transportation mode is very low, as indicated by the Beijing data.

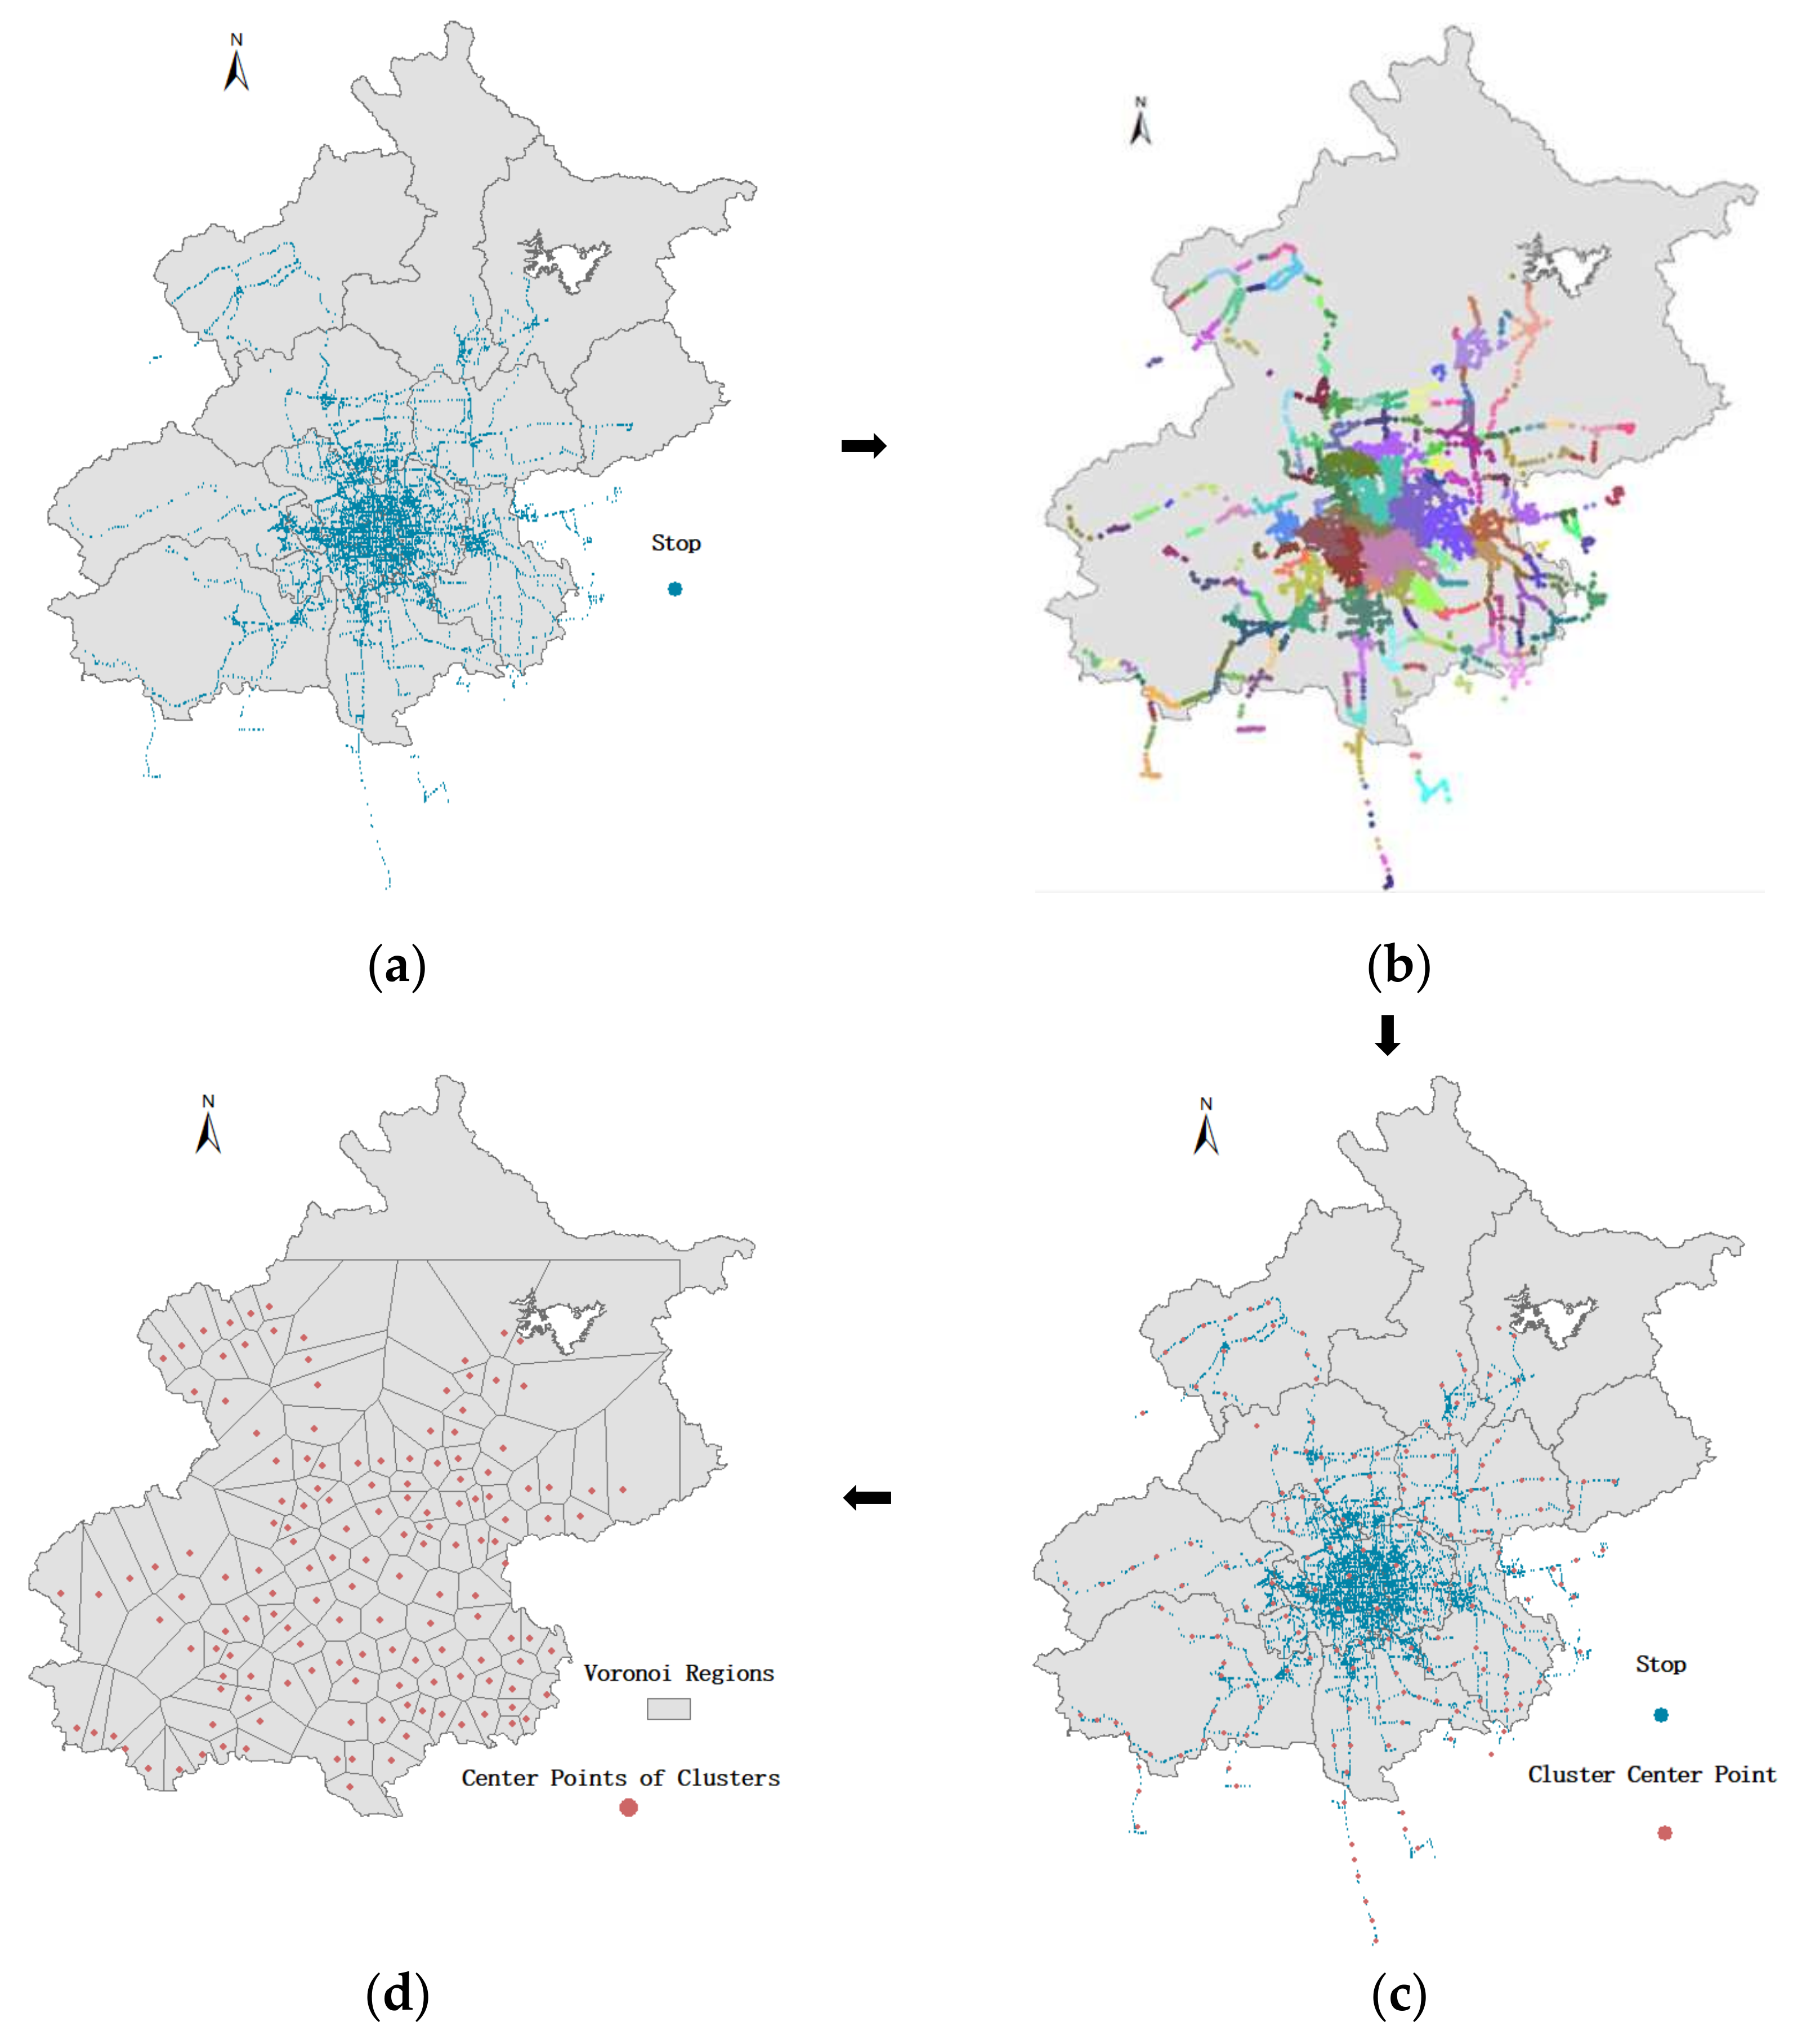
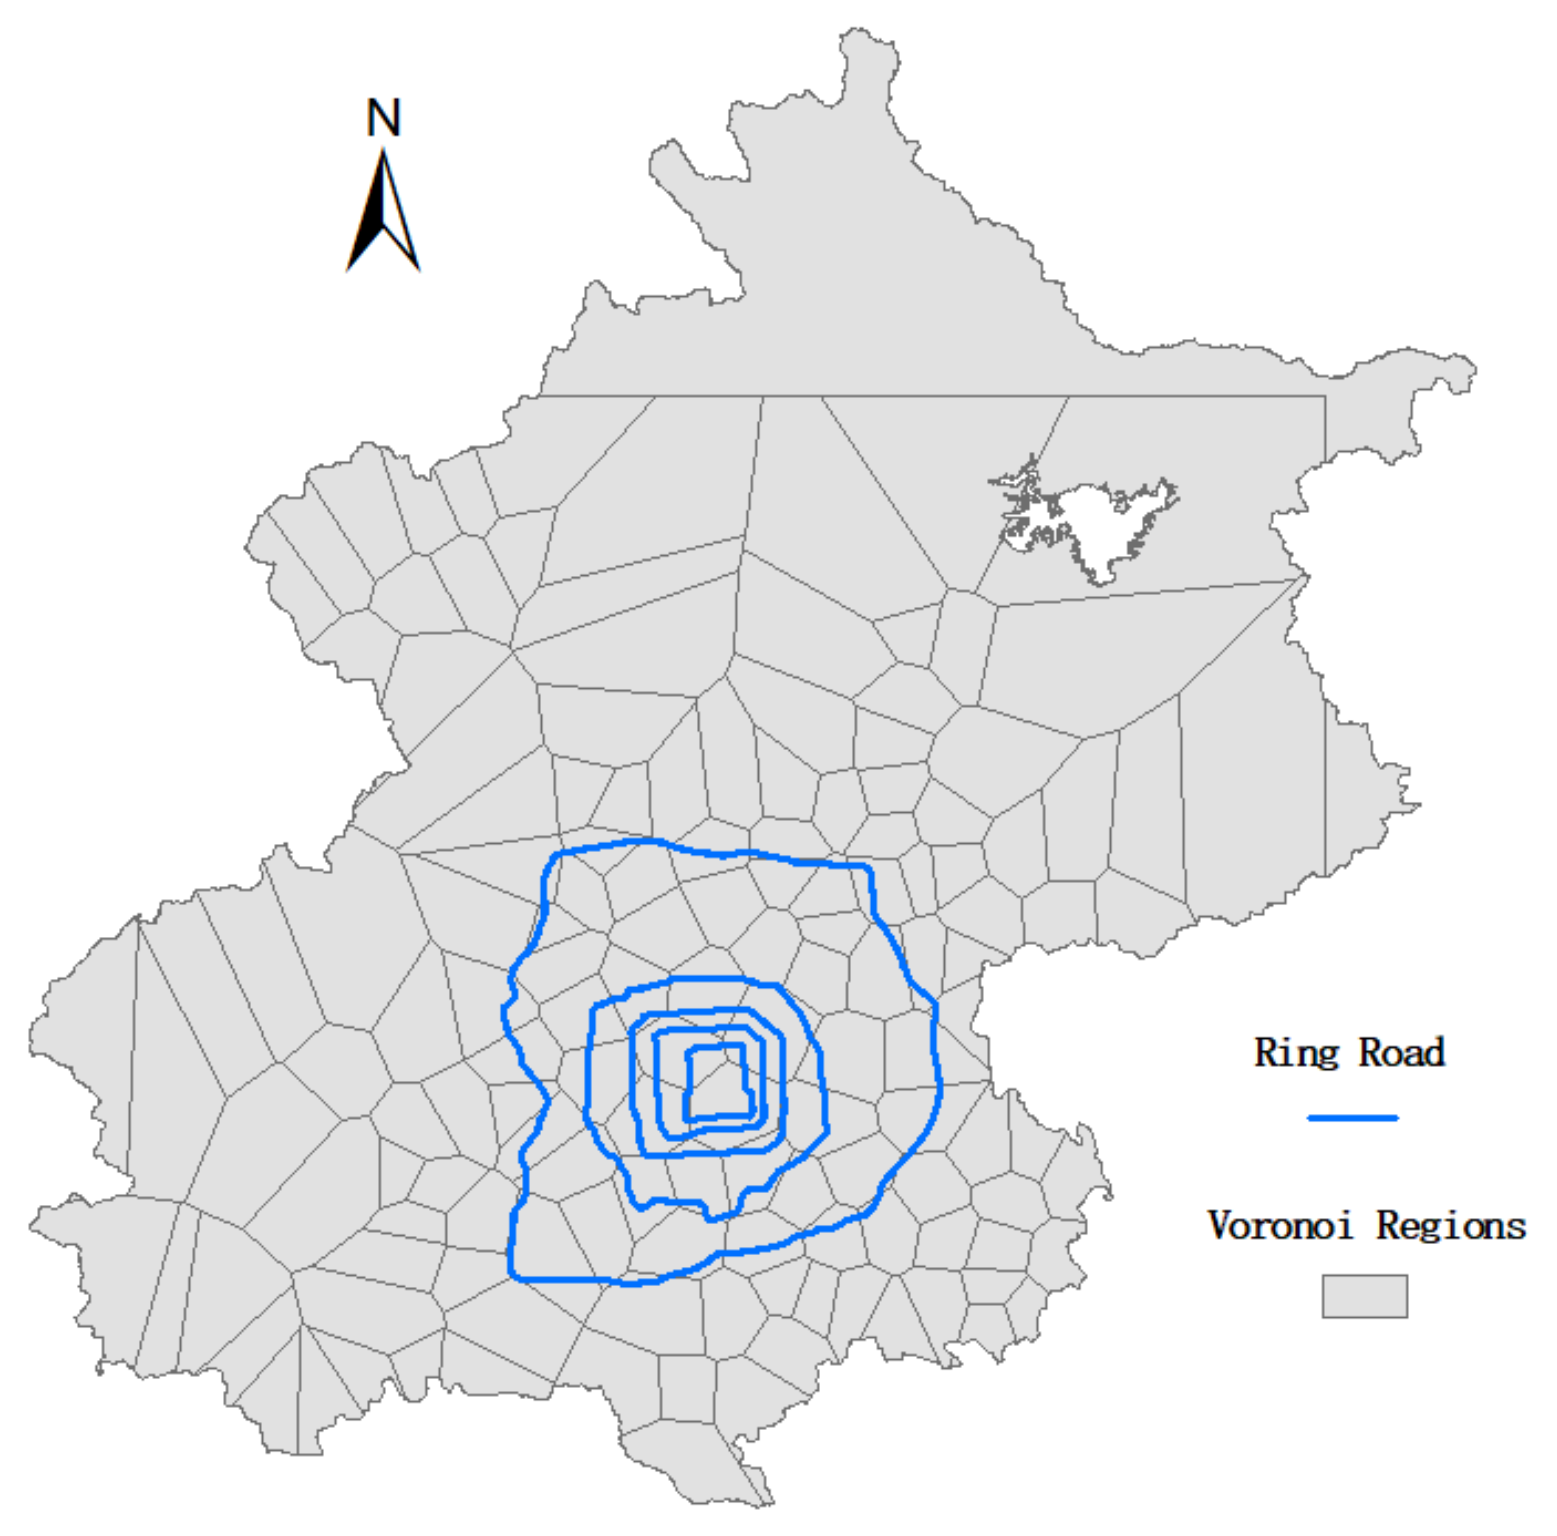
4.2. Voronoi Diagram Construction by Clustering Method

To describe the spatial distribution of the elderly cardholders, we require a method to properly partition a city into multiple regions. Traditionally, administrative regions, such as the districts of a city, are used as the basic geographic unit for censuses. However, the area of each administrative region is too large to describe the detailed information of the population distribution. Therefore, a detailed city partitioning method for elderly residential regions must be developed. Here, we propose a clustering method for grouping bus stops to construct a Voronoi diagram as an alternative solution. The logic flow of the clustering method includes three steps as follows.
First, we count the elderly passenger flow, which comprise the total number of onboarding and offboarding at each stop. Then, we sort all stops S N = S 1 , S 2 , S n in descending order based on the number.
Second, the clustering method is used for clustering stops. A distance threshold value is set in advanced. In this study, we set 3500 as the distance threshold. According to the sorted result in the first step, for each stop S i , the stop S j is identified, where stop S j has the shortest distance with stop S i among all the stops. If the distance is shorter than the threshold, then S i and S j belong to the same cluster, while if it is larger than the threshold, the stop S i is regarded as a new cluster center. We continue this process until all the stops are clustered.
Third, after all the stops are clustered into different clusters, the center point of each cluster is computed, and the arithmetic mean is used for computing the coordinates of each center. The pseudo code is given in Algorithm 1.
Algorithm 1. Clustering method based on high frequency and distance
Data: Smart card data S
Input: Distance threshold r
   Cluster indicator c = 0
Output: Cluster number
   Set of cluster C n
Count passage flow of each stop and sort these by descent based on the number S = S 0 , S 1 , S 2 S n
For i to S .length
 If i = 0 then
  Stop S i is new cluster core, insert c into C n
   c + +
 Else
  Let d   is new array
  For j in i 1 do
       d d j i d i s t a n c e S j , S i
  Sort d d j i 0 , d j i 1 ,   by ascending
  If d j i 0 < r
   Stop S i and S j are in the same cluster, insert C j into C n
  Else
   Stop S i is new cluster core, insert c into C n
    c + +
The center points of each cluster are regarded as the seed point, linking the perpendicular bisector of two adjacent seed points; the polygons of the Voronoi diagram are thus generated. We chose ArcGIS 10.2 [43] to generate the Voronoi diagram by importing the result of center points.
The smart car data from the Beijing are used as the data source to detect the clusters. Figure 3 shows the clustering of spatial distribution of the stops, and the center points are used to construct the Voronoi diagram.

4.3. The Elderly Mobility Model Based on Gravity Model

A gravity model is commonly used to quantify the relationship between different objects. The gravity model can be expressed as Equation (1):
I i j = G m i m j d γ
where G is a constant parameter that can be determined according to the problem concerned, m i   and m j are the mass of object i and object j , respectively, d is the distance between i and j , and γ is the order of distance. Many types of distance can be chosen, such as the Euclidean distance or Chebyshev distance; an appropriate type should be determined for the particular application concerned.
In this study, we discovered that the relationship between the public facilities index and the number follows a quasi-gravity model, represented in Formula (2). Here, the public facilities index is quantified by POI within the Voronoi diagram, and the connectivity strength is quantified by that of the edge connecting the two regions.
S i j = G L _ I n d e x i   L _ I n d e x j D γ i j ,   i = 0 , 1 , 2 , , j = 0 , 1 , 2 ,
where S i j is the strength between region i and j , G is a constant parameter, L _ I n d e x i and   L _ I n d e x j are the public facilities indices of regions i and j , D is the Euclidean distance between the centroids of regions i and j , and γ is the order of distance. This quasi-gravity model was verified based on the smart card datasets of the study area.
The public facilities index model derives from the POI data. POI data are widely used to identify the functional zone [44,45]. In this study, the public facilities index is an indicator of whether a region is convenient for the elderly to live according to POI data. The higher the index value, the more convenient the region is. In this study, the model of the elderly public facilities index is designed to be computable based on POI data, which is open and widely available on the internet.
Through the above correlation coefficients of the elderly population distribution and POI, the following five kinds of POI were identified for computing the public facilities index: shops, parks, restaurants, hospitals and stops. The index is quantified by this set of factors with an emphasis on public facilities, which are important for the elderly in daily life, and these facilities are indicated by the spatial distribution of corresponding POI. The model of the public facilities index is thus formulated as follows:
L _ I n d e x i = p s i + p p i + p f i + p h i + p t i         i = 1 , 2 , 3 ,
where L _ I n d e x i is the public facilities index; p s i , p f i and p t i are the total number of the three kinds of POI in each region; p p i is the total area of parks in each region; p h i is not only the number of hospitals in each region, but also considers the levels of hospitals; and i is the ID of each region.

5. Application Study and Results Analyses

5.1. Spatial Distribution of the Elderly Cardholders

5.1.1. Home Location Spatial Distribution of the Elderly Cardholders

The insufficiency of smart card data is that they only contain travel information with the stop level. There is not any detailed travel information, such as origin and destination location. In this study, we made several assumptions to deduce the home location of the elderly cardholders. Government statistics data are used to evaluate the detection result.
Firstly, the spatial distribution of the elderly is displayed, using administrative regions and government statistics data. Figure 4 shows the distribution of the elderly population distribution of 16 administrative regions by means of various colors. The population of the elderly is in accordance with the government statistics data [8]. The black circular lines indicate the Second to the Sixth Ring Road. From Figure 4, it can be seen that five districts at the center are much more significantly populated than the others. Chaoyang and Haidian rank first and second highest in terms of elderly population, respectively. Xicheng, Fengtai and Dongcheng rank after them. In the following sections, the elderly distribution, with respect to the administrative regions, are taken as the benchmark to compare with the spatial distributions of the elderly population derived from the proposed method.
Secondly, the proposed rule-based method is applied to identify the home location of the elderly cardholders. Figure 5 presents the identification result, using 16 administrative regions. The density level of the elderly population distribution in the different regions is indicated in different colors; the black lines are Ring Roads. The color scale indicates the population density of the elderly. It can clearly be seen that the color is darker in the center than in remote regions. The spatial distribution is highly similar with the statistical data distribution result.
To evaluate the quality of the spatial distribution of the elderly population described by the proposed method, the Pearson correlation coefficient and the p value are used to calculate the correlation of the two spatial representations. The correlation coefficient value is equal to 0.85, and the p value is 0.0002. Suppose that we set the significance level at 1%; as the p value is smaller than 0.01, the correlation of the two spatial distributions shows a significantly positive correlation. It indicates that the proposed method can be used to roughly describe the elderly spatial distribution of administrative regions. Even though the proposed method cannot accurately predict the real population of the elderly, it helps to understand the density level of the elderly population distribution. In the following content, the proposed method is used to detect the elderly spatial distribution in multi-scale spatial representation.

5.1.2. Spatial Distribution of the Elderly Cardholders Constructed by Voronoi Diagram

Administrative regions are among the commonly used geospatial units. However, the area of each administrative region is too large for the elderly spatial distribution to be illustrated in detail. Shao et al. [20] adopted an aggregated method to group bus stations into small cells for constructing a Voronoi diagram. The Voronoi diagram partitions a plane into regions close to the given sets of seed points [46]. In our study, the Voronoi diagram is still utilized to construct a new geographic unit. Bus stops are clustered by the clustering method to calculate the seed points for constructing the Voronoi diagram. The plane refers to the whole area of a city, and the Voronoi diagram is the partition of a city, where each polygon represents a cluster result of the bus stop [20]. This method considers not only the spatial locations of the stops in a city, but also the number of the elderly who use the stops. Compared with the partitioning of a city by administrative regions, the advantage of the proposed method is that the area of each region is smaller than the traditional administrative region and thus, can provide a detailed distribution. The data-driven method based on the usage of stops reflects the real/frequent living place. The proposed method in this study, which is based on these data, is therefore more reliable. Figure 6 presents the Voronoi diagram with the regions as grey polygons, and the blue lines show the Ring Road of Beijing. Because of the limitations of the dataset, in remote areas with a low density of stops or none at all, the corresponding polygons are much larger than those of areas with a high density of stops. In Figure 6, for example, there are large polygons in the northern part of the city, and most of the small-polygon regions are located in the center of the city. As a comparison, 328 administrative counties are used to represent the analysis results.
Figure 7 shows the spatial distribution of the elderly in the 147-polygon Voronoi diagram and 328 counties, using the home location detection method; the black lines indicate Ring Road. From the distribution of the colored regions in Figure 7a, we can see that the regions with high population density are concentrated in the center of the city. Remote regions have lower population densities. The area of each region in the Voronoi diagram is smaller than the administrative region, and thus, the elderly spatial distribution is illustrated in greater detail. Figure 7b shows the elderly cardholders distribution using 328 counties’ administrative regions. It contains more polygons than the former result in a smaller area of each polygon. As the areas of polygons in the center are smaller than the others, the population is lower than the others. Around center areas, the elderly cardholders’ distribution is similar with Figure 7a.

5.2. Mobility Model of the Elderly Cardholders in Beijing

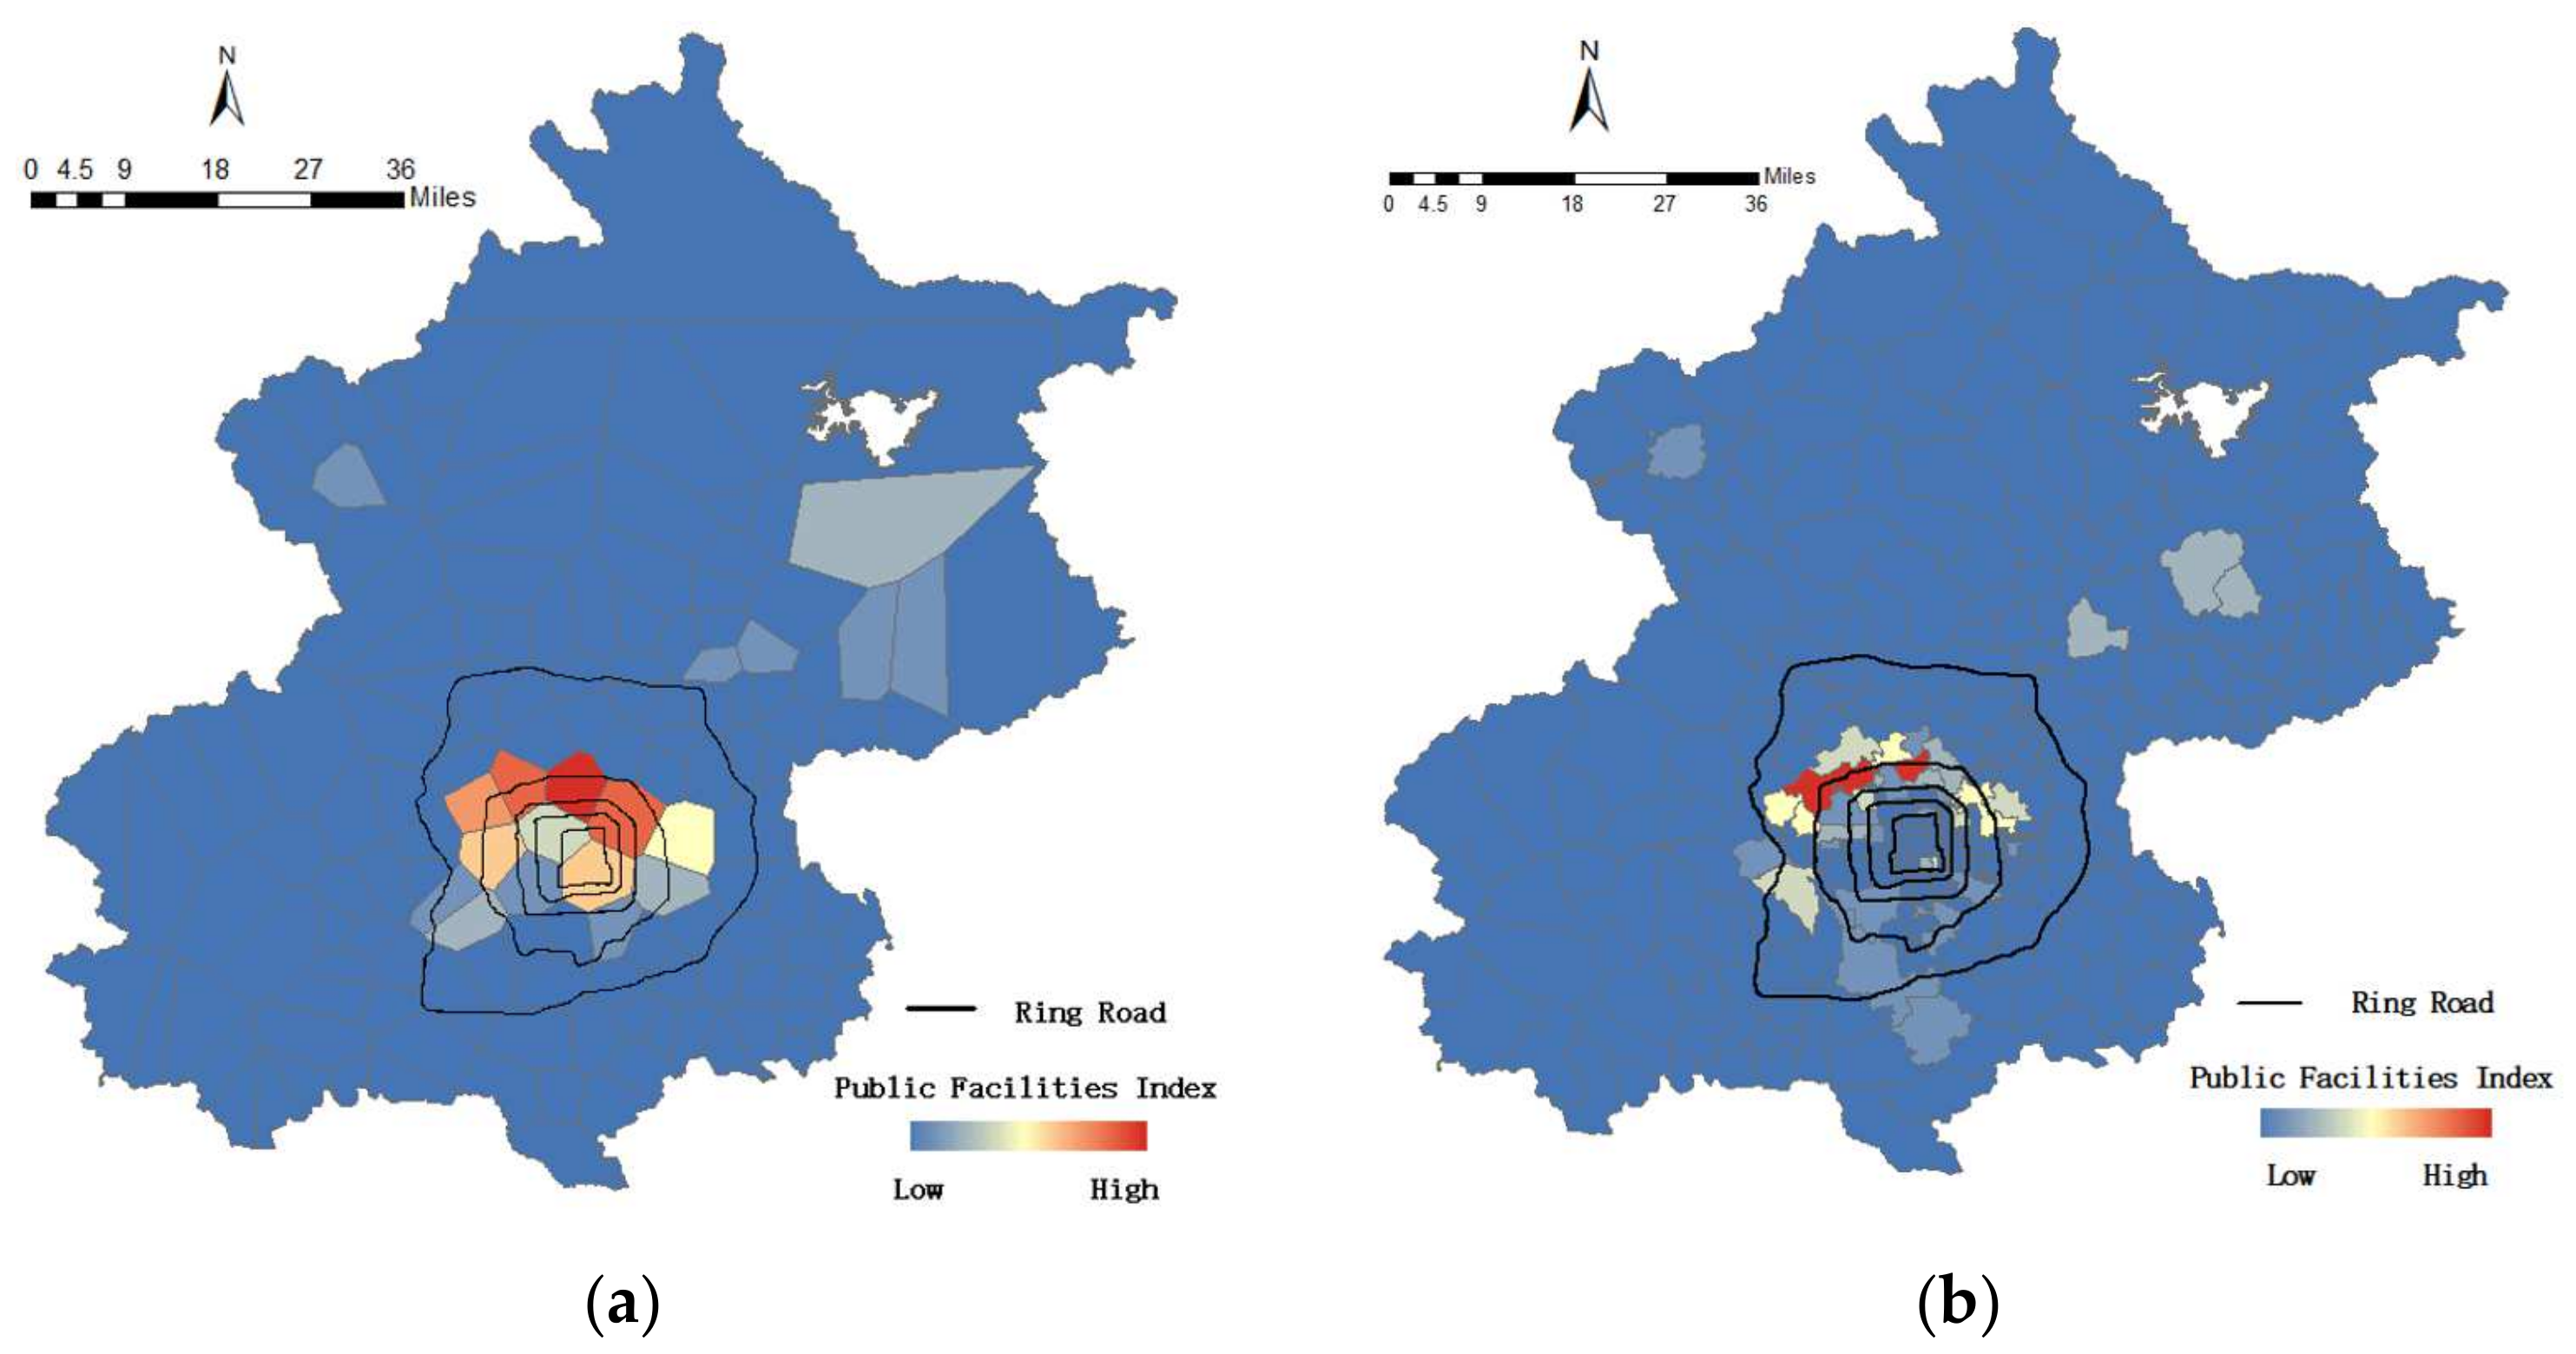
5.2.1. Spatial Distribution Public Facilities Index

The proposed public facilities index model is used to analyze the mobility of the elderly cardholders. Mobility may be related to many factors, including social, economic, security and environmental factors, in addition to public facilities. In this study, we focus on public facilities because elderly mobility is strongly relevant with them.
In the proposed public facilities index, we identified five kinds of POI on public facilities: shops, parks, restaurants, hospitals and stops. The POI distribution has a clearly clustered pattern in which some regions have more POIs than others, and most are located in the center of the city. The Pearson correlation coefficients between the elderly cardholders’ distribution and each category of POI were calculated in a Voronoi diagram and 328 counties as shown in Table 1. Most of the coefficient values are very large and the p values are small. We calculated the total area of parks as the indicator when processing the POI data, instead of calculating the number of parks, as regions with large areas of parkland necessarily have smaller residential areas, which in turn leads to a low coefficient value. The result shows that the POI distribution is highly correlated with the elderly cardholders’ population distribution.
The rationale for the selected five factors for the public facilities index in terms of POI is verified by calculating the correlation of the elderly cardholders’ distribution and POI in the region. The public facilities index of each region is then calculated, according to Equation (3).
Figure 8 shows the spatial distribution of the public facilities index in the Voronoi diagram and 328 counties. From the figure, we can see that higher values of the index are mainly concentrated in the north center of the city from the 4th ring road to 5th ring road, and lower values are in the remote regions. The reason is that we are using park areas as one of POI factors to calculate the public facilities index, and the large parks are located in those regions. This reflects the fact that the public facilities development is unbalanced. At the center, the density of public facilities is higher than in the remote regions. This explains that most of the home locations of elderly cardholders are located with comprehensive public facilities. In a future study, we will consider more rational calculation methods of the public facilities index.
This spatial distribution public facilities index can help the government planning department to make the urban development policy. As the distribution of public facilities is unbalanced, the elderly living in remote places without sufficient facilities must travel long distances to obtain what they need. The planning department should, therefore, plan more public facilities to meet the needs of the elderly. The spatial distribution clearly shows the regions in need of development. Even though the center regions have sufficient facilities, their elderly population is large. It is better to enable the elderly to move to remote regions by developing public facilities there. If it is difficult for the elderly to move to other places because of poor physical health, more care centers, such as nursing homes, should be established.

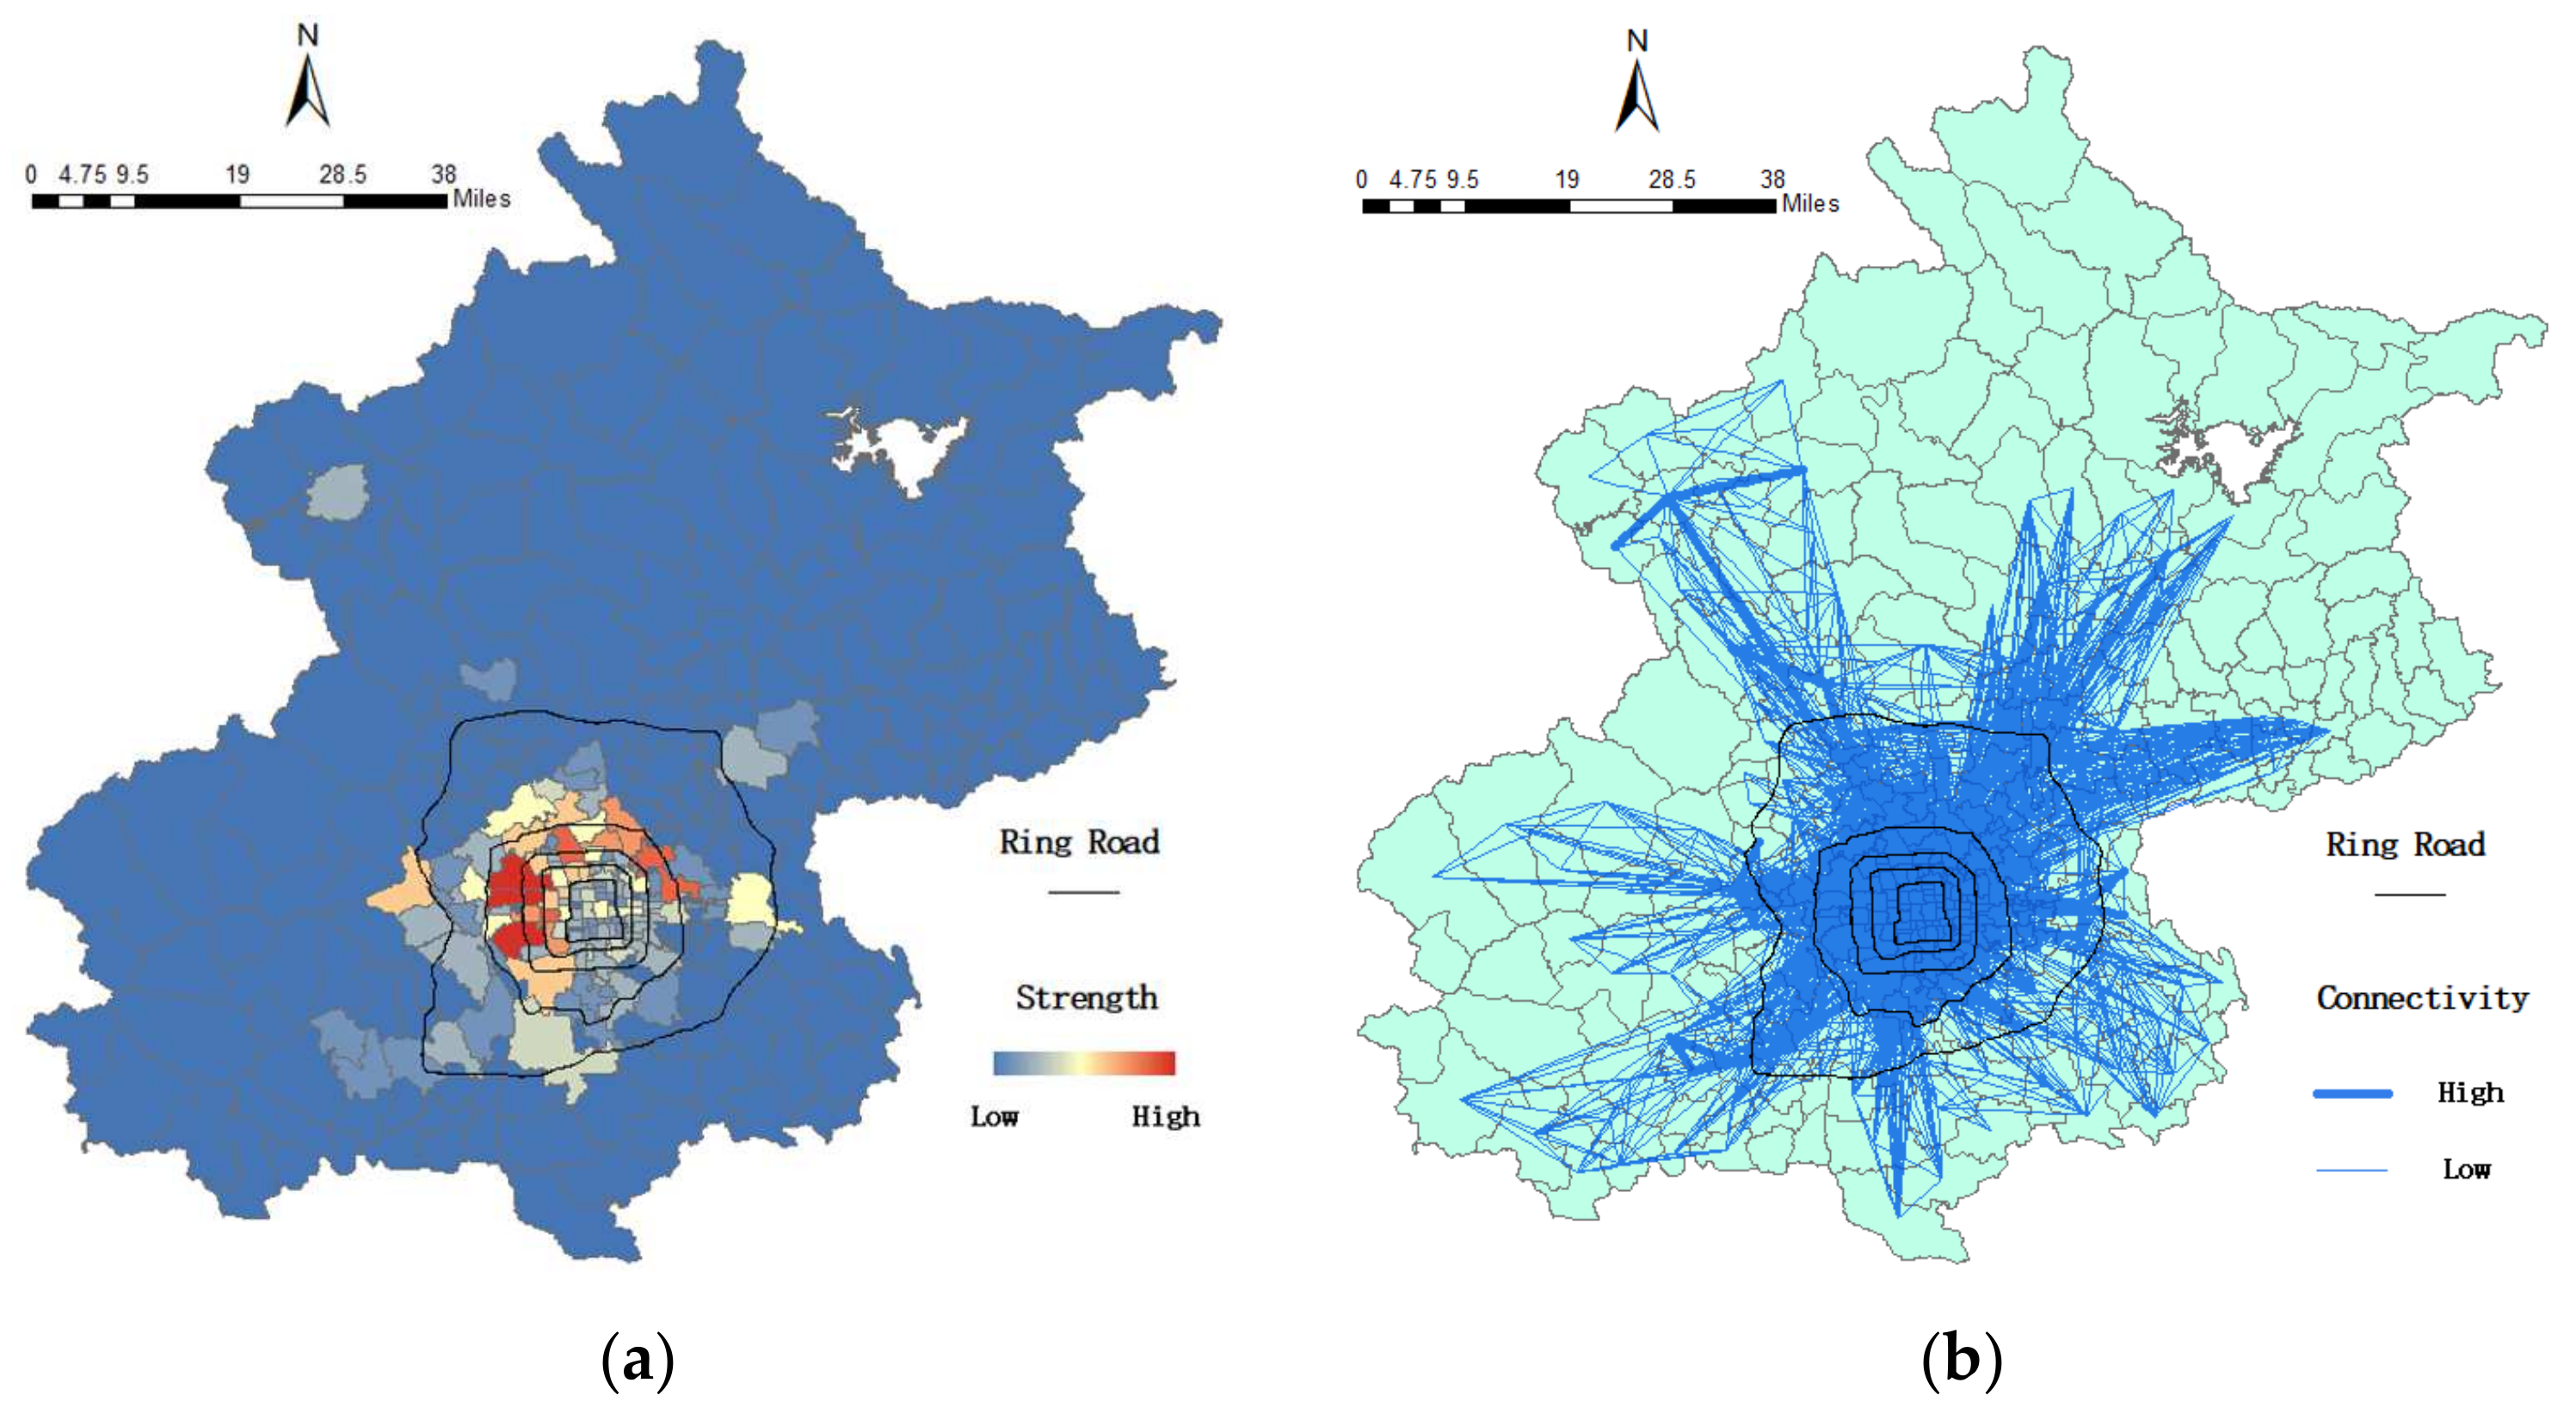
5.2.2. Mobility Model of the Elderly Cardholders

To study the mobility model, a network was constructed based on the centroids of the 147-polygon regions in the Voronoi diagram and in 328 counties. The connectivity between the regions with respect to the activities of elderly was conducted accordingly. The coordinates of the centroids for each polygon were regarded as network nodes. The locations of stops within each region were aggregated to the centroids. If any elderly citizen took a public transport from one region to another, the linkage between the two centroids was regarded as a network edge. Table 2 illustrates the overall properties of the Voronoi diagram and 328 counties.
The whole city is divided into 147 regions, the same as the number of nodes. In the network, only 972 edges are detected, which is lower than the total possible connectivity. There are three reasons for this. The first is that not all pairs of regions are directly connected by public transport. The second is that some remote regions can be accessed by other public transportation modes that are not recorded in our smart card data source. Third, the terrain could be an influential factor, as some features, such as mountains and rivers, form natural obstacles to setting up public transport. It is similar to the 328 counties distribution.
Two kinds of connection patterns are important for understanding the elderly connectivity: connections within each region and the connections between regions. In this network analysis, the total number of connections between each pair of regions is taken to represent the strength of the connectivity between regions, while loops represent the total number of connections within each region. The connectivity of the Voronoi diagram is unbalanced. Compared with the spatial distribution of administrative counties, detailed information is displayed with an increased number of regions. Beijing is an ancient city with a long history; with the ongoing development of urbanization, public facilities and commercial centers are blossoming in the Forbidden City at the heart of Beijing and are gradually spreading outward. This will lead to unbalanced urban development with respect to the areas where the elderly take part in activities.
Figure 9 is the visualization result of connecting the pair of regions with the strength value. The black circular lines indicate the Second to Sixth Ring Road. The color variations from blue to red indicate the strength level, from low to high. The grey lines stand for the number of the elderly travels between the two regions. We divide them into high level and low level. The grey straight lines mean there is a large number of the elderly traveling between two regions; the grey broken lines show the opposite. We can see that regions with high strength have high connectivity with each other. Similar to the elderly cardholders’ distribution, high-strength regions and connectivity are located at the center of the city, which shows clearly a cluster pattern and unbalanced distribution.
Figure 10 shows the connectivity and strength distributions in 328 administrative counties. To better present the detailed information, the distributions are shown separately. The left figure is the strength distribution and the right one is another. For the perspective of the elderly travel number from the left figure, most regions with a large elderly travel number are located in the west and north of the center areas. The right of the figure shows the OD pair numbers of the elderly traveling between regions. Within the 6th ring road, in the north and west, the travel pairs are larger than in the south and east regions. The two figures represent a similar travel pattern of the elderly cardholders.
The connectivity between the elderly’s living regions describes their travel frequency between regions. Many means of public transport, such as subways and buses, have priority seating for people with special needs. However, the traffic flow is so huge in this large city that it may be not enough for the elderly. Considering their physical health and their low travel frequency, customized shuttle buses would be a good solution for the elderly. The transportation department should, thus, develop a special public transportation line and schedule that are in line with the connectivity results to make the elderly’s travel more convenient.
In this study, we proposed a quasi-gravity model, which was used to quantify the relationship between regions using the public facilities index. Three factors were imported into the model, as shown in Equation (3). The strength of the network was regarded as an indicator of mobility. The public facilities index corresponded to the POI indicator. The Euclidean distance was used to calculate the distance between two nodes, but the square of the distance may not be the optimal order for selection. We calculated the model in accordance with the Voronoi diagram.
To find the optimal parameters of this model, using estimated values of γ ranging from 2.6 to 3.0 as given in Table 3, the corresponding values of G were computed. According to the table, with increasing γ , the goodness-of-fit R2 first reaches a peak value of 0.3706, then decreases. We selected the fitness value of   γ as 2.8 and the value of G as equal to 970.
Finally, we selected the optimal model, which is represented as Equation (4):
S i j = 970 L _ I n d e x i   L _ I n d e x j D 2.8   i j ,   i = 0 , 1 , 2 , j = 0 , 1 , 2 ,
In summary, the mobility of the elderly cardholders in Beijing can be quantified with the quasi-gravity model above based on POI data and the distance between regions in the Voronoi diagram. We can conclude from the model that distance is not a major factor affecting the purposes of travel for elderly. Thus, if one region has a large public facilities index value while another has a small value, the strength between the two regions is unlikely to be affected, even if the distance between them is large. This motivates these elderly people to travel great distances to access high-quality public facility services, including shops for necessities.

6. Conclusions and Future Works

This paper presented a framework for studying the spatial distribution pattern of elderly cardholders to help address the issue of the population ageing, now and in the future. To detect the spatial distribution of the elderly cardholders, we took two steps: (a) a rule-based method for identifying the home locations of the elderly cardholders, and (b) a clustering method to construct the Voronoi diagram for city partition. To model the elderly mobility between regions in a city, a public facilities index model and a quasi-gravity model were proposed to measure the mobility of the elderly cardholders between regions. Five kinds of POI data, including restaurants, parks, hospitals, shops and stops, were identified as the key factors for the public facility index model. The connectivity model built a relationship between the public facility index and network strength for any two regions in terms of the constructed network.
Three findings arose from this study: (a) the spatial distribution of the elderly cardholders shows clear clustering characteristics; (b) the spatial distribution of the elderly has a strong relationship with that of public service facilities, such as restaurants and hospitals; and (c) the connectivity of each pair of regions is related to the distribution of public facilities in the connected regions. These findings are essential for urban planning, management and services, given the aging population trend worldwide.
A number of areas of this study can be further extended. First, the clustering method has to set the distance threshold manually and it does not consider the density of stops. Two drawbacks have to be improved in future work. Second, because of the limitations of smart card data, we only considered the public transport mode of bus in studying the spatial distribution of the elderly. Other transport modes, such as walking, bicycles and private cars, can be studied when all these datasets are available. Third, when multiple data sources are available, we can cross-check and validate the reliability of the identified spatial distribution pattern of the elderly population.

Author Contributions

Writing—original draft, Z.S.; validation, X.L.; resources, J.L.; data curation, C.T.; formal analysis, A.Z.; conceptualization, writing—review and editing, W.S. All authors have read and agreed to the published version of the manuscript.

Funding

This research was funded by Ministry of Science and Technology, National Key R&D Program of China: 2017YFB0503604, The Hong Kong Polytechnic University: ZVN6, National Natural Science Foundation of China (Project Number: 42101468).

Data Availability Statement

Not Applicable.

Conflicts of Interest

No potential conflict of interest was reported by the authors.

References

  1. United Nations. World Population Prospects 2019: Highlights (ST/ESA/SER.A/423); Department of Economic and Social Affairs, Population Division, United Nations: New York, NY, USA, 2019. [Google Scholar]
  2. Kim, S. Assessing mobility in an aging society: Personal and built environment factors associated with older people’s subjective transportation deficiency in the US. Transp. Res. Part F Traffic Psychol. Behav. 2011, 14, 422–429. [Google Scholar] [CrossRef]
  3. Burtless, G. The impact of population aging and delayed retirement on workforce productivity. In SSRN; Boston College: Chestnut Hill, MA, USA, 2013. [Google Scholar]
  4. Wong, R.; Szeto, W.; Yang, L.; Li, Y.; Wong, S. Public transport policy measures for improving elderly mobility. Transp. Policy 2018, 63, 73–79. [Google Scholar] [CrossRef] [Green Version]
  5. Boschmann, E.E.; Brady, S.A. Travel behaviors, sustainable mobility, and transit-oriented developments: A travel counts analysis of older adults in the Denver, Colorado metropolitan area. J. Transp. Geogr. 2013, 33, 1–11. [Google Scholar] [CrossRef]
  6. Wang, J.; Kong, X.; Xia, F.; Sun, L. Urban Human Mobility: Data-Driven Modeling and Prediction. ACM Sigkdd Explor. Newsl. 2019, 21, 1–19. [Google Scholar] [CrossRef]
  7. Mohamed, K.; Côme, E.; Oukhellou, L.; Verleysen, M. Clustering smart card data for urban mobility analysis. IEEE Trans. Intell. Transp. Syst. 2016, 18, 712–728. [Google Scholar]
  8. Beijing Committee on Aging. White Papers of Development of Aging Service and Care System Construction in Beijing; Beijing Committee on Aging: Beijing, China, 2018. [Google Scholar]
  9. Erwig, M. The graph Voronoi diagram with applications. Networks 2000, 36, 156–163. [Google Scholar] [CrossRef]
  10. Gonzalez, M.C.; Hidalgo, C.A.; Barabasi, A.-L. Understanding individual human mobility patterns. Nature 2008, 453, 779. [Google Scholar] [CrossRef]
  11. Long, Y.; Thill, J.-C. Combining smart card data and household travel survey to analyze jobs–housing relationships in Beijing. Comput. Environ. Urban Syst. 2015, 53, 19–35. [Google Scholar] [CrossRef] [Green Version]
  12. Jiang, S.; Ferreira, J.; Gonzalez, M.C. Activity-based human mobility patterns inferred from mobile phone data: A case study of Singapore. IEEE Trans. Big Data 2017, 3, 208–219. [Google Scholar] [CrossRef] [Green Version]
  13. Zhong, C.; Batty, M.; Manley, E.; Wang, J.; Wang, Z.; Chen, F.; Schmitt, G. Variability in regularity: Mining temporal mobility patterns in London, Singapore and Beijing using smart-card data. PLoS ONE 2016, 11, e0149222. [Google Scholar] [CrossRef] [Green Version]
  14. Sun, L.; Lee, D.-H.; Erath, A.; Huang, X. Using smart card data to extract passenger’s spatio-temporal density and train’s trajectory of MRT system. In Proceedings of the ACM SIGKDD International Workshop on Urban Computing, Beijing, China, 12 August 2012; pp. 142–148. [Google Scholar]
  15. Lee, K.-S.; Eom, J.K.; Lee, J.; Ko, S. Analysis of the Activity and Travel Patterns of the Elderly Using Mobile Phone-Based Hourly Locational Trajectory Data: Case Study of Gangnam, Korea. Sustainability 2021, 13, 3025. [Google Scholar]
  16. Barbosa, H.; Barthelemy, M.; Ghoshal, G.; James, C.R.; Lenormand, M.; Louail, T.; Menezes, R.; Ramasco, J.J.; Simini, F.; Tomasini, M. Human mobility: Models and applications. Phys. Rep. 2018, 734, 1–74. [Google Scholar] [CrossRef] [Green Version]
  17. Zou, Q.; Yao, X.; Zhao, P.; Wei, H.; Ren, H. Detecting home location and trip purposes for cardholders by mining smart card transaction data in Beijing subway. Transportation 2018, 45, 919–944. [Google Scholar] [CrossRef]
  18. Cui, J.; Loo, B.P.; Lin, D. Travel behaviour and mobility needs of older adults in an ageing and car-dependent society. Int. J. Urban Sci. 2017, 21, 109–128. [Google Scholar] [CrossRef]
  19. Truong, L.T.; Somenahalli, S.V. Exploring frequency of public transport use among older adults: A study in Adelaide, Australia. Travel Behav. Soc. 2015, 2, 148–155. [Google Scholar] [CrossRef]
  20. Shao, F.; Sui, Y.; Yu, X.; Sun, R. Spatio-temporal travel patterns of elderly people—A comparative study based on buses usage in Qingdao, China. J. Transp. Geogr. 2019, 76, 178–190. [Google Scholar] [CrossRef]
  21. Hu, X.; Wang, J.; Wang, L. Understanding the travel behavior of elderly people in the developing country: A case study of Changchun, China. Procedia Soc. Behav. Sci. 2013, 96, 873–880. [Google Scholar] [CrossRef] [Green Version]
  22. Liu, W.; Lu, H.; Sun, Z.; Liu, J. Elderly’s travel patterns and trends: The empirical analysis of Beijing. Sustainability 2017, 9, 981. [Google Scholar] [CrossRef] [Green Version]
  23. Zhang, Y.; Yao, E.; Zhang, R.; Xu, H. Analysis of elderly people’s travel behaviours during the morning peak hours in the context of the free bus programme in Beijing, China. J. Transp. Geogr. 2019, 76, 191–199. [Google Scholar] [CrossRef]
  24. Yang, L. Modeling the mobility choices of older people in a transit-oriented city: Policy insights. Habitat Int. 2018, 76, 10–18. [Google Scholar] [CrossRef]
  25. Szeto, W.; Yang, L.; Wong, R.; Li, Y.; Wong, S. Spatio-temporal travel characteristics of the elderly in an ageing society. Travel Behav. Soc. 2017, 9, 10–20. [Google Scholar] [CrossRef] [Green Version]
  26. Guo, S.; Song, C.; Pei, T.; Liu, Y.; Ma, T.; Du, Y.; Chen, J.; Fan, Z.; Tang, X.; Peng, Y. Accessibility to urban parks for elderly residents: Perspectives from mobile phone data. Landsc. Urban Plan. 2019, 191, 103642. [Google Scholar] [CrossRef]
  27. Cheng, L.; Chen, X.; Yang, S.; Cao, Z.; De Vos, J.; Witlox, F. Active travel for active ageing in China: The role of built environment. J. Transp. Geogr. 2019, 76, 142–152. [Google Scholar] [CrossRef]
  28. Titheridge, H.; Achuthan, K.; Mackett, R.; Solomon, J. Assessing the extent of transport social exclusion among the elderly. J. Transp. Land Use 2009, 2, 31–48. [Google Scholar] [CrossRef] [Green Version]
  29. Ahern, A.; Hine, J. Rural transport–Valuing the mobility of older people. Res. Transp. Econ. 2012, 34, 27–34. [Google Scholar] [CrossRef]
  30. Findlay, A.M.; Stockdale, A.; Findlay, A.; Short, D. Mobility as a driver of change in rural Britain: An analysis of the links between migration, commuting and travel to shop patterns. Int. J. Popul. Geogr. 2001, 7, 1–15. [Google Scholar] [CrossRef]
  31. Lin, T.G.; Xia, J.C.; Robinson, T.P.; Goulias, K.G.; Church, R.L.; Olaru, D.; Tapin, J.; Han, R. Spatial analysis of access to and accessibility surrounding train stations: A case study of accessibility for the elderly in Perth, Western Australia. J. Transp. Geogr. 2014, 39, 111–120. [Google Scholar] [CrossRef] [Green Version]
  32. Goins, R.T.; Williams, K.A.; Carter, M.W.; Spencer, S.M.; Solovieva, T. Perceived barriers to health care access among rural older adults: A qualitative study. J. Rural Health 2005, 21, 206–213. [Google Scholar] [CrossRef] [PubMed]
  33. Yuan, Y.; Yang, M.; Wu, J.; Rasouli, S.; Lei, D. Assessing bus transit service from the perspective of elderly passengers in Harbin, China. Int. J. Sustain. Transp. 2019, 13, 761–776. [Google Scholar] [CrossRef]
  34. Plazinić, B.R.; Jović, J. Mobility and transport potential of elderly in differently accessible rural areas. J. Transp. Geogr. 2018, 68, 169–180. [Google Scholar] [CrossRef]
  35. Sen, Z.; Ke, Z.; Xiaoyang, L.; Jian, Z.; Yan, L.; Lian, Z. Characterisation of elderly daily travel behaviour in Tianjin using a space–time cube. Environ. Plan. B Urban Anal. City Sci. 2021. [Google Scholar] [CrossRef]
  36. Azevedo, G.A.; Sampaio, R.R.; Nascimento Filho, A.S.; Moret, M.A.; Murari, T.B. Sustainable urban mobility analysis for elderly and disabled people in São Paulo. Sci. Rep. 2021, 11, 791. [Google Scholar] [CrossRef]
  37. Rocha, N.P.; Bastardo, R.; Pavão, J.; Santinha, G.; Rodrigues, M.; Rodrigues, C.; Queirós, A.; Dias, A. Smart Cities’ Applications to Facilitate the Mobility of Older Adults: A Systematic Review of the Literature. Appl. Sci. 2021, 11, 6395. [Google Scholar] [CrossRef]
  38. De Paiva, F.T.F.; Stival, M.M.; De Lima, L.R.; De Oliveira Silva, A.; De Sousa Barbalho, Y.G.; Da Costa, M.V.G.; Da Silva, I.C.R.; Funghetto, S.S. Predictive factors for reduced functional mobility in elderly diabetics and non-diabetics. Int. J. Diabetes Dev. Ctries. 2021, 41, 314–321. [Google Scholar] [CrossRef]
  39. Masoumi, S.; Emami, A.; Mirsaeedie, L. Elderly Mobility and Architectural Factors in Apartment Units: A Hierarchical Regression Analysis. J. Aging Environ. 2021, 35, 273–294. [Google Scholar] [CrossRef]
  40. Zhao, P.; Yu, Z. Investigating mobility in rural areas of China: Features, equity, and factors. Transp. Policy 2020, 94, 66–77. [Google Scholar] [CrossRef]
  41. Taghinejad, H.; Abdi, A.; Kikhavani, S.; Ebrahimi, A. Assessment of care needs of the elderly living in Kermanshah province in 2020. Med. Sci. 2021, 25, 1955–1962. [Google Scholar]
  42. Barry, J.J.; Newhouser, R.; Rahbee, A.; Sayeda, S. Origin and destination estimation in New York City with automated fare system data. Transp. Res. Rec. 2002, 1817, 183–187. [Google Scholar] [CrossRef]
  43. Johnston, K.; Ver Hoef, J.M.; Krivoruchko, K.; Lucas, N. Using ArcGIS Geostatistical Analyst; Esri Redlands: New York, NY, USA, 2001; Volume 380. [Google Scholar]
  44. Long, Y.; Shen, Z. Discovering functional zones using bus smart card data and points of interest in Beijing. In Geospatial Analysis to Support Urban Planning in Beijing; Springer: Berlin/Heidelberg, Germany, 2015; pp. 193–217. [Google Scholar]
  45. Hu, Y.; Han, Y. Identification of Urban Functional Areas Based on POI Data: A Case Study of the Guangzhou Economic and Technological Development Zone. Sustainability 2019, 11, 1385. [Google Scholar] [CrossRef] [Green Version]
  46. Fortune, S. A sweepline algorithm for Voronoi diagrams. Algorithmica 1987, 2, 153. [Google Scholar] [CrossRef]
Figure 1. Analytics framework of the spatial distribution patterns of the elderly cardholders.
Ijgi 10 00728 g001
Figure 2. The flowchart of the home location detection algorithm.
Ijgi 10 00728 g002
Figure 3. Process of the clustering method to construct Voronoi diagram (a) shows the bus stops’ distribution of Beijing, (b) shows the cluster results of bus stops, (c) shows the center points of each cluster by red points, (d) shows the Voronoi diagrams that are constructed by using the center points of clusters as the seed points.
Ijgi 10 00728 g003
Figure 4. Spatial population distribution of the elderly in Beijing from statistical data [8].
Ijgi 10 00728 g004
Figure 5. Home location detection distribution of the elderly cardholders.
Ijgi 10 00728 g005
Figure 6. Space partitioning by Voronoi diagram.
Ijgi 10 00728 g006
Figure 7. Home location detection distribution of the elderly cardholders in (a) 147-polygon Voronoi diagram and (b) 328 counties.
Ijgi 10 00728 g007
Figure 8. Public facilities index distribution in (a) 147-polygon Voronoi diagram, (b) 328 counties.
Ijgi 10 00728 g008
Figure 9. Connectivity and strength in Voronoi diagram.
Ijgi 10 00728 g009
Figure 10. Strength (a) and connectivity (b) distributions in 328 counties.
Ijgi 10 00728 g010
Table 1. Pearson correlation coefficient and p value between POI and the elderly cardholders in Voronoi diagram and 328 counties.
ShopParkRestaurantHospitalStop
Voronoi diagramr0.9240.6860.9410.9210.996
p value0.0000.0000.0000.0000.000
328 countiesr0.6770.3490.7080.6050.899
p value0.0000.0000.0000.0000.000
Table 2. Overall network properties of Voronoi diagram and 328 counties.
147 Voronoi Diagrams328 Counties
Nodes147328
Edges9725260
Average degree2574
Average strength20,63317,913
Graph density0.090.15
Table 3. Parameter results of developed model.
G γ R 2  
(a)1562.60.3694
(b)389.42.70.3703
(c)9702.80.3706
(d)24122.90.3702
(e)59883.00.3692
Publisher’s Note: MDPI stays neutral with regard to jurisdictional claims in published maps and institutional affiliations.

