Article

Detection of Schools in Remote Sensing Images Based on Attention-Guided Dense Network

1
Key Laboratory of Digital Earth Science, Aerospace Information Research Institute (AIR), Chinese Academy of Sciences, Beijing 100094, China
2
University of Chinese Academy of Sciences, Beijing 100049, China
*
Author to whom correspondence should be addressed.
ISPRS Int. J. Geo-Inf. 2021, 10(11), 736; https://doi.org/10.3390/ijgi10110736
Submission received: 1 September 2021 / Revised: 15 October 2021 / Accepted: 25 October 2021 / Published: 29 October 2021

Abstract

:
The detection of primary and secondary schools (PSSs) is a meaningful task for composite object detection in remote sensing images (RSIs). As a typical composite object in RSIs, PSSs have diverse appearances with complex backgrounds, which makes it difficult to effectively extract their features using the existing deep-learning-based object detection algorithms. Aiming at the challenges of PSSs detection, we propose an end-to-end framework called the attention-guided dense network (ADNet), which can effectively improve the detection accuracy of PSSs. First, a dual attention module (DAM) is designed to enhance the ability in representing complex characteristics and alleviate distractions in the background. Second, a dense feature fusion module (DFFM) is built to promote attention cues flow into low layers, which guides the generation of hierarchical feature representation. Experimental results demonstrate that our proposed method outperforms the state-of-the-art methods and achieves 79.86% average precision. The study proves the effectiveness of our proposed method on PSSs detection.

1. Introduction

As a fundamental and meaningful task, object detection has always been a hot topic in remote sensing images’ interpretation. With the rapid development of earth observation technology, it has become easier to obtain more high-resolution remote sensing images (RSIs), which brings a strong requirement for the intelligent extraction of remote sensing image information.
Over the past years, deep-learning-based methods have achieved great performance in the field of computer vision [1,2,3,4,5,6,7], which have proved to be very successful tools for the intelligent extraction of big data. Therefore, many researchers have devoted themselves to the research of object detection in RSIs based on deep learning and achieved good results [8,9,10,11]. However, most of these methods are designed for single objects with regular geometric appearance and structure such as ships, vehicles, and airplanes.
In fact, most objects in RSIs have a diverse spatial appearance and component structure. They are characterized by combinations of multiple objects and have rich natural and social attributes [12], such as airports, thermal power plants, and schools. Composite object detection plays an important role in the application of RSIs [13]. However, these composite objects face the problems of the diversity and complexity of characteristics, environmental interference, limitation of training samples, and so on. Methods designed for single objects may not be completely suitable for composite objects detection [13,14]. Therefore, some scholars have dedicated themselves to the research of composite object detection. For airport detection, Cai et al. [15] and Li et al. [16] used hard example mining to improve the detection rate. Xu et al. [17] built a cascade region proposal network (RPN) to effectively reduce the false samples. Zeng et al. [18] extracted airport candidate regions with prior knowledge, such as excluding nonground regions, block segmentation, and setting threshold values of airport regions. However, these methods only use traditional convolutional neural networks (CNNs), which have limitations in feature representation. Sun et al. [13] and Yin et al. [14] proposed a part-based detection network to detect distinctive components of objects, which is effective for complex composite object detection. According to the research mentioned above, existing studies mostly focus on large composite objects which are in large remote sensing scenes. These methods have not considered composite objects like primary and secondary schools (PSSs), which have various appearances in different scales and regions. Additionally, the size of PSSs is relatively smaller and the internal parts of PSSs are more compact compared to airports and thermal power plants. Therefore, it may be difficult to learn discriminative features only using the traditional CNN, and the part-based method may not be suitable for PSSs detection.
Compared with airports and thermal power planets shown in Figure 1, PSSs in China have diverse spatial patterns in different scales. PSSs usually consist of a field or a vacant lot surrounded by some buildings, and have relatively clear boundaries. The small schools only contain one field and a building, and the large schools contain more buildings. Figure 2 displays some samples of PSSs in different regions. In urban regions, PSSs usually include plastic tracks and fields, and are surrounded by neat and uniform residential areas; but in remote regions, some fields are made of cement and loess, and PSSs are surrounded by cluster cottages, farmlands, or mountains. In most cases, the internal parts of PSSs are compact and diverse. Although PSSs have relatively fixed boundaries, they are generally distributed in a clustered surrounding and the internal parts can easily be confused by complex background. Due to the above-mentioned characteristics of PSS, it is very challenging to detect PSSs in RSIs.
PSSs detection also plays an important role for applications in remote sensing image interpretation. Education is essential to the development of countries and regions. With the popularization of compulsory education policies, China’s basic education has entered a new stage. The level of basic education reflects the regional education situation to some extent, which is of practical significance to the regional economic and social development and the improvement of living standards. Primary and secondary education represents the level of basic education of cities and regions, and PSSs are important places for minors to receive an education. As important basic education facilities, the number and distribution of PSSs are important factors to be considered in urban planning and regional evaluation. In addition, with the rapid development of remote sensing technology, a large number of high-resolution RSIs are obtained, which contain abundant spatial information, clear and detailed textural features, and topological relationships. Studying the PSSs detection in RSIs can achieve the development characteristics including quantity and distribution of PSSs in real-time. Therefore, the detection of PSSs is a meaningful but challenging task.
To tackle the above problems, we propose an end-to-end detection framework named the attention-guided dense network (ADNet), which is based on Faster R-CNN. Different from the classical Faster R-CNN, the proposed ADNet can produce more salient information and further enhance the discriminative ability of multi-level feature representation. The dual attention module (DAM) firstly makes the high-level features more discriminative. Then the attention cues flow into each pyramid layer of the dense feature fusion module (DFFM). Guided by the attentive results, the dense feature fusion structure can obtain hierarchical feature representation with enhanced discriminative ability and precisely detect objects at different scales and sizes.
The main contributions of our work are summarized as follows:
  • We propose an end-to-end detection framework called ADNet for PSSs detection. The attention-guided feature fusion structure can learn discriminative features of objects and then transmit the critical information of objects to each feature pyramid layer. The proposed ADNet has better robustness through the attention-guided structure and dense feature fusion strategy, which is more effective for PSSs detection in RSIs.
  • A dual attention module (DAM) is designed to produce stronger semantic information and further strengthen the feature representation. The DAM can explicitly model channel-wise relationship and spatial-wise relationship, and be further combined with raw features using residual structure to obtain enhanced feature maps. Simultaneously, the attention information is used to guide the subsequent multi-level feature fusion.
  • A dense feature fusion module (DFFM) is designed for transmitting the powerful semantic information to other layers and promoting multiple features fusion. The dense feature fusion strategy can better utilize multilevel features and further tackle the problem of scale variation.
  • To the best of our knowledge, this is the first time to realize PSSs detection with an accuracy of 79.86%. The proposed method in this article has practical significance for PSSs detection in RSIs.
The remainder of this paper is organized as follows: Section 2 introduces the proposed method in detail, including the basic network, dual attention module, and dense feature fusion module. The experimental procedures and results are presented and analyzed in Section 3 and Section 4, respectively. Section 5 discusses the results of the proposed method. Finally, the conclusions of this paper and future works are presented in Section 6.

2. Proposed Method

The overall framework of our proposed ADNet for PSSs detection is illustrated in Figure 3, which is built on Faster R-CNN [3].
Given the difficulty of composite object detection in RSIs, it is far from sufficient to apply an object detection model designed for natural images to the detection task of RSIs. Therefore, we design a novelty network with the goals of extracting more discriminative features and improving scale-varying objects’ detection performance. Different from basic Faster R-CNN architecture, our proposed ADNet has two novel components: (1) dual attention module (DAM) that that captures powerful attentive information and produces the features with stronger discriminative ability; (2) dense feature fusion module (DFFM) that exploits rich attentive information and better combines different feature representation levels. Different from traditional conventional feature encoders and decoders, the attention-guided structure can extract more salient feature representations while fusing the features between different scales gradually. The DAM generates an enhanced attention map, which is further combined with raw features using residual structure. A dense feature fusion strategy is used for better utilizing high-level and low-level features. In this way, the attention cues can flow into low-level layers to guide the subsequent multi-level feature fusion. The whole network can obtain the hierarchical and discriminative feature representations for subsequent classification and bounding box regression. In later parts, we will introduce the Backbone Feature Extractor, Dual Attention Module, and Dense Feature Fusion Module.

2.1. Backbone Feature Extractor

ResNet [19] can solve the problem of network degradation by adding a residual module and now has been widely used in convolutional neural networks (CNNs). Compared with ordinary CNN without residual modules, a ResNet has better convergence and is easier to optimize, which can greatly improve the accuracy of training and prediction. Therefore, convolutional layer “conv2_x”, “conv3_x”, “conv4_x”, and “conv5_x” in ResNet-101 are extracted as four source feature layers. The four feature layers denote C2, C3, C4, and C5, respectively. The sizes of feature maps are {1/4,1/8,1/16,1/32} corresponding to the input image. The details of the convolution layers are shown in Figure 4.

2.2. Dual Attention Module

When scanning an image, people can quickly obtain the target area that needs to be focused on, and invest more attention in the area for obtaining more details and suppressing other useless information. The attention mechanism in deep learning is like the human vision system, whose core goal is to select the information critical to the task from a large amount of information [20]. Attention mechanism applied in computer vision tasks has proved that it is highly efficient for feature extraction and machine learning [21,22].
As discussed before, enabling the features to focus on target-related regions and reducing the feature redundancy are essential for PSSs detection. Therefore, we design a dual attention module (DAM) in the process of feature encoder, integrating inter-channel and inter-spatial features to suppress less useful information and retain strong semantic information. The DAM contains two types of attention branches: channel attention branch (CAB) and spatial attention branch (SAB), as shown in Figure 5. The parallel branches can effectively separate features in different feature spaces and improve the discriminative ability of the model. The ∊ module is combined with raw features by residual block to obtain enhanced feature maps.
Given an input feature map° F R H × W × C , the final output F R H × W × C in a residual block can be summarized as
F = F c o n v ( [ F A c ( F ) ; F A s ( F ) ] ) ,
where ⊗ denotes element-wise multiplication and ⊕ denotes element-wise summation. A c ( F ) and A s ( F ) denote the channel feature descriptor and the spatial feature descriptor, respectively. We left out the initial convolution operation in the formula.
CAB pays attention to the inter-channel relationships of feature maps. It also uses global max-pooling (GMP) for generating another important channel attention feature, which is different from the SE-Net [21] that only uses global average pooling (GAP). The c m a x R 1 × 1 × C and c a v g R 1 × 1 × C undergo two full-connection (FC) layers followed by the element-wise summation operation and the sigmoid gating to yield the channel feature descriptor A c ( F ) R 1 × 1 × C . The channel attention is computed as
A c ( F ) = s i g m o i d ( F C 2 ( F C 1 ( G A P ( F ) ) ) F C 2 ( F C 1 ( G M P ( F ) ) ) ) ,
Unlike channel attention, spatial attention focuses on exploiting the inter-spatial dependencies of feature maps. It uses average pooling and max pooling operations to compress the input feature maps F R H × W × C along channel dimensions. It can obtain global context information and highlight useful information by applying both average pooling and max pooling operations. Then, the outputs are concatenated to generate an efficient feature map. Finally, a standard convolution layer followed by the sigmoid function is used to generate a spatial attention descriptor A s ( F ) R H × W × 1 . The spatial attention is computed as
A s ( F ) = s i g m o i d ( c o n v ( [ G A P ( F ) ; G M P ( F ) ] ) ) ,
To verify the effects of global average pooling and global max-pooling in CAB, we conduct ablation studies in Section 4.2.

2.3. Dense Feature Fusion Module

Although the output of DAM can capture critical information of objects, it still lacks detailed features from shallow layers, such as edges and unique textures. Therefore, we employ a dense feature fusion strategy to link the shallow layer and deep layer and produce salient predictions at different scales. Different from traditional FPN [4], this feedforward cascade architecture allows each feature pyramid map to make full use of the previous high-level semantic features. The high-level and low-level features are all utilized for further enhancing the representation of feature pyramid maps. In addition, the attention cues derived from DAM flow into each pyramid layer. In this way, high-level semantic information could be propagated as useful guidance to enhance low-level features.
Each pyramid layer P i R H × W × 256 obtains two parts: one is the convolutional layer C i R H × W × 256 after dimensional reduction of the raw convolution layer C i R H × W × C , and the other is the high-level feature map P x :
P i = [ ( P 5 ) , , ( P i + 1 ) ] C i ,
where [ P 5 , , P i 1 ] refers to the concatenation of the high-level pyramid layers, and (·) refers to the operation of up-sampling. Finally, the pyramid layers are added to the convolutional layer at the element level. Figure 6 shows the structure of the proposed DFFM, which takes F3 as an example.

3. Experiments

3.1. Datasets

Gaofen (GF) satellites are a series of Chinese high-resolution earth observation satellites, which are of great significance to the research of RSIs in China. The GF satellite slice images used in our study are the fusion data of GF-1 and GF-6 from “the Strategic Priority Research Program of the Chinese Academy of Sciences”, with a spatial resolution of 2 m. The study area is the Beijing-Tianjin-Hebei region, as shown in Figure 7. Due to the problems such as labor cost, we chose PSSs of eight cities in the Beijing-Tianjin-Hebei region as samples (including 1497 images). In the future, we will collect more data to build a more complete dataset.
PSSs in China usually include a field or a vacant lot surrounded by some independent buildings and have a relatively clear boundary, which is easy to be distinguished from its surrounding buildings. The size of the PSSs usually ranges from 50 m × 50 m to 200 m × 200 m, and the area is smaller than that of universities.
Considering the size of the PSSs and the GPU computational resources, we set the crop size to 512 × 512 pixels. We crop the samples from the GF slice images and obtain 1497 samples. Among them, 1196 images are used as the training set, and the last 301 images are used as the test set. For enhancing the generalization ability of the model, we use three augmentation methods including color change, flip, and rotation, to extend the sample dataset. In addition, two data enhancement methods are used for creating more small and big objects. Small PSSs with areas of less than 50 × 50 pixels are cropped and enlarged, which is called “zoom in”, and big PSSs whose areas are greater than 100 × 100 pixels are resized to smaller ones, which is called “zoom-out”. For detection, the clearer objects are, the easier the features are to learn, so we set the ratios of zoom in and out to be 2 and 0.5 respectively. Finally, the number of training samples is 4959.

3.2. Experiments Design

3.2.1. Training Configuration

Our network is trained in the TensorFlow framework on NVIDIA TiTan with CUDA 10.1. In this study, the batch size is set to 1, the stochastic gradient descent (SGD) is used as an optimizer, with a momentum of 0.9 and weight decay of 0.0005. The initial learning rate is set to 0.001, then becomes 0.0001 for 50,000 iterations and becomes 0.00001 for 70,000 iterations. The number of training iterations is set to 90,000.

3.2.2. Anchor Parameters

The schools in RSIs have different sizes, corresponding to different areas of the surrounding boxes. In the RPN method proposed by Faster R-CNN, the ratio and scale parameters of anchors are set to [0.5,1,2]. For PSSs detection, appropriate anchor parameters can be used as the references of proposals, which is beneficial for model training. In our study, we use the K-Means ++ algorithm and statistical methods to analyze the ratio and size of bounding boxes. The results guide us to design the initial anchor parameters that are more suitable for training.
The K-Means ++ algorithm is based on a classical cluster analysis algorithm of K-Means. The difference between the two algorithms is the choice of the initial center. In the K-Means algorithm, k data are randomly selected from the dataset as the initial centers. However, in the K-Means ++ algorithm, k initial centers that are as far away from each other as possible are selected as initial centers from the dataset through iterations, and the K-means algorithm is finally used for clustering.
We select k = 5 to cluster the heights and widths of training samples, which are shown in Figure 8a. In addition, we calculate the aspect ratios of bounding boxes, shown in Figure 8b. From the Figure 8, we can see that the heights/widths of the bounding boxes are basically between 50 and 200, and the aspect ratios are between 0.3 and 2. Based on the results of the K-Means ++ algorithm and statistical analysis, we set the size of basic anchors to [32,64,128,256], and the ratios of anchors to [0.5,0.7,0.9,1.2,1.6]. Particularly, each layer of the pyramid network generates proposals, therefore, there is no need to set up multi-scale anchors.

3.2.3. Evaluation Metrics

We employ the average precision (AP) to quantitatively evaluate the performance of our proposed method. In addition, we analyze the precision rate and recall rate of different methods at different score thresholds.
True positive (TP) denotes the number of positive examples that are correctly classified. False positive (FP) denotes the number of positive examples that are incorrectly classified. And False negative (FN) denotes the number of negative examples that are incorrectly classified. The precision and recall of detection results are calculated as
r e c i s o n = T P T P + F P   ,
R e c a l l = T P T P + F N ,
Ideally, the precision rate is as high as the recall rate, but the two values are contradictory in some cases. The results of detection provide the object confidence (0–1), which represents the probability that the detected object is a positive sample. Precision rate and recall rate are different at each threshold of confidence. Thus, it is very helpful for evaluating the performance of models by analyzing the relationship of precision rate and recall rate in different cases.
Precision-Recall (PR) curve represents the relationship between precision rate and recall rate. The AP can be considered as the area under the PR curve, given as below:
A P = 0 1 p r e c i s i o n ( r e c a l l ) d ( r e c a l l ) ,

4. Results

4.1. Effect of Scale Variation of Training Samples

We conduct several experiments to verify the effects of the operations of zoom in and out. The scale variation of training samples may lead to different detection results on the same test set, as shown in Table 1. It can be seen that the accuracy of the model can be increased by nearly 4.12% in total under all operations. At the same time, the AP of the model increases by 1.2% with the zoom-in operation, and 0.8% with the zoom-out operation. The comparative results illustrate that changing the scale of images in the training stage could affect the performance of the model to some extent.

4.2. Ablation Studies on Different Structures

We experimentally demonstrate the effect of using both average pooling and max pooling in CAB. Experimental results with different pooling methods are reported in Table 2. It illustrates that using both average pooling and max pooling in CAB can improve the performance of the model. GAP captures the global information of channel attention maps, and GMP captures the high response of the channel attention maps. Therefore, extracting the salient features of the channel can compensate for the miss of the average pooling operation.
We also perform four sets of ablation studies on the test set, for exploring the effects of DAM and DFFM. Based on Faster R-CNN, we gradually introduce the two modules and compute the AP of each test experiment. Table 3 reports the detection accuracy. In the table, the Faster R-CNN with all modules achieves the best performance, which is highlighted in bold. It displays that the addition of DAM can improve the detection accuracy by 7.10%. When building the DFFM, we achieve a 6.59% AP gain against Faster R-CNN. It is confirmed that DAM and DFFM can improve the performance of the model to some extent.
The visual comparisons of Faster R-CNN and ADNet are shown in Figure 9. The first row shows that our proposed method can accurately locate the objects and has a superior ability to distinguish the differences between PSSs and other buildings. However, Faster R-CNN mistakenly identifies some buildings and facilities as PSSs despite detecting some true samples. In the second row, Faster R-CNN cannot effectively detect all of PSSs. The smaller objects may be difficult to detect by the Faster R-CNN method. In addition, Faster R-CNN can only roughly detect some parts of the PSSs in some cases, as shown in the third row. On the contrary, our proposed method can accurately and completely detect the different samples of PSSs.
The experiment results show that Faster R-CNN cannot locate the PSSs well in some cases. When employing attention mechanisms and a dense feature fusion strategy, our proposed ADNet can effectively identify and locate the PSSs even under messy backgrounds. These ablation results demonstrate that the modules designed can obtain more discriminative features and precisely detect objects at different scales and sizes.

4.3. Comparison with Other Methods

The relationship between the precision rate and recall rate at different score thresholds is depicted in Figure 10. The score threshold is gradually increased from 0.5 to 0.95, and the precision rate and recall rate are recorded under different thresholds. It reveals the negative correlation between precision rate and recall rate. A lower threshold leads to a higher recall rate but a lower precision rate. On the contrary, a higher threshold, such as 0.95, results in a higher precision rate but a lower precision. The comparative results reveal that the precision rate and recall rate of the ADNet exceed Faster R-CNN. However, it demonstrates that the single score threshold cannot evaluate the performance of the of the model well. Therefore, it is necessary to compute the mean value of the precision rate over different recall rates.
We conduct some comparisons between our proposed method and two-stage detector (Faster R-CNN [3], FPN [4]), multi-stage detector (Cascade R-CNN [23]), and anchor-free detector (FSAF [24]) on the same training set, shown in Table 4. All methods are implemented using the ResNet-101 network. Compared with the different original object detection methods, our proposed method obtains the best mean AP of 79.86%, which achieved increases by 10.14%, 6.52%, 7.22%, and 5.26% over the existing methods, respectively. Figure 11 presents some detection results of ADNet on the test set. All results convincingly illustrate that the ADNet can exclude the false positives and locate precisely the PSSs from the complex background. In addition, PSSs of different regions and scales can be detected correctly.

4.4. Visualization of Heatmaps

To more intuitively illustrate the effects of DAM, we apply the Grad-CAM [25] on the output of DAM. Grad-CAM is a visualization method, which is used for highlighting the critical information of feature maps by using gradients.
The input images, visual results of C5 and visual results of the output of DAM are shown in Figure 12, respectively. We can clearly see that the output of DAM covers the salient regions of PSSs. In some cases, the baseline network cannot capture critical information in complex environments. It is obvious that the attention module can obtain critical information and guide the ADNet to obtain more discriminating features. Therefore, the ADNet with DAM can learn the common characteristics of the objects and distinguish them from the complex background.

5. Discussion

In our experiments, we develop a novel method for PSSs detection. Based on the detection results, our proposed method is more accurate than classical deep learning detectors.
The comparative experiments in Table 1 indicate that creating more small and big samples is beneficial for model training. PSSs in RSIs have various appearances at different scales. Due to the limitation of samples, it may lead to class imbalance at different scales. Adding more small and big objects can both expand the number of PSSs at different scales and enhance the feature representation of the small objects, which can improve the feature learning ability of the model. In the field of composite object detection in RSIs, appropriate data augmentation methods can produce a more complex representation of data, thus reducing the gap between the test set and training set and improving the generalization ability of the model.
Composite objects in RSIs have diverse appearances and complex internal structures. Obtaining critical information and eliminating background interference are essential for composite object detection. The visualization of heatmaps verifies that the attention mechanism can learn a critical set of features that is beneficial for locating objects. It can also be seen that traditional convolutional neural networks are difficult to learn discriminative features in some cases. In addition, the comparative results of Faster R-CNN and ADNet indicate that the proposed attention-guided dense structure can effectively improve detection accuracy.
The analysis of experimental results and visualization results demonstrate that the proposed method can obtain more critical information of PSSs and get rid of complex background information, which is helpful to identification and localization. However, there still exist some problems with PSSs detection. We discuss some failure cases of our proposed ADNet in Figure 13. The ground truth, detection results, false positives, and false negatives are marked in green, red, blue, and orange rectangles, respectively. For some great challenging examples, our method still cannot obtain perfect results.
(1)
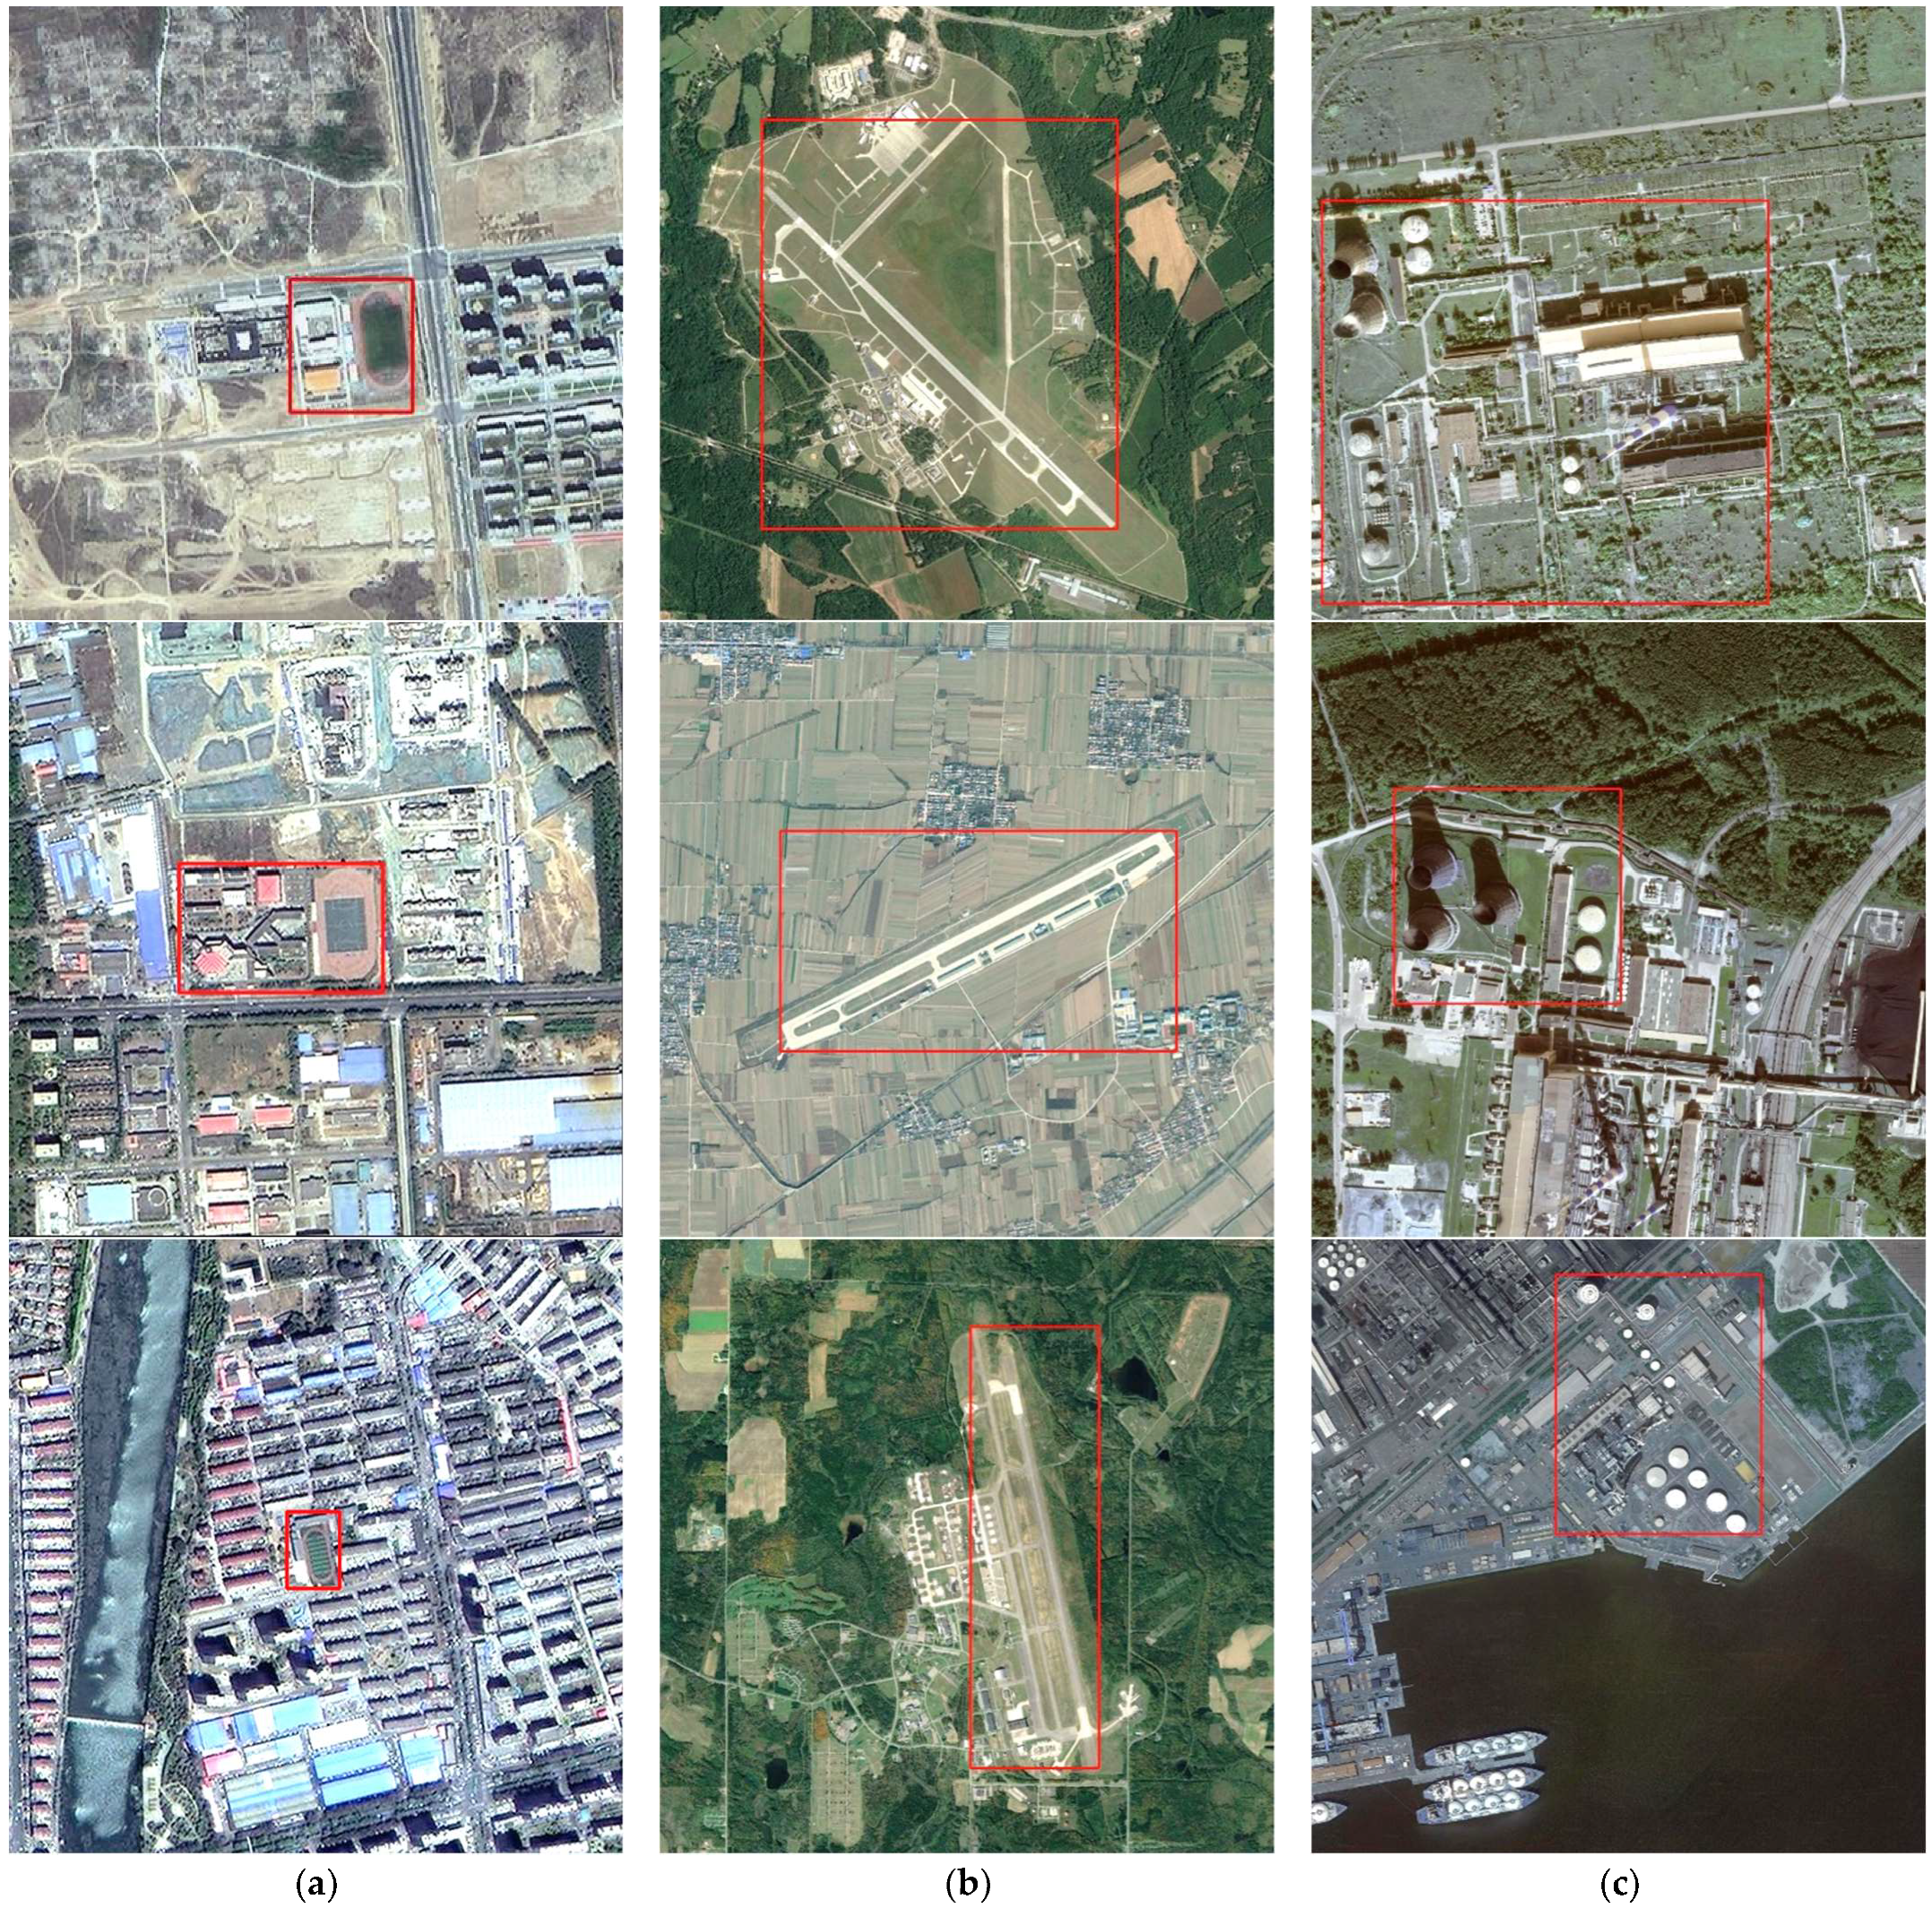
It is still challenging for our method to well distinguish the PSSs from the surrounding backgrounds and buildings with high appearance similarity. For example, in Figure 13a,b, some buildings and other facilities have similar characteristics to that of the PSSs. It would be more promising to explore a better learning strategy for building intra-class semantic dependencies.
(2)
It is still challenging for our method to deal with unclear objects. For example, in Figure 13c, the characteristics of some schools in remote regions are not salient. In Figure 13d, the small schools have unclear characteristics, which are hard to be accurately recognized. For future work, using higher-resolution remote sensing images could effectively solve these problems.
In the future, more attempts could be made to learn deep features in a weakly supervised or semi-supervised way, thus avoiding the problems raised by the limitation annotated samples. Furthermore, RSIs record the electromagnetic radiation information of geospatial objects, which reflects the properties of objects. Learning the spectral information of RSIs using deep learning algorithms may be another way to achieve complex object detection in RSIs.

6. Conclusions and Future Work

In this study, we proposed an effective method named ADNet, for achieving the automatic detection of PSSs. Our methods can enhance the discriminative ability of feature representation, and obtain enough critical information, by establishing an attention-guided dense feature pyramid network. The DAM can integrate spatial and channel information, enhance the ability in representing complex characteristics and alleviate distractions in the background. Guided by the attention module, the DFFM can not only integrate the multi-scale information but also transmit the attentive cues to low-level layers. The experimental results and ablation studies demonstrate that our proposed method outperforms the classical object detection algorithms, and could significantly improve the detection accuracy of PSSs. In the future, we will add more samples to enhance the generalization and robustness of the model. Furthermore, we will design a more efficient model for PSSs detection.

Author Contributions

Methodology, Han Fu, Xiangtao Fan, Zhenzhen Yan and Xiaoping Du; Zhenzhen Yan and Xiaoping Du contributed to the conception of the study, and performed the analysis with constructive discussions; Han Fu performed the experiments and processed the data, and wrote the original manuscript, and then reviewed and edited by Xiangtao Fan, Zhenzhen Yan and Xiaoping Du; Funding acquisition, Xiangtao Fan, Zhenzhen Yan and Xiaoping Du. All authors have read and agreed to the published version of the manuscript.

Funding

This research was funded by the Strategic Priority Research Program of the Chinese Academy of Sciences, grant number XDA 19080101, XDA 19080103; the National Natural Science Foundation of China, grant number 41974108; Innovation Drive Development Special Project of Guangxi, grant number GuikeAA20302022.

Institutional Review Board Statement

Not applicable.

Informed Consent Statement

Not applicable.

Data Availability Statement

The test dataset presented in this study are available on request from the corresponding author. And the relevant code will be publicly available at https://github.com/AIRCAS-FU accessed on 1 September 2021.

Acknowledgments

The authors are grateful for the anonymous reviewers’ critical comments and constructive suggestions.

Conflicts of Interest

The authors declare no conflate of interest.

References

  1. Girshick, R.; Donahue, J.; Darrell, T.; Malik, J. Rich feature hierarchies for accurate object detection and semantic segmentation. In Proceedings of the 2014 IEEE Conference on Computer Vision and Pattern Recognition, Columbus, OH, USA, 24–27 June 2014; pp. 580–587. [Google Scholar]
  2. Girshick, R. Fast r-cnn. In Proceedings of the IEEE International Conference on Computer Vision, Santiago, Chile, 7–13 December 2015; pp. 1440–1448. [Google Scholar]
  3. Ren, S.; He, K.; Girshick, R.; Sun, J. Faster r-cnn: Towards real-time object detection with region proposal networks. IEEE Trans. Pattern Anal. Mach. Intell. 2017, 39, 1137–1149. [Google Scholar] [CrossRef] [Green Version]
  4. Lin, T.-Y.; Dollár, P.; Girshick, R.; He, K.; Hariharan, B.; Belongie, S. Feature pyramid networks for object detection. IEEE Conf. Comput. Vis. Pattern Recognit. 2017, 936–944. [Google Scholar]
  5. Liu, W.; Anguelov, D.; Erhan, D.; Szegedy, C.; Reed, S.; Fu, C.-Y.; Berg, A.C. SSD: Single shot multibox detector. In Proceedings of the Computer Vision; Leibe, B., Matas, J., Sebe, N., Welling, M., Eds.; Springer International Publishing: Cham, Switzerland, 2016; pp. 21–37. [Google Scholar]
  6. Redmon, J.; Divvala, S.; Girshick, R.; Farhadi, A. You only look once: Unified, real-time object detection. In Proceedings of the 2016 IEEE Conference on Computer Vision and Pattern Recognition (CVPR), Las Vegas, NV, USA, 27–30 June 2016; pp. 779–788. [Google Scholar]
  7. Redmon, J.; Farhadi, A. YOLOv3: An incremental improvement. arXiv 2018, arXiv:1804.02767. [Google Scholar]
  8. Cheng, G.; Zhou, P.; Han, J. Learning rotation-invariant convolutional neural networks for object detection in vhr optical remote sensing images. IEEE Trans. Geosci. Remote Sens. 2016, 54, 7405–7415. [Google Scholar] [CrossRef]
  9. Tang, T.; Zhou, S.; Deng, Z.; Lei, L.; Zou, H. Arbitrary-oriented vehicle detection in aerial imagery with single convolutional neural networks. Remote Sens. 2017, 9, 1170. [Google Scholar] [CrossRef] [Green Version]
  10. Chen, Z.; Zhang, T.; Ouyang, C. End-to-end airplane detection using transfer learning in remote sensing images. Remote Sens. 2018, 10, 139. [Google Scholar] [CrossRef] [Green Version]
  11. Ma, W.; Guo, Q.; Wu, Y.; Zhao, W.; Zhang, X.; Jiao, L. A novel multi-model decision fusion network for object detection in remote sensing images. Remote Sens. 2019, 11, 737. [Google Scholar] [CrossRef] [Green Version]
  12. Zhang, B. Remotely sensed big data era and intelligent information extraction. Wuhan Daxue Xuebao (Xinxi Kexue Ban)/Geomat. Inf. Sci. Wuhan Univ. 2018, 43, 1861–1871. [Google Scholar]
  13. Sun, X.; Wang, P.; Wang, C.; Liu, Y.; Fu, K. PBNet: Part-based convolutional neural network for complex composite object detection in remote sensing imagery. ISPRS J. Photogramm. Remote Sens. 2021, 173, 50–65. [Google Scholar] [CrossRef]
  14. Yin, W.; Diao, W.; Wang, P.; Gao, X.; Li, Y.; Sun, X. PCAN—Part-based context attention network for thermal power plant detection in remote sensing imagery. Remote Sens. 2021, 13, 1243. [Google Scholar] [CrossRef]
  15. Cai, B.; Jiang, Z.; Zhang, H.; Zhao, D.; Yao, Y. Airport detection using end-to-end convolutional neural network with hard example mining. Remote Sens. 2017, 9, 1198. [Google Scholar] [CrossRef] [Green Version]
  16. Li, S.; Xu, Y.; Zhu, M.; Ma, S.; Tang, H. Remote sensing airport detection based on end-to-end deep transferable convolutional neural networks. IEEE Geosci. Remote Sensing Lett. 2019, 16, 1640–1644. [Google Scholar] [CrossRef]
  17. Xu, Y.; Zhu, M.; Li, S.; Feng, H.; Ma, S.; Che, J. End-to-end airport detection in remote sensing images combining cascade region proposal networks and multi-threshold detection networks. Remote Sens. 2018, 10, 1516. [Google Scholar] [CrossRef] [Green Version]
  18. Zeng, F.; Cheng, L.; Li, N.; Xia, N.; Ma, L.; Zhou, X.; Li, M. A hierarchical airport detection method using spatial analysis and deep learning. Remote Sens. 2019, 11, 2204. [Google Scholar] [CrossRef] [Green Version]
  19. He, K.; Zhang, X.; Ren, S.; Sun, J. Deep residual learning for image recognition. In Proceedings of the 2016 IEEE Conference on Computer Vision and Pattern Recognition (CVPR), Las Vegas, NV, USA, 27–30 June 2016; pp. 770–778. [Google Scholar]
  20. Xu, K.; Ba, J.; Kiros, R.; Cho, K.; Courville, A.; Salakhutdinov, R.; Zemel, R.; Bengio, Y. Show, attend and tell: Neural image caption generation with visual attention. arXiv 2016, arXiv:1502.03044. [Google Scholar]
  21. Hu, J.; Shen, L.; Sun, G.; Albanie, S. Squeeze-and-excitation networks. In Proceedings of the IEEE Conference on Computer Vision and Pattern Recognition, Honolulu, HI, USA, 21–26 July 2017; pp. 7132–7141. [Google Scholar]
  22. Woo, S.; Park, J.; Lee, J.-Y.; Kweon, I.S. CBAM: Convolutional block attention module. In Proceedings of the European Conference on Computer Vision, Munich, Germany, 8–14 September 2018; pp. 3–19. [Google Scholar]
  23. Cai, Z.; Vasconcelos, N. Cascade R-CNN: Delving into high quality object detection. In Proceedings of the 2018 IEEE/CVF Conference on Computer Vision and Pattern Recognition, Salt Lake City, UT, USA, 18–23 June 2018; pp. 6154–6162. [Google Scholar]
  24. Zhu, C.; He, Y.; Savvides, M. Feature selective anchor-free module for single-shot object detection. In Proceedings of the 2019 IEEE/CVF Conference on Computer Vision and Pattern Recognition (CVPR), Long Beach, CA, USA, 15–20 June 2019; pp. 840–849. [Google Scholar]
  25. Selvaraju, R.R.; Cogswell, M.; Das, A.; Vedantam, R.; Parikh, D.; Batra, D. Grad-CAM: Visual explanations from deep networks via gradient-based localization. In Proceedings of the 2017 IEEE International Conference on Computer Vision (ICCV), Venice, Italy, 22–29 October 2017; pp. 618–626. [Google Scholar]
Figure 1. Samples of composite objects: (a) primary and secondary schools at different scales; (b) airports in DIOR datasets; (c) thermal power plants in AIR-TPPDD [14].
Ijgi 10 00736 g001
Figure 2. Samples of PSSs in different regions: (a,b) PSSs in urban regions; (c,d) PSSs in remote regions.
Ijgi 10 00736 g002
Figure 3. Overview of the proposed ADNet, which is built on the framework of Faster R-CNN. The features are guided by DAM and integrated by DFFM to gradually generate predictions.
Ijgi 10 00736 g003
Figure 4. The structure of the baseline feature extractor.
Ijgi 10 00736 g004
Figure 5. Dual attention module incorporating spatial and channel attention mechanisms in the residual block.
Ijgi 10 00736 g005
Figure 6. The architecture of dense feature fusion module (DFFM). Taking F3 as an example to illustrate the implementation of this module.
Ijgi 10 00736 g006
Figure 7. Display of study area. Note: the secondary schools and primary schools are plotted by the red circle and blue triangle, respectively.
Ijgi 10 00736 g007
Figure 8. Bounding box analysis of the training samples: (a) the results of K-Means ++; (b) the distribution of the boxes’ ratios.
Ijgi 10 00736 g008
Figure 9. Detection results on the test set. The ground-truth boxes are plotted in green, and the detection results are plotted in red: (a) the detection results of Faster R-CNN; (b) the detection results of ADNet.
Ijgi 10 00736 g009
Figure 10. Performance of Faster R-CNN and ADNet: (a) precision rate and recall rate of Faster R-CNN at different thresholds; (b) precision rate and recall rate of ADNet at different thresholds.
Ijgi 10 00736 g010
Figure 11. Results of ADNet on the test set. The ground truth boxes are plotted in green, and the detection results of ADNet are plotted in red.
Ijgi 10 00736 g011
Figure 12. Verify the effects of DAM via visualizing attention map: (a) examples of the input image; (b) heatmap visualization results of input of DAM corresponding images; (c) heatmap visualization results of the output of DAM corresponding images.
Ijgi 10 00736 g012
Figure 13. Some detection results of proposed methods on the test set. The false positives and false negatives are plotted in blue and orange, respectively: (a,b) false positives; (c) missed objects with unclear features; (d) missed small objects.
Ijgi 10 00736 g013aIjgi 10 00736 g013b
Table 1. Effects of data enhancement.
Data EnhancementZoom inZoom outAP
ADNet— —— —0.7574
— —0.7694
— —0.7654
0.7986
Table 2. Comparison of different attention methods.
MethodCABAP
ADNet+GAP0.7716
+GAP&GMP0.7986
Table 3. Comparison of different structures.
Method+DAM+DFFMAP
Faster R-CNN— —— —0.6972
— —0.7682
— —0.7631
0.7986
Table 4. Detection results of different methods.
MethodsAP
Faster R-CNN0.6972
FPN0.7334
Cascade R-CNN0.7264
FSAF0.7460
ADNet0.7986
Publisher’s Note: MDPI stays neutral with regard to jurisdictional claims in published maps and institutional affiliations.

