
Urban Growth, Real Estate Development and Indigenous Property: Simulating the Expansion Process in the City of Temuco, Chile

 , ,
, ,  and
and 
Abstract
:1. Introduction
Background
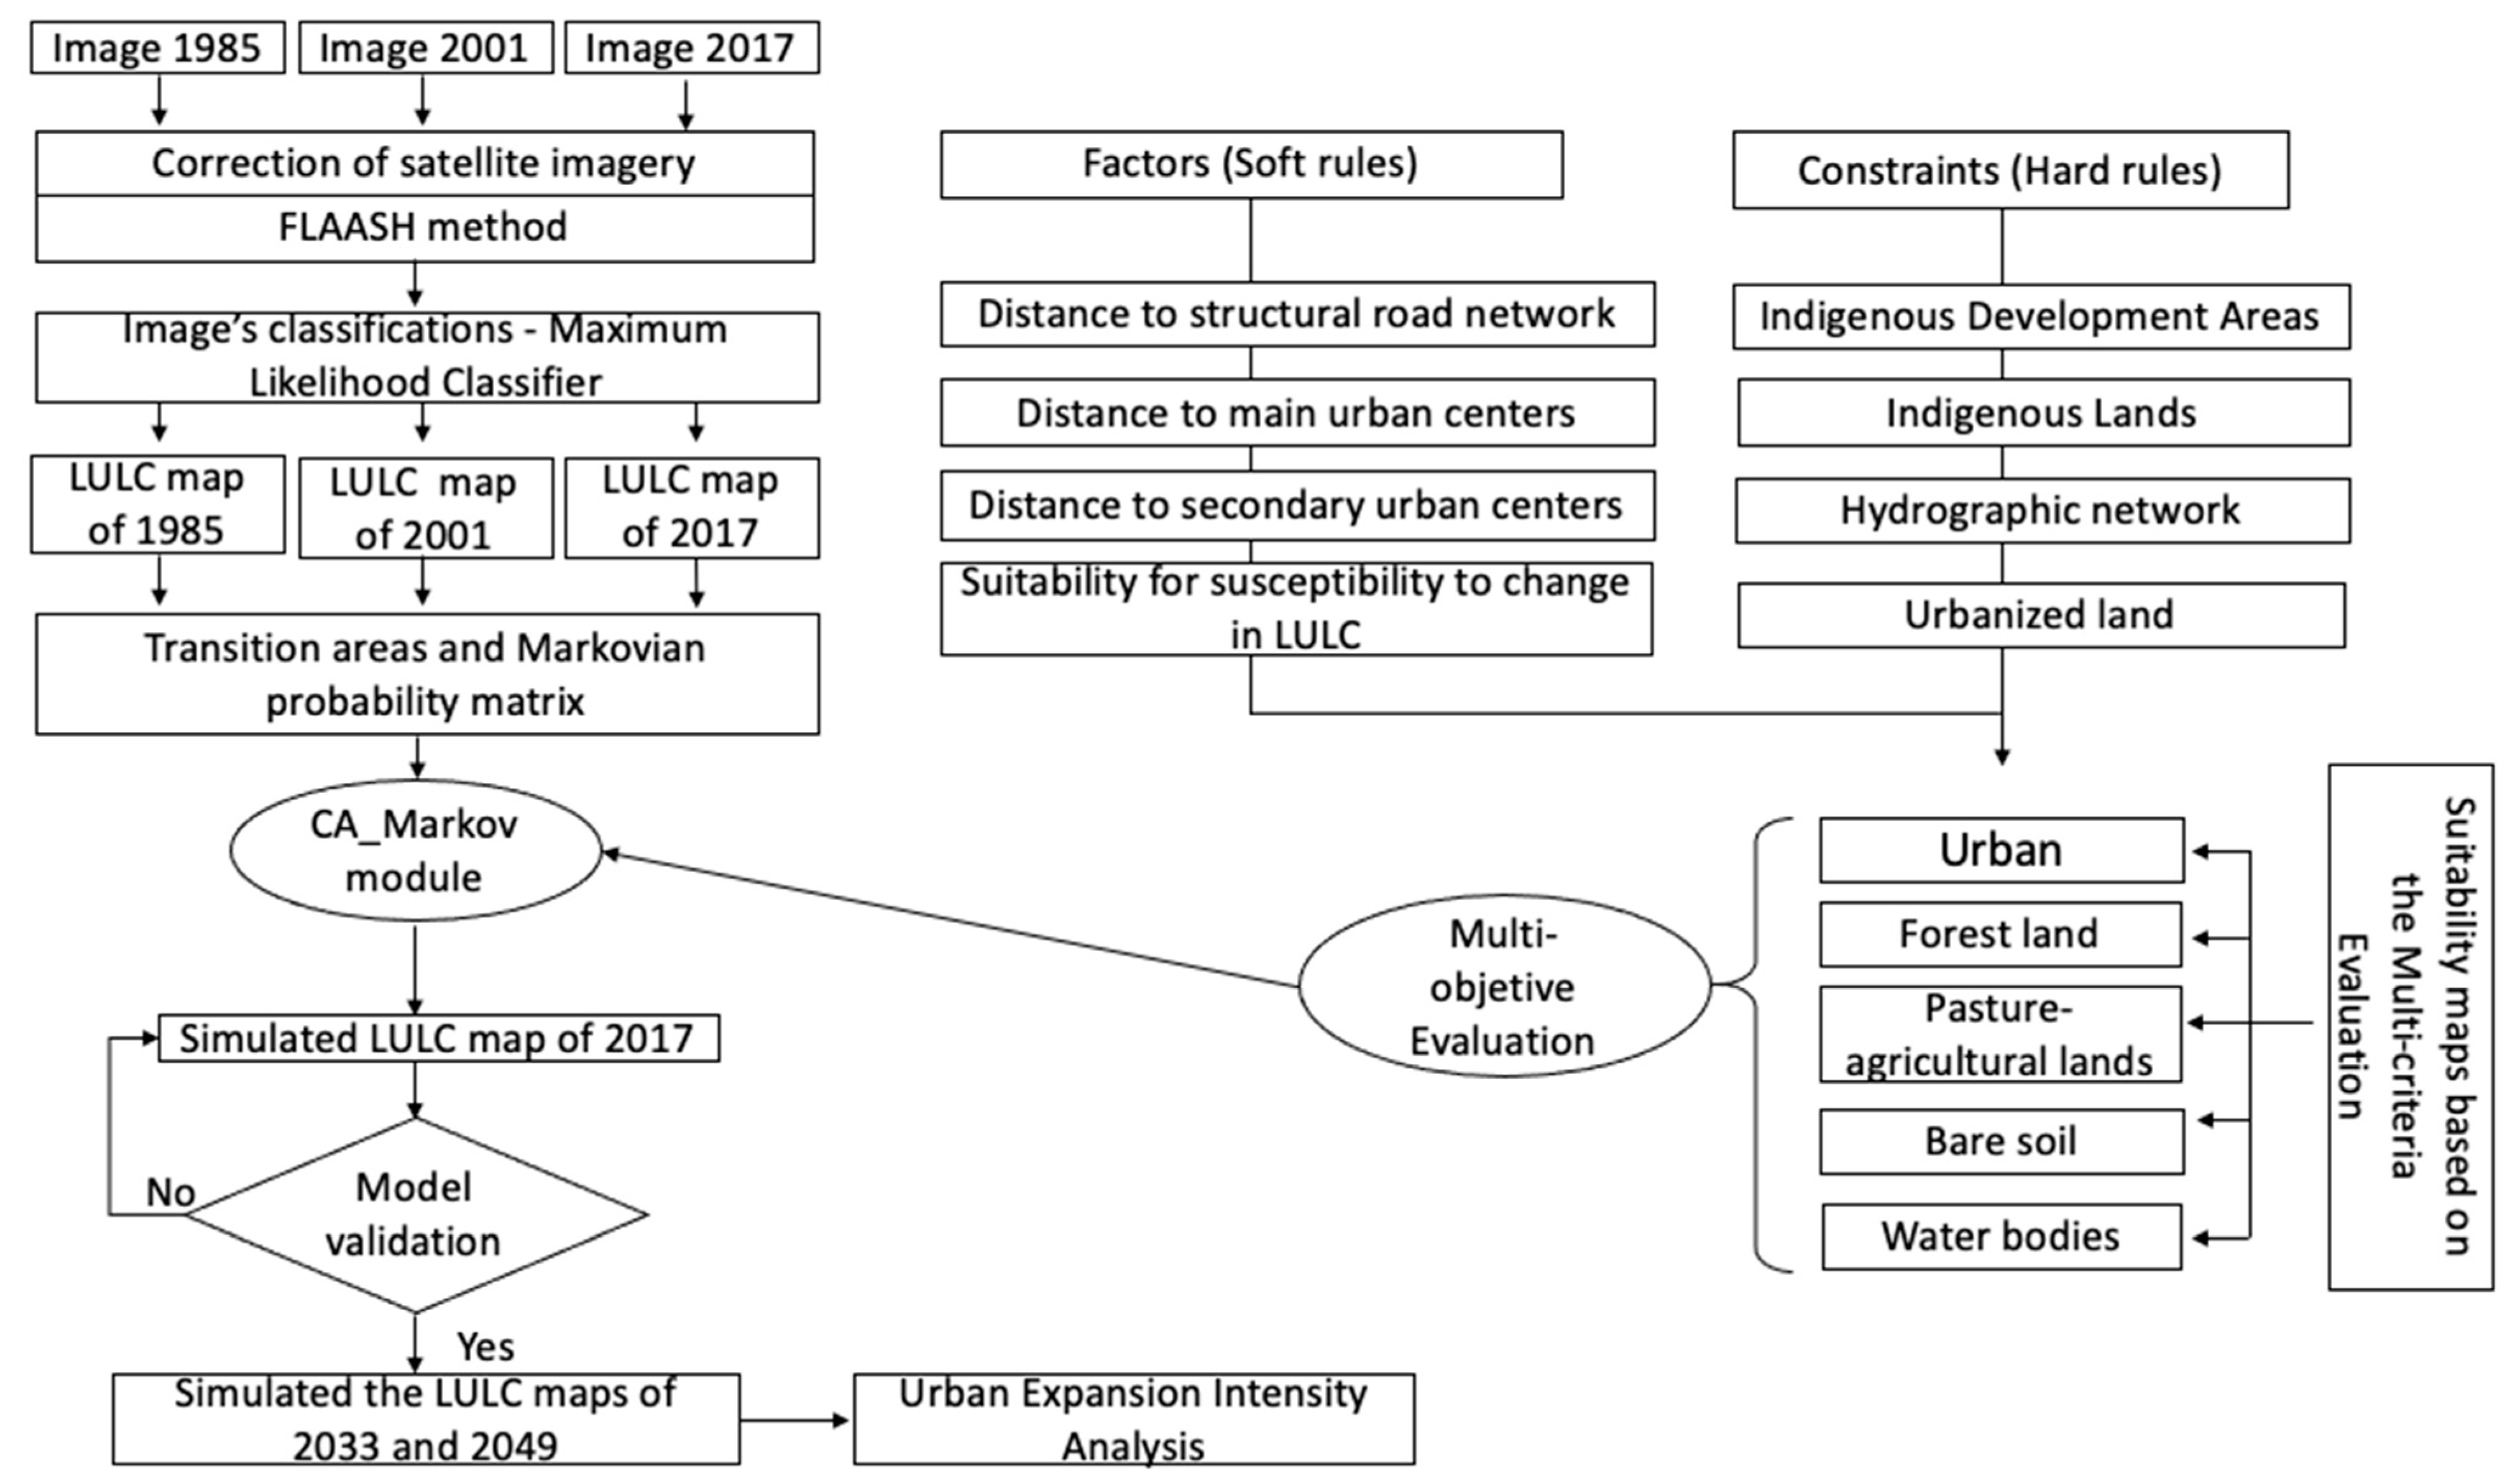
2. Materials and Methods
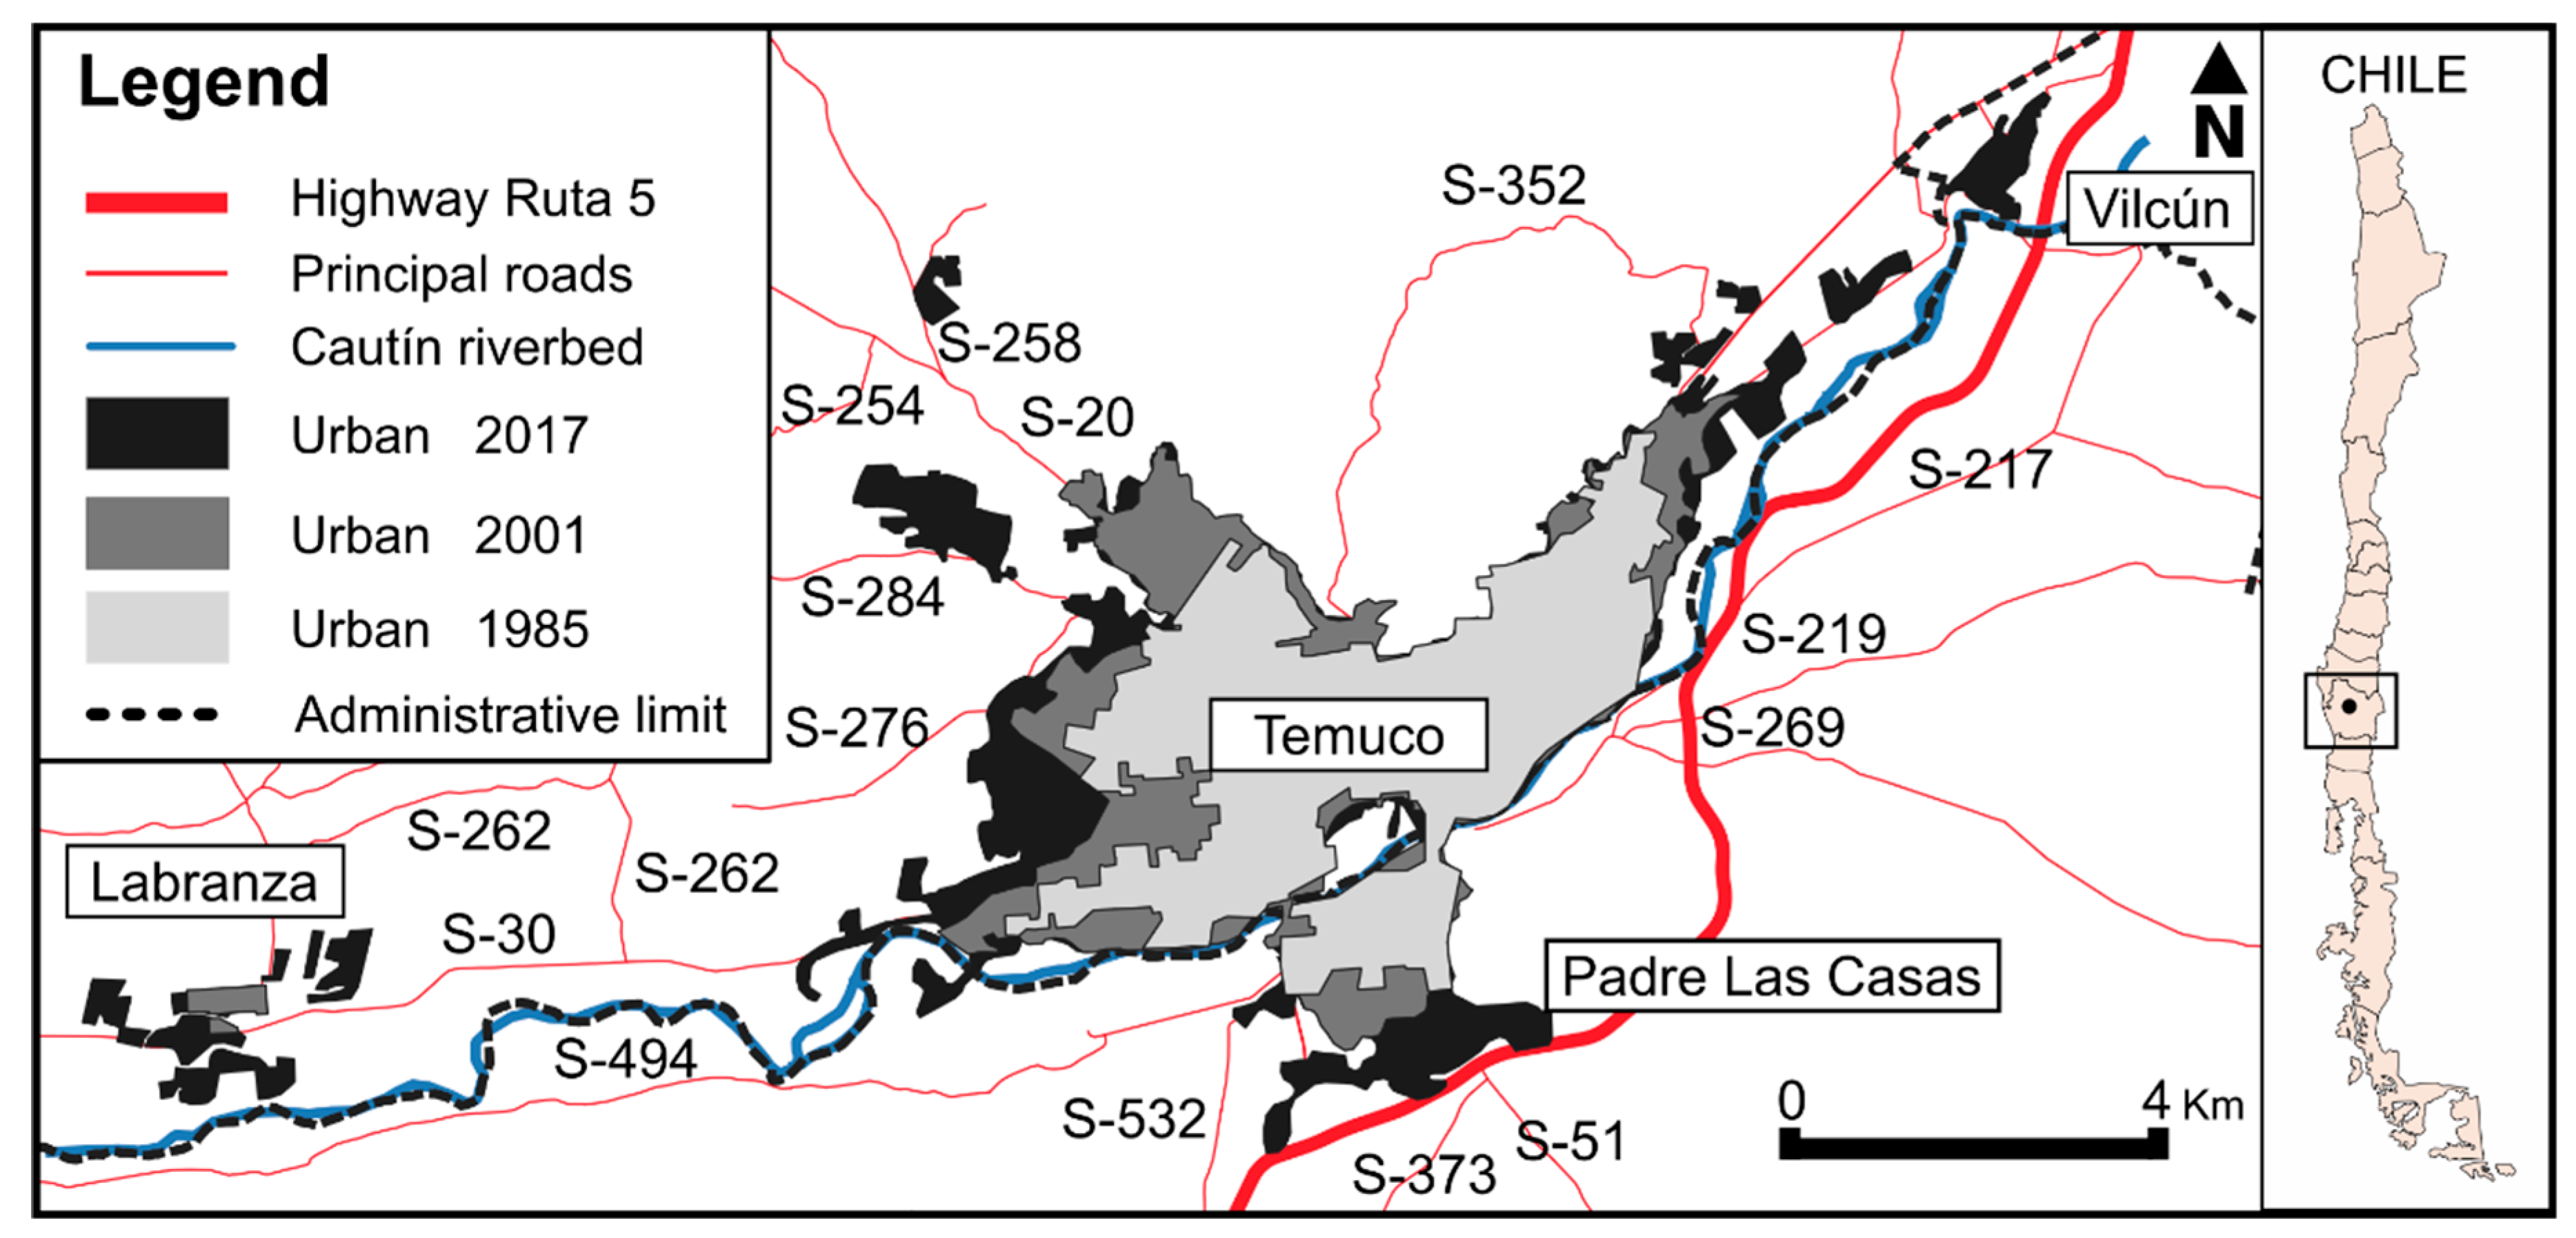
2.1. Study Area
2.2. Detection of Changes in Land Uses and Covers between 1985 and 2017
2.3. Geo-Simulation of Changes in Land Use and Cover Using Cellular Automata and Markov Chains
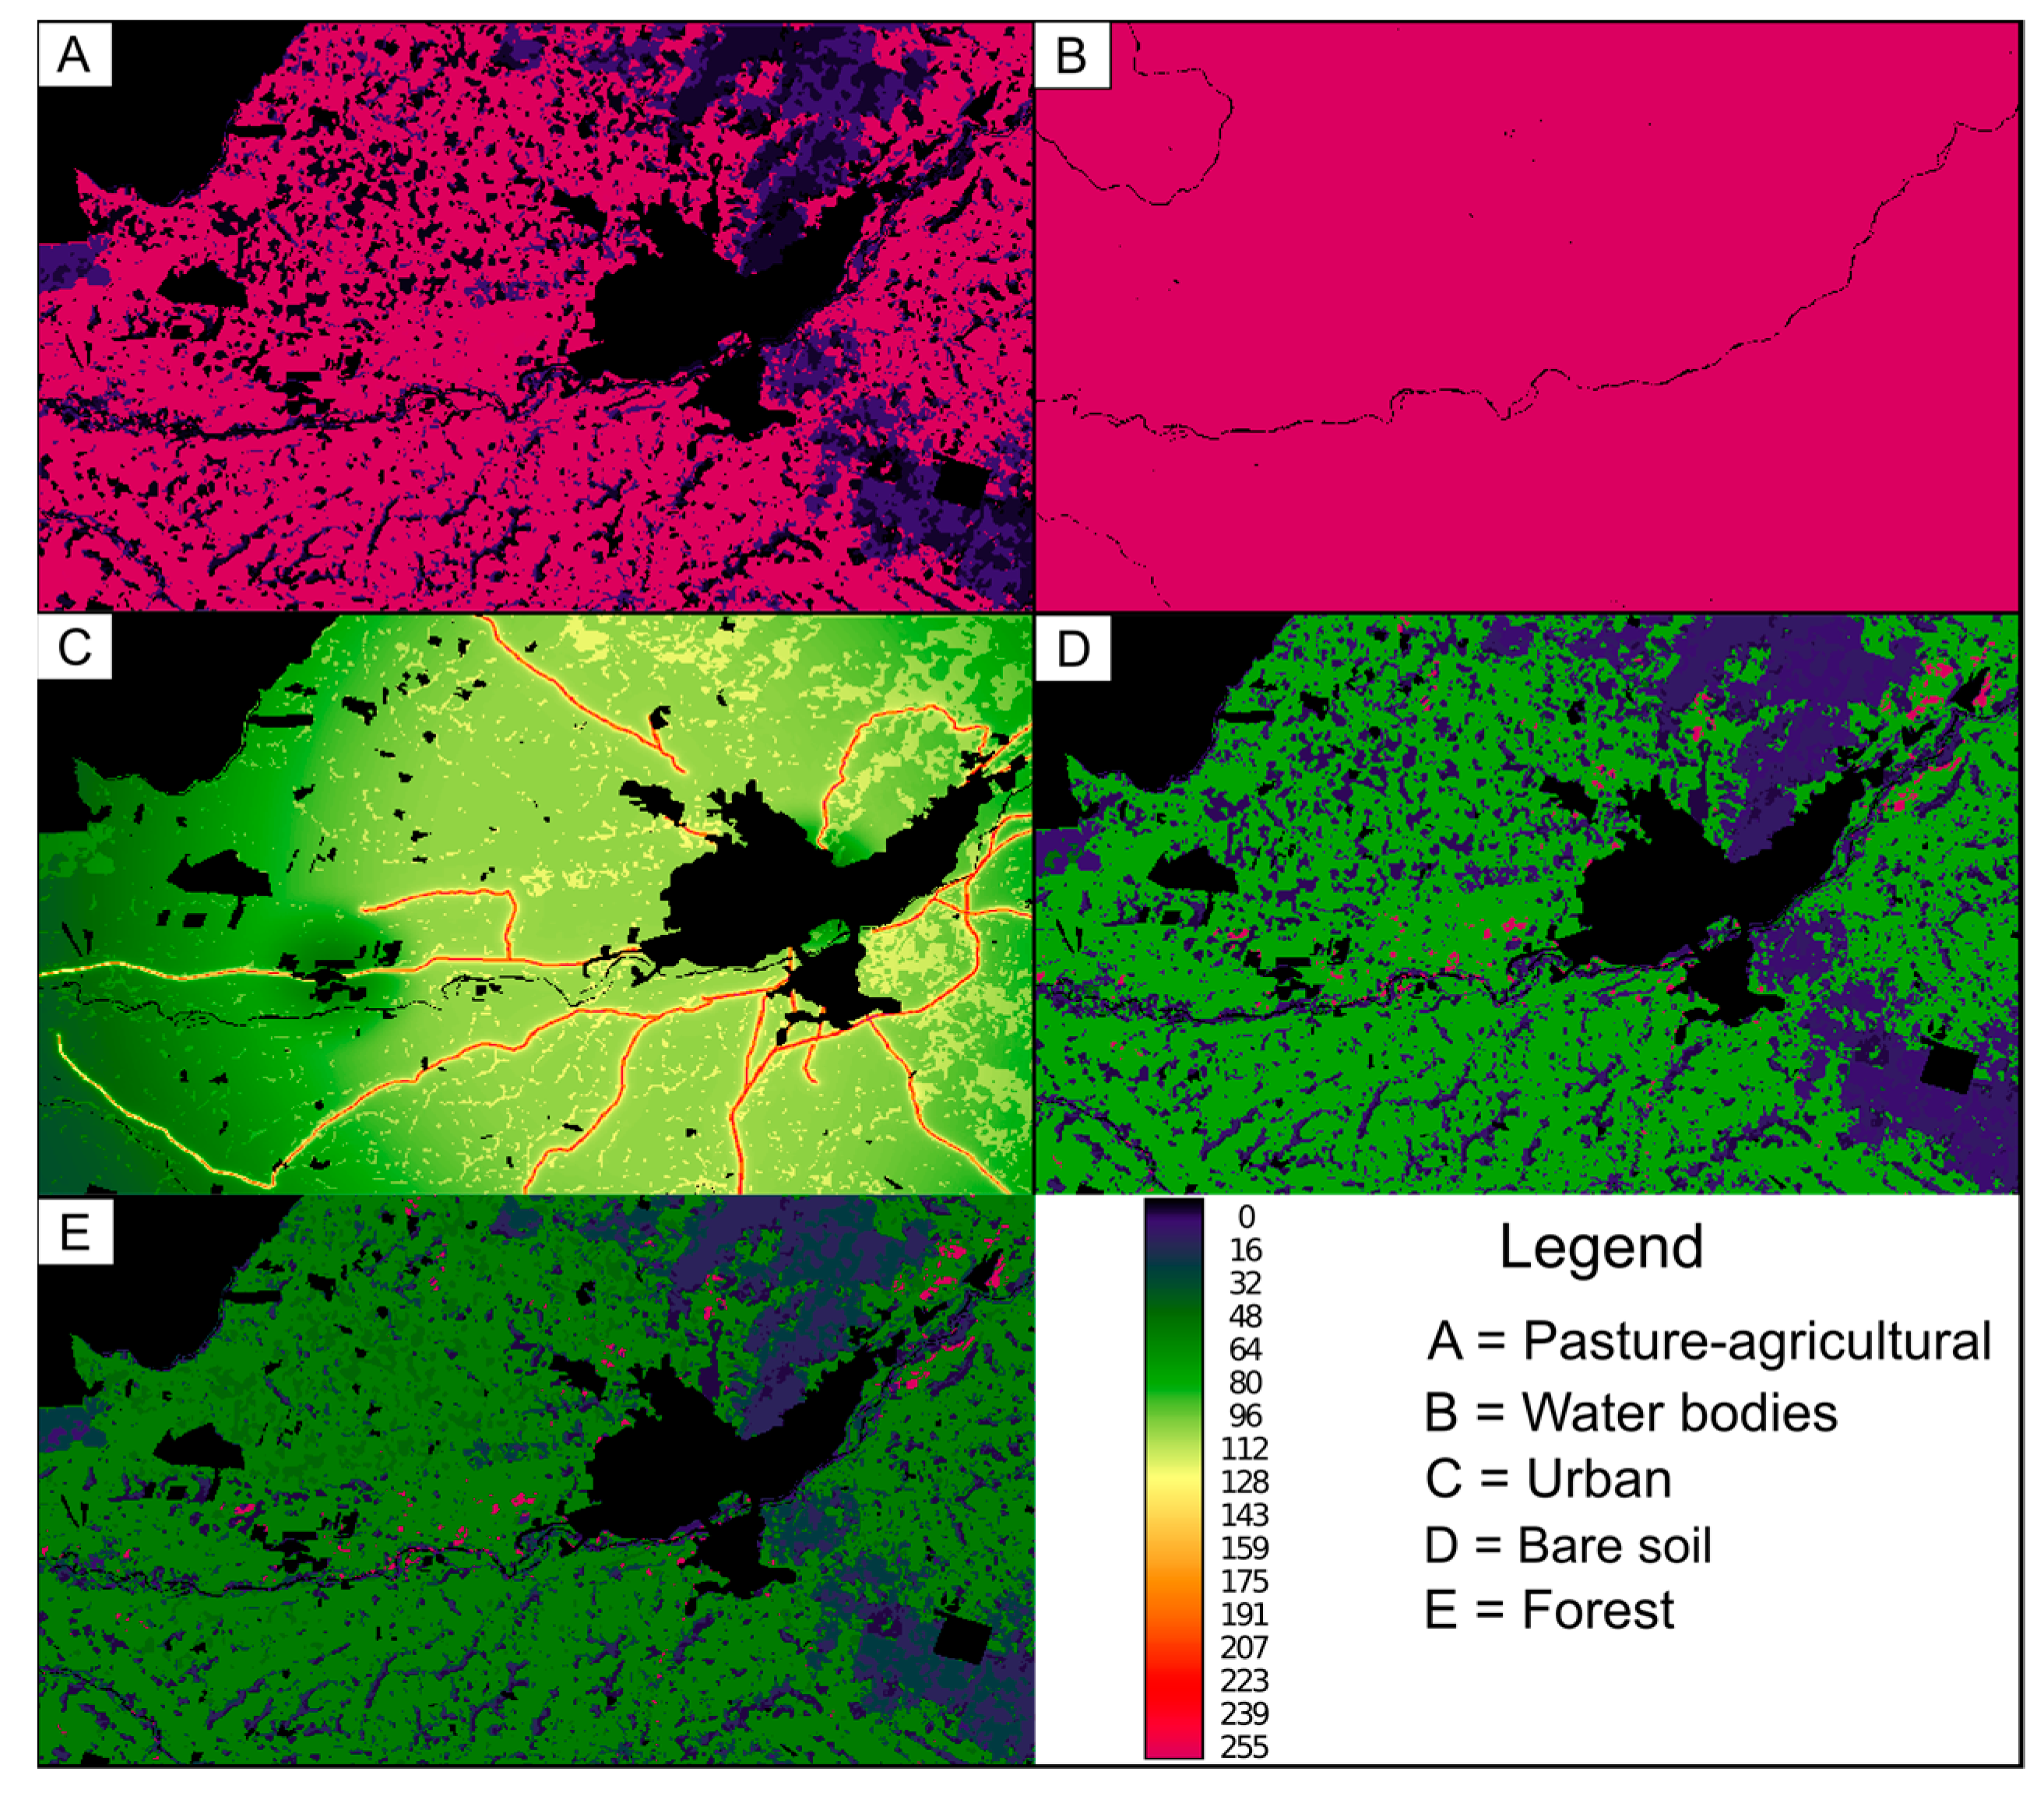
2.3.1. Multi-Criteria and Multi-Objective Evaluation
2.3.2. Markov Chains and Cellular Automata
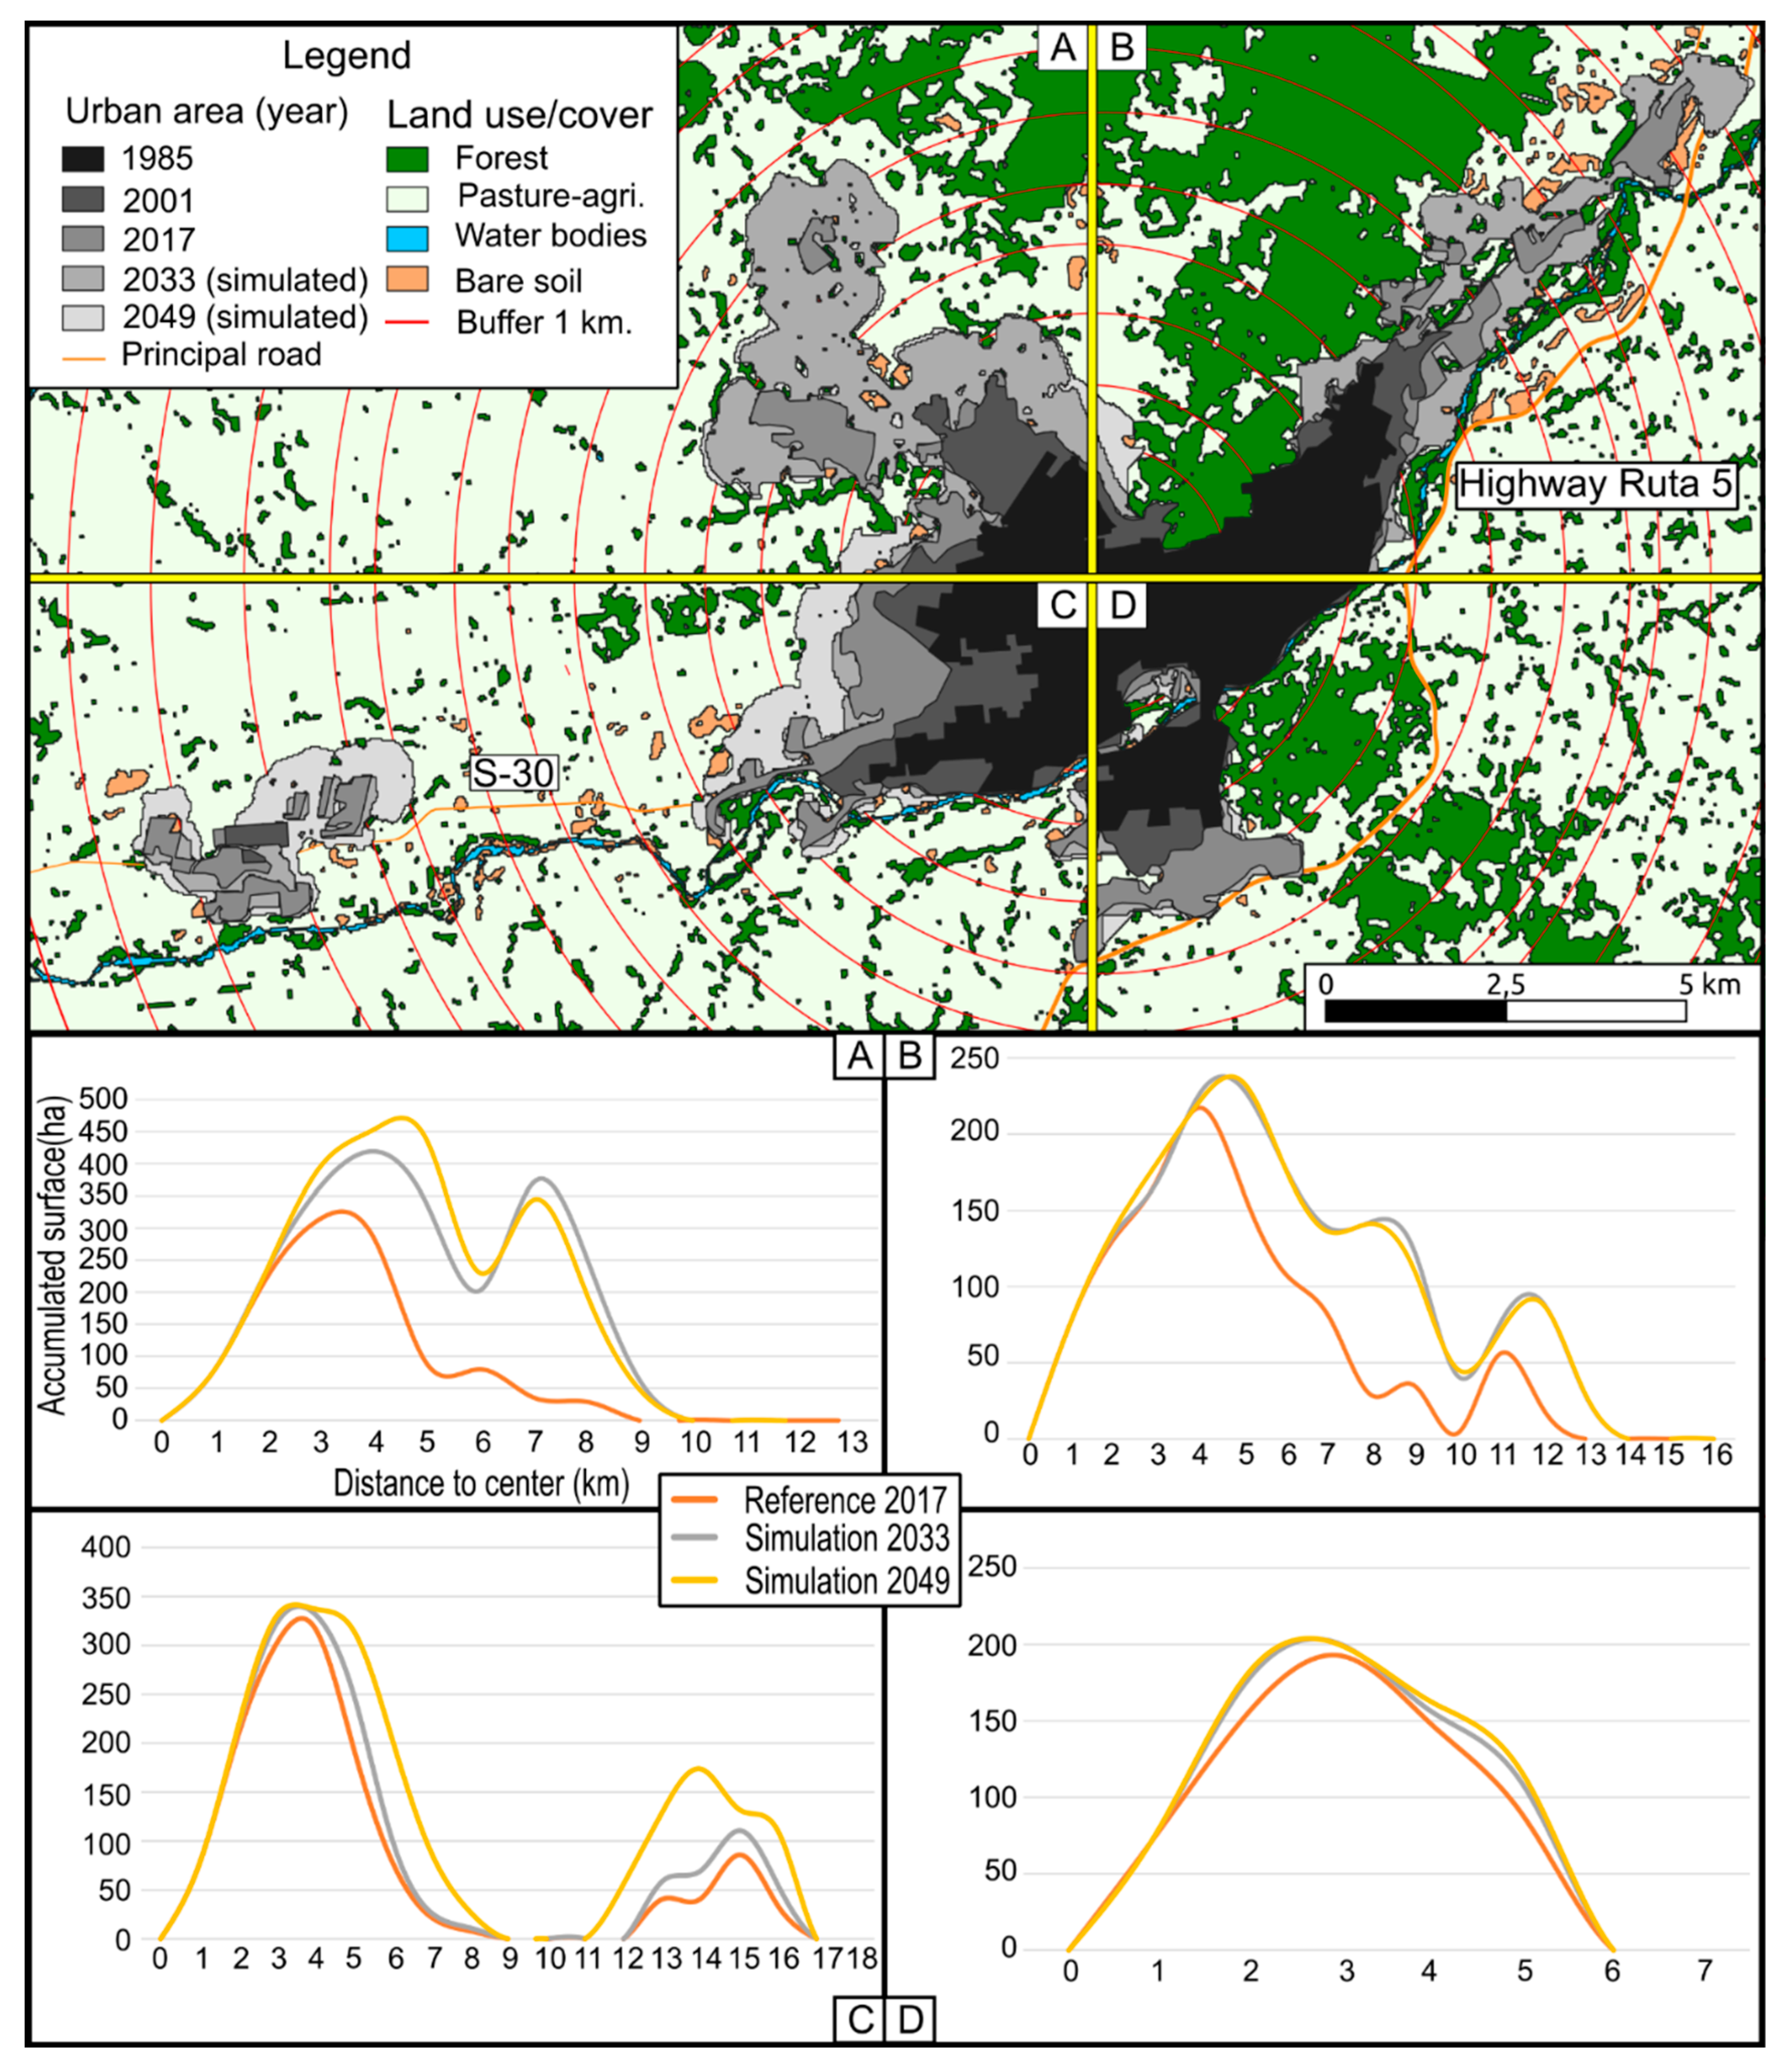
2.4. Urban Expansion Intensity Analysis
3. Results
3.1. Validation of the Simulation Model for the City of Temuco
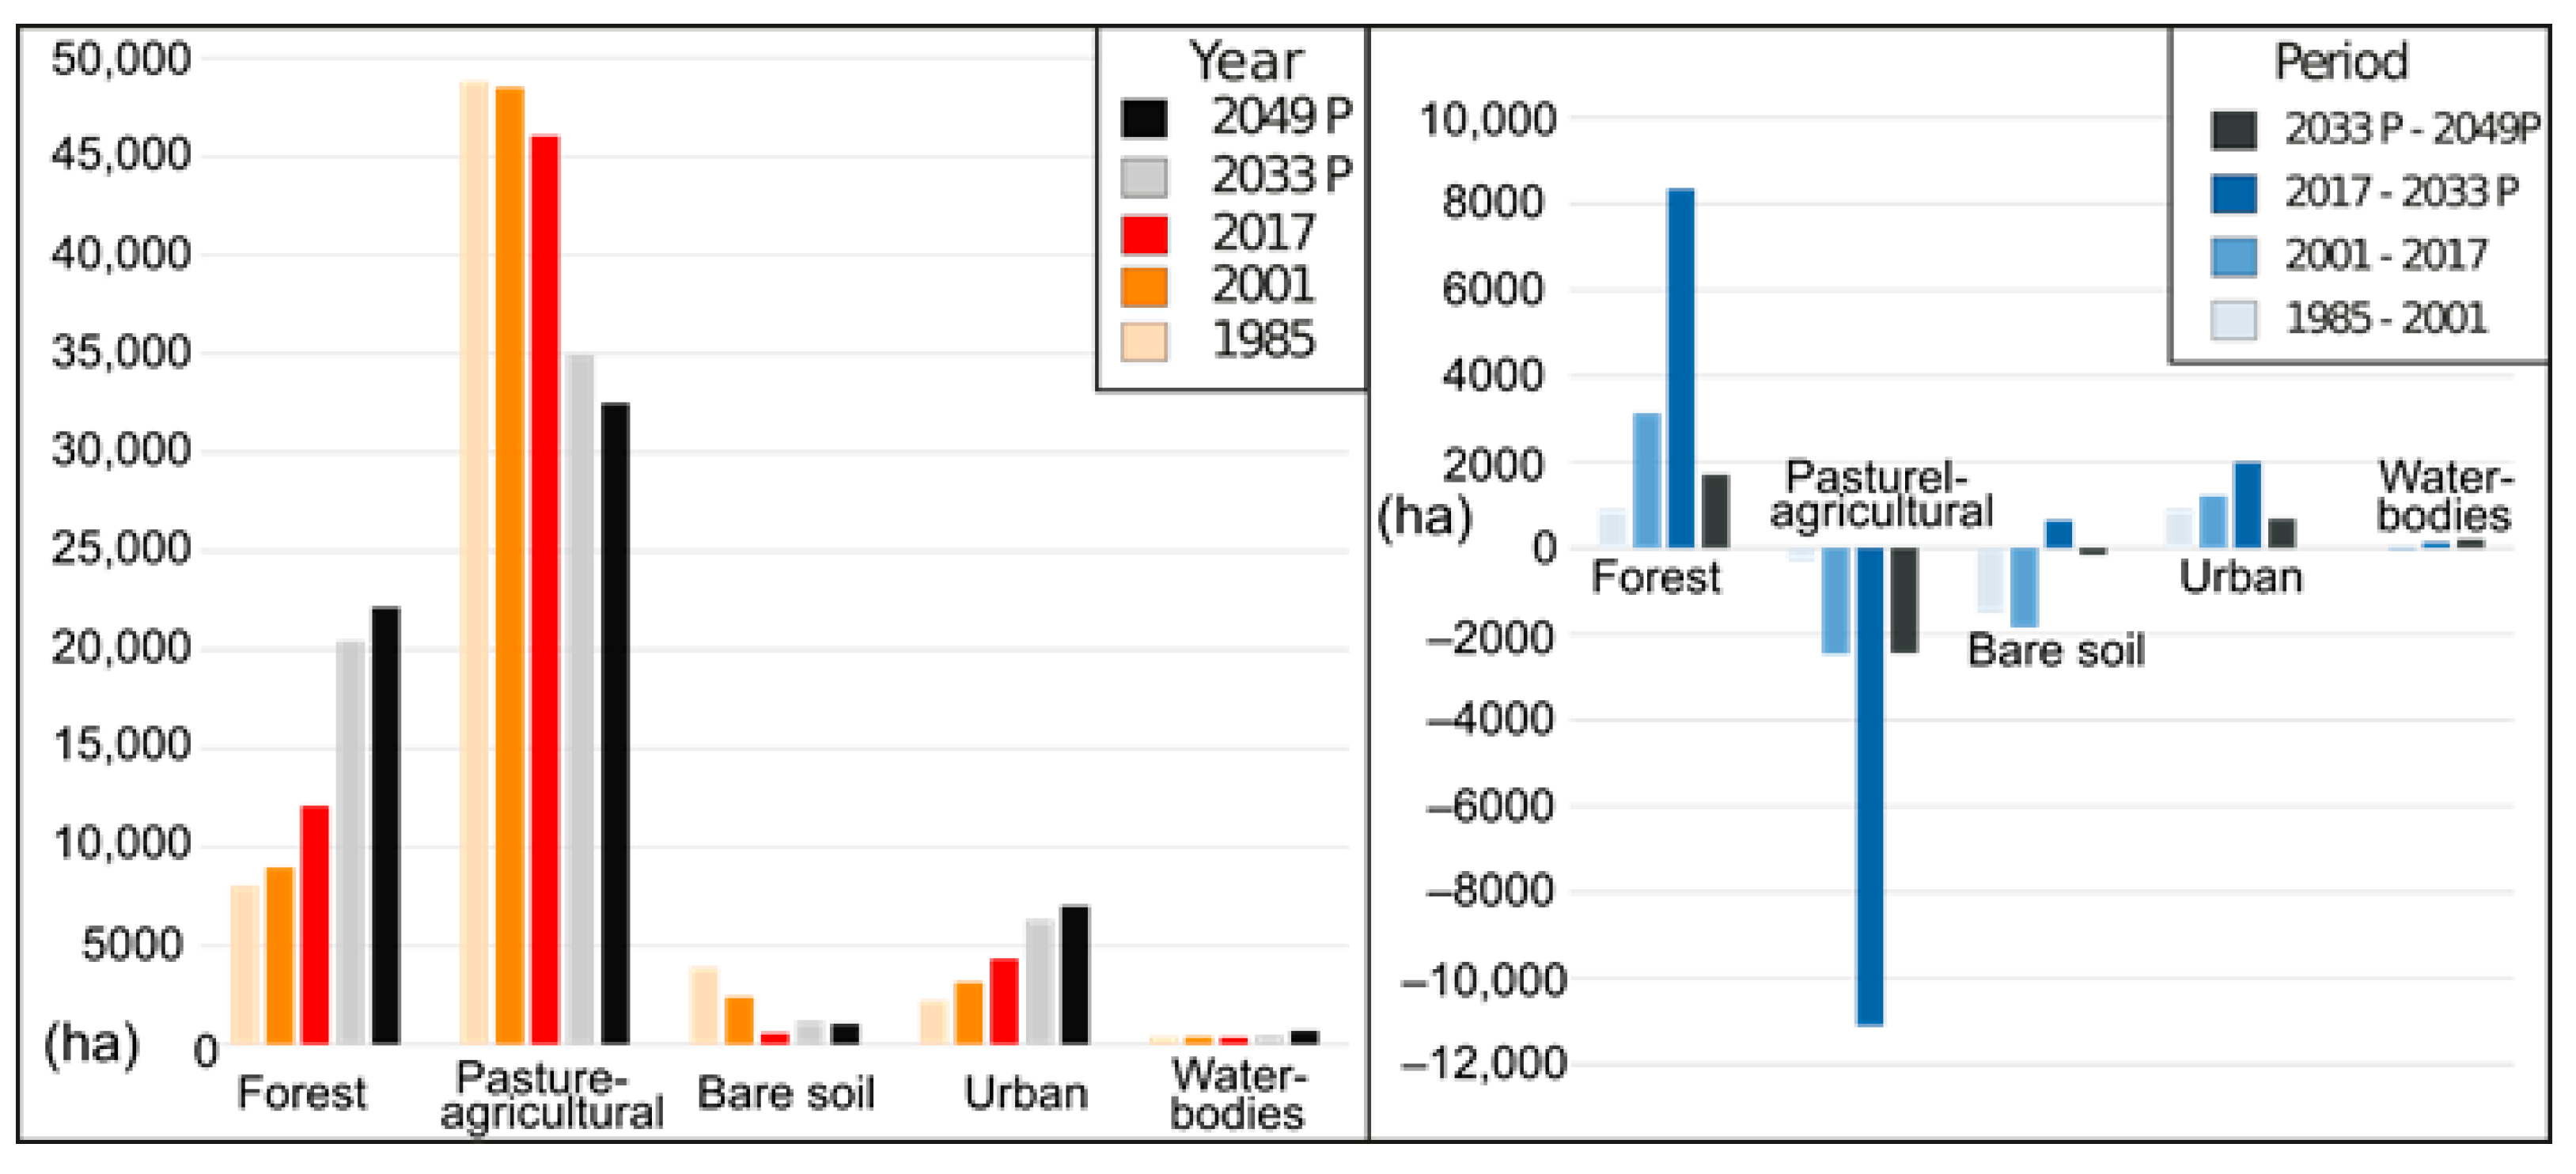
3.2. Trends in Land Use and Cover Between 1985 and 2017
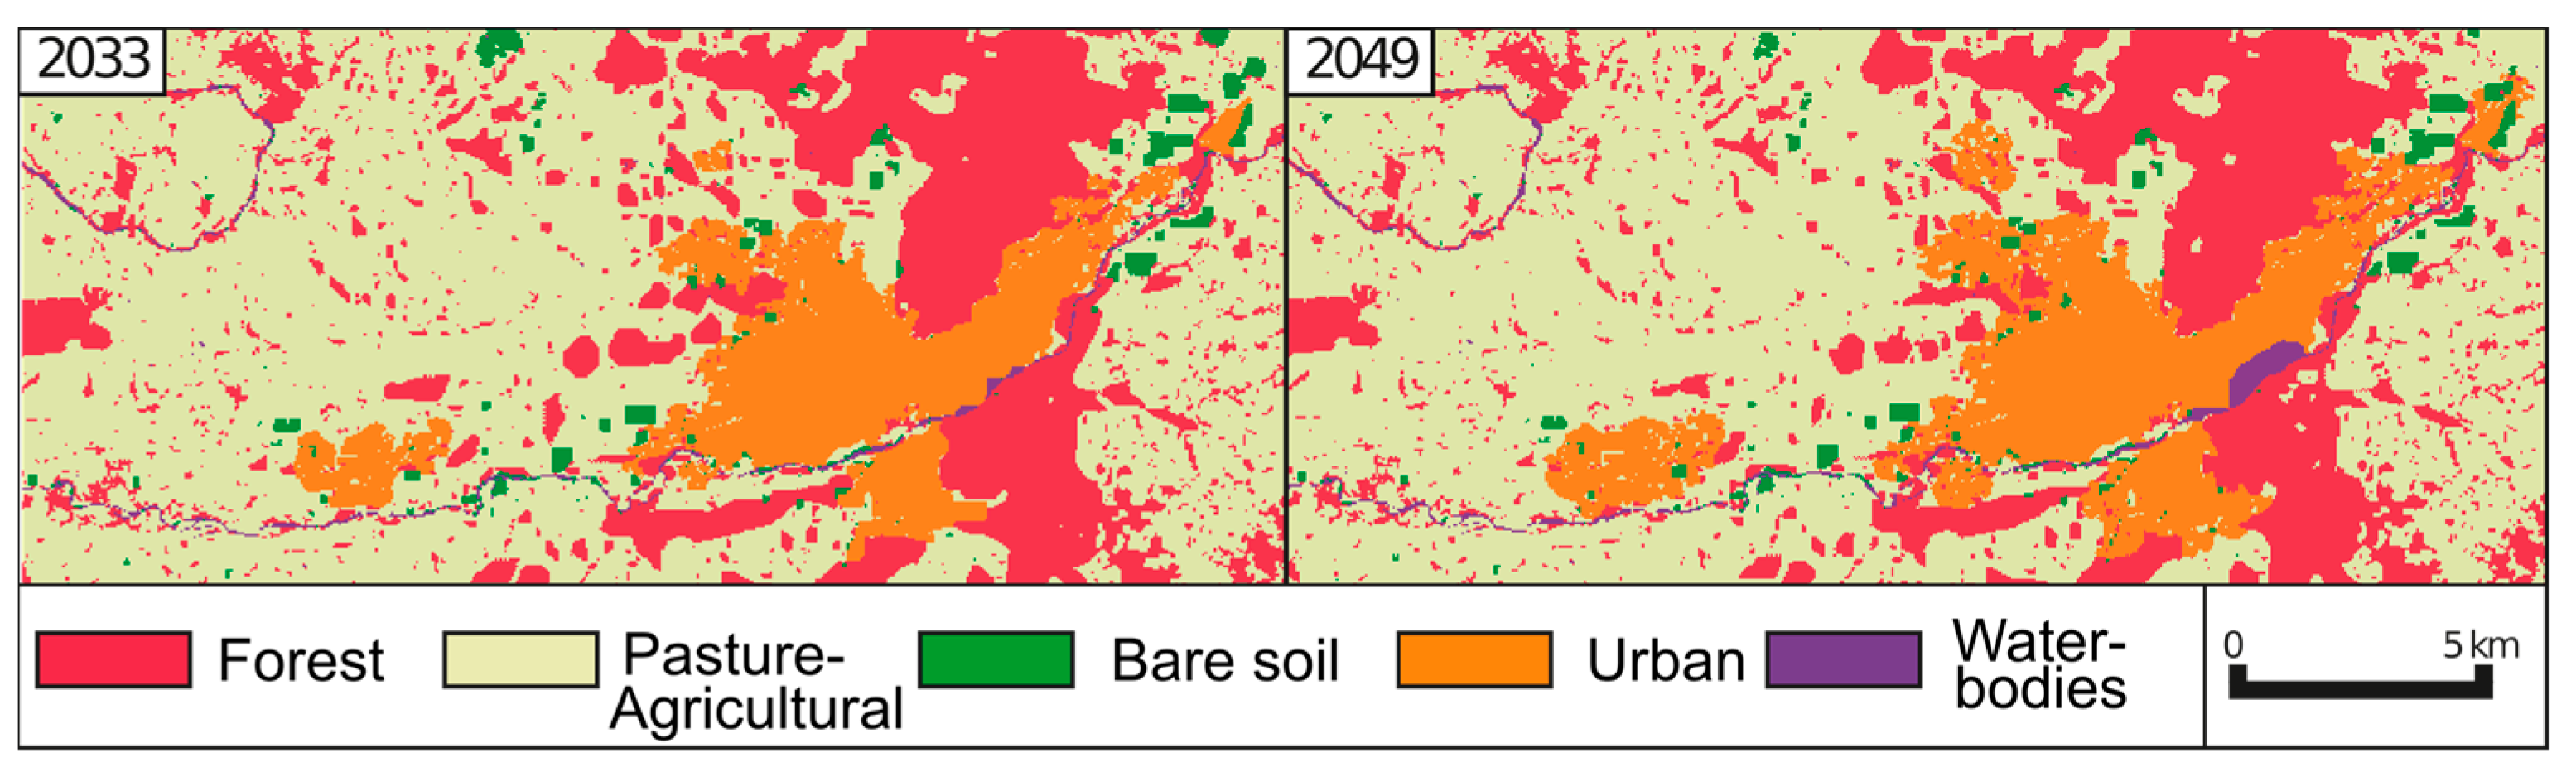
3.3. Simulation of Changes in Land Use and Cover for the City of Temuco
4. Discussion
Author Contributions
Funding
Acknowledgments
Conflicts of Interest
References
- United Nations World Urbanization Prospects. The 2018 Revision; UNWUP: New York, NY, USA, 2019. [Google Scholar]
- Batty, M. The New Science of Cities; The MIT Press: Cambridge, MA, USA, 2013; ISBN 9780262318235. [Google Scholar]
- Barthelemy, M. The Structure and Dynamics of Cities; Cambridge University Press: Cambridge, UK, 2016; ISBN 9781316271377. [Google Scholar]
- Benenson, I.; Torrens, P.M. Geosimulation; Wiley: Hoboken, NJ, USA, 2004; ISBN 9780470843499. [Google Scholar]
- Rana, S.; Sharma, J. Frontiers of Geographic Information Technology; Springer: Berlin/Heidelberg, Germany, 2006; ISBN 3-540-25685-7. [Google Scholar]
- Pontius, R.G.; Chen, H. Land Change Modeling with GEOMOD. In IDRISI Andes Help Contents; Clark University: Worcester, MA, USA, 2006. [Google Scholar]
- Arsanjani, J.J. Dynamic Land Use/Cover Change Modelling; Springer: Berlin/Heidelberg, Germany, 2012; ISBN 978-3-642-23704-1. [Google Scholar]
- Kumar, R.; Nandy, S.; Agarwal, R.; Kushwaha, S.P.S. Forest cover dynamics analysis and prediction modeling using logistic regression model. Ecol. Indic. 2014, 45, 444–455. [Google Scholar] [CrossRef]
- Nath, B.; Wang, Z.; Ge, Y.; Islam, K.P.; Singh, R.; Niu, Z. Land Use and Land Cover Change Modeling and Future Potential Landscape Risk Assessment Using Markov-CA Model and Analytical Hierarchy Process. ISPRS Int. J. Geo-Inf. 2020, 9, 134. [Google Scholar] [CrossRef] [Green Version]
- Hamad, R.; Balzter, H.; Kolo, K. Predicting Land Use/Land Cover Changes Using a CA-Markov Model under Two Different Scenarios. Sustainability 2018, 10, 3421. [Google Scholar] [CrossRef] [Green Version]
- Zhou, L.; Dang, X.; Sun, Q.; Wang, S. Multi-scenario simulation of urban land change in Shanghai by random forest and CA-Markov model. Sustain. Cities Soc. 2020, 55, 2045. [Google Scholar] [CrossRef]
- Ravetz, J.; Fertner, C.; Nielsen, T.S. The Dynamics of Peri-Urbanization. In Peri-Urban Futures: Scenarios and Models for Land Use Change in Europe; Nilsson, K., Pauleit, S., Bell, S., Aalbers, C., Sick Nielsen, T., Eds.; Springer: Berlin/Heidelberg, Germany, 2013; pp. 13–44. [Google Scholar]
- Lima, M.L.; Zelaya, K.; Massone, H. Groundwater Vulnerability Assessment Combining the Drastic and Dyna-Clue Model in the Argentine Pampas. Environ. Manag. 2011, 47, 828–839. [Google Scholar] [CrossRef] [PubMed]
- Batty, M. A strategy for generating and testing models of migration and urban growth. Reg. Stud. 1983, 17, 223–236. [Google Scholar] [CrossRef]
- Fahmi, F.Z.; Hudalah, D.; Rahayu, P.; Woltjer, J. Extended urbanization in small and medium-sized cities: The case of Cirebon, Indonesia. Habitat Int. 2014, 42, 1–10. [Google Scholar] [CrossRef]
- Maturana, F.; Sposito, B.M.; Bellet, C.; Arenas, F.; Henríquez, C. Sistemas Urbanos y Ciudades Medias en Iberoamérica; Serie GeoLibros: Santiago, Chile, 2017. [Google Scholar]
- Maturana, F.; Rojas, A. Ciudades Intermedias en Chile: Territorios Olvidados; RIL Editor: Santiago, Chile, 2015. [Google Scholar]
- Henderson, V. Medium size cities. Reg. Sci. Urban Econ. 1997, 27, 583–612. [Google Scholar] [CrossRef]
- Instituto Nacional de Estadísticas. Censo Nacional de Población 2017; Base Redatam: Santiago, Chile, 2017. [Google Scholar]
- Maturana, F.; Rojas, A.; Salas, R. Dinámicas espaciales y transición hacia la articulación de espacios metropolitanos. El caso de Temuco y su hinterland, Chile. Cuad. Geográficos 2018, 57. [Google Scholar] [CrossRef]
- Mendoza, R.F.; Peterson, A.V.; Peñaloza, O.J.; Burrows, S.A. Definiendo el Temuco metropolitano: Consideraciones para un nuevo modelo de urbanización extendida en la Araucanía. Arquit. Urban Sustentabilidad 2020. [Google Scholar] [CrossRef]
- Salazar, G.; Irarrázaval, F.; Fonck, M.; Salazar, G.; Irarrázaval, F.; Fonck, M. Ciudades intermedias y gobiernos locales: Desfases escalares en la Región de La Araucanía, Chile. EURE 2017, 43, 161–184. [Google Scholar] [CrossRef] [Green Version]
- Garín, A.; Salvo, S.; Bravo, G. Segregación residencial y políticas de vivienda en Temuco: 1992–2002. Rev. Geogr. Norte Gd. 2009, 113–128. [Google Scholar] [CrossRef]
- Gallo, B.C. El conflicto mapuche como lucha por el reconocimiento: La necesidad de una nueva clave de lectura. Izquierdas 2020, 49. [Google Scholar] [CrossRef]
- Kokaly, R.F. Investigating a physical basis for spectroscopic estimates of leaf nitrogen concentration. Remote Sens. Environ. 2001, 75, 153–161. [Google Scholar] [CrossRef]
- Peña, M.A.; Brenning, A.; Sagredo, A. Constructing satellite-derived hyperspectral indices sensitive to canopy structure variables of a Cordilleran Cypress (Austrocedrus chilensis) forest. ISPRS J. Photogramm. Rem. Sens. 2012, 74, 1–10. [Google Scholar] [CrossRef]
- Morales, M.; Maturana, F. Análisis de patrones espaciales en la expansión urbana de ciudades intermedias. El caso de San Fernando, Chile. Cuad. Vivienda Urban. 2019, 12, cvu12–cvu24. [Google Scholar] [CrossRef]
- Beinat, E.; Nijkamp, P. Multicriteria Analysis for Land-Use Management; Springer Netherlands Environment & Management: Dordrecht, The Netherlands, 1998; Volume 9, ISBN 978-90-481-5077-9. [Google Scholar]
- Conadi, Sistema Integrado de Información CONADI SIIC. Available online: http://siic.conadi.cl (accessed on 19 January 2021).
- Manuschevich, D.; Beier, C.M. Simulating land use changes under alternative policy scenarios for conservation of native forests in south-central Chile. Land Use Policy 2016, 51, 350–362. [Google Scholar] [CrossRef]
- Borsdorf, A. Cómo modelar el desarrollo y la dinámica de la ciudad latinoamericana. EURE 2003, 29, 37–49. [Google Scholar] [CrossRef]
- Kharat, G.; Raut, R.; Kamble, S.S.; Kamble, S.J. The application of Delphi and AHP method in environmentally conscious solid waste treatment and disposal technology selection. Manag. Environ. Qual. Int. J. 2016, 27, 427–440. [Google Scholar] [CrossRef]
- Batty, M. Cities and Complexity: Understanding Cities with Cellular Automata, Agent-Based Models, and Fractals; The MIT Press: Cambridge, MA, USA, 2007; ISBN 0262524791. [Google Scholar]
- Pontius, R. Quantification error versus location error in comparison of categorical maps. Photogramm. Eng. Remote Sens. 2000, 66, 1011–1016. [Google Scholar]
- Fan, Y.; Zhu, X.; He, Z.; Zhang, S.; Gao, J.; Chen, F.; Peng, X.; Li, J. Urban Expansion Assessment in Huaihe River Basin, China, from 1998 to 2013 Using Remote Sensing Data. J. Sens. 2017, 2017, 1201. [Google Scholar] [CrossRef]
- Zhang, X.; Bai, Z.; Fan, X.; Lu, Y.; Cao, Y.; Zhao, Z.; Sun, Q.; Pan, J. Urban Expansion Process, Pattern, and Land Use Response in an Urban Mining Composited Zone from 1986 to 2013. J. Urban Plan. Dev. 2016, 142, 6014. [Google Scholar] [CrossRef]
- Vergara, L. Medianización social y transformaciones residenciales recientes en ciudades de La Araucanía. Cult. Hombre Soc. 2019, 29, 36–60. [Google Scholar] [CrossRef]
- Paulsen, A.; Rodríguez, L.; Hidalgo, R. Los espacios de furia. Política y ciudad a través de las luchas urbanas por la vivienda en Santiago de Chile (1990–2016). Cad. Metrópole 2019, 21, 763–782. [Google Scholar] [CrossRef] [Green Version]
- Peña, F.; Escalona, M. Expansión urbana en la intercomuna Araucanía Centro. Alteraciones sobre las áreas rurales. In Chile: Del País Urbano al País Metropolitano del País Urbano al País Metropolitano; Hidalgo, R., De Mattos, C., Arenas, F., Eds.; Pontificia Universidad Católica de Chile: Santiago, Chile, 2009; pp. 389–398. [Google Scholar]


| Satellite/Sensor | Image Acquisition Date (yy/mm/dd) | Spatial Resolution (m) | Spectral Resolution (#Bands) * | Scene ID |
|---|---|---|---|---|
| Landsat5/MSS | 1985/02/10 | 30 | 4 | LM52330871985041AAA03 |
| Landsat-7/ETM+ | 2001/03/18 | 30 | 6 | LE72330872001077EDC00 |
| Landsat-8/OLI | 2017/03/06 | 30 | 6 | LC82330872017065LGN01 |
| Criterion | Variable | Unit of Measure | Source |
|---|---|---|---|
| Factors | Distance to main urban centers | Meters | Authors’ compilation based on 2017 Census. |
| Distance to secondary urban centers | Meters | Authors’ compilation based on 2017 Census. | |
| Distance to structural road network | Meters | Open Street Maps, 2019. | |
| Suitability for susceptibility to change in land use/land cover | Normalized score | Authors’ compilation. | |
| Constraints | Indigenous Development Areas (ADI) | Hectares | CONADI, 2019. |
| Indigenous Lands | Hectares | CONADI, 2019. | |
| Hydrographic network | Hectares | Library of the National Congress of Chile, 2018. | |
| Urbanized land | Hectares | Authors’ compilation based on 2017 Census. |
| Chi-Square Test | |||
|---|---|---|---|
| LULC | OBS 2017 (O) | SIM 2017 (S) | (O-S)2/O |
| Forest land cover | 19.1% | 27.4% | 0.04 |
| Pasture-agricultural | 72.7% | 56.5% | 0.04 |
| Bare soil | 0.9% | 8.7% | 0.70 |
| Urban land use | 6.8% | 6.2% | 0.00 |
| Water bodies | 0.5% | 1.2% | 0.01 |
| Total | 100% | 100% | 0.78 |
| Indicator | Value |
|---|---|
| Kno | 0.6852 |
| Klocation | 0.7714 |
| KlocationStrata | 0.7714 |
| Kstandard | 0.5268 |
| Agreement/Disagreement | Percentage |
|---|---|
| AgreementChance | 20.00 |
| AgreementQuantity | 26.79 |
| AgreementStrata | 0.00 |
| AgreementGridcell | 28.03 |
| DisagreeGridcell | 0.83 |
| DisagreeStrata | 0.00 |
| DisagreeQuantity | 16.88 |
| Distance to Main Urban Center | Distance to Secondary Urban Center | Distance to Structural Road Network | Suitability for Susceptibility to Change in Land Use/Land Cover | Weight | |
|---|---|---|---|---|---|
| Distance to main urban center | 1 | 2 | 3 | 4 | 0.4673 |
| Distance to secondary urban center | 1/2 | 1 | 2 | 3 | 0.2772 |
| Distance to structural road network | 1/3 | 1/2 | 1 | 2 | 0.1601 |
| Suitability for susceptibility to change in land use/land cover | 1/4 | 1/3 | 1/2 | 1 | 0.0954 |
| Urban Area | Area in 2017 (ha) | Expansion Area (Hectares) | EI Index 2017–2033 | EI Index 2017–2049 | |||
|---|---|---|---|---|---|---|---|
| 2033 | 2049 | % | Explanation (Expansion) | % | Explanation (Expansion) | ||
| Temuco | 3479.6 | 5183.7 | 5506.9 | 0.168 | high-speed | 0.100 | medium-speed |
| Padre Las Casas | 582.1 | 663.5 | 712.5 | 0.008 | low-speed | 0.006 | low-speed |
| Labranza | 201.1 | 293.9 | 601.7 | 0.009 | low-speed | 0.020 | low-speed |
| Vilcún (Cajón sector) | 76.1 | 186.5 | 184.9 | 0.011 | low-speed | 0.005 | low-speed |
| Temuco city | 4338.9 | 6327.5 | 7006.1 | 0.196 | high-speed | 0.132 | medium-speed |
| Total area of study | 63.360 | ||||||
Publisher’s Note: MDPI stays neutral with regard to jurisdictional claims in published maps and institutional affiliations. |
© 2021 by the authors. Licensee MDPI, Basel, Switzerland. This article is an open access article distributed under the terms and conditions of the Creative Commons Attribution (CC BY) license (http://creativecommons.org/licenses/by/4.0/).
Share and Cite
Maturana, F.; Morales, M.; Peña-Cortés, F.; Peña, M.A.; Vielma, C. Urban Growth, Real Estate Development and Indigenous Property: Simulating the Expansion Process in the City of Temuco, Chile. ISPRS Int. J. Geo-Inf. 2021, 10, 101. https://doi.org/10.3390/ijgi10020101
Maturana F, Morales M, Peña-Cortés F, Peña MA, Vielma C. Urban Growth, Real Estate Development and Indigenous Property: Simulating the Expansion Process in the City of Temuco, Chile. ISPRS International Journal of Geo-Information. 2021; 10(2):101. https://doi.org/10.3390/ijgi10020101
Chicago/Turabian StyleMaturana, Francisco, Mauricio Morales, Fernando Peña-Cortés, Marco A. Peña, and Carlos Vielma. 2021. "Urban Growth, Real Estate Development and Indigenous Property: Simulating the Expansion Process in the City of Temuco, Chile" ISPRS International Journal of Geo-Information 10, no. 2: 101. https://doi.org/10.3390/ijgi10020101
APA StyleMaturana, F., Morales, M., Peña-Cortés, F., Peña, M. A., & Vielma, C. (2021). Urban Growth, Real Estate Development and Indigenous Property: Simulating the Expansion Process in the City of Temuco, Chile. ISPRS International Journal of Geo-Information, 10(2), 101. https://doi.org/10.3390/ijgi10020101