Article

Exploring the Influence of E-Hailing Applications on the Taxi Industry—From the Perspective of the Drivers

1
School of Remote Sensing and Information Engineering, Wuhan University, Wuhan 430079, China
2
Department of Civil and Environmental Engineering, Norwegian University of Science and Technology, 7491 Trondheim, Norway
*
Author to whom correspondence should be addressed.
ISPRS Int. J. Geo-Inf. 2021, 10(2), 77; https://doi.org/10.3390/ijgi10020077
Submission received: 3 January 2021 / Revised: 9 February 2021 / Accepted: 13 February 2021 / Published: 16 February 2021

Abstract

:
In China, the traditional taxi industry is conforming to the trend of the times, with taxi drivers working with e-hailing applications. This reform is of great significance, not only for the taxi industry, but also for the transportation industry, cities, and society as a whole. Our goal was to analyze the changes in driving behavior since taxi drivers joined e-hailing platforms. Therefore, this paper mined taxi trajectory data from Shanghai and compared the data of May 2015 with those of May 2017 to represent the before-app stage and the full-use stage, respectively. By extracting two-trip events (i.e., vacant trip and occupied trip) and two-spot events (i.e., pick-up spot and drop-off spot), taxi driving behavior changes were analyzed temporally, spatially, and efficiently. The results reveal that e-hailing applications mine more long-distance rides and new pick-up locations for drivers. Moreover, driver initiative have increased at night since using e-hailing applications. Furthermore, mobile payment facilities save time that would otherwise be taken sorting out change. Although e-hailing apps can help citizens get taxis faster, from the driver’s perspective, the apps do not reduce their cruising time. In general, e-hailing software reduces the unoccupied ratio of taxis and improves the operating ratio. Ultimately, new driving behaviors can increase the driver’s revenue. This work is meaningful for the formulation of reasonable traffic laws and for urban traffic decision-making.

1. Introduction

Ride-sourcing services, as an essential part of mobile sharing, has brought about significant changes to the way people travel. Ride-sourcing services include e-hailing services (ERSs), which are on-demand services that connect private car owners and passengers via smartphones. As ride-sourcing provides high-quality services for passengers, it is widely used by the public. However, with the rapid expansion of e-hailing software, the taxi industry has sustained heavy losses [1,2,3], in terms of market share, income, and labor [4].
The convenience of e-hailing apps can be observed in every facet of travel, including planning a trip, hailing and waiting for a cab, arriving at a destination, payment, and feedback (mainly evaluation of a service). The advanced internet technology of e-hailing apps supports service quality—including trip reliability, security, accessibility, and accountability. Before hailing a trip, the apps can predict the price of the ride and the waiting time to decrease travel uncertainty [5], especially for people with mixed modes of travel and who need to be somewhere on time. Additionally, these apps can enhance the safety of travel, as they supply path planning and real-time location data to make the passenger feel more secure [6]. Moreover, hailing a taxi can be more convenient due to the matching algorithm. For example, passengers can make car requests anywhere they are; drivers are matched with nearby riders [7]. When arriving at a destination, the passenger pays the fare via an electronic payment, such as a credit card instead of cash [8]. Finally, the accountability mechanism has been improved so that passengers can rate drivers directly within the app [9]. Drivers perceived as providing poor service receive low scores, which can impact their likelihood of receiving future requests.
Concerning the taxi industry: positive development of the traditional taxi industry can be promoted if taxi drivers work with e-hailing apps.
On 1 June, 2015, the Shanghai Taxi Information Service Platform (STISP, hereafter referred to as the “platform”) was officially launched, with joint participation from the Shanghai Transportation Commission, the four major taxi companies in Shanghai, and the “DiDi” (DiDi is a Chinese transportation network company that offers e-hailing ride services, holding approximately 99% of the market as of September 2015). This is the first time that a car-hailing app has officially cooperated with the authorities, marking the opening of doors between local traffic control departments and China’s largest internet taxi company. Since the launch of the platform, the taxi industry now shares the technology with DiDi; therefore, we wonder, what will happen to taxi drivers using the latest technology? How do these changes affect drivers? Can this technology eventually bring more benefits to drivers?
To explore answers to these questions, this paper compared the trajectory data of May 2015 to those of May 2017 based on the two stages of taxi drivers in Shanghai, i.e., the before-app stage and the full-use stage. We extracted two-trip events (i.e., vacant trip and occupied trip) and two-point events (i.e., pick-up point and drop-off point) from the trajectory data, and then analyzed the spatiotemporal changes and efficiency. This study provides the basis and suggestions for promoting cooperation between the taxi industry and the transportation network companies (TNCs), contributing to the healthy development of innovative transportation.
The remainder of the paper is organized as follows: Section 2 briefly reviews related studies, and Section 3 describes the data and preprocessing. Section 4 analyzes the spatiotemporal changes in taxi driving behavior and compares the operational efficiency and revenue. Section 5 analyzes the findings and provides the discussion. Finally, the findings of this paper are summarized in the last section.

2. Related Works

Floating car data (FCD) have been widely used to analyze the behaviors of taxi drivers. Liu et al. [10,11] attempted to detect taxi operating patterns, as well as the mobility patterns of high-income drivers, by observing spatiotemporal driving behaviors. Li et al. [12] explored the origins and destinations of cruising trips and discovered the drivers’ passenger-finding strategies. Based on FCD analysis, with 33,000 taxis, Yuan et al. [13] presented a recommendation system for taxi drivers to pick passengers with the fastest route at a given time and location. In a similar study, Yuan et al. [14] mined mobility patterns of pick-up and drop-off behaviors and developed a recommendation system for both drivers and passengers, with 12,000 taxis in 110 days. Moreover, some research has aimed to improve the profit of taxi drivers. Ding et al. [15] compared the stationary points and cruising trips between the top and bottom income driver groups, using FCD with 2000 taxis for 47 days in Shanghai, China. Naji et al. [16] classified taxi drivers into three groups based on their average daily income, revealed the relationship between spatiotemporal operating behavior with their profits, and suggested improvements for revenue and efficiency. Gao et al. [17] attempted to explore the revenues in different pick-up locations, and tried to determine high-income strategies for taxi drivers. Moreover, visualization methods have also been used to understand taxi operating. Powell et al. [18] visualized a spatiotemporal profit map to guide drivers in reducing their unoccupied rate and cruising time to increase profit. Shen et al. [19] analyzed and visualized hotspots based on short-dated FCD to help cruising taxi drivers find potential passengers.
Since ride-sourcing has only emerged in recent years and the data of TNCs are private, relevant research analyzing the influence of e-hailing apps on the traditional taxi market are relatively limited. Leng et al. [20] collected 37-day trip data of over 9000 taxis to address the influence of the subsidy war in Beijing on taxi services. Using the taxi trajectory data of Shenzhen from 2013 to 2015, Nie [21] examined the impact of the subsidy war on the taxi industry and explored the benefits and drawbacks of e-hailing apps and traditional taxis, as compared to one another in spatiotemporal driving behavior. Similarly, Fang et al. [22] focused on the changes of taxicabs under an e-hailing app subsidy war in the operation zones, based on FCD of 9648 taxicabs in Shenzhen, China. However, few studies have focused on taxi drivers’ changes before and after they began working with e-hailing apps. Ye et al. [23,24,25] conducted relative research from the perspective of supply and demand for taxi services based on taxi trajectory data in Shanghai in 2012, 2015, and 2016 for each week, and analyzed the changes in taxi orders after the development of e-hailing apps.
Unlike previous studies, we used two datasets of taxi trajectories with a duration of one month in two years (2015 and 2017), in order to determine the impact of e-hailing apps on taxi operations. The two datasets were selected from the same month in the two years (i.e., May), in order to rule out the influence of seasonal changes in the taxi industry. We note that 2016 was a transition year, as e-hailing apps were being widely deployed in the taxi market. Therefore, selecting datasets in 2015 and 2017 made the data more comparable. Our goal was to analyze the changes in taxi driving behavior after taxi drivers joined e-hailing platforms. Therefore, this paper extracted two-trip events (i.e., vacant trip and occupied trip) and two-spot events (i.e., pick-up spot and drop-off spot), and analyzed taxi driving behavior (i.e., occupied distance, unoccupied duration, pick-up location, payment duration, traffic flow, unoccupied ratio, operating ratio, and revenue) changes temporally, spatially, and efficiently. To the best of our knowledge, to date, little attention has been paid to exploring the impact of e-hailing apps on the work of taxi drivers. This research attempted to answer the following questions: (1) what changes can e-hailing apps bring to taxi drivers? (2) How do these changes affect drivers? (3) Can these apps eventually bring drivers more benefits?

3. Dataset and Preprocessing

3.1. Study Dataset

Since our focus was to examine the impact of e-hailing applications on taxi drivers, it was necessary to first review the major events leading to the cooperation of TNCs with the taxi industry in the city of Shanghai. On 1 June, 2015, the Shanghai Taxi Information Service Platform was officially launched. This platform connects the local taxi dispatch center with DiDi. In September 2015, DiDi officially partnered with Shanghai Seagull Holdings Co., Ltd., to set up Shanghai Seagull Taxi Driver Service. In April 2016, DiDi signed a contract with Haibo Rentals in Shanghai to establish strategic cooperation. Additionally, DiDi experienced a fiercely competitive process. On 14 February, 2015, DiDi announced a strategic merger with Fast Taxi. On 1 August, 2016, Uber in China merged with DiDi. On 21 March, 2018, the Meituan officially launched a new competition with DiDi in Shanghai, which was initially developed in Nanjing. Combined with the history of DiDi cooperating with the government, and the events of DiDi swallowing up other powerful competitors, we can infer two points: (1) 2016 was a transition year, with e-hailing apps being widely deployed in the taxi market; (2) the e-hailing app subsidy war was avoided in May 2015 and May 2017.
This study was based on two types of datasets. The first dataset was the taxi trajectories covering the two periods of May 2015 and May 2017, which represent the before-app and the full-use stages in Shanghai. We chose the same month to exclude seasonal effects. From the events described above, we can see that the two periods avoided the impact of the subsidy war. Moreover, our trajectory dataset of the two different years was offered by the same company to ensure similar driving experiences in the two periods. Under the above premise, the platform caused the changes in driving behaviors. The GPS sampling frequency of the dataset was 10 s. The dataset covers about 5000 taxis in each of the two periods (above 11% of all registered taxis in Shanghai) and records 10 attributes, i.e., date, time, company name, car ID, longitude, latitude, velocity, direction, car status, and GPS effectiveness(describe whether the sampling point is effective). The second dataset is Shanghai’s administrative division map and road network data. The road network data include spatial information (polyline layer of road) and attribute information (road name, ID number, width and length, etc.).

3.2. Preprocessing

The study area was the land area of Shanghai (excluding Chongming Island). The data preprocessing steps for FCD were as follows: (1) deleting the default records, drift points, and error data; (2) converting latitudes and longitudes to projected coordinate system, and then calculating the distance and time difference of adjacent records (clearly, the time difference was 10 s, the same as the temporal resolution of the dataset, while the distance difference is the Euclidean distance based on the projected coordinates of the adjacent sampling points); (3) reconstructing occupied and vacant trips by slicing sequences with the same “car status” and estimating the distance and duration separately (the distance of the trip was the cumulative Euclidean distance of the adjacent sampling point), and deleting occupied trips that were too short (a distance less than 300 m, as such a journey does not constitute a taxi ride [26]); (4) matching occupied and unoccupied trips, re-cleaning, and then dividing FCD into two-trip events (i.e., vacant trip and occupied trip) and two-point events (i.e., pick-up point and drop-off point), as described in Table 1. It is not difficult to understand that the origin of an occupied trip and the pick-up spot are on the same place, and the location of the origin of a vacant trip corresponds to the drop-off spot; (5) randomly selecting 5000 taxis from each of the two periods. This process of randomized selection aimed to sure the number of sampling cars on both sides was the same.
Figure 1 displays the indicators used for the analysis. Depending on the status of a taxi, the trajectory was divided into occupied, i.e., with passengers (O), and unoccupied, i.e., without passengers (N). Obviously, the driving behavior of the former can directly affect a driver’s income. When a taxi was unoccupied, we regarded it as either looking for the next passenger or resting. Drivers often expect to find new customers faster and they spend more time taking orders to boost revenue. As for the two-spot events, a journey’s origin and destination corresponded to the pick-up spot event (P) and the drop-off spot event (D). If a taxi status changed from N to O, it was classified as a pick-up spot. Otherwise, it was designated a drop-off spot. The distribution of pick-up spots is mainly affected by demand.
E-hailing is an on-demand service bound to affect taxi drivers and it reflects the distribution of urban transportation capacity. When a destination is reached, traditional cash payments can waste a lot of time for a driver. It is a reasonable guess that taxi drivers could get help from an online payment facility and improve their work efficiency through the platform. Moreover, in regards to traffic flow—pick-up spots and drop-off spots could be taken into consideration. Pick-up spots and drop-off spots are referred to as the origin–destination of the trip (OD).
Next, this study analyzed the spatiotemporal patterns of two-trip events and two-spot events, as shown in Figure 1. In addition, we considered two sub-events of unoccupied trips, namely, cruising (C) and long break (B). Cruising refers to a taxi moving without a passenger, while a long break refers to being unoccupied for over an hour. Finally, we calculated the efficiency from the unoccupied ratio, the operating ratio, and the revenue.

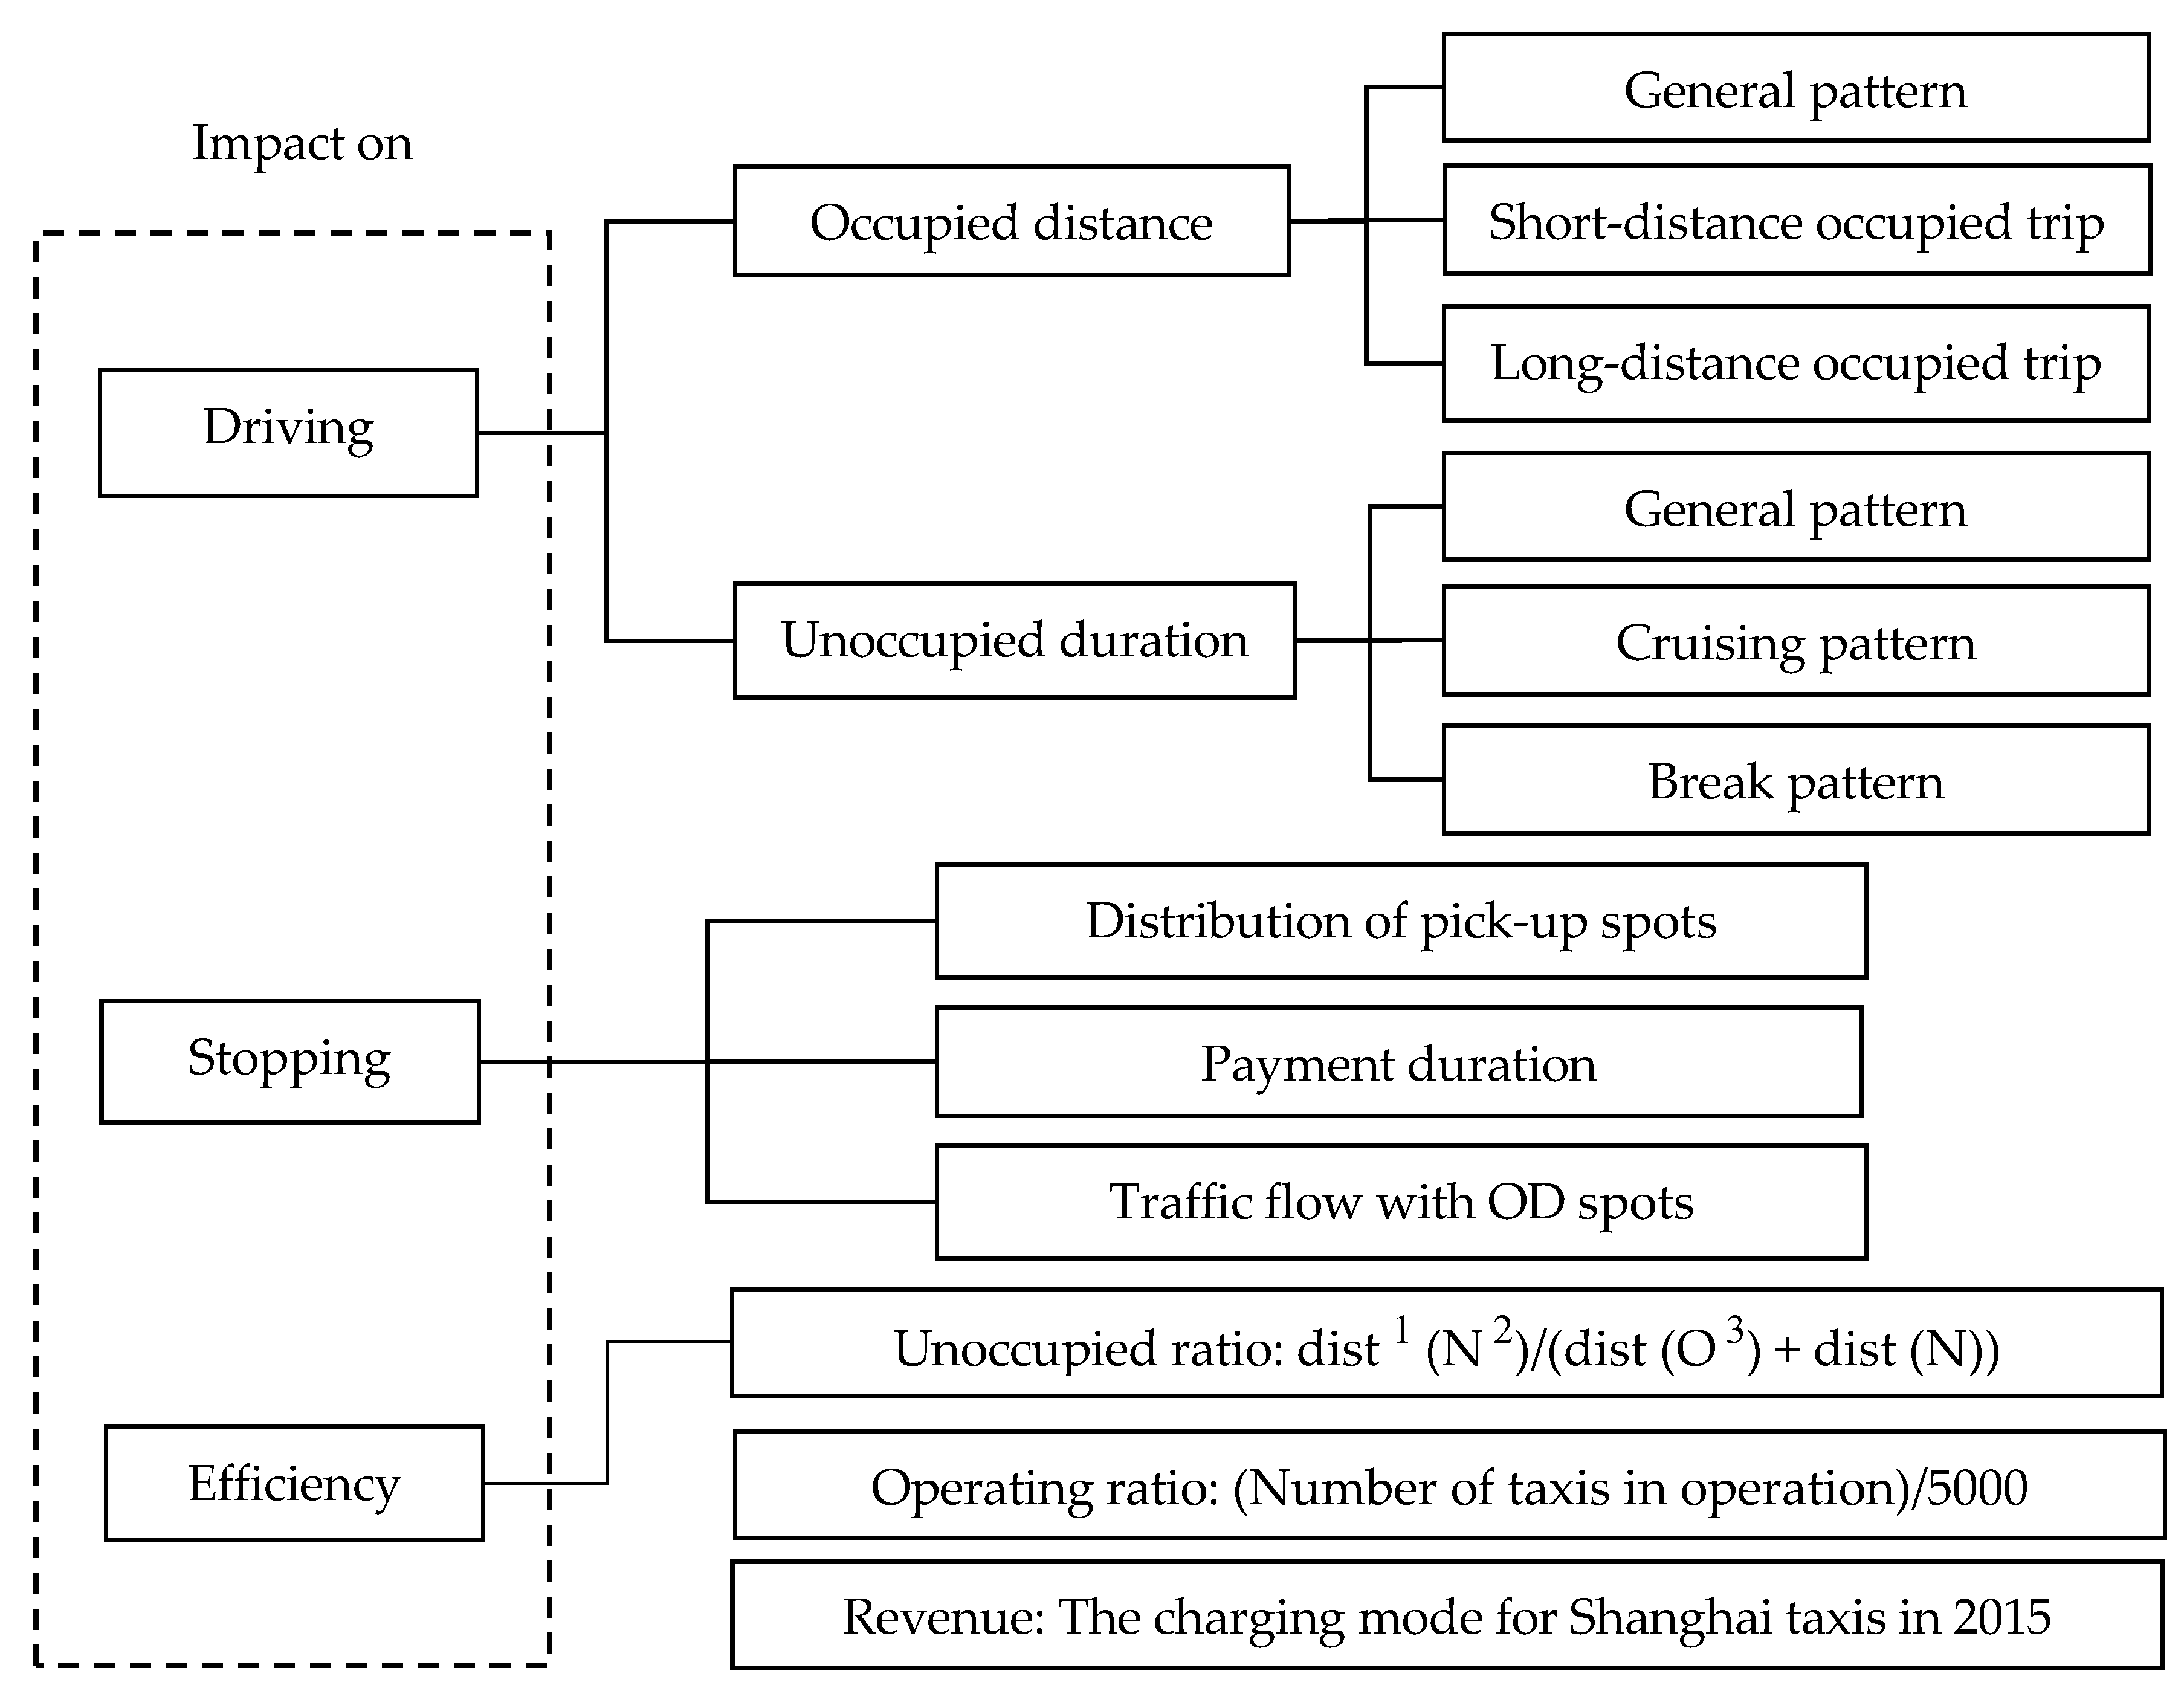
4. Spatiotemporal Patterns of Driving Behavior

In this section, we decomposed driving behavior into two-trip events (i.e., vacant trip and occupied trip) and two-spot events (i.e., pick-up spot and drop-off spot). Additionally, the unoccupied trip events are further categorized into two sub-events—cruising and breaks. Then, we analyzed and visualized the spatiotemporal patterns of all events of taxi driving behavior. Finally, we measured the impact of e-hailing apps from the perspective of efficiency.

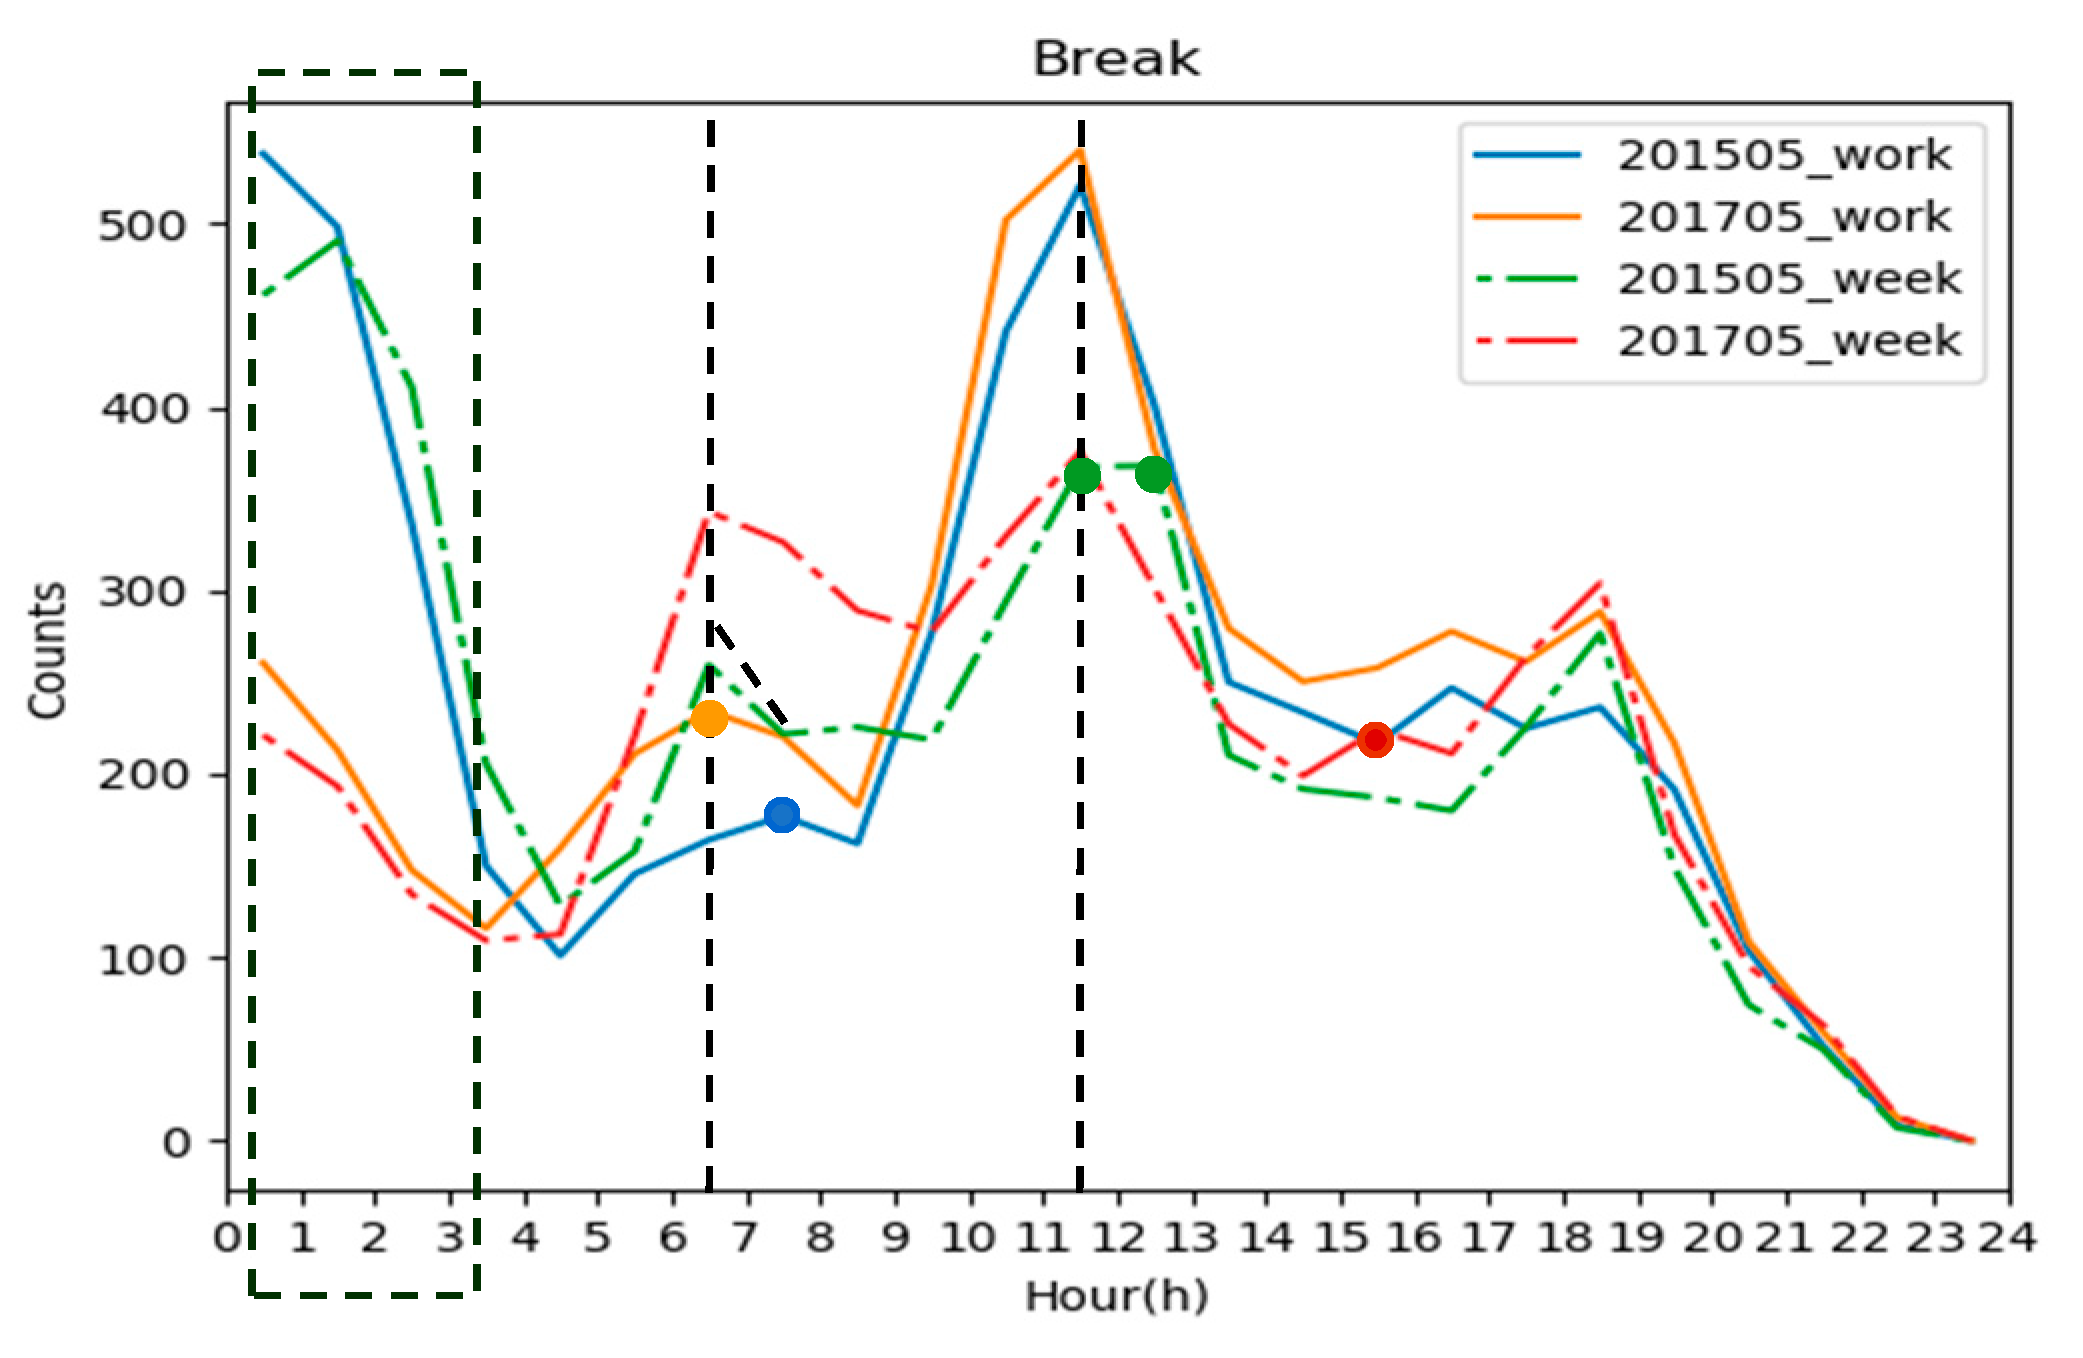
4.1. Temporal Patterns of the Occupied Journey

4.1.1. General Patterns

To get an overview of the occupied journey, we drew a frequency distribution map of the occupied trip distance, as shown in Figure 2. It can be observed that the patterns in Figure 2a,b are consistent. The proportion of trips ranging between 5 and 10 km was the largest, while the proportion of trips less than 5 km increased, and above 10 km decreased gradually.
It is widely known that Shanghai is an international metropolis with a very rich and dense transportation system. People prefer to ride the subway, as it is convenient and fast. On the contrary, longer distance rides via taxis incur high costs. Generally, people prefer a mixed-mode of travel, comprising subway, bus, and taxi rides, in order to achieve economically feasible transportation. Therefore, the proportion of short-distance trips was larger than that of long-distance trips. At the same time, it was found that when the distance ranged between 5 and 10 km, people preferred taxi rides. Occupied trips within 10 km on weekends were more frequent than that on weekdays, indicating that people have more nearby activities on weekends. This phenomenon is more prominent, as shown in Figure 2b.
Differences between Figure 2a,b can also be found. More than 80% of the occupied trips were within 10 km, while more than 90% were within 15 km in 2015. This can be explained by the fact that most taxi orders were within 10 km, and that a small number of drivers were willing to take passengers further than 15 km. In May 2017, the proportion of journeys over 10 km increased significantly compared to that of May 2015, and the proportion of trips within 3 km decreased rapidly. Therefore, it could be reasonably inferred that the platform allowed drivers to obtain more long-distance orders and less short-distance rides. A distance within 3 km was defined as a short-distance occupied trip (SDOT), while a distance further than 10 km was defined as a long-distance occupied trip (LDOT).

4.1.2. Temporal Patterns of Short- and Long-Distance Occupied Trips

In this subsection, we explored the temporal patterns of SDOT and LDOT. In order to compare the changes from 2015 to 2017, the growth rate of SDOT and LDOT in 24 h was calculated, according to Formula (1), as shown in Figure 3. Figure 3a shows that SDOT increased slightly on workdays and decreased on weekends. Figure 3b illustrates that LDOT experienced positive growth in 24 h, both on workdays and on weekends. To be more specific, the increase of LDOT on workdays was greater. As known, the SDOT demand often increased on the weekends and there was less demand for LDOT. Therefore, the phenomenon of software mining LDOT was more obvious on workdays. The growth rate during non-commuting hours, from 6:00 p.m. to 4:00 a.m., was high, approaching or exceeding 100% growth for workdays. The growth rate, from 10:00 a.m. to 1:00 p.m., was low, within 40%. Moreover, the growth rate during commuting hours was between 40% and 70%. We reasonably believe that the platform enables drivers to become more “active” at night and early in the morning so as to obtain more orders. Moreover, the platform is very prominent in digging LDOT. Since the capacity for the two years was close (same number of taxis in the two years), the amount of SDOT inevitably decreased. This change of occupied events had a direct impact on driving behavior, which finally affected the driver’s income.
Var = (Trip2017 − Trip2015)/Trip2015.

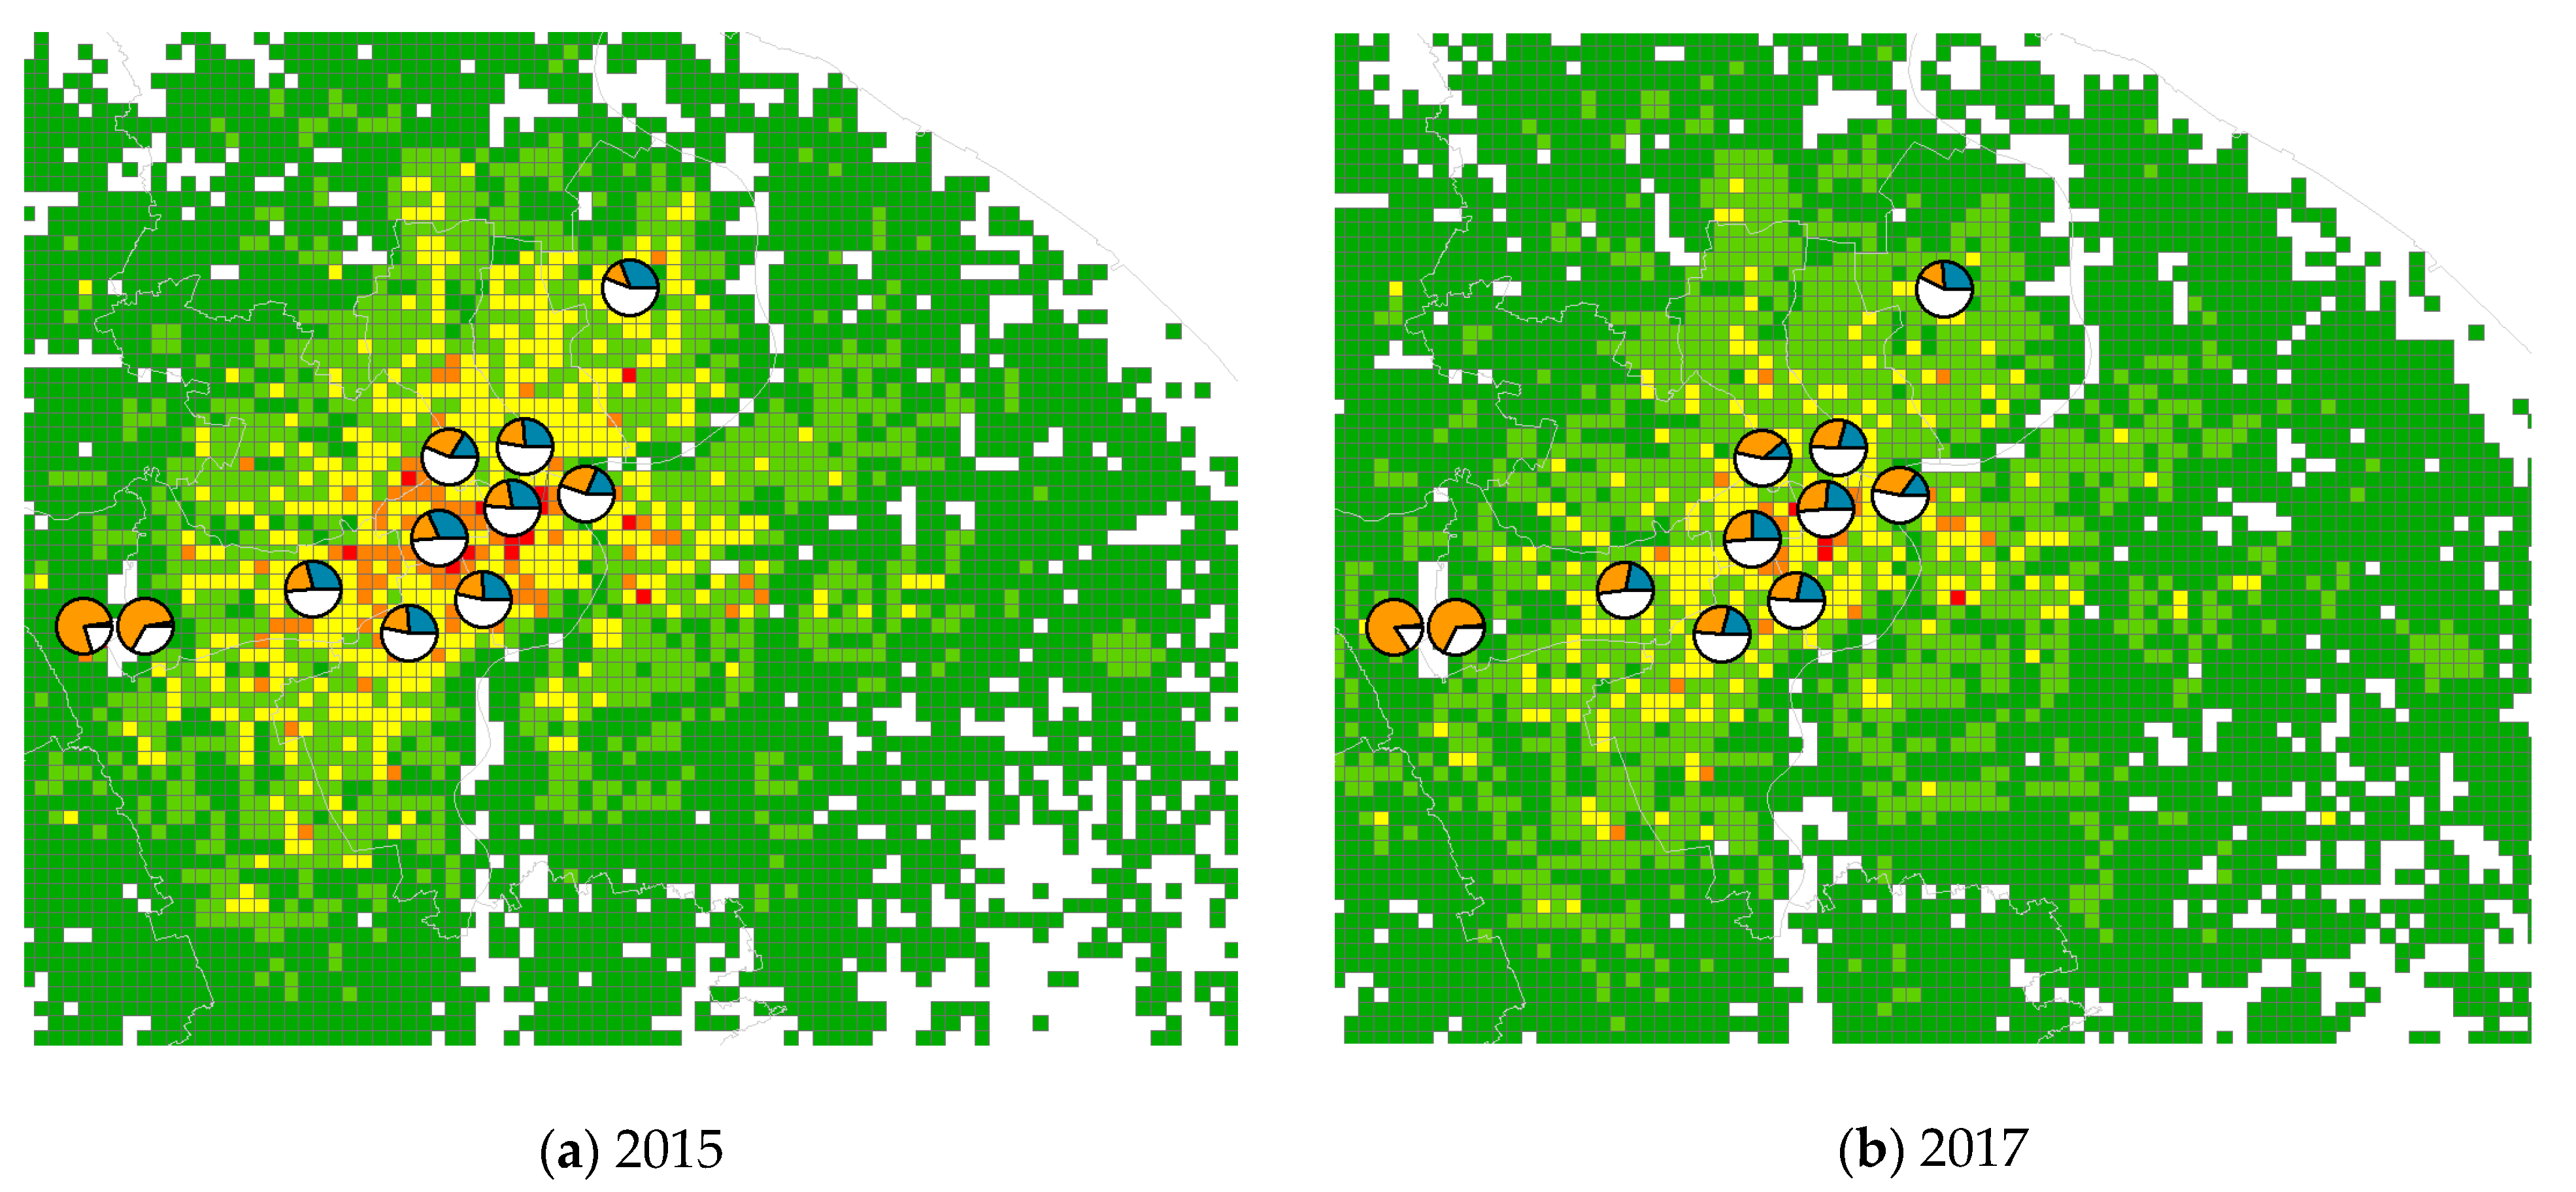
4.1.3. Spatial Patterns of the Occupied Journeys

The spatial patterns of SDOT and LDOT should also be considered, except for the temporal patterns. Pie charts were used to compare the patterns between 2015 and 2017. We made statistics on the start points of the occupied journeys based on grids and performed the density map in ArcGIS 10.2. According to the land use information around the densest areas on the heat map, the same hotspots were identified in the two stages, which were Hongqiao railway station, Hongqiao Airport, Gubei, Xujiahui, Sun-Moon-Light Center, Shanghai railway station, Wujiaochang, The Bound, Jingan Temple, People’s Square, and Lujiazui. Next, a heat map of the origins was used as a base map, and we created pie charts to show the SDOT and LDOT in each hotspot, as shown in Figure 4. As described above, we divided the occupied trips into three distance intervals: SDOT (<3 km), LDOT (>10 km), and medium-distance occupied trips between 3 and 10 km, and then we calculated in each hotspot area, on the base map, the number of trip events in each interval. The colors (i.e., blue for SDOT, orange for LDOT, and white for MDOT) of the pie chart sectors correspond to the three distance intervals, and these sectors are proportionally sized relative to the number of trips in each distance interval. Figure 4 reveals that all of the pie charts of the hotspots varied uniformly, with the proportion of SDOT decreasing and of LDOT increasing. This phenomenon is evident in Gubei, Xujiahui, Sun-Moon-Light Center, The Bound, Jingan Temple, People’s Square, and Lujiazui. Overall, the distance of occupied journeys became longer after taxi drivers joined the platform.

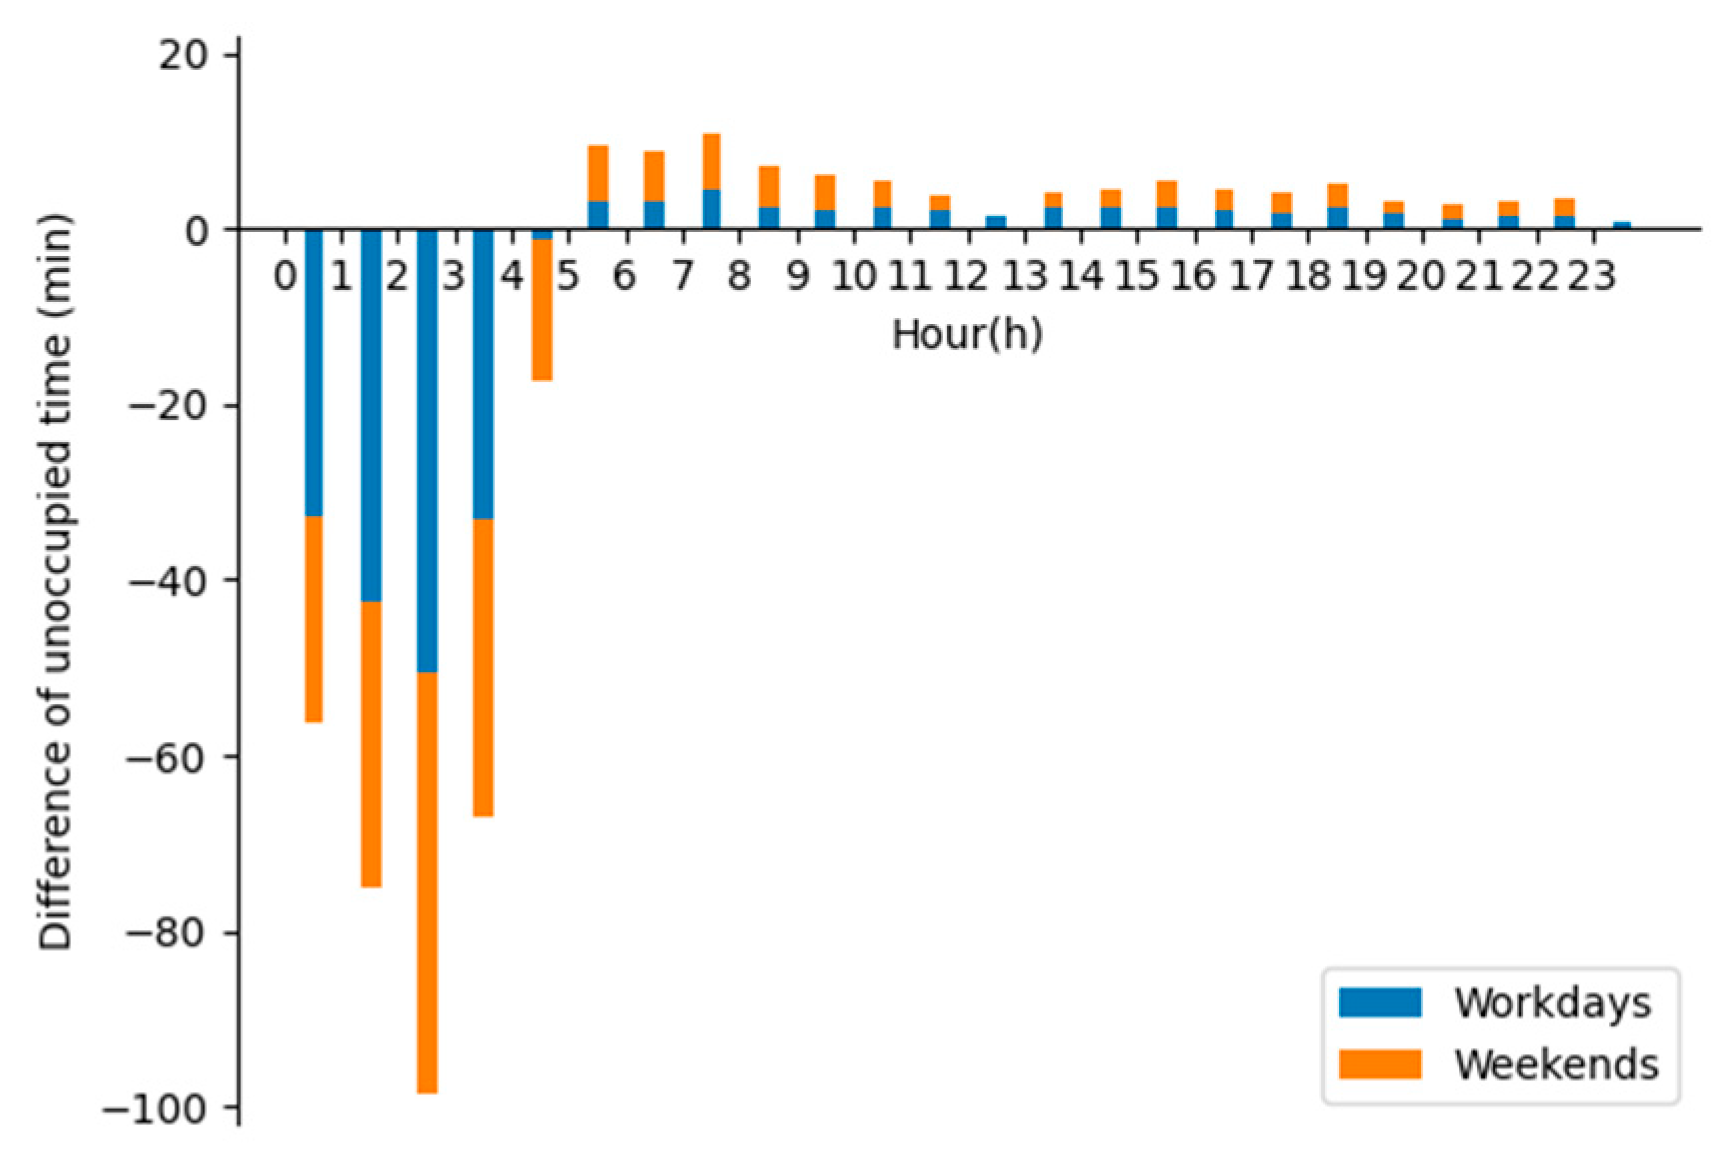
4.2. Temporal Patterns of Unoccupied Trips

According to whether the duration was long or not and whether the taxi was moving or not, an unoccupied trip was divided into three situations (as shown in Table 2): break (B), cruising (C), and standing (S). Generally, C is the most frequent state (when drivers hope to find customers as soon as possible). B refers to a long, unoccupied time, with the lowest frequency, which can better reflect the schedule of the rest. Drivers are passive in S; the location for S is often based on experience and is not affected by the platform. Therefore, C and B events were, herein, taken into account.

4.2.1. General Patterns

To get an overview of the unoccupied journeys, we drew a frequency distribution map of the duration of unoccupied trips (shown in Figure 5) and calculated the average hourly unoccupied duration between the two stages (shown in Figure 6). Figure 5 shows that drivers in 2017 usually lost a high proportion within 5 min, which increased to between 15 to 60 min. The cumulative frequency within 30 min exceeded 80%, and the cumulative frequency within 60 min exceeded 90%. This means that the platform’s algorithms could be matched quickly, but that drivers were unoccupied for longer than before using the platform. We should note that though the proportion over 60 min was lower than 7%, the increment over 60 min was small, but with a larger change ratio.
In Figure 6, one can see that the unoccupied durations significantly reduced in early morning time slots, before 5:00 a.m., and the platform provided more opportunities for orders. However, the unoccupied durations were longer during the daytime, especially from 9:00 a.m. to 7:00 p.m., which was unexpected to us. The unoccupied durations increased 1.2–4.2 min on weekdays and 1.5–6 min on weekends. To further mine these changes, it was necessary to analyze the two sub-events of unoccupied trips—cruising events and break events.

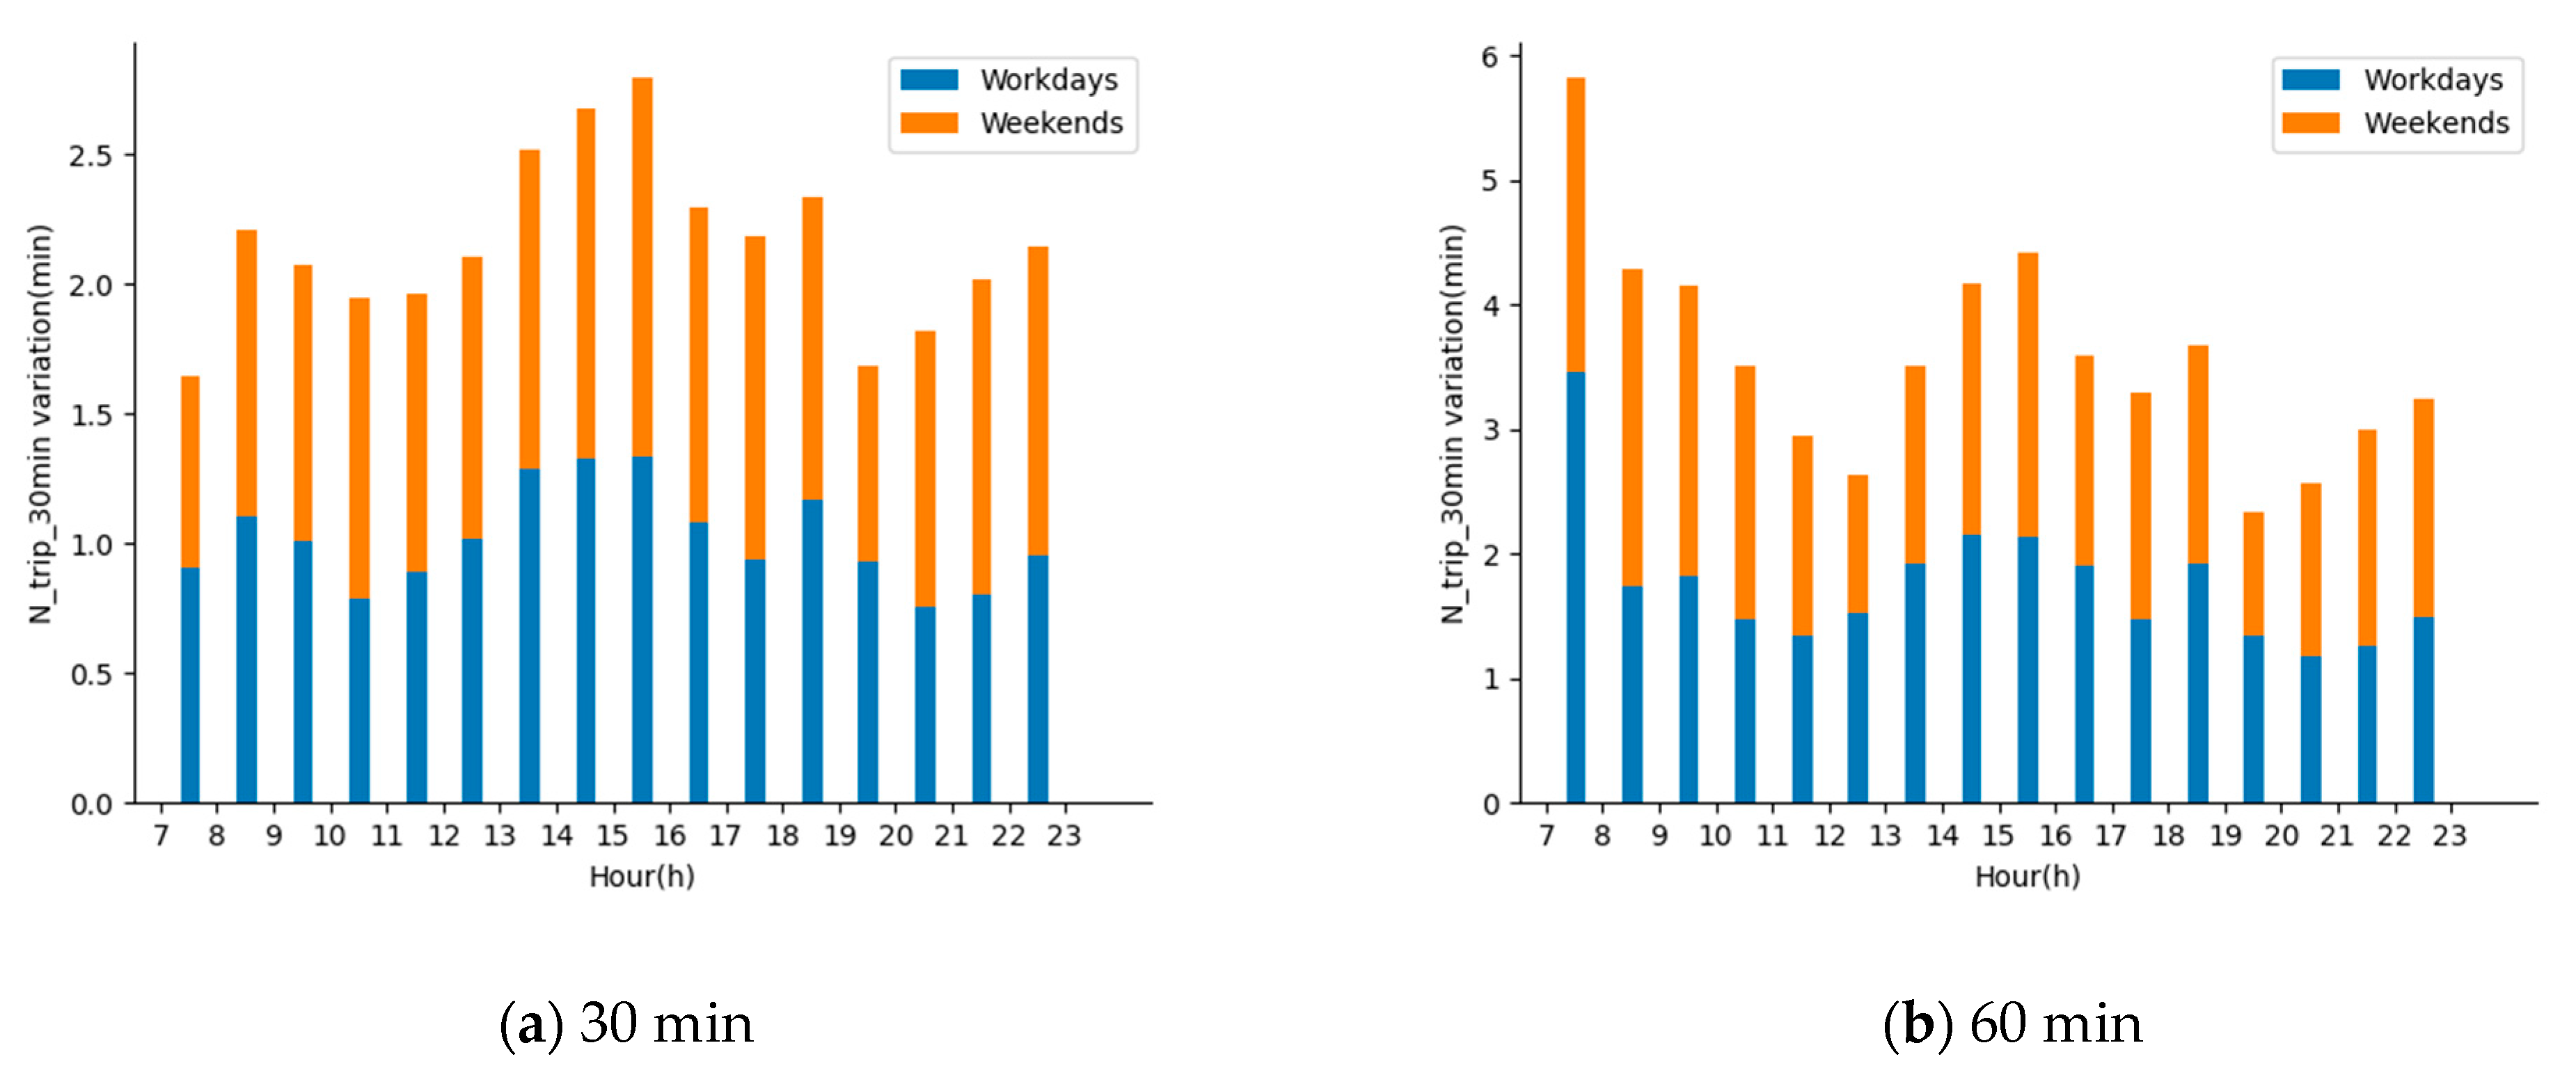
4.2.2. Temporal Patterns of Cruising Trips

Cruising is an essential manifestation of driving behavior, so the changes in the duration of cruising should be considered. Since the duration of cruising is also related to traffic pressure, we needed to distinguish rush hour, to eliminate the interference of increasing traffic pressure that occurs year-by-year. Simultaneously, there are far fewer resident riding trips in the early morning hours, leading to drivers rarely finding passengers. For cruising events, periods in the early morning are of little significance, and the commuting time from 7:00 a.m. to 11:00 p.m. was selected in Figure 7. The differences in the cruising durations within 30 and 60 min are shown in Figure 7a,b, respectively. Clearly, the platform had a negative impact on the drivers meeting customers. Figure 7a shows that the drivers in 2017 took more time, approximately 0.7–1 min to meet customers using the platform on weekdays, and 0.2–1.5 min on weekends. Figure 7b shows that the drivers in 2017 took more time, approximately 1.1–3.5 min, to meet customers using the platform on weekdays and 1–2.4 min on weekends. Therefore, two conclusions can be made: (1) e-hailing did not help taxi drivers receive new orders faster, and (2) the extended cruising duration was partially caused by longer unoccupied durations. There are two possible explanations for a longer cruising duration. On the one hand, the platform dispatches orders following the principle of distance priority, which causes an unoccupied taxi to miss nearby opportunities. This means that the platform can result in drivers missing the nearest ride-hailing demands. On the other hand, fast matching does not mean fast meeting. When a driver is paired with a passenger, usually, there is still a distance between the two sides. Sometimes, passengers need to communicate with drivers to describe their location in detail. Therefore, drivers will take extra time to meet their passengers.

4.2.3. Temporal Patterns of Long-Unoccupied Trip

The rest of the events that occurred in 24 h are shown in Figure 8. After the taxi drivers began working with the platform, two changes occurred in terms of break events. The first and most apparent change was that long break events in the early morning decreased both on weekdays and weekends, and gradually rebounded during the daytime. The second is that there was a small change in the peak hours of break events: from 6:00 to 7:00 a.m. in 2015, moving back 1 h in 2017 on weekdays (or the peak advanced). There was another peak from 11:00 a.m. to 12:00 p.m. in 2015, extending to 5:00 p.m. in 2017 on weekends, and a new peak occurred from 3:00 to 4:00 p.m. on weekends in 2017, meaning that drivers had a new choice for the arrangement of rest time. We can infer that the ride information supplied by the platform allowed taxi drivers to become more flexible with their working schedules.

4.3. Spatiotemporal Patterns of Spot Events

The origin and destination of a journey corresponded to the pick-up and drop-off spot events. The spatial distribution of pick-up spots is affected by factors, such as ride demands, transportation hubs, road sections, and periods. Since the launch of STISP, e-hailing has helped to match supply and demand. This change can be understood from the spatiotemporal distribution of pick-up spots. Additionally, this change can also refresh the understanding of ride demands and can help allocate traffic resources rationally. As for drop-off spots, traditional cash payments waste time for the driver. Fortunately, drivers can now accept online payments and can improve their work efficiency via the platform. This is not only beneficial for drivers, but also speeds up urban operations.

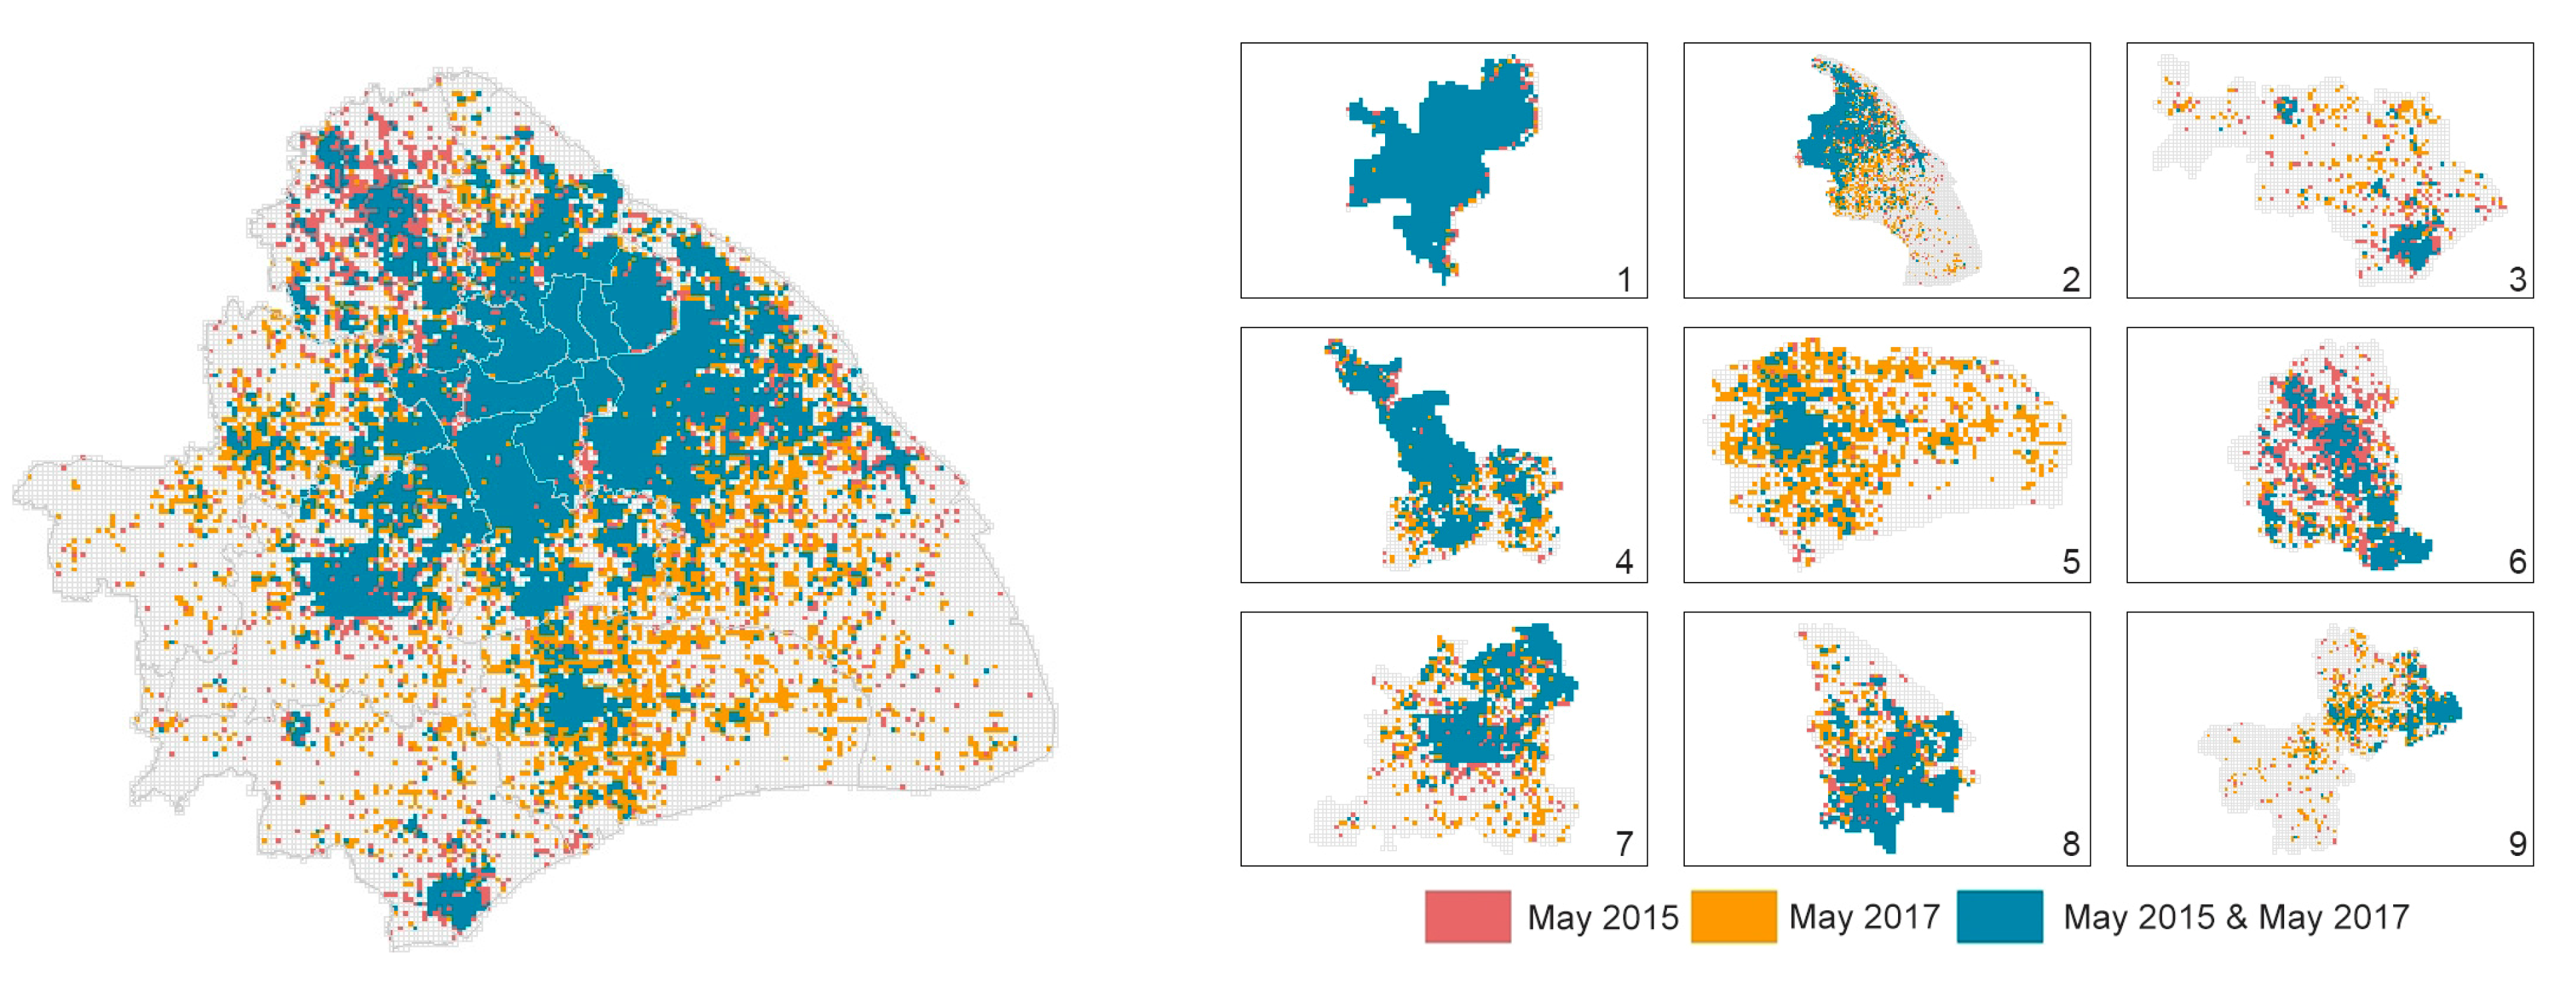
4.3.1. Spatial Patterns of Pick-Up Spots

Traditionally, citizens are more likely to go to main roads to take cabs. Pick-up spots often take place at key road junctions or on main roads. In order to highlight the change of pick-up locations, we adopted the “road network + grid” method to reflect the variations. The details of this “road network + grid” are as follows:
  • Step 1: based on the road data of Shanghai, generate buffers for all road segments and set a 1/2 road width as the radius. If the pick-up spots in May 2015 and May 2017 were located in the same buffer, these spots should be deleted.
  • Step 2: draw grids with a side length of 500 m to cover the land area of Shanghai (excluding Chongming Island). Then count whether the pick-up spots were covered in each grid.
Finally, Figure 9 displays the pick-up areas in May 2015 and May 2017 with pink and orange grids, respectively. The shared pick-up areas in May 2015 and May 2017 are indicated by the blue grids.
From the left of Figure 9; the number of pick-up grids in 2017 was more extensive and widespread. The details of each administrative area can be observed in the right of Figure 9. Broader and more comprehensive coverage occurred in Pudong New Area, Fengxian District, and Qingpu District. In Minhang District and Songjiang District, the coverage in 2017 was slightly wider than before. The distribution in Jinshan District, Baoshan District, and the urban center remained almost unchanged for the two stages, although the Jiading District had more rides in 2015. With the platform, when picking up passengers, taxi drivers are no longer confined to hotspots or trunk sections, but have more new options. Drivers are dispersed to where there is taxi demand to facilitate citizens, to reduce the drivers’ anxiety of cruising, and to dispatch urban transportation capacity reasonably.

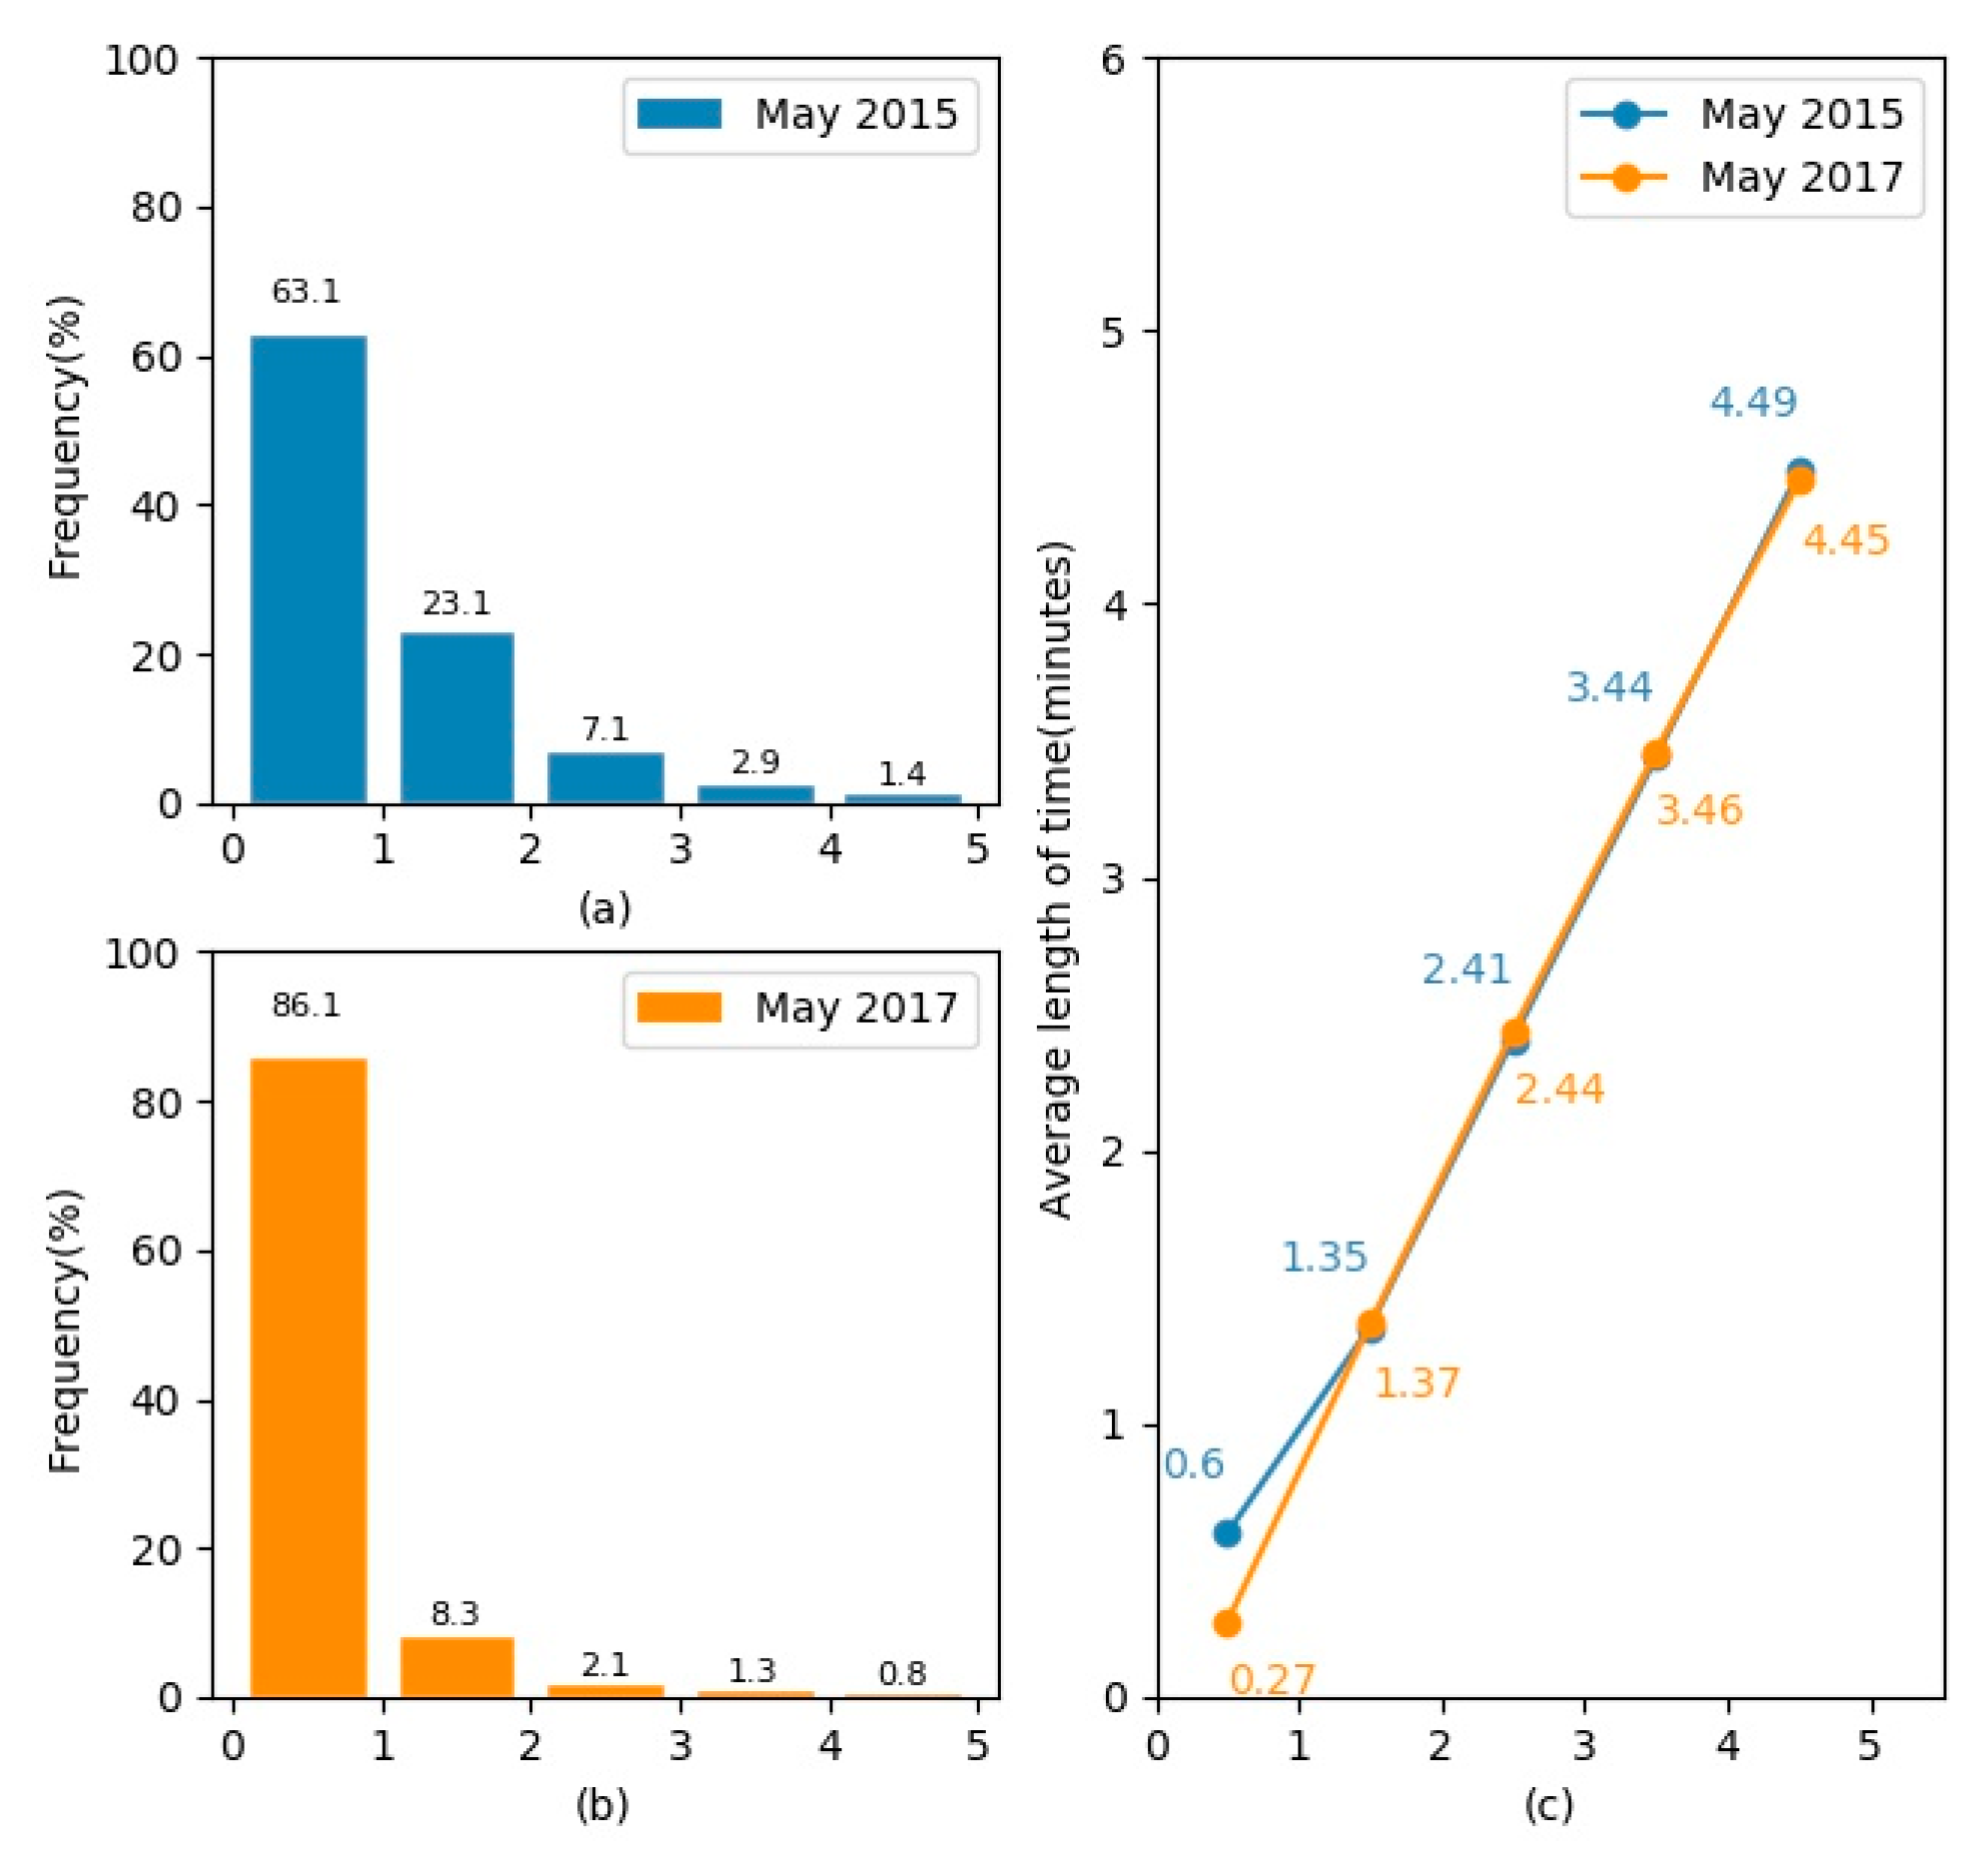
4.3.2. Temporal Patterns of Payment

In China, mobile payments are widely used (due to convenience). The information platform is connected to the mainstream domestic online payment channels (Alipay and WeChat), resulting in citizens preferring e-hailing. With a smartphone, citizens do not need to pay cash for a ride, and drivers are less troubled with having to dole out change, which saves time for both the supply and the demand sides, and affects taxi driving behavior. This behavior is called the payment event, which occurs after a drop-off event. A payment event starts with a drop-off point and ends at the first moving point, which means the duration of payment is the time interval between two points. Based on the definition above, there could be small mistakes in the extracted payment events. For instance, at midnight, the destination of the ride is often a karaoke bar, hotel, residential area, etc., where drivers also like to wait for passengers at night. Thus, drivers remain standing for their next orders after dropping off passengers. This situation results in a large error in the duration of payment. In order to eliminate the interference of remaining motionless on the spot after a drop-off, we observed the frequency distribution of the durations of payment and found that durations of more than 5 min accounted for less than 0.1%. Therefore, 5 min was set as the threshold of payment events, and payment durations that exceeded this threshold were eliminated.
In order to compare the payment durations in the two stages, two million payment events were randomly selected from each stage. In Figure 10a, the histogram represents the distribution of payment durations within 5 min in May 2015, while Figure 10b shows the payment events in May 2017. Furthermore, the average payment time in each bar is shown in Figure 10c.
Comparing Figure 10a with Figure 10b, 86% of the payment events in May 2017 were completed within 1 min, while 86% of the payment events in May 2015 required 2 min. Nearly 95% of the payment events in May 2017 were finished within 2 min, while the same proportion in May 2015 was extended to 5 min. We found the duration of payments to be significantly shortened after the introduction of the platform. In May 2017, most of the payments were accomplished within 1 min. It can be seen from Figure 10c that the duration of payments reduced from 36 to 16 s in 1 min. Not only did the proportion within 1 min increase, but the average payment time in 1 min did reduce. In general, the platform saved payment time for the drivers, and that saved time could then be used to pick-up more passengers or take a break. Even if the payment time shortened, the unoccupied time increased. Therefore, it can be inferred that the time saved was not used to cruise, and was more likely to be utilized for resting.

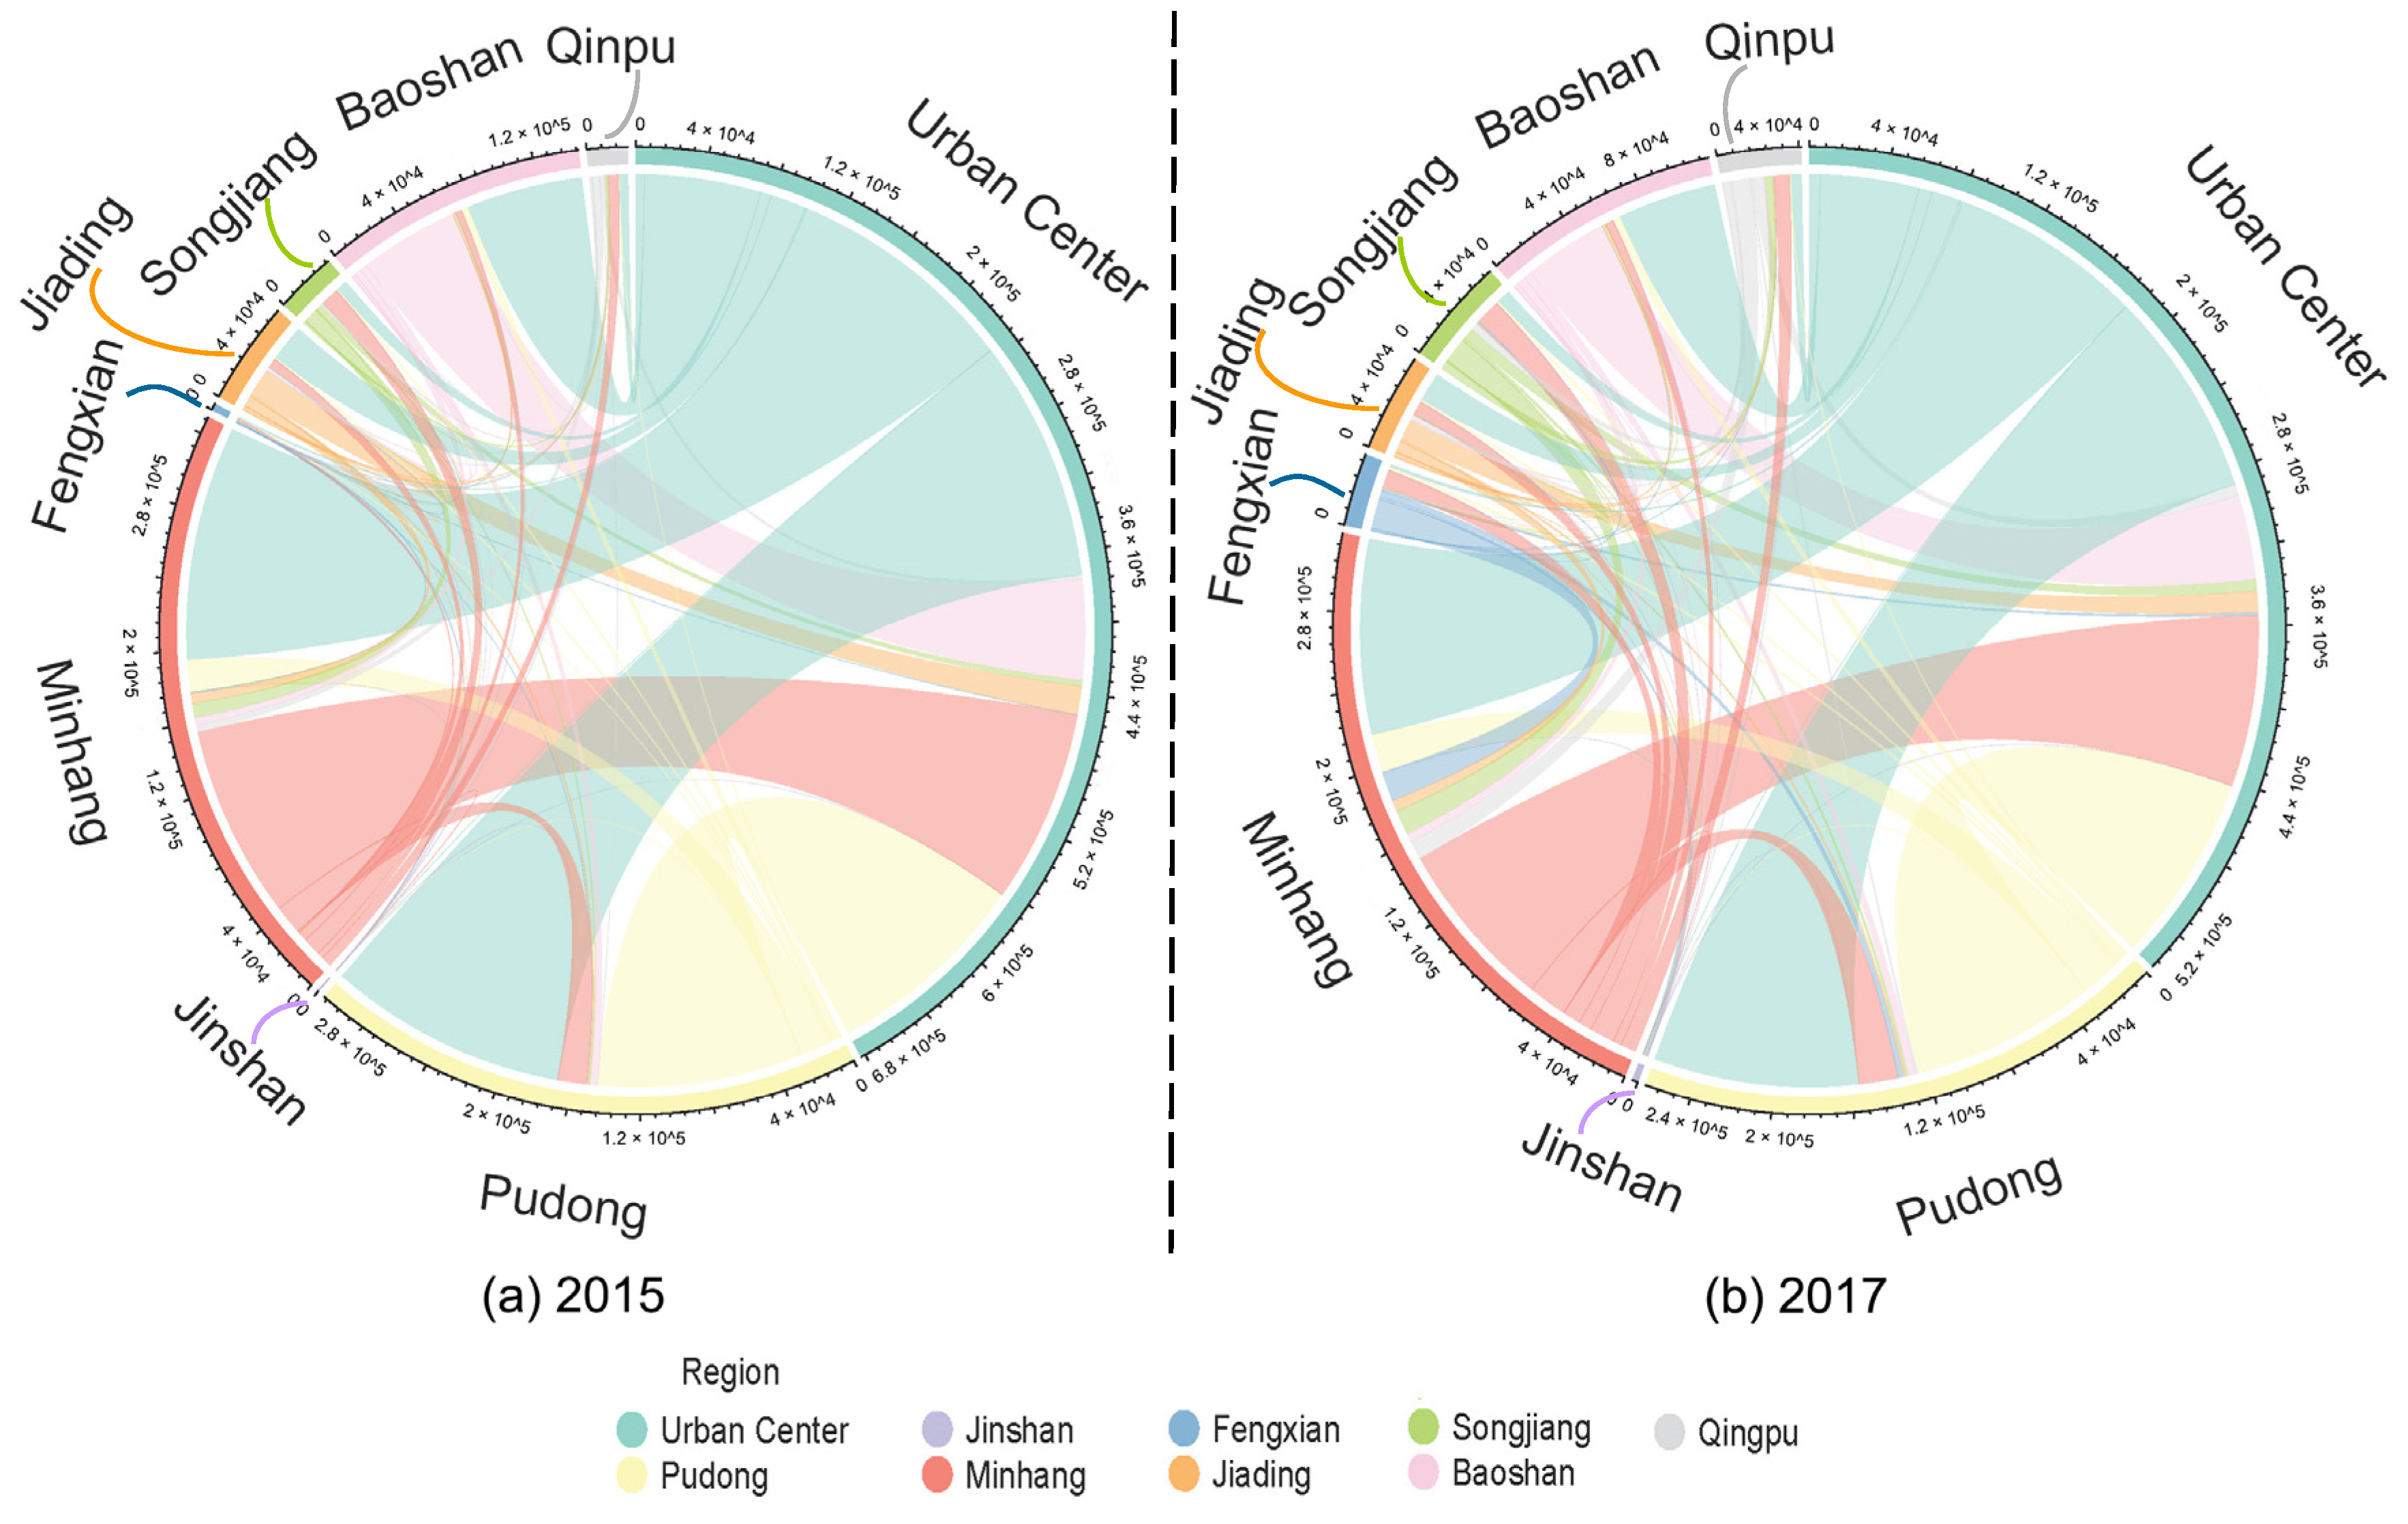
4.3.3. Spatial Patterns of Taxi Flow

According to the locations of the pick-up and drop-off points, the flows of all rides between the nine administrative regions could be counted. The traffic flows visualized by a chord diagram are shown in Figure 11. The different administrative regions in the figure are represented by arcs of different colors, and the bands of the same color as the arcs indicate that the taxis of the corresponding regions had driven to other regions. The bandwidth in the figure shows the absolute values. The wider the band, the heavier the volume of traffic. As an overview, five of the regions (urban center, Pudong, Minhang, Jiading, and Baoshan) were found to have a decreased flow after the deployment of e-hailing apps. On the contrary, the other four regions (Fengxian, Songjiang, Qingpu, and Jinshan) became more active. Specifically, three types of changes took place. First, the interaction between the urban center and four areas (Baoshan, Jiading, Minhang, and Pudong) weakened. As a result, both the in and out flow of the urban center, Pudong, and Baoshan declined. As for Jiading, this was mainly caused by fewer taxis coming from the urban center. Second, Fengxian, Qingpu, and Songjiang experienced slightly strengthened activity with Minhang. Third, Minhang became more active with the three regions of Fengxian, Songjiang, and Qingpu. Among them, the interaction between Songjiang and Qingpu was also enhanced. To sum up, the urban center became less attractive to taxi drivers, as the platform allowed drivers to receive orders from the suburbs. This is consistent with the above results of more scattered pick-up spots.

4.4. Efficiency and Revenue

4.4.1. Unoccupied Ratio

The unoccupied ratio is a measure of driving efficiency based on the distance of two trips, and is always an indication for improving the taxi dispatching system. The unoccupied ratio is calculated as distance (N)/(distance (O) + disttance (N)). Moreover, distance (O) is recorded in the “dis” property of occupied events, and distance (N) is recorded in the “dis” property of unoccupied events. We gathered the “dis” of the two events, and calculated the unoccupied ratio of each hour. Figure 12 shows the unoccupied ratio within 24 h; Figure 12a shows the workdays, while Figure 12b shows the weekends. In Figure 12a, the phenomenon of unoccupied driving can be seen to have eased. The unoccupied ratio at night from 12:00 to 5:00 a.m. decreased significantly, related to the platform dispatching orders and the drivers’ increasing initiatives to find customers. In the daytime, after 7:00 a.m., there was a slightly relieved unoccupied running. Figure 12b shows that the unoccupied ratio decreased on weekends, but declined far less than that on weekdays. In general, the platform reduces the unoccupied ratio of taxis.

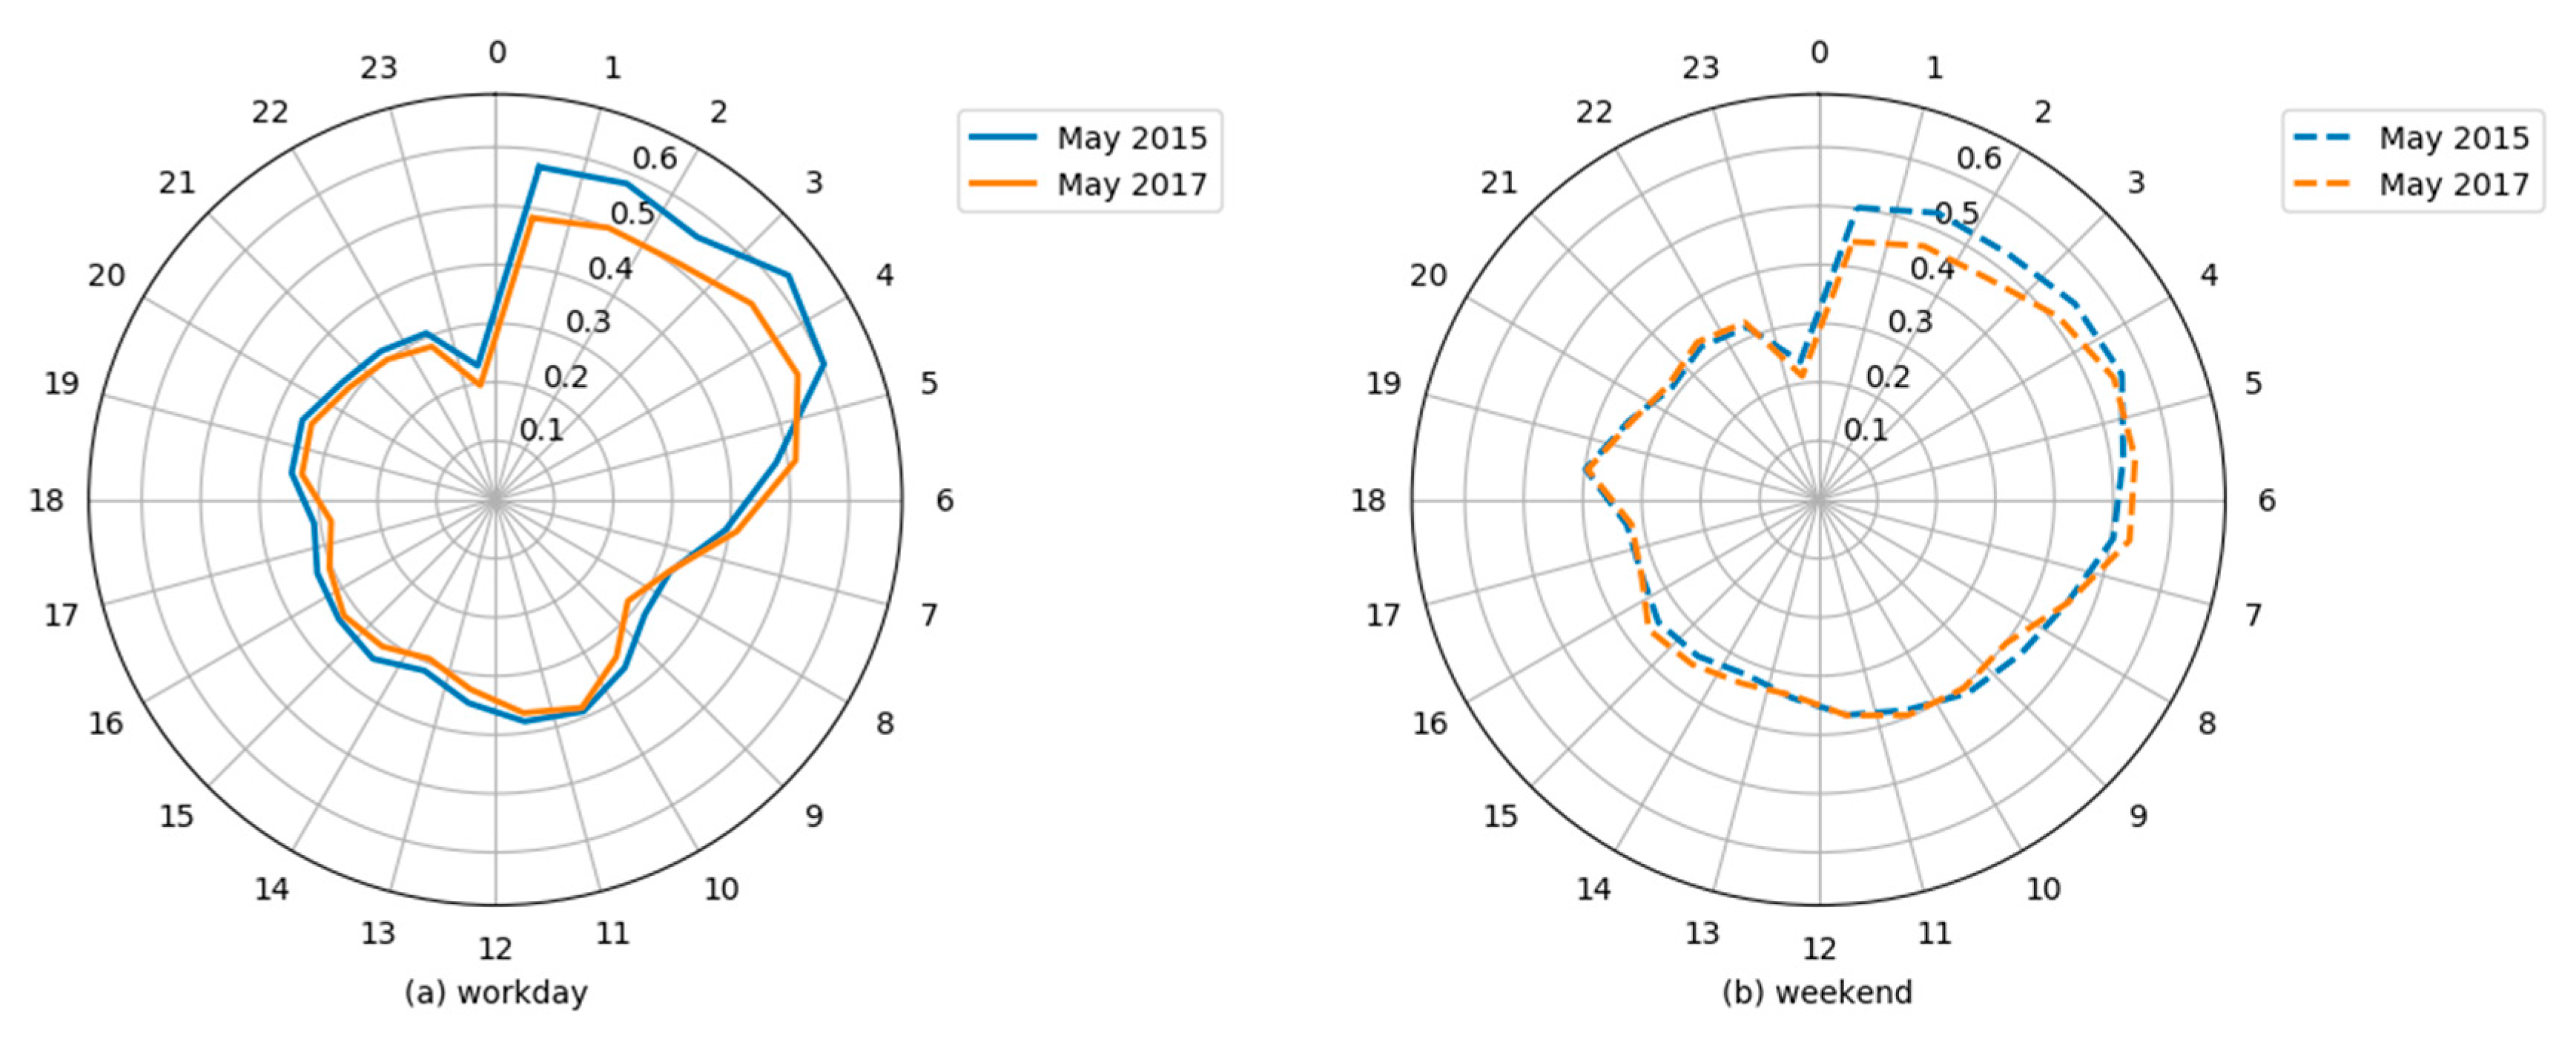
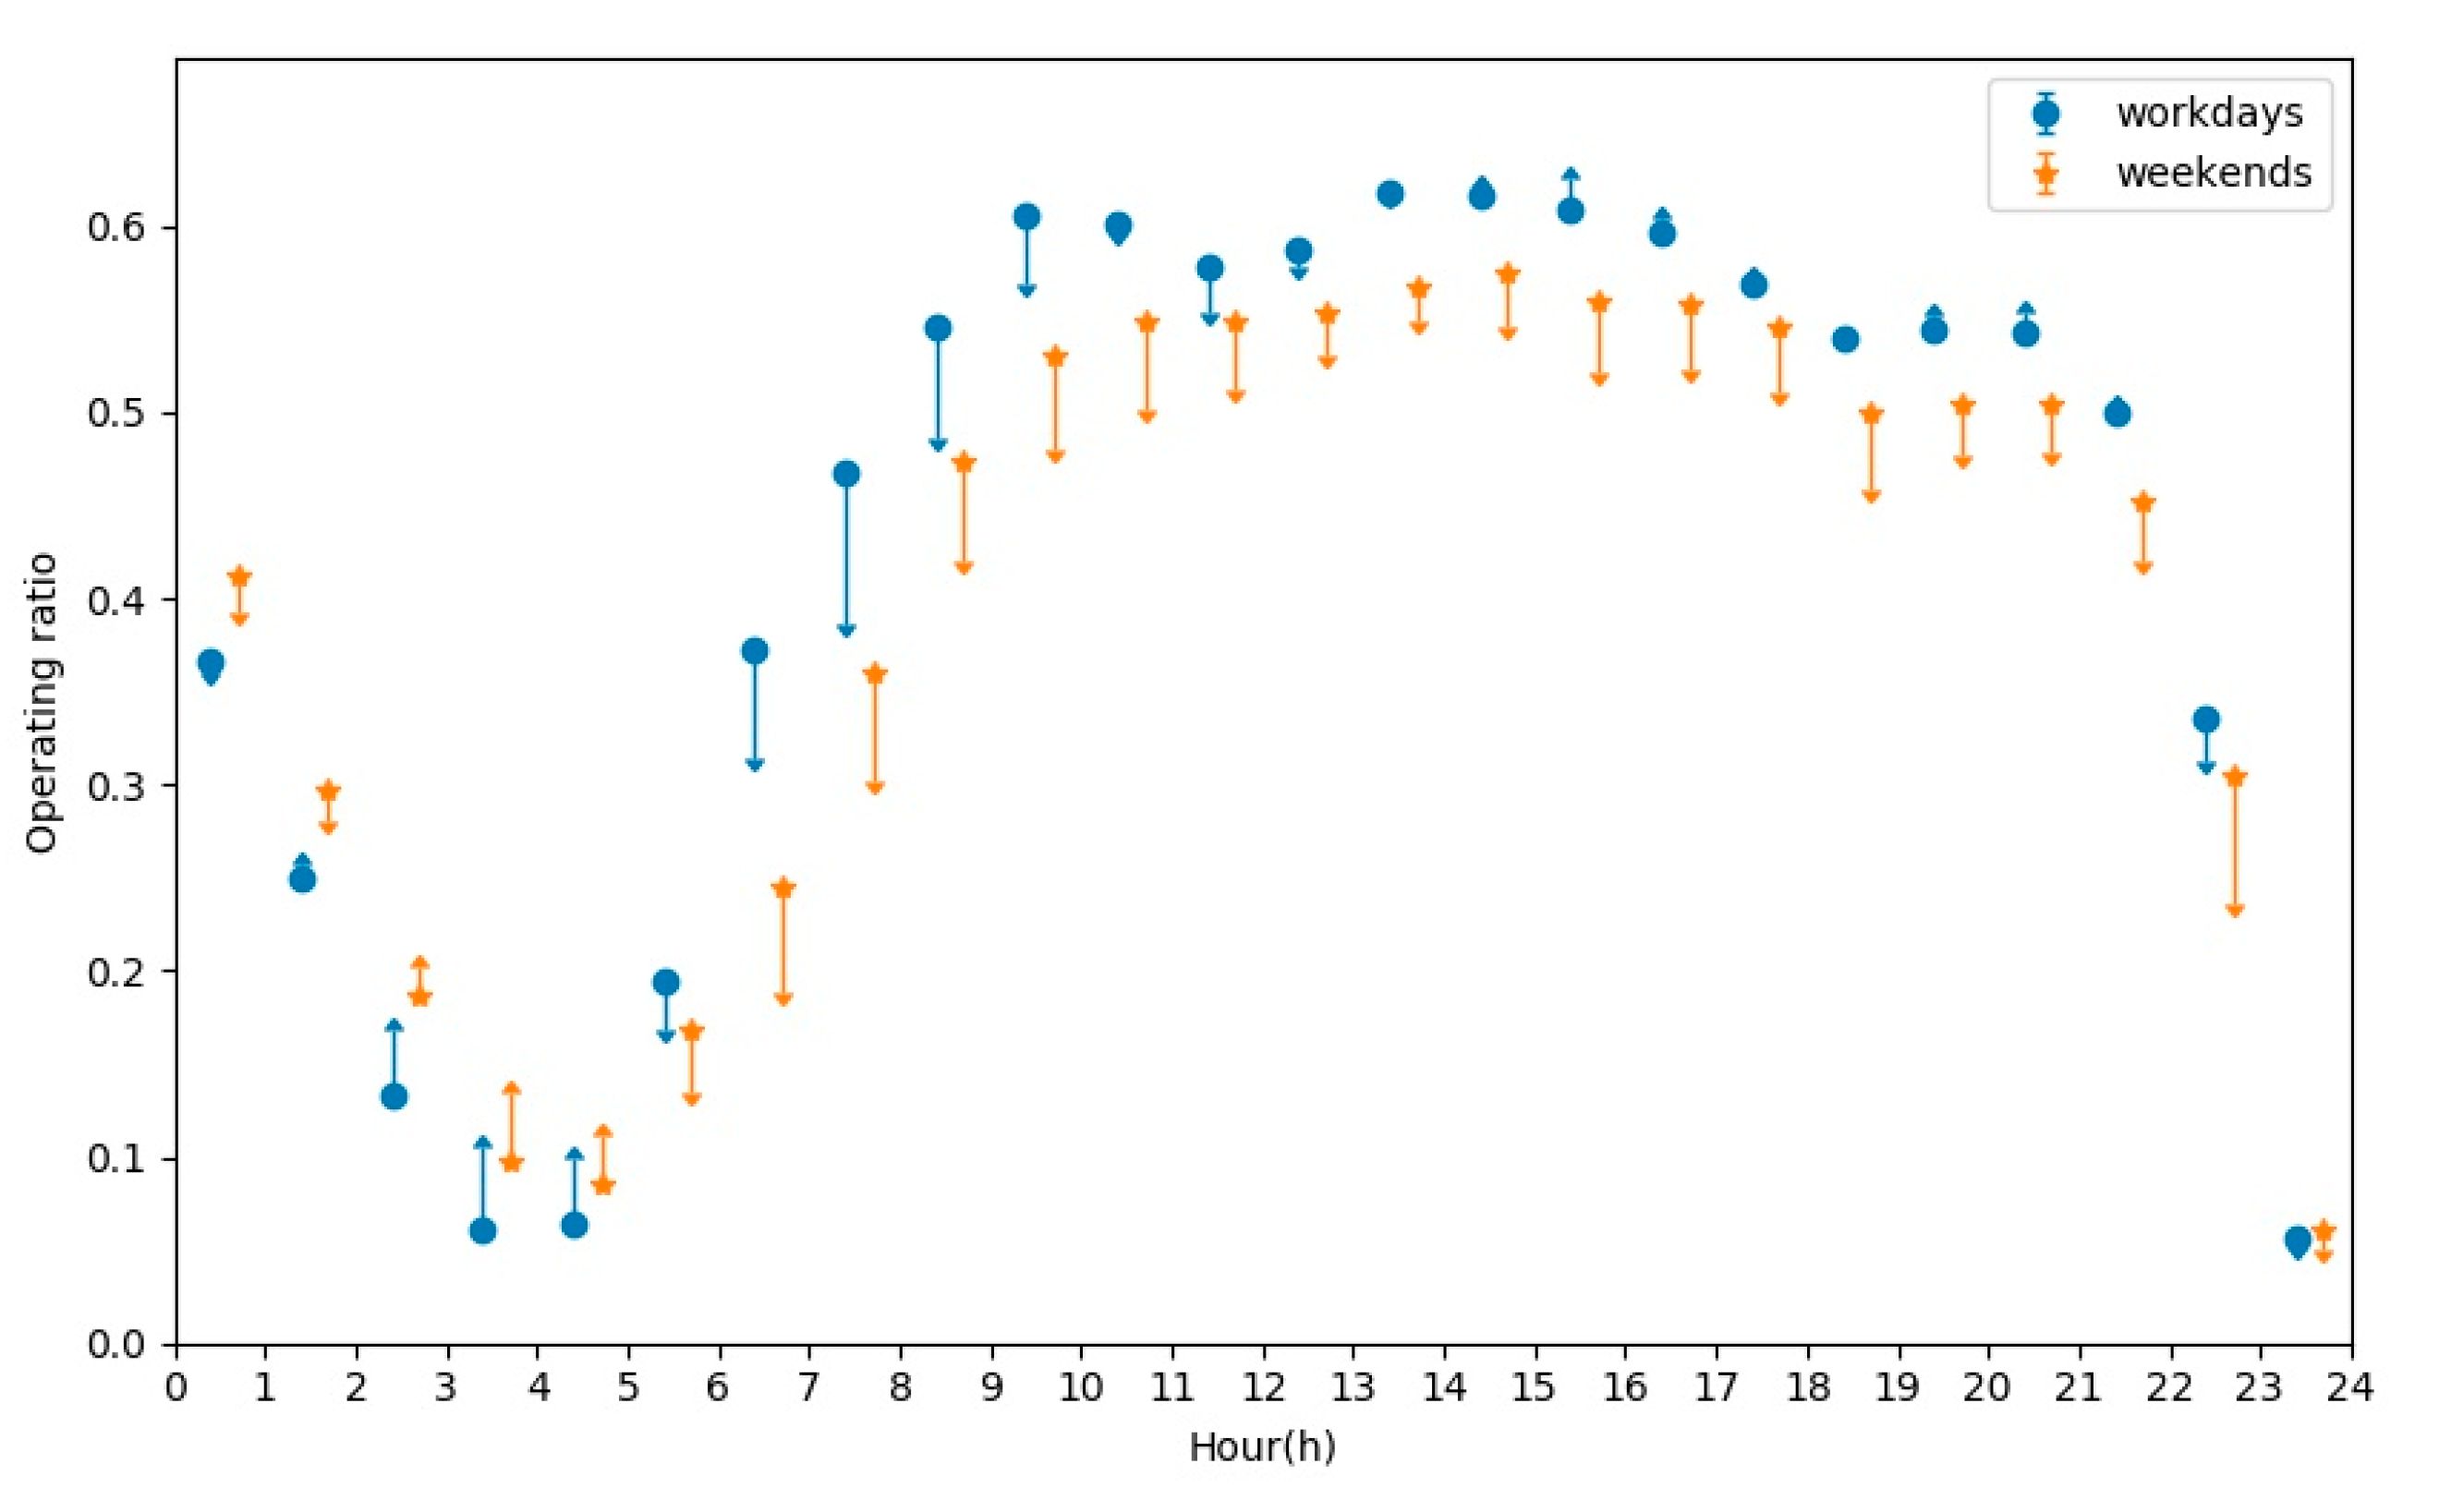
4.4.2. Operating Ratio
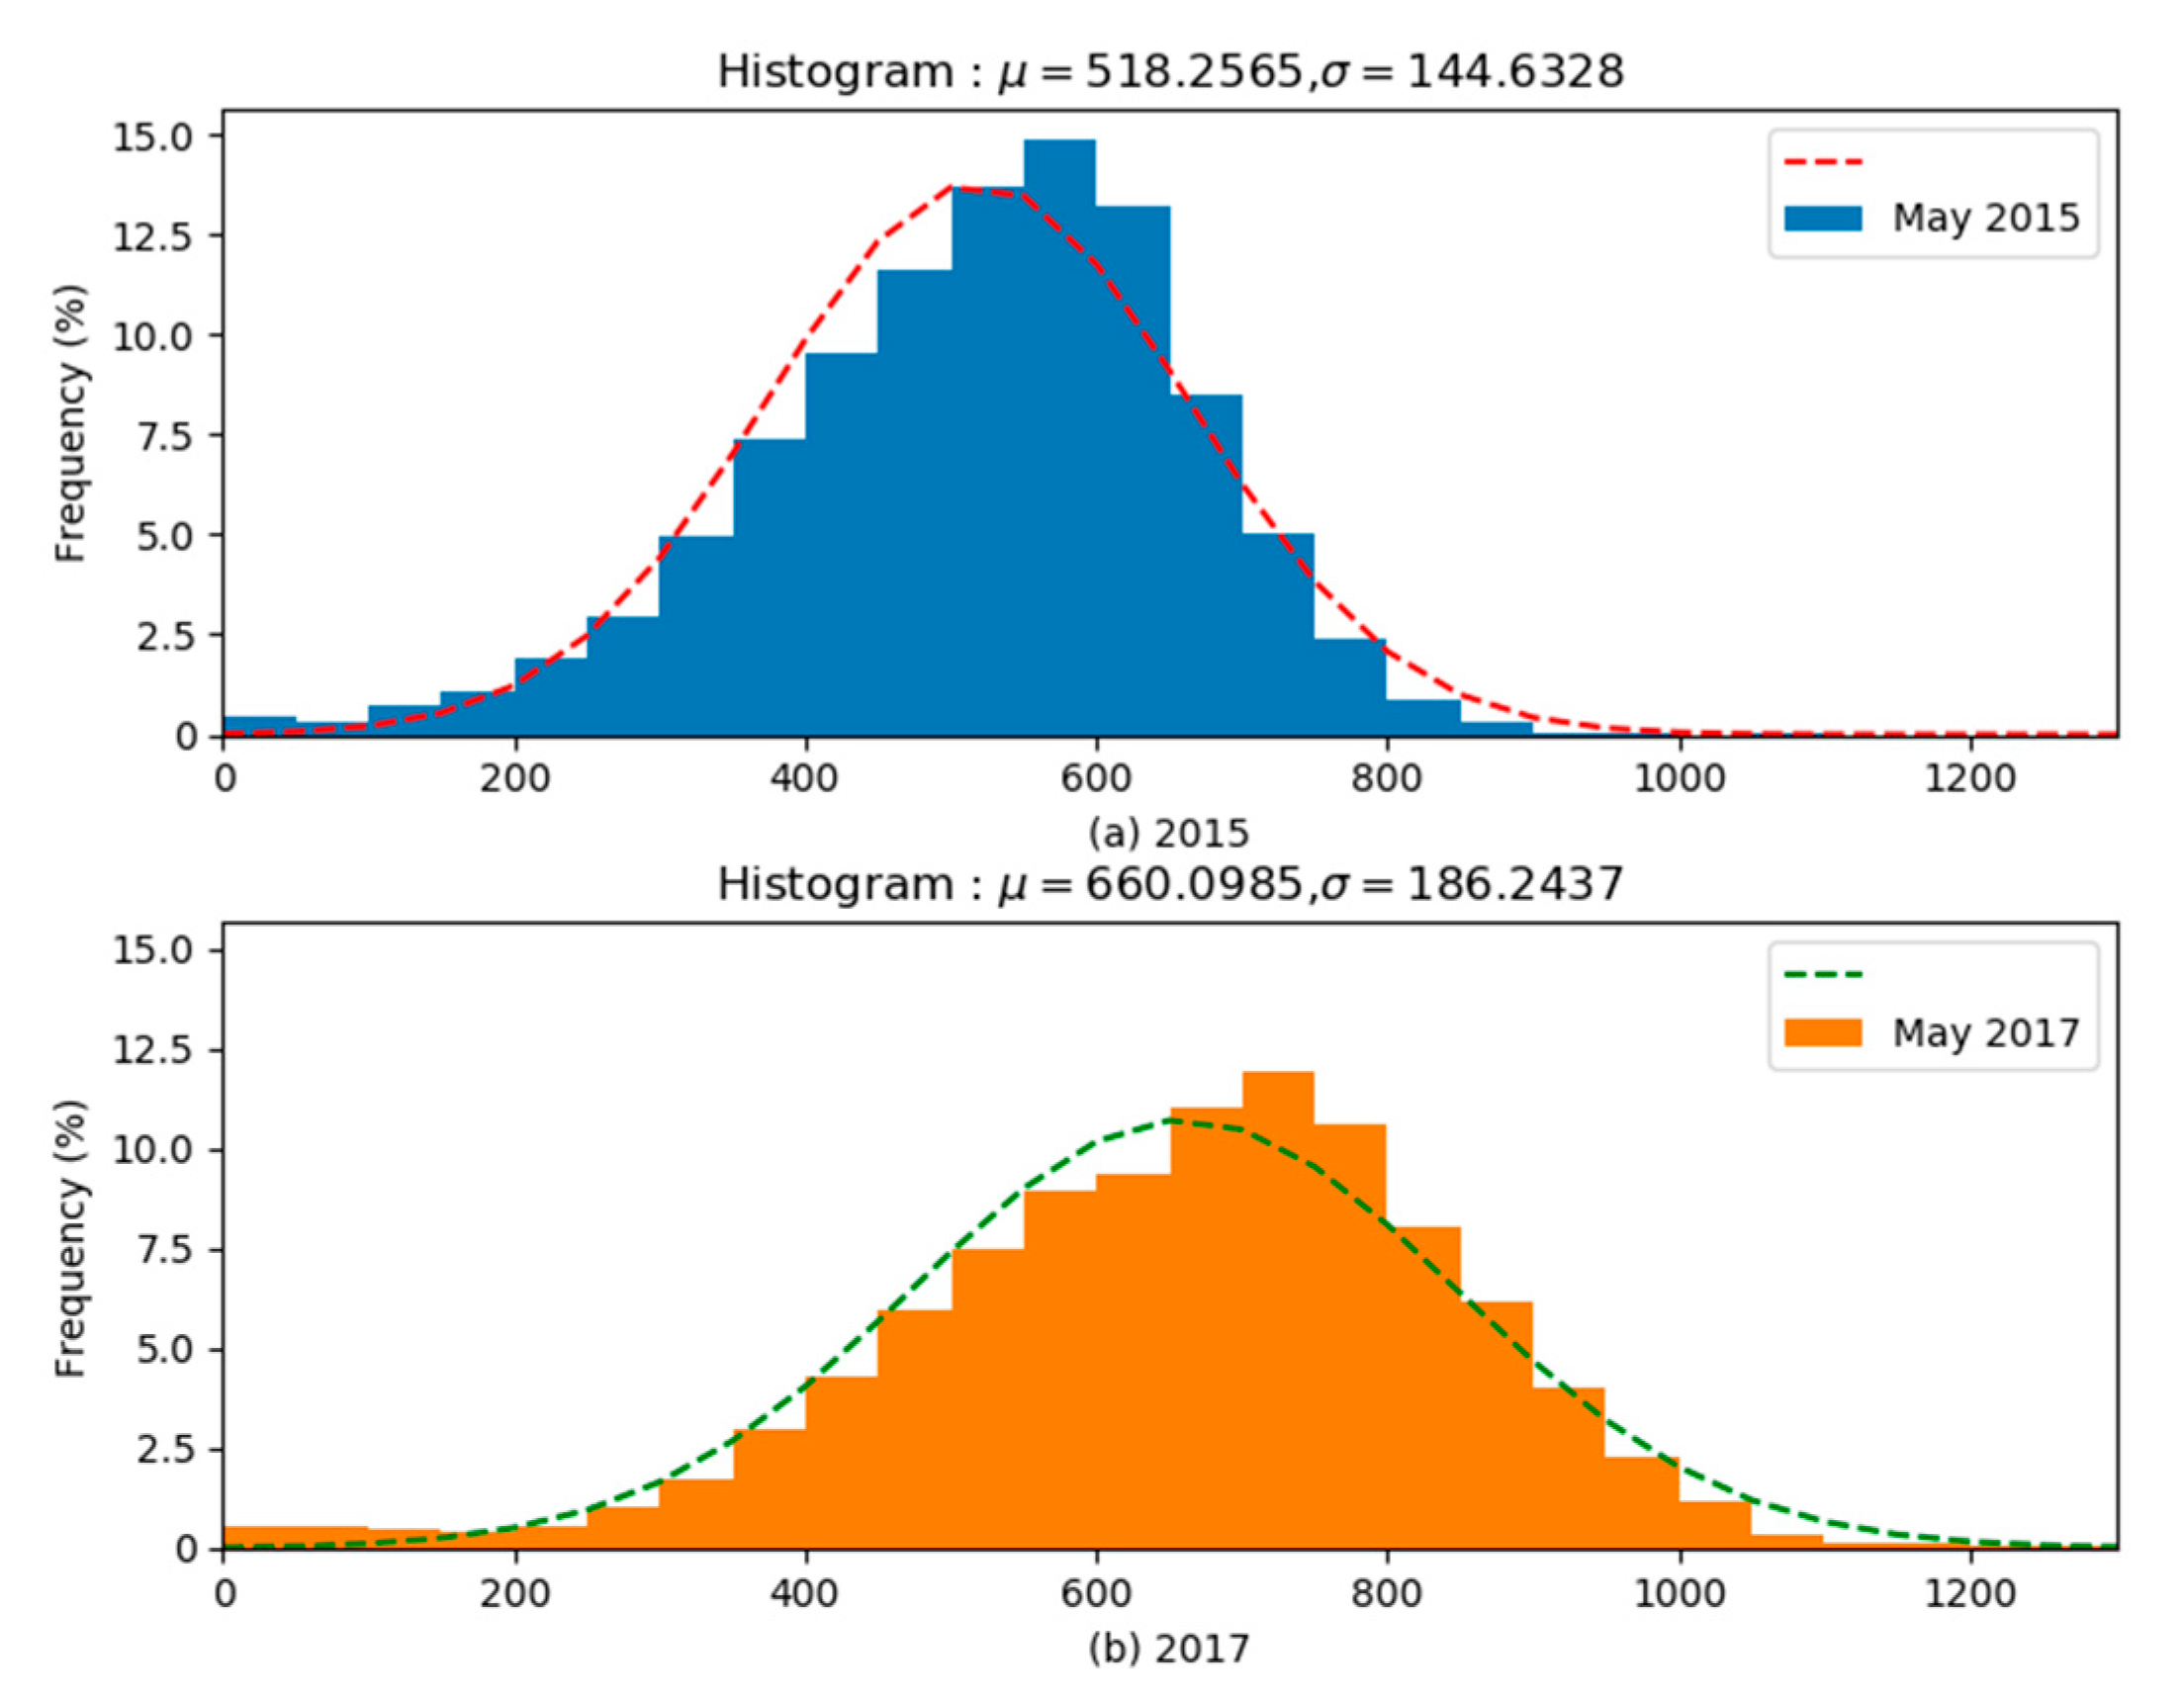
The operating ratio is the ratio of the number of taxis open for business to the total number of taxis. It is necessary to distinguish the operating ratio from the unoccupied ratio, as the former focuses on the driver’s schedule, while the latter studies the efficiency at work. The change in taxi operating ratio in 24 h from 2015 to 2017 is shown in Figure 13. The node recorded the operating ratio in May 2015, and the endpoint of the arrow represents the operating ratio in May 2017. The direction of the arrow shows the trend from May 2015 to 2017, i.e., up represents an increase and down represents a decrease. In 2017, the operating ratio decreased during the daytime, which was more evident during the morning rush hour. It is understandable that citizens prefer to ride the metro to avoid traffic jams during rush hour, with taxi drivers, therefore, also preferring to avoid the periods when drivers have more initiative. However, the opposite pattern can be seen from 11:00 pm to 6:00 am. Traditionally, pick-ups occur less at night with e-hailing, as drivers prefer to go home or to passively wait at hotspots (such as hospitals, streets, community gates, hotels, hotels, karaoke bars, and train stations). The platform’s technology can make up for this passivity and can significantly increase the chances of receiving new orders. Therefore, as seen here, drivers pay more attention to working at night, with working hours being partially adjusted from day to night.

4.4.3. Revenue

All changes in driving behaviors comprehensively affect a driver’s income. This paper was based on the behaviors in May 2015, and focused on the changes from 2015 to 2017. Similarly, we chose the charge mode for Shanghai taxis in May 2015 (shown in Table 3) as the standard, and used Formula (2) to calculate the cost of a ride. It was easy to find that 3 km and 10 km are distance breakpoints, leading to different charge prices per mile. In particular, they correspond to long- and short-distance trips, respectively. It is clear that short-distance trips can be finished quickly, and multiple short-distance trips mean multiple base fares, resulting in a higher revenue. As for long-distance trips, they are priced per kilometer with the highest level. Both short- and long-distance trips are helpful for increasing revenue.
Fare (d) = F0 + F3 × Min(Max(d − 3, 0), 7) + F10 × Max(d – 10, 0) + 1.
The distribution of the drivers’ average daily income is shown in Figure 14. Three changes can be found. First, in the frequency distribution of May 2017, the bar with the largest proportion moved to the right, and the μ value became larger compared to that of May 2015. Therefore, we can infer that most of the drivers gained more money, and the average income increased in 2017. Second, the proportion of low income decreased, while on the other side, the proportion of high income increased. In Figure 14a, the drivers rarely exceeded 800 yuan daily, but Figure 14b shows an even daily income of more than 1000 yuan. Third, the distribution of revenue was more concentrated in May 2015, but flattened in May 2017. The platform weakens the differentiation of driving experience to income. We can therefore infer that the positive impact of increased long-distance trips is more significant than the negative impact of decreased short-distance trips. Overall, the drivers’ average daily income improved after the launch of the platform.

5. Discussion and Conclusions

This paper focused on the spatiotemporal changes in driving behavior and the influences on taxi drivers after working with e-hailing applications. We chose the FCD in the before-app and full-use stages to bypass the private data of TNCs. Additionally, the interference of the subsidy war was also considered. Therefore, the taxi trajectory data in May 2015 and May 2017 in Shanghai were selected to obtain comprehensive, stable, and reliable results.
This paper divided drivers’ driving behavior into two-trip events (i.e., vacant trip and occupied trip) and two-point events (i.e., pick-up point and drop-off point). Then, we extracted the indicators for each event, the distance of the occupied trips, the duration of the unoccupied trips, the distribution of pick-up locations and payment durations, and traffic flow with two-point events being analyzed in turn. Finally, we calculated the unoccupied ratio, the operational ratio, and the revenue.
The results of the changes from the before-app stage to the full-use stage showed four parts corresponding to four driving behavior events. In the occupied trips, the proportion of journeys over 10 km (i.e., LDOT) increased significantly, and the proportion of trips within 3 km (i.e., SDOT) decreased rapidly. In the temporal patterns, the SDOT decreased significantly between 4:00 a.m. and 9:00 p.m., and increased before 4:00 a.m. After 9:00 p.m., the SDOT increased slightly on workdays and decreased on weekends. The LDOT experienced positive growth in 24 h, both on workdays and on weekends. During non-commuting hours, from 6:00 p.m. to 4:00 a.m., the growth rate was high, approaching or exceeding 100% growth for workdays. The growth rate from 10:00 a.m. to 1:00 p.m. was low, within 40%. Moreover, the growth rate during commuting hours was between 40% and 70%. In the spatial patterns, the pie charts displayed the SDOT and LDOT in each hotspots of starting points in 2015 and 2017. All 11 hotspots varied uniformly in the proportion of SDOT that decreased and LDOT that increased. In the unoccupied events, the results revealed that, as a result of the unoccupied durations in 2017, taxi drivers usually lost a high proportion of unoccupied durations within 5 min, and increased between 15 and 60 min. In detail, the unoccupied durations were significantly reduced in time slots of the early morning, before 5:00 a.m., and were longer during the daytime, especially from 9:00 a.m. to 7:00 p.m. They also increased 1.2–4.2 min on weekdays and 1.5–6 min on weekends. To further mine these changes, two sub-events were extracted: cruising and long break events. During commuting times, drivers in 2017 took approximately 1.1–3.5 min longer to meet passengers with the platform on weekdays, and 1–2.4 min longer on weekends. In the early mornings, long break events were rare on weekdays and weekends, and instead spread to the daytime. As for the two spot events, we visualized the distribution of the pick-up spots using a grid-based method, and the results pointed out that the pick-up points were more dispersed and covered Pudong New Area, Fengxian District, and Qingpu District more comprehensively. In the drop-off events, 86% of the payment events in May 2017 were completed within 1 min, while 86% of the payment events in May 2015 needed 2 min. In 1 min payments, the average payment duration in 2017 was 20 s faster than that in 2015. Finally, a chord diagram was used to show the changes in the traffic flow of the origin–destination spots. Overall, five regions had decreased flow: the urban center, Pudong, Minhang, Jiading, and Baoshan. On the contrary, the other four regions (Fengxian, Songjiang, Qingpu, and Jinshan) were more active. From the perspective of efficiency, the unoccupied ratio at night, from 12:00 to 5:00 a.m. decreased significantly, related to the platform dispatching orders and the drivers’ increasing initiatives to find customers. In the daytime, after 7:00 a.m., there was a slight relief of unoccupied running. In 2017, the operating ratio decreased during the daytime, and was more evident during the morning rush hour, which was the exact opposite from 11:00 p.m. to 6:00 a.m.
We can infer that the platform has dug more LDOTs for drivers. Since the capacity for the two years was close, the amount of SDOTs inevitably decreased, especially seeing as Shanghai is a metropolis where the subway and bus networks are very dense. Therefore, it is more convenient for people to take the subway if they have an SDOT. In small cities where the subway network is not dense, the convenience of e-hailing may increase SDOTs for drivers, and this should be further verified in future work. The possible reasons for the increase in LDOTs are as follows:
-
First: the platform algorithm is good at mining LDOTs.
-
Second: drivers prefer LDOTs to increase their revenue.
-
Third: the urban subway and bus networks are more convenient.
From the results of the unoccupied events, during commuting time, drivers spend more time cruising. Although e-hailing apps can help citizens obtain a taxi ride faster, from the drivers’ perspectives, cruising time has not reduced. As a supplement, the platform enables drivers to become more “active” at night and in the early morning to receive more orders. Taxi drivers also have a new allocation of rest time. Moreover, a more dispersed distribution of pick-up points means that the platform has supported more pick-up locations for drivers. The locations have spread from the urban center to the suburbs, and the urban center has become less attractive to taxi drivers. This phenomenon can also be found from the changes in traffic flow. First, the interaction with the city center has weakened. Second, Fengxian, Qingpu, and Songjiang have experienced slightly strengthened activity with Minhang. Third, Minhang has achieved more active interactions with the three regions of Fengxian, Songjiang, and Qingpu. Among them, the interaction between Songjiang and Qingpu has also been enhanced. As for drop-off events, e-hailing apps have introduced mobile payments, saving time on the traditional cash payment method and the provision of change. Meanwhile, we are also concerned that some the drop-offs took a long time, which means that the traditional payment method has not been completely replaced. From the perspective of efficiency, the unoccupied ratio on weekdays and on weekends has reduced. Drivers’ operating ratios increased, eventually increasing their income. Traditionally, pick-ups occur less at night with e-hailing apps, so drivers prefer going home or passively waiting at hotspots (such as hospitals, streets, community gates, hotels, hotels, karaoke bars, and train stations). The platform’s technology can make up for this passivity, significantly increasing the chances of receiving new orders. Moreover, drivers now pay more attention to working at night, and have partially adjusted their working hours from day to night.
This research attempted to answer the questions mentioned in Section 1. After working with e-hailing apps, the driving behavior of taxi drivers has changed spatiotemporally. In general, e-hailing apps mine more orders at night and early in the morning, temporally, and in suburban areas, spatially. In particular, these apps supply long-distance orders for drivers. Surprisingly, cruising time has not been reduced, but the time saved due to the change in payment methods has, more likely, allocated for rest. Finally, the software platform has reduced the unoccupied ratio of taxis and improved their operating ratios. Ultimately, the new driving behavior has brought higher revenues to drivers.
In this paper, we offered a different point of view, comparing taxi drivers before and after they began working with e-hailing apps. Our research presents a universal method to analyze the impact of e-hailing applications in the taxi industry, which is suitable for taxi FCD not only in Shanghai, but also in any other cities. The results reveal that changes in taxi driving behavior can assist the rational dispatching of urban traffic capacity, can promote the cooperation between the taxi industry and TNCs, and can contribute to the healthy development of innovative transportation.
Lastly, e-hailing applications have improved the driving efficiency and flexibility in the working schedules of the drivers. However, we still need to pay more attention to taxi drivers’ health, as problems may result from this new driving behavior. For example, to take advantage of the opportunity of orders at night, the adjustment in working schedules might lead to fatigue and may increase the risk of traffic accidents. In addition, our study area was a large city, and changes in small- and medium-sized cities should be analyzed in the future.

Author Contributions

Hongchao Fan contributed to the original ideas of the paper and designed the experiments. Yitong Gan performed the experiments and analyzed the experimental data under the supervision of Hongchao Fan. Wei Jiao and Mengqi Sun participated in the details of the experiment. Yitong Gan wrote the first draft of the manuscript; Hongchao Fan revised and edited it. All authors have read and agreed to the published version of the manuscript.

Funding

This research was funded by the NSFC (the National Natural Science Foundation of China), project no. 41771484.

Data Availability Statement

No new data were created or analyzed in this study. Data sharing is not applicable to this article.

Conflicts of Interest

The authors declare no conflict of interest.

References

  1. Correa, D.; Xie, K.; Ozbay, K. Exploring the taxi and Uber demand in New York City: An empirical analysis and spatial modeling. In Proceedings of the 96th Annual Meeting of the Transportation Research Board, Washington, DC, USA, 8–12 January 2017. [Google Scholar]
  2. Qian, X.; Zhang, W.; Ukkusuri, S.V.; Yang, C. Optimal assignment and incentive design in the taxi group ride problem. Transp. Res. Part B Methodol. 2017, 103, 208–226. [Google Scholar] [CrossRef]
  3. Contreras, S.D.; Paz, A. The effects of ride-hailing companies on the taxicab industry in Las Vegas, Nevada. Transp. Res. Part A Policy Pract. 2018, 115, 63–70. [Google Scholar] [CrossRef]
  4. Rayle, L.; Dai, D.; Chan, N.; Cervero, R.; Shaheen, S. Just a better taxi? A survey-based comparison of taxis, transit, and ridesourcing services in San Francisco. Transp. Policy 2016, 45, 168–178. [Google Scholar] [CrossRef] [Green Version]
  5. Brown, A.; LaValle, W. Hailing a change: Comparing taxi and ridehail service quality in Los Angeles. Transportation 2020, 1–25. [Google Scholar] [CrossRef]
  6. Glöss, M.; McGregor, M.; Brown, B. Designing for labour: Uber and the on-demand mobile workforce. In Proceedings of the 2016 CHI Conference on Human Factors in Computing Systems, San Jose, CA, USA, 7–12 May 2016; pp. 1632–1643. [Google Scholar]
  7. He, F.; Shen, Z.-J.M. Modeling taxi services with smartphone-based e-hailing applications. Transp. Res. Part C Emerg. Technol. 2015, 58, 93–106. [Google Scholar] [CrossRef]
  8. Cetin, T.; Deakin, E. Regulation of taxis and the rise of ridesharing. Transp. Policy 2019, 76, 149–158. [Google Scholar] [CrossRef]
  9. Edelman, B.G.; Geradin, D. Efficiencies and regulatory shortcuts: How should we regulate companies like Airbnb and Uber. Stan. Tech. L. Rev. 2015, 19, 293. [Google Scholar] [CrossRef] [Green Version]
  10. Liu, L.; Andris, C.; Biderman, A.; Ratti, C. Revealing taxi driver’s mobility intelligence through his trace. In Movement-Aware Applications for Sustainable Mobility: Technologies and Approaches; IGI Global: Hershey, PA, USA, 2010; pp. 105–120. [Google Scholar]
  11. Liu, L.; Andris, C.; Ratti, C. Uncovering cabdrivers’ behavior patterns from their digital traces. Comput. Environ. Urban Syst. 2010, 34, 541–548. [Google Scholar] [CrossRef]
  12. Li, B.; Zhang, D.; Sun, L.; Chen, C.; Li, S.; Qi, G.; Yang, Q. Hunting or waiting? Discovering passenger-finding strategies from a large-scale real-world taxi dataset. In Proceedings of the 2011 IEEE International Conference on Pervasive Computing and Communications Workshops (PERCOM Workshops), Seattle, WA, USA, 21–25 March 2011; pp. 63–68. [Google Scholar]
  13. Yuan, J.; Zheng, Y.; Xie, X.; Sun, G. T-drive: Enhancing driving directions with taxi drivers’ intelligence. IEEE Trans. Knowl. Data Eng. 2011, 25, 220–232. [Google Scholar] [CrossRef]
  14. Yuan, N.J.; Zheng, Y.; Zhang, L.; Xie, X. T-finder: A recommender system for finding passengers and vacant taxis. IEEE Trans. Knowl. Data Eng. 2012, 25, 2390–2403. [Google Scholar] [CrossRef]
  15. Ding, L.; Fan, H.; Meng, L. Understanding taxi driving behaviors from movement data. In AGILE 2015; Springer: Berlin/Heidelberg, Germany, 2015; pp. 219–234. [Google Scholar]
  16. Naji, H.A.; Wu, C.; Zhang, H. Understanding the impact of human mobility patterns on taxi drivers’ profitability using clustering techniques: A case study in Wuhan, China. Information 2017, 8, 67. [Google Scholar] [CrossRef] [Green Version]
  17. Gao, Y.; Xu, P.; Lu, L.; Liu, H.; Liu, S.; Qu, H. Visualization of taxi drivers’ income and mobility intelligence. In Proceedings of the International Symposium on Visual Computing; Springer: Berlin/Heidelberg, Germany, 2012; pp. 275–284. [Google Scholar]
  18. Powell, J.W.; Huang, Y.; Bastani, F.; Ji, M. Towards reducing taxicab cruising time using spatio-temporal profitability maps. In Proceedings of the International Symposium on Spatial and Temporal Databases; Springer: Berlin/Heidelberg, Germany, 2011; pp. 242–260. [Google Scholar]
  19. Shen, Y.; Zhao, L.; Fan, J. Analysis and visualization for hot spot based route recommendation using short-dated taxi GPS traces. Information 2015, 6, 134–151. [Google Scholar] [CrossRef] [Green Version]
  20. Leng, B.; Du, H.; Wang, J.; Li, L.; Xiong, Z. Analysis of taxi drivers’ behaviors within a battle between two taxi apps. IEEE Trans. Intell. Transp. Syst. 2015, 17, 296–300. [Google Scholar] [CrossRef]
  21. Nie, Y.M. How can the taxi industry survive the tide of ridesourcing? Evidence from Shenzhen, China. Transp. Res. Part C Emerg. Technol. 2017, 79, 242–256. [Google Scholar] [CrossRef]
  22. Fang, Z.; Su, R.; Huang, L. Understanding the effect of an E-hailing app subsidy war on taxicab operation zones. J. Adv. Transp. 2018, 2018, 7687852. [Google Scholar] [CrossRef]
  23. Ye, Q.; Cen, J.; Chen, X.; Zhang, H. How taxi operation change in the development of e-hailing APPs: A case study in Shanghai, China. In CICTP 2017: Transportation Reform and Change—Equity, Inclusiveness, Sharing, and Innovation; American Society of Civil Engineers: Reston, VA, USA, 2018; pp. 2167–2177. [Google Scholar]
  24. Chen, X.; Ye, Q.; Zhang, H. Exploring the Change on Taxi Service Availability Under the Operation Mechanism of E-hailing Apps. In Proceedings of the 15th World Conference on Transport Research, Mumbai, India, 26–31 May 2019. [Google Scholar]
  25. Ye, Q.; Chen, X.; Ozbay, K.; Wang, Y. How People View and Respond to Special Events in Shared Mobility: Case Study of Two Didi Safety Incidents via Sina Weibo. In Proceedings of the 20th COTA International Conference of Transportation Professionals, Xi’an, China, 14–16 August 2020; pp. 3229–3240. [Google Scholar]
  26. Simma, A.; Cattaneo, P.; Baumeler, M.; Axhausen, K.W. Factors influencing the individual shopping behaviour: The case of Switzerland. AreSwiss Fed. Off. Spat. Dev. 2004, 247. [Google Scholar] [CrossRef]
Figure 1. The impact of e-hailing apps on taxi drivers. 1 dist is the distance of the trip, 2 N is the unoccupied trip, 3 O is the occupied trip.
Ijgi 10 00077 g001
Figure 2. Frequency distribution of the distance of occupied trips in (a) 2015 and (b) 2017.
Ijgi 10 00077 g002
Figure 3. The relative difference between (a) short-distance and (b) long-distance occupied trips. The relative variation ratio refers to the trip growth rate between 2015 and 2017, and the growth formula is as shown in Formula (1). If the y-valve > 0, then the growth in the number of trips was more than 0% and the number of trips increased. Instead, if the y-valve < 0, then the growth in the number of trips was below 0% and the number of trips decreased.
Ijgi 10 00077 g003
Figure 4. The short-distance occupied trip (SDOT) and long-distance occupied trip (LDOT) in each hotspot of starting points in 2015 (a) and 2017 (b). The red and blue pie chart sectors represent SDOT and LDOT, respectively. The pie charts are proportionally sized, relative to the number of the trips in each distance interval, located within the hotspots.
Ijgi 10 00077 g004
Figure 5. Frequency distribution of the distance of unoccupied trips in (a) 2015 and (b) 2017.
Ijgi 10 00077 g005
Figure 6. The relative difference between the unoccupied durations from 2015 to 2017.
Ijgi 10 00077 g006
Figure 7. The growth in cruising duration year on year in May: (a) cruising trips within 30 min; (b) cruising trips within 60 min.
Ijgi 10 00077 g007
Figure 8. The quality of unoccupied trips longer than 1 h, by hours.
Ijgi 10 00077 g008
Figure 9. Distribution of the pick-up spots. Oriented top to bottom, from left to right: (1) urban center; (2) Pudong New Area; (3) Jinshan District; (4) Minhang Area; (5) Fengxian District; (6) Jiading District; (7) Songjiang District; (8) Baoshan District; (9) Qingpu District.
Ijgi 10 00077 g009
Figure 10. Duration of payment. (a) Distribution of payment durations within 5 min in May 2015; (b) distribution of payment durations within 5 min in May 2017; (c) the average payment time in each bar.
Ijgi 10 00077 g010
Figure 11. Traffic flow in (a) 2015 and (b) 2017.
Ijgi 10 00077 g011
Figure 12. Unoccupied ratio (a) on workdays and (b) on weekends.
Ijgi 10 00077 g012
Figure 13. The taxi operating ratio.
Ijgi 10 00077 g013
Figure 14. The average daily income of taxi drivers in (a) 2015 and (b) 2017.
Ijgi 10 00077 g014
Table 1. Description of driving behavior events.
EventPropertyDescription
Trip events
(vacant/occupied)
DateDate the trip started, 8-digit number, yyyy-mm-dd
TimeTime the trip started, 6-digit number, hh-mm-ss
GPSIDCar identifier, 5-digit number
Trip_xX coordinate of the origin of the trip, accurate to 6 decimal places, in degrees/units (meters)
Trip_yY coordinate of the origin of the trip, accurate to 6 decimal places, in degrees/units (meters)
DisThe distance of the trip, accurate to 6 decimal places, in degrees/units (meters)
DurThe duration of the trip, units (seconds)
Spot events
(pick-up/drop-off)
DateDate the trip started, 8-digit number, yyyy-mm-dd
TimeTime the trip started, 6-digit number, hh-mm-ss
GPSIDCar identifier, 5-digit number
XX coordinate of the spot events, accurate to 6 decimal places, in degrees/units (meters)
YY coordinate of the spot events, accurate to 6 decimal places, in degrees/units (meters)
RegionAdministrative area number
Pay_durThe time interval between the drop-off point and the first moving point, units (seconds), only drop-off spot
Table 2. The three situations of unoccupied trip.
Car StatusVelocityDescription
Load = 0V > 0C—Looking for the next customer while driving;
V = 0B—Suspension of business (e.g., lunch break or off duty) with a long break;
S—Standing for passengers (airports, railway stations, shopping malls, hospitals, etc.).
Table 3. The charging mode for Shanghai taxis in 2015 (CNY).
ItemDaytime
(05:00 a.m. to 11:00 p.m.)
Nighttime
(11:00 p.m. to 05:00 a.m.)
F0 d 1∈(0, 3] km1318
F3 d∈(3, 10] km2.43.1
F10 d∈(10, +∞) km3.64.7
1 d is the distance of the occupied trip.
Publisher’s Note: MDPI stays neutral with regard to jurisdictional claims in published maps and institutional affiliations.

