Public Responses to Air Pollution in Shandong Province Using the Online Complaint Data
Abstract
:1. Introduction
2. Materials and Methods
2.1. Data
2.1.1. Public Complaint Data
2.1.2. Microblog Data
2.1.3. AQI Data
2.2. Methods
2.2.1. Building an Emotional Dictionary for Air Pollution
2.2.2. Sentiment Analysis
- 1)
- Text preprocessing
- 2)
- Emotional word matching and modifier matching
- 3)
- Calculation of emotional intensity of public complaints
2.2.3. Address Matching
- (1)
- Hanlp was used for Chinese word segmentation and part of speech tagging;
- (2)
- Address extraction: we analyzed the words after part of speech tagging, and detected the address parts of speech in terms including organization name and place name. Besides, we stored the words of organization name and place name.
- (3)
- Address normalization: it is necessary to standardize the extracted address and standardize the address information of each comment data as: (Province, city, district and county, and detailed address] since the public often uses abbreviations to represent address information in expression.It is worth noting that when performing detailed address matching, the factory or company name will be used directly in instances where the factory or company name appears. If there is no factory or company name, match ‘town’ + ‘village’. If none of the above, match’ Road name’ + ‘community’.
- (4)
- Longitude and latitude matching: This study used the AutoNavi Map API to perform latitude and longitude matching on the address information after address normalization.
2.2.4. Spatial Analysis and Statistical Analysis
3. Results
3.1. Spatiotemporal Analysis of Air Pollution Complaint Data
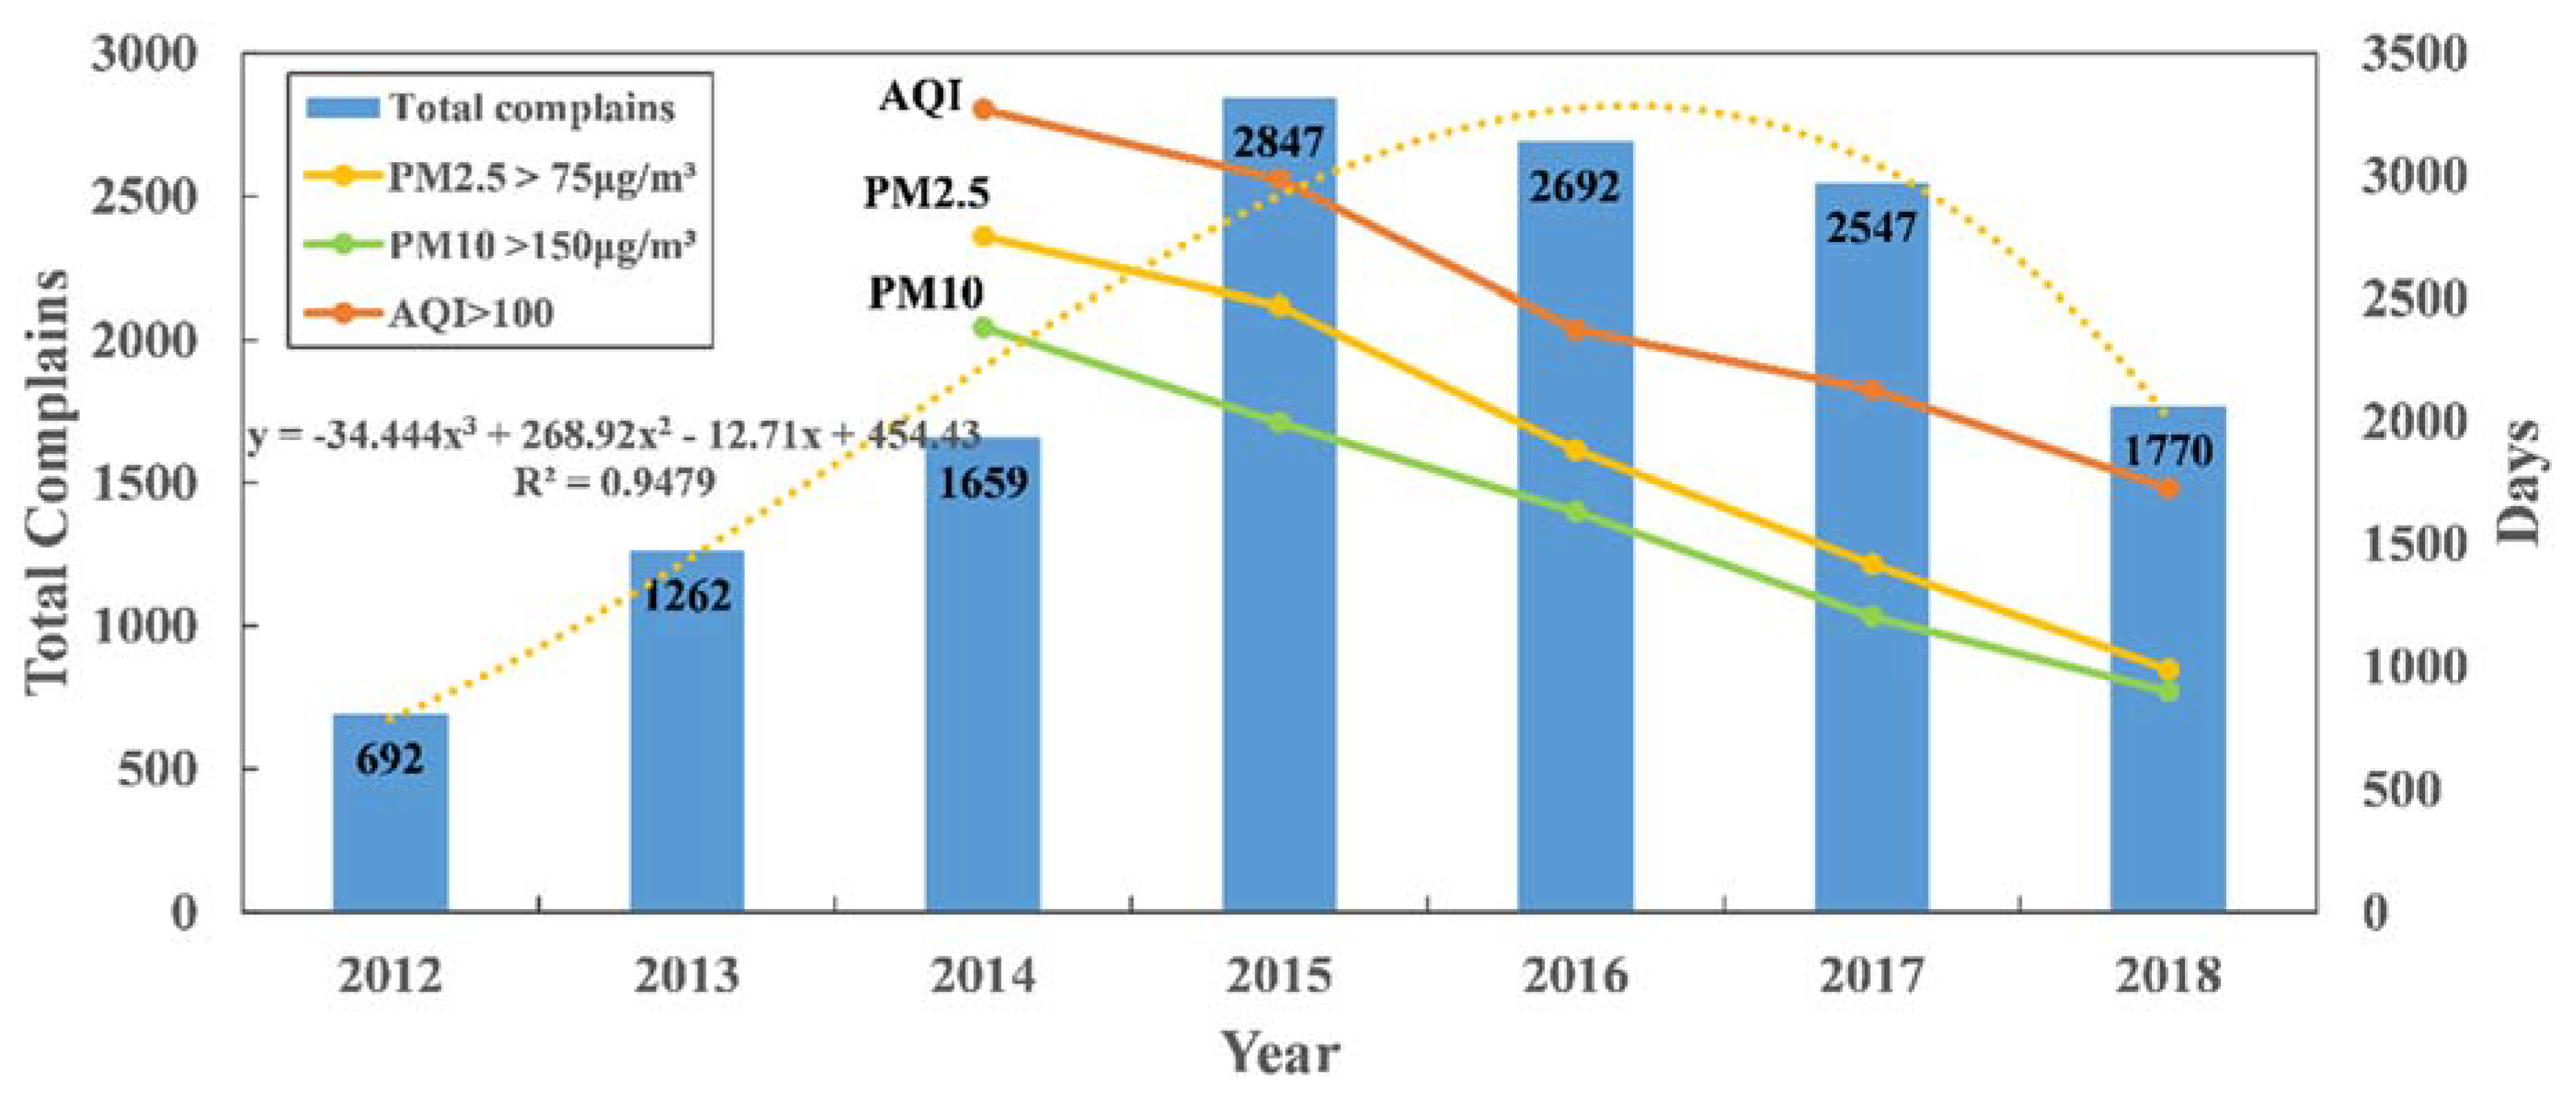
3.1.1. Temporal Characteristics of Air Pollution Complaint Data
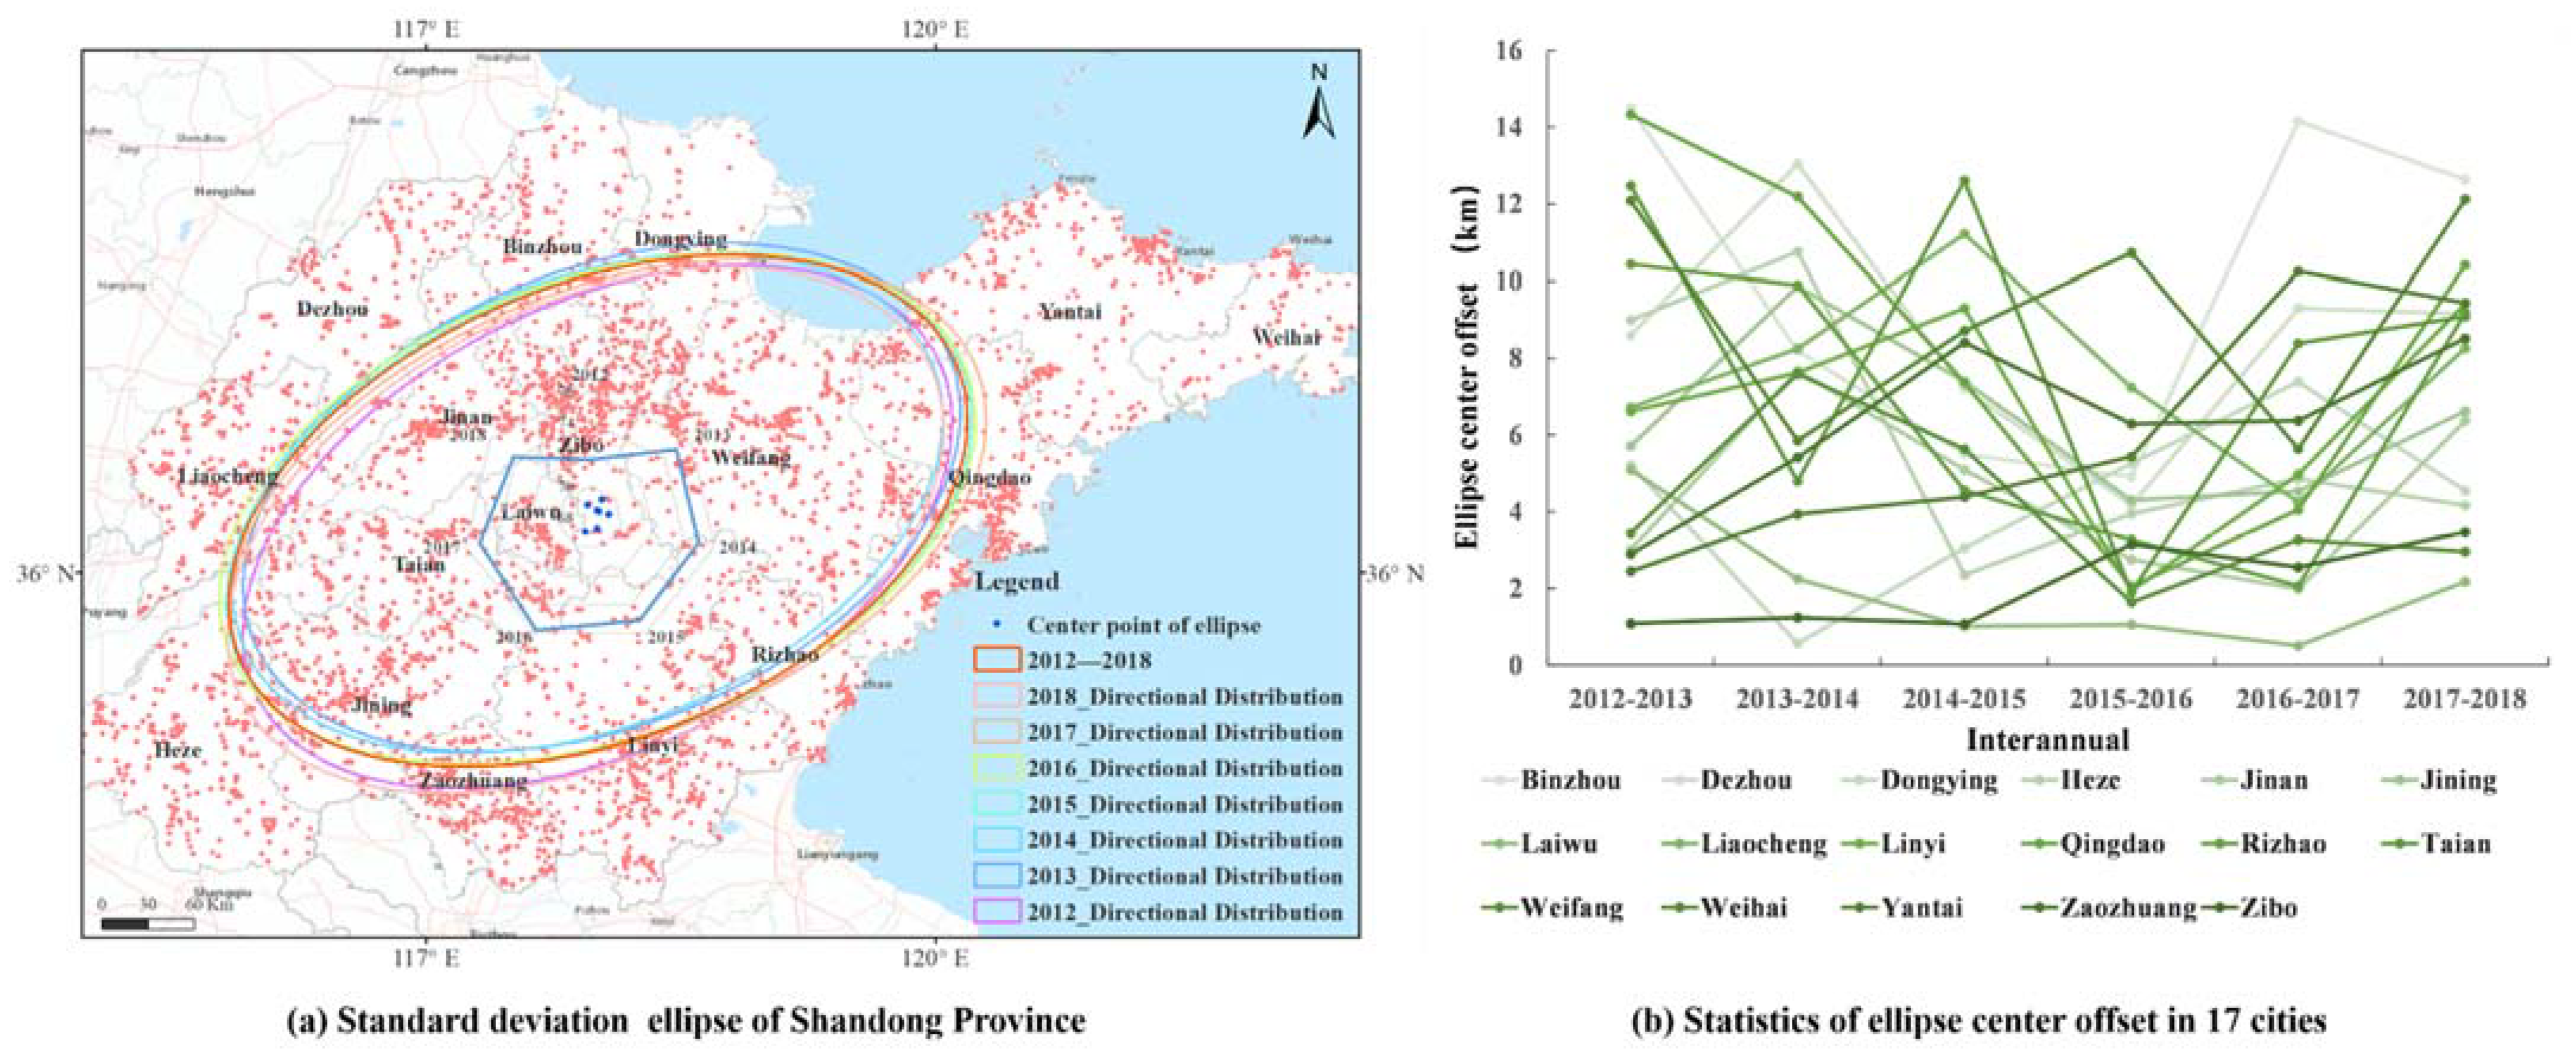
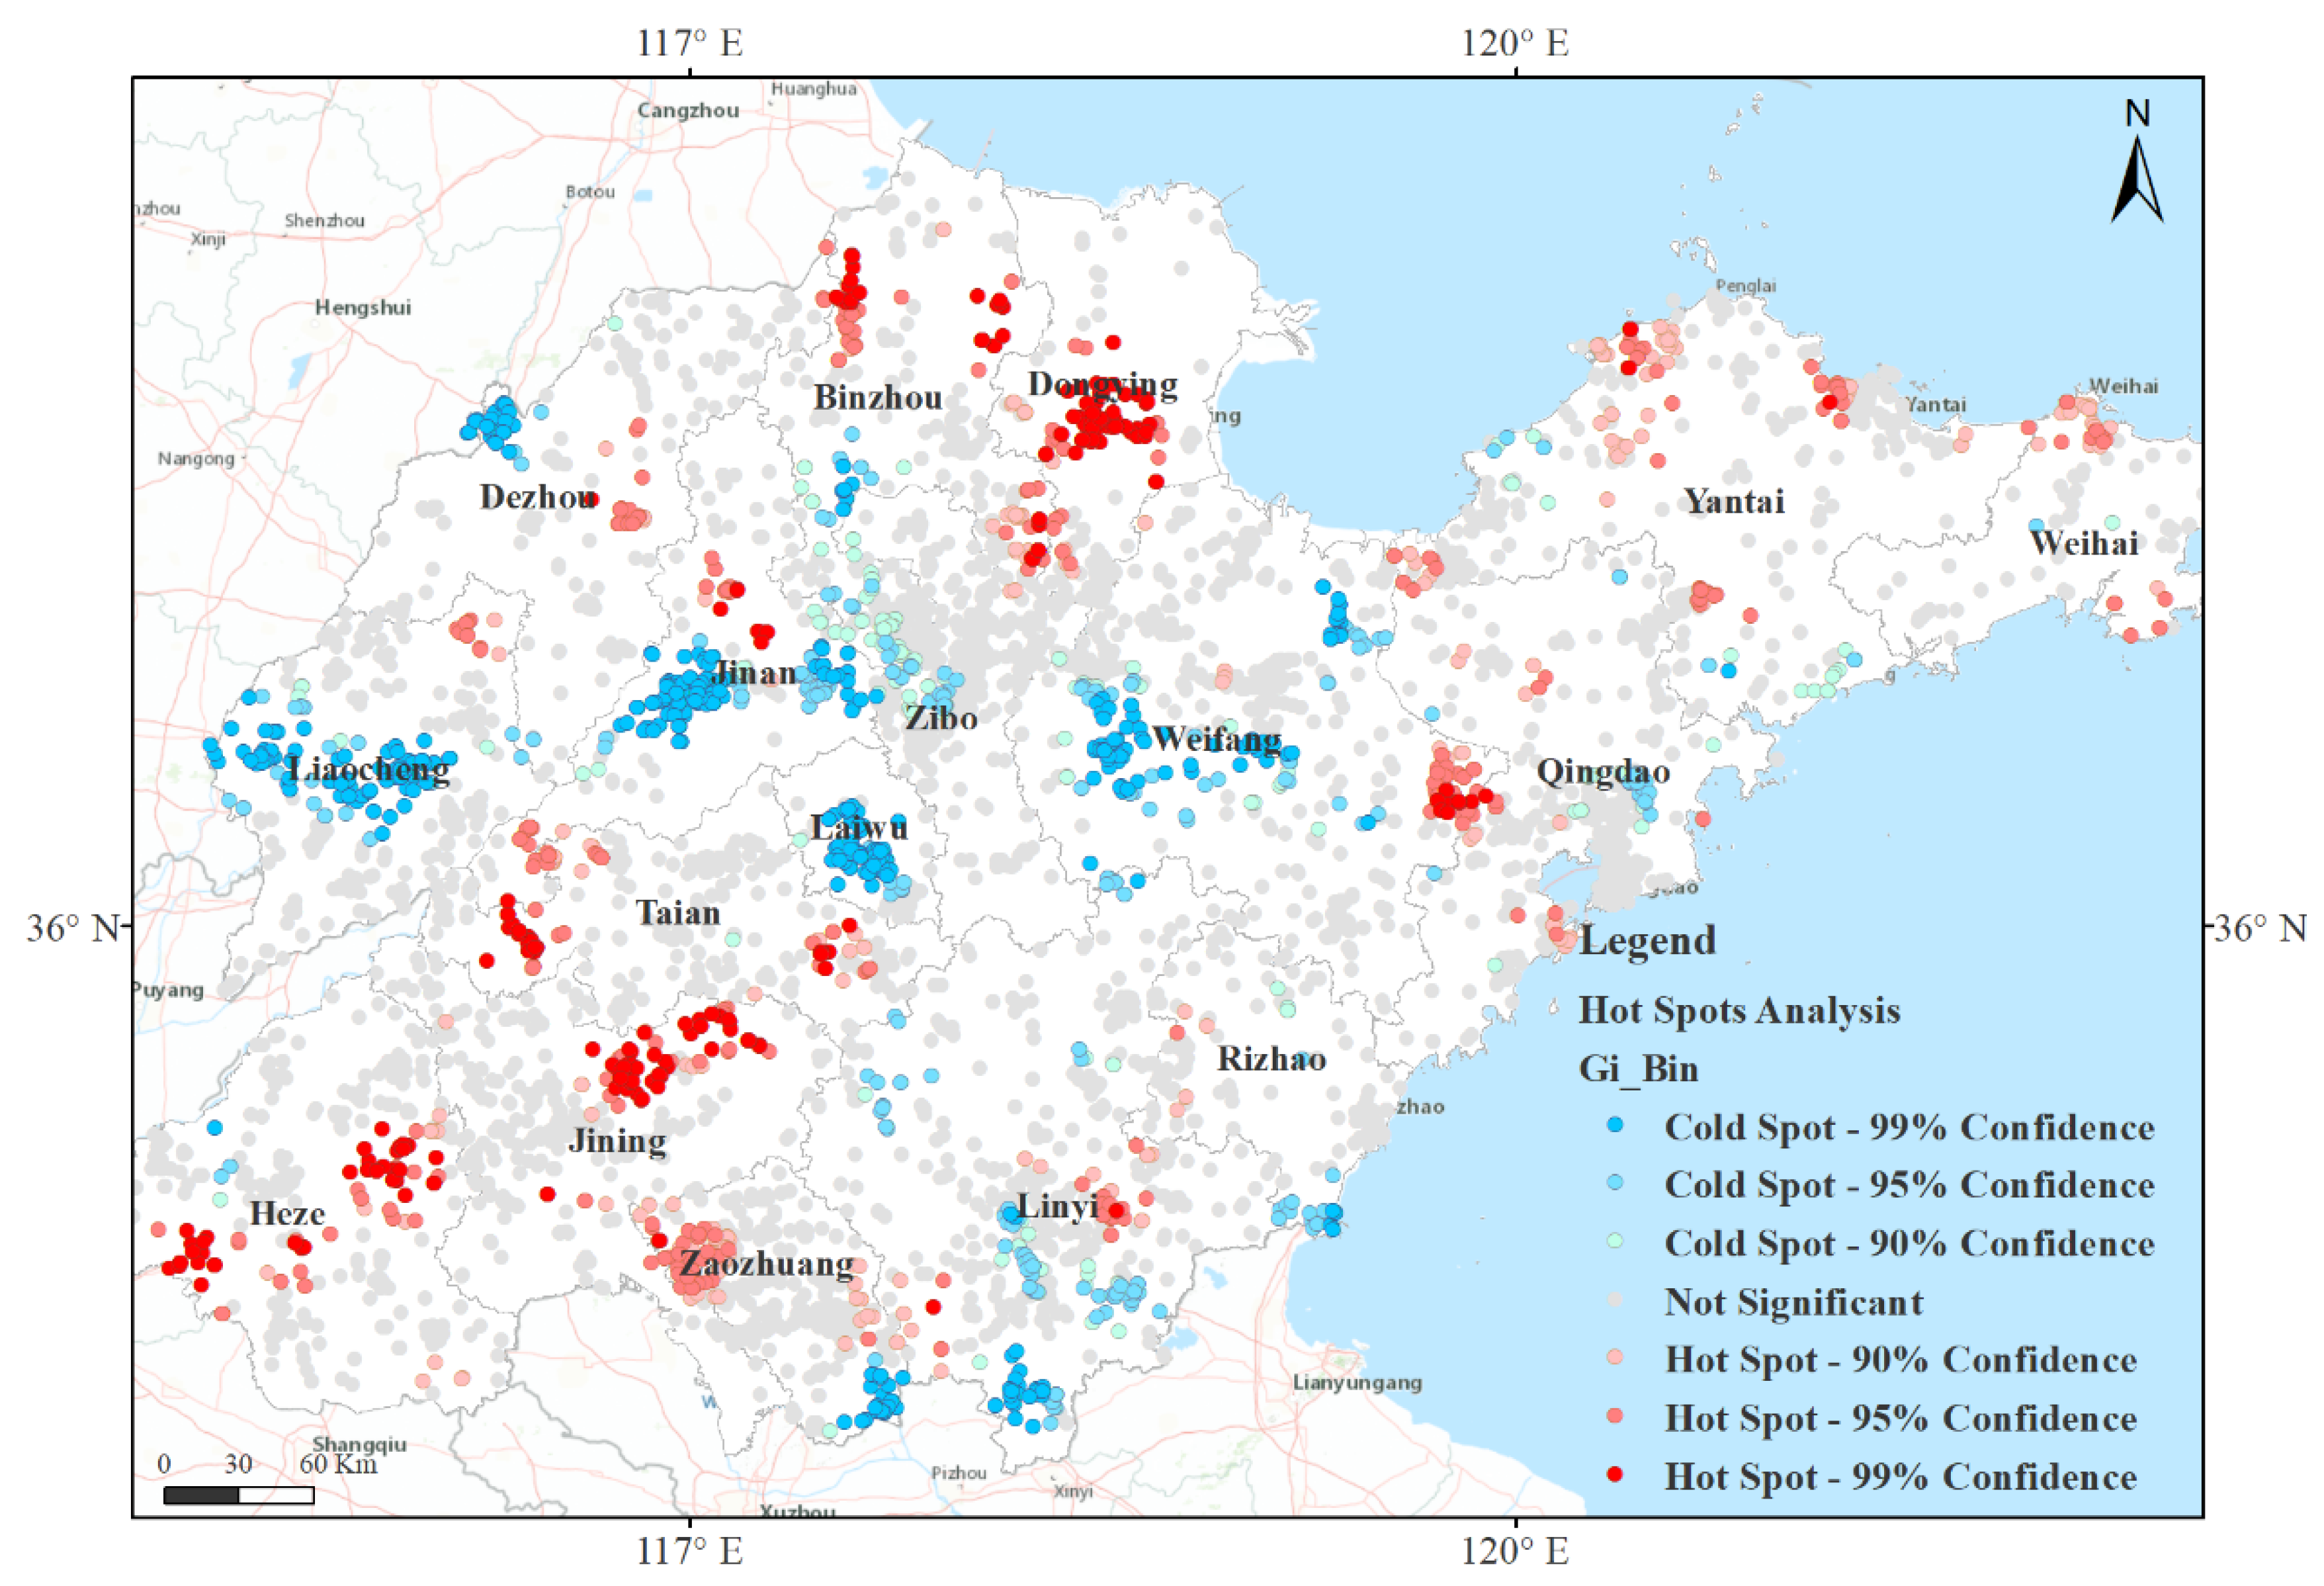
3.1.2. Spatial Characteristics of Air Pollution Complaint Data
3.2. Spatiotemporal Analysis of Public Complaint Sentiment
3.2.1. Statistical Analysis of Public Complaint Emotion
3.2.2. Spatial Pattern of Public Complaint Emotion
3.3. Correlation Analysis
4. Discussion
5. Conclusions
- (1)
- The public’s perception of air pollution is mainly reflected in the sense of vision and smell, and the content of complaints focuses on the emission problems of enterprises and factories.
- (2)
- The number and emotional intensity of public air pollution complaint data, which were −0.7 and −0.73, respectively, were negatively correlated with PM2.5. It means that the number of complaints is large when the air quality is good, but the public’s negative emotion is not strong. Moreover, the number of public complaints is reduced when the air quality deteriorates, and the negative emotion is stronger.
- (3)
- The correlation between public emotional intensity and PM2.5 was higher in Shandong Province than in PM10. Furthermore, the analysis of PM2.5 and PM10 over standard data confirmed that PM2.5 pollution is more severe than PM10 pollution in Shandong Province.
- (4)
- The air quality of Shandong Province improved significantly between 2014 and 2018, and the number of public complaints and the emotional intensity of negative complaints also showed a downward trend.
Author Contributions
Funding
Institutional Review Board Statement
Informed Consent Statement
Data Availability Statement
Conflicts of Interest
References
- Darçın, M. Association between air quality and quality of life. Environ. Sci. Pollut. Res. 2014, 21, 1954–1959. [Google Scholar] [CrossRef]
- Zhan, D.; Kwan, M.-P.; Zhang, W.; Yu, X.F.; Meng, B.; Liu, Q. The driving factors of air quality index in China. J. Clean. Prod. 2018, 197, 1342–1351. [Google Scholar] [CrossRef]
- Carducci, A.; Donzelli, G.; Cioni, L. Air pollution: A study of citizen’s attitudes and behaviors using different information sources. Epidemiol. Biostat. Public Health 2017, 14, 1–9. [Google Scholar]
- Sun, Y.; Moshfeghi, Y.; Liu, Z. Exploiting crowdsourced geographic information and GIS for assessment of air pollution exposure during active travel. J. Transp. Health 2017, 6, 93–104. [Google Scholar] [CrossRef] [Green Version]
- Wang, Y.; Fu, X.; Jiang, W.; Wang, T.; Tsou, M.; Yue, X. Inferring urban air quality based on social media. Comput. Environ. Urban Syst. 2017, 66, 110–116. [Google Scholar] [CrossRef]
- Zhou, Z.; Guo, X.; Wu, H.; Yu, J. Evaluating air quality in China based on daily data: Application of integer data envelopment analysis. J. Clean. Prod. 2018, 198, 304–311. [Google Scholar] [CrossRef]
- Pu, S.; Shao, Z.; Fang, M.; Yang, L.; Liu, R. Spatial distribution of the public’s risk perception for air pollution: A nationwide study in China. Sci. Total Environ. 2019, 655, 454–462. [Google Scholar] [CrossRef] [PubMed]
- Song, Y.; Zhou, A.; Zhang, M. Exploring the effect of subjective air pollution on happiness in China. Environ. Sci. Pollut. Res. 2020, 27, 43299–43311. [Google Scholar] [CrossRef]
- Li, W.; Fengying, Z.; Eva, P. Taking Action on Air Pollution Control in the Beijing-Tianjin-Hebei (BTH) Region: Progress, Challenges and Opportunities. Int. J. Environ. Res. Public Health 2018, 15, 306. [Google Scholar]
- Izabela, S.; Paciorek, M.; Skotak, K. The Analysis of the Effectiveness of Implementing Emission Reduction Measures in Improving Air Quality and Health of the Residents of a Selected Area of the Lower Silesian Voivodship. Energies 2020, 13, 4001. [Google Scholar]
- Yang, R.; Wei, J.; Lu, L. Air pollution and green consumption of consumers in China’s urban areas: A norm activation perspective. Hum. Ecol. Risk Assess. 2019, 26, 1988–2010. [Google Scholar] [CrossRef]
- Dons, E.; Laeremans, M.; Anaya-Boig, E. Concern over health effects of air pollution is associated to NO2 in seven European cities. Air Qual. Atmos. Health 2018, 11, 591–599. [Google Scholar] [CrossRef]
- David, V.; Mariaelena, G.; Paul, B.; Hamed, G.; Ricardo, C. Perceptions about air quality of individuals who work outdoors in the San Joaquin Valley, California. Atmos. Pollut. Res. 2020, 11, 825–830. [Google Scholar]
- Wang, Y.; Tsou, M.; Fu, X. Using Social Media to Detect Outdoor Air Pollution and Monitor Air Quality Index (AQI): A Geo-Targeted Spatiotemporal Analysis Framework with Sina Weibo (Chinese Twitter). PLoS ONE 2015, 10, e0141185. [Google Scholar]
- Gurajala, S.; Dhaniyala, S.; Matthews, J. Understanding Public Response to Air Quality Using Tweet Analysis. Soc. Media + Soc. 2019, 5, 205630511986765. [Google Scholar] [CrossRef] [Green Version]
- Hswen, Y.; Qin, Q.; John, S.; Brownstein, J.; Hawkins, B. Feasibility of using social media to monitor outdoor air pollution in London, England. Prev. Med. 2019, 121, 86–93. [Google Scholar] [CrossRef] [PubMed]
- Huang, Y.; Fei, T.; Kwan, M.-P.; Kang, Y. GIS-Based Emotional Computing: A Review of Quantitative Approaches to Measure the Emotion Layer of Human–Environment Relationships. ISPRS Int. J. Geo-Inf. 2020, 9, 551. [Google Scholar] [CrossRef]
- Gallagher, D.L.; Dietrich, A.M. Satistical approaches for analyzing customer complaint data to assess aesthetic episodes in drinking water. J. Water Supply Res. Technol.-AQUA 2014, 63, 358–367. [Google Scholar] [CrossRef]
- Avaliani, S.L.; Balter, B.M.; Balter, D.B. Air pollution source identification from odor complaint data. Air Qual. Atmos. Health 2015, 9, 179–192. [Google Scholar] [CrossRef]
- Pan, G.; Wang, B.; Guo, S.; Zhang, W. Statistical analysis of sewer odour based on 10-year complaint data. Water Sci. Technol. 2020, 81, 1221–1230. [Google Scholar] [CrossRef] [PubMed]
- Sailunaz, K.; Alhajj, R. Emotion and sentiment analysis from Twitter text. J. Comput. Sci. 2019, 36, 101003. [Google Scholar] [CrossRef] [Green Version]
- Wang, Z.; Ho, S.B.; Cambria, E. A review of emotion sensing: Categorization models and algorithms. Multimed. Tools Appl. 2020, 79, 35553–35582. [Google Scholar] [CrossRef]
- Chen, S.; Lv, X.; Gou, J. Personalized Recommendation Model: An Online Comment Sentiment Based Analysis. Int. J. Comput. Commun. Control 2020, 15, 1004. [Google Scholar] [CrossRef] [Green Version]
- Feng, S.; Wang, D.; Yu, G.; Gao, W.; Wong, K.F. Extracting common emotions from blogs based on fine-grained sentiment clustering. Knowl. Inf. Syst. 2011, 27, 281–302. [Google Scholar] [CrossRef]
- Despoina, A.; Paraskevi, F.; Sotiris, I. A survey of Twitter research: Data model, graph structure, sentiment analysis and attacks—ScienceDirect. Expert Syst. Appl. 2020, 164, 114006. [Google Scholar]
- Choi, H.-J.; Park, C.H. Emerging topic detection in twitter stream based on high utility pattern mining. Expert Syst. Appl. 2019, 115, 27–36. [Google Scholar] [CrossRef]
- Yang, L.; Lin, H. Construction and Application of Chinese Emotional Corpus. In Proceedings of the 13th Chinese Conference on Chinese Lexical Semantics, Wuhan, China, 6–8 July 2012; pp. 122–133. [Google Scholar]
- Ali, Y.; Ameneh, G.; Zaiane, O. Current State of Text Sentiment Analysis from Opinion to Emotion Mining. ACM Comput. Surv. 2017, 50, 1–33. [Google Scholar]
- Goldberg, W.D.; Wilson, J.P.; Knoblock, C.A. From text to geographic coordinates: The current state of geocoding. J. Urban Reg. Inf. Syst. Assoc. 2007, 19, 33–46. [Google Scholar]
- Lin, Y.; Kang, M.J.; Wu, Y.Y.; Du, Q.Y.; Liu, T. A deep learning architecture for semantic address matching. Int. J. Geogr. Inf. Sci. 2020, 34, 559–576. [Google Scholar] [CrossRef]
- Getis, A.; Ord, J.K. The Analysis of Spatial Association by Use of Distance Statistics. Geogr. Anal. 1992, 24, 189–206. [Google Scholar] [CrossRef]
- Freedman, D.; Pisani, R.; Purves, R. Statistics; Norton & Company: New York, NY, USA, 1998; p. 148. [Google Scholar]
- Li, J.; Sun, Z. Urban Function Orientation Based on Spatiotemporal Differences and Driving Factors of Urban Construction Land. J. Urban Plan. Dev. 2020, 146, 05020011. [Google Scholar] [CrossRef]
- Liu, L.; He, P.; Zhang, B.; Bi, J. Red and Green: Public Perception and Air Quality Information in Urban China. Environment 2012, 54, 44–49. [Google Scholar] [CrossRef]
- Xian, J.; Sun, D.; Xu, W.; Han, W.; Yang, S. Urban air pollution monitoring using scanning Lidar. Environ. Pollut. 2019, 258, 113696. [Google Scholar] [CrossRef] [PubMed]
- Ryu, Y.H.; Min, S.K. What matters in public perception and awareness of air quality? Quantitative assessment using internet search volume data. Environ. Res. Lett. 2020, 15, 0940b4. [Google Scholar] [CrossRef]
- Cui, W.; Wu, Y.; Liu, S.; Wei, F.; Zhou, M.; Qu, H. Context-Preserving, Dynamic Word Cloud Visualization. IEEE Comput. Graph. Appl. 2010, 30, 42–53. [Google Scholar] [CrossRef] [PubMed]
- Heimerl, F.; Lohmann, S.; Lange, S.; Ertl, T. Word Cloud Explorer: Text Analytics Based on Word Clouds. In Proceedings of the 2014 47th Hawaii International Conference on System Sciences, Waikoloa, HI, USA, 6–9 January 2014. [Google Scholar]


| Number | Date | Title | Content | Reply |
|---|---|---|---|---|
| 201211031525 | 2012/11/3 | Heze chemical plant seriously pollutes the environment | Recently, there is a strong smell of chemical industrial waste gas near Guangzhou road and Huanghe East Road in Heze City from 19 o’clock every night to 7 o’clock the next morning, which seriously threatens the physical and mental health of residents. | [Heze Environmental Protection Bureau] After receiving the problems reported by the masses, it investigated the chemical companies in the development zone one by one, and found that Shandong Dongyao Pharmaceutical Co., Ltd. had many environmental problems such as odor of exhaust gas, and issued a notice of production suspension and rectification. |
| 201708033338 | 2017/8/3 | Exhaust gas is secretly discharged, smoke and dust pollution is serious, evading inspection | I am a villager where this factory is located. Every day, the factory has serious odors, secretly venting gases, and does not have any environmental protection equipment. And the dust smell is serious. I hope that the provincial leaders will pay attention to our living environment. | [Zibo Yiyuan Environmental Protection Bureau] there is unorganized emission of smoke and dust in Zibo Deyuan metal materials Co., Ltd. The environmental supervisors of our bureau required the enterprise to: first, build new air pollutant treatment facilities matching the production process; second, during the rectification period of the production workshop, take measures to limit production or stop production to ensure the emission up to the standard. |
| Polarity | Intensity | Description | Example |
|---|---|---|---|
| - Negative | 9 | Cannot survive | Killed, Cancer |
| 7 | Danger to the human body | Dizziness, Nausea | |
| 5 | Affect normal life | Pungent, Choking | |
| 3 | Has an unpleasant smell | Bad smell, Stench | |
| 1 | Can feel, but not affected | Sewage, Soot |
| Correlations | |||
|---|---|---|---|
| Emotion Score | Number of Complaints | ||
| PM2.5 | Pearson correlation | −0.733 ** | −0.718 ** |
| Sig. 2-tailed | 0.000 | 0.000 | |
| N | 301 | 301 | |
| PM10 | Pearson correlation | −0.606 ** | −0.735 ** |
| Sig. 2-tailed | 0.000 | 0.000 | |
| N | 419 | 419 | |
Publisher’s Note: MDPI stays neutral with regard to jurisdictional claims in published maps and institutional affiliations. |
© 2021 by the authors. Licensee MDPI, Basel, Switzerland. This article is an open access article distributed under the terms and conditions of the Creative Commons Attribution (CC BY) license (http://creativecommons.org/licenses/by/4.0/).
Share and Cite
Sun, Y.; Ji, M.; Jin, F.; Wang, H. Public Responses to Air Pollution in Shandong Province Using the Online Complaint Data. ISPRS Int. J. Geo-Inf. 2021, 10, 126. https://doi.org/10.3390/ijgi10030126
Sun Y, Ji M, Jin F, Wang H. Public Responses to Air Pollution in Shandong Province Using the Online Complaint Data. ISPRS International Journal of Geo-Information. 2021; 10(3):126. https://doi.org/10.3390/ijgi10030126
Chicago/Turabian StyleSun, Yong, Min Ji, Fengxiang Jin, and Huimeng Wang. 2021. "Public Responses to Air Pollution in Shandong Province Using the Online Complaint Data" ISPRS International Journal of Geo-Information 10, no. 3: 126. https://doi.org/10.3390/ijgi10030126
APA StyleSun, Y., Ji, M., Jin, F., & Wang, H. (2021). Public Responses to Air Pollution in Shandong Province Using the Online Complaint Data. ISPRS International Journal of Geo-Information, 10(3), 126. https://doi.org/10.3390/ijgi10030126


