
Geospatial Analysis of Solar Energy in Riyadh Using a GIS-AHP-Based Technique


Abstract
1. Introduction
- -
- Conducting a comprehensive review of the related studies in the field of the geospatial analysis of solar energy, categorized into remote sensing techniques, ground-based station techniques and hybrid techniques;
- -
- Developing a GIS-AHP-based technique to perform a spatial analysis of the Riyadh region in order to find suitable sites for solar energy projects;
- -
- Delivering visualization maps to present the sites suitable for solar energy projects in the Riyadh region to assist in decision-making processes.
2. Related Work
3. Materials and Methods
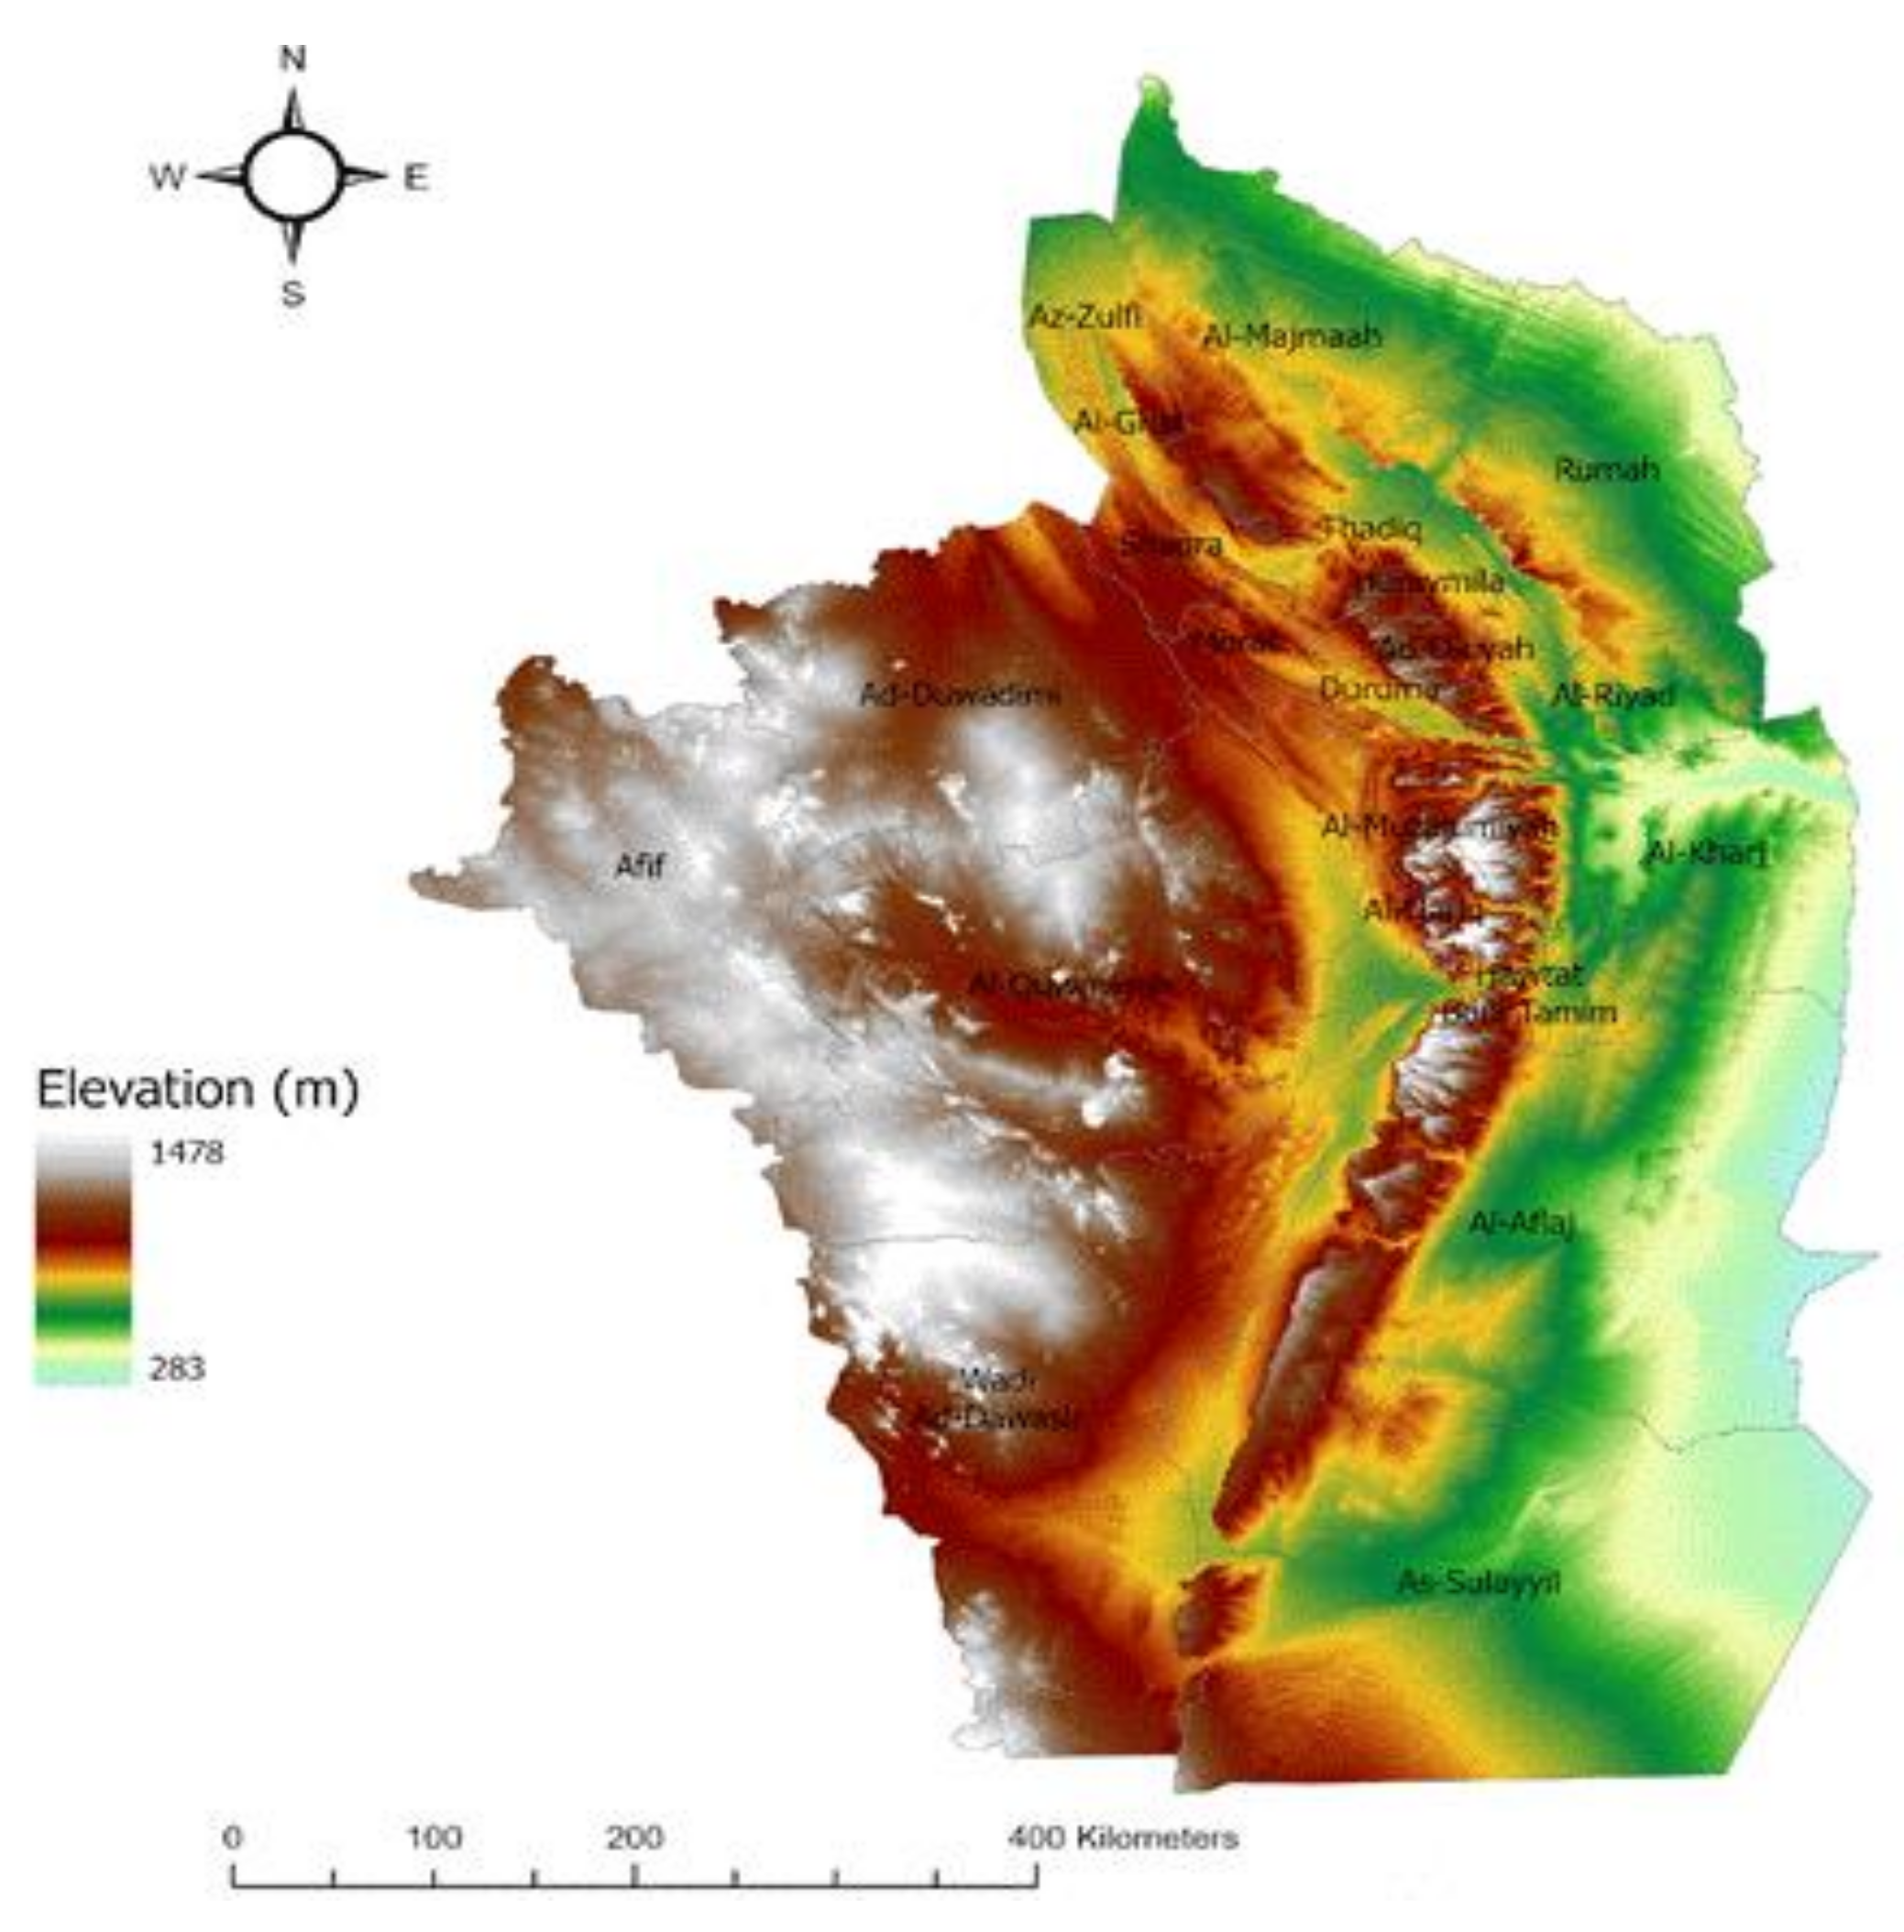
3.1. Study Area

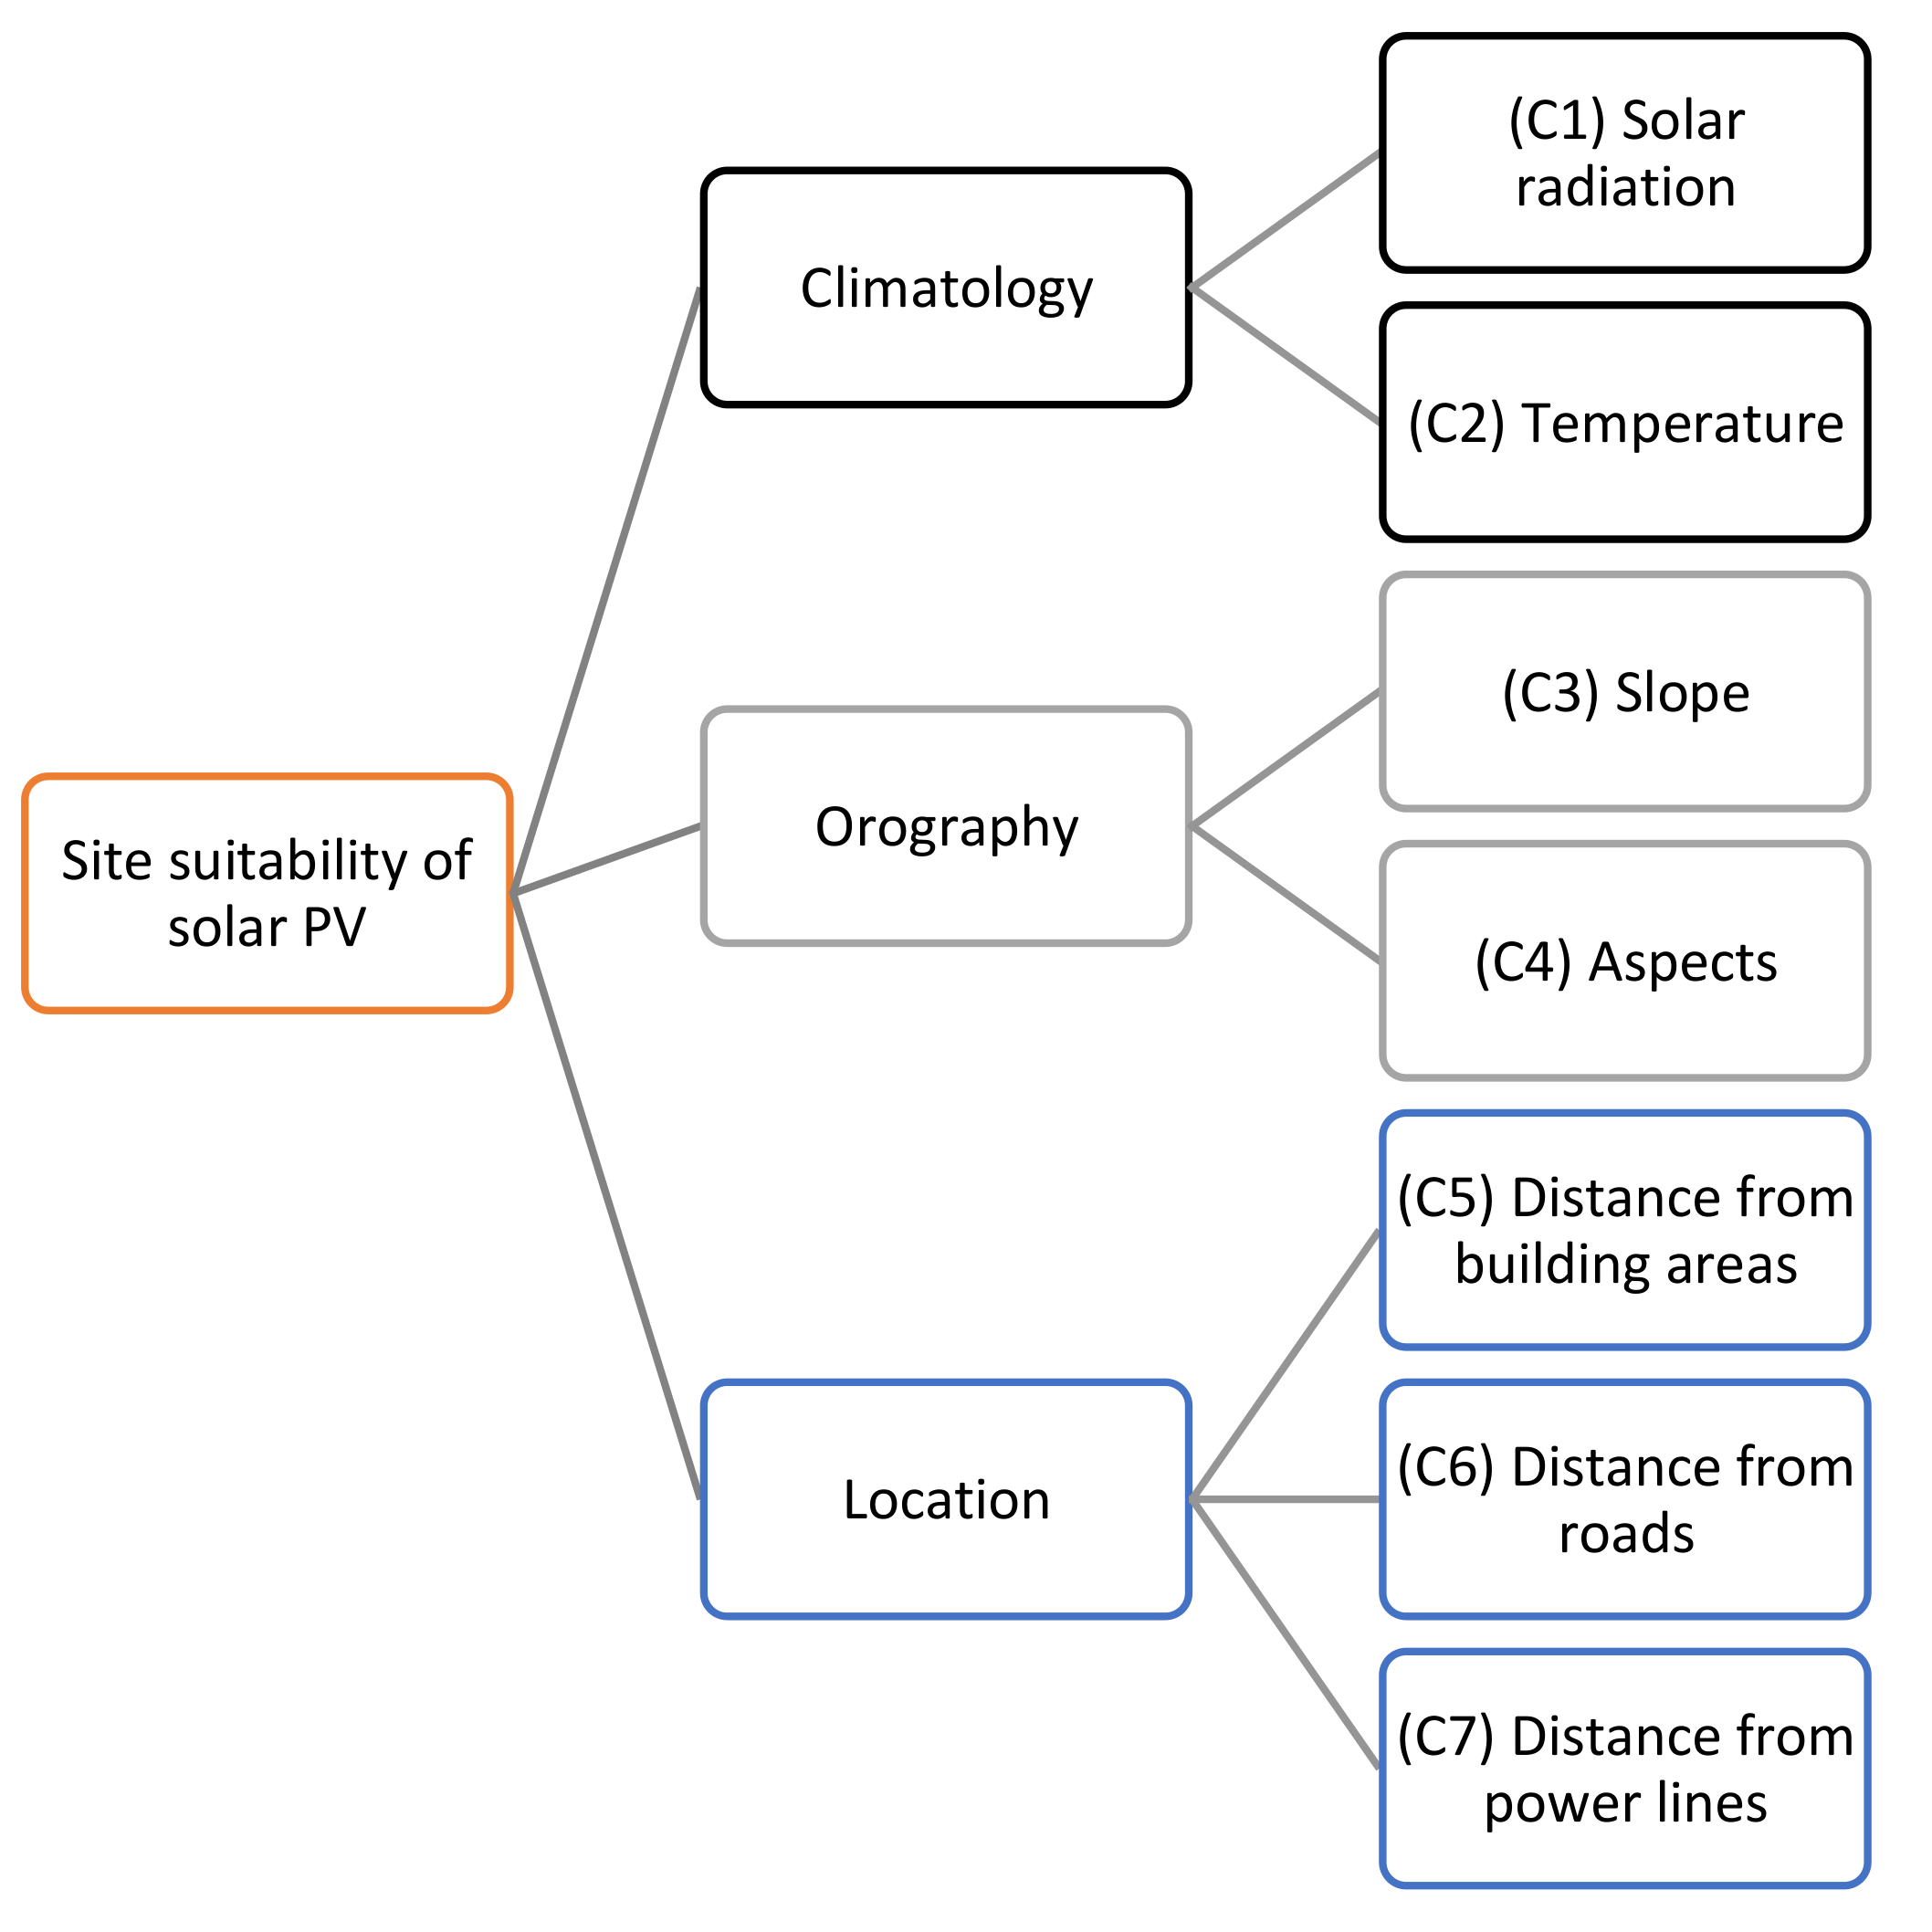
3.2. Defining Criteria
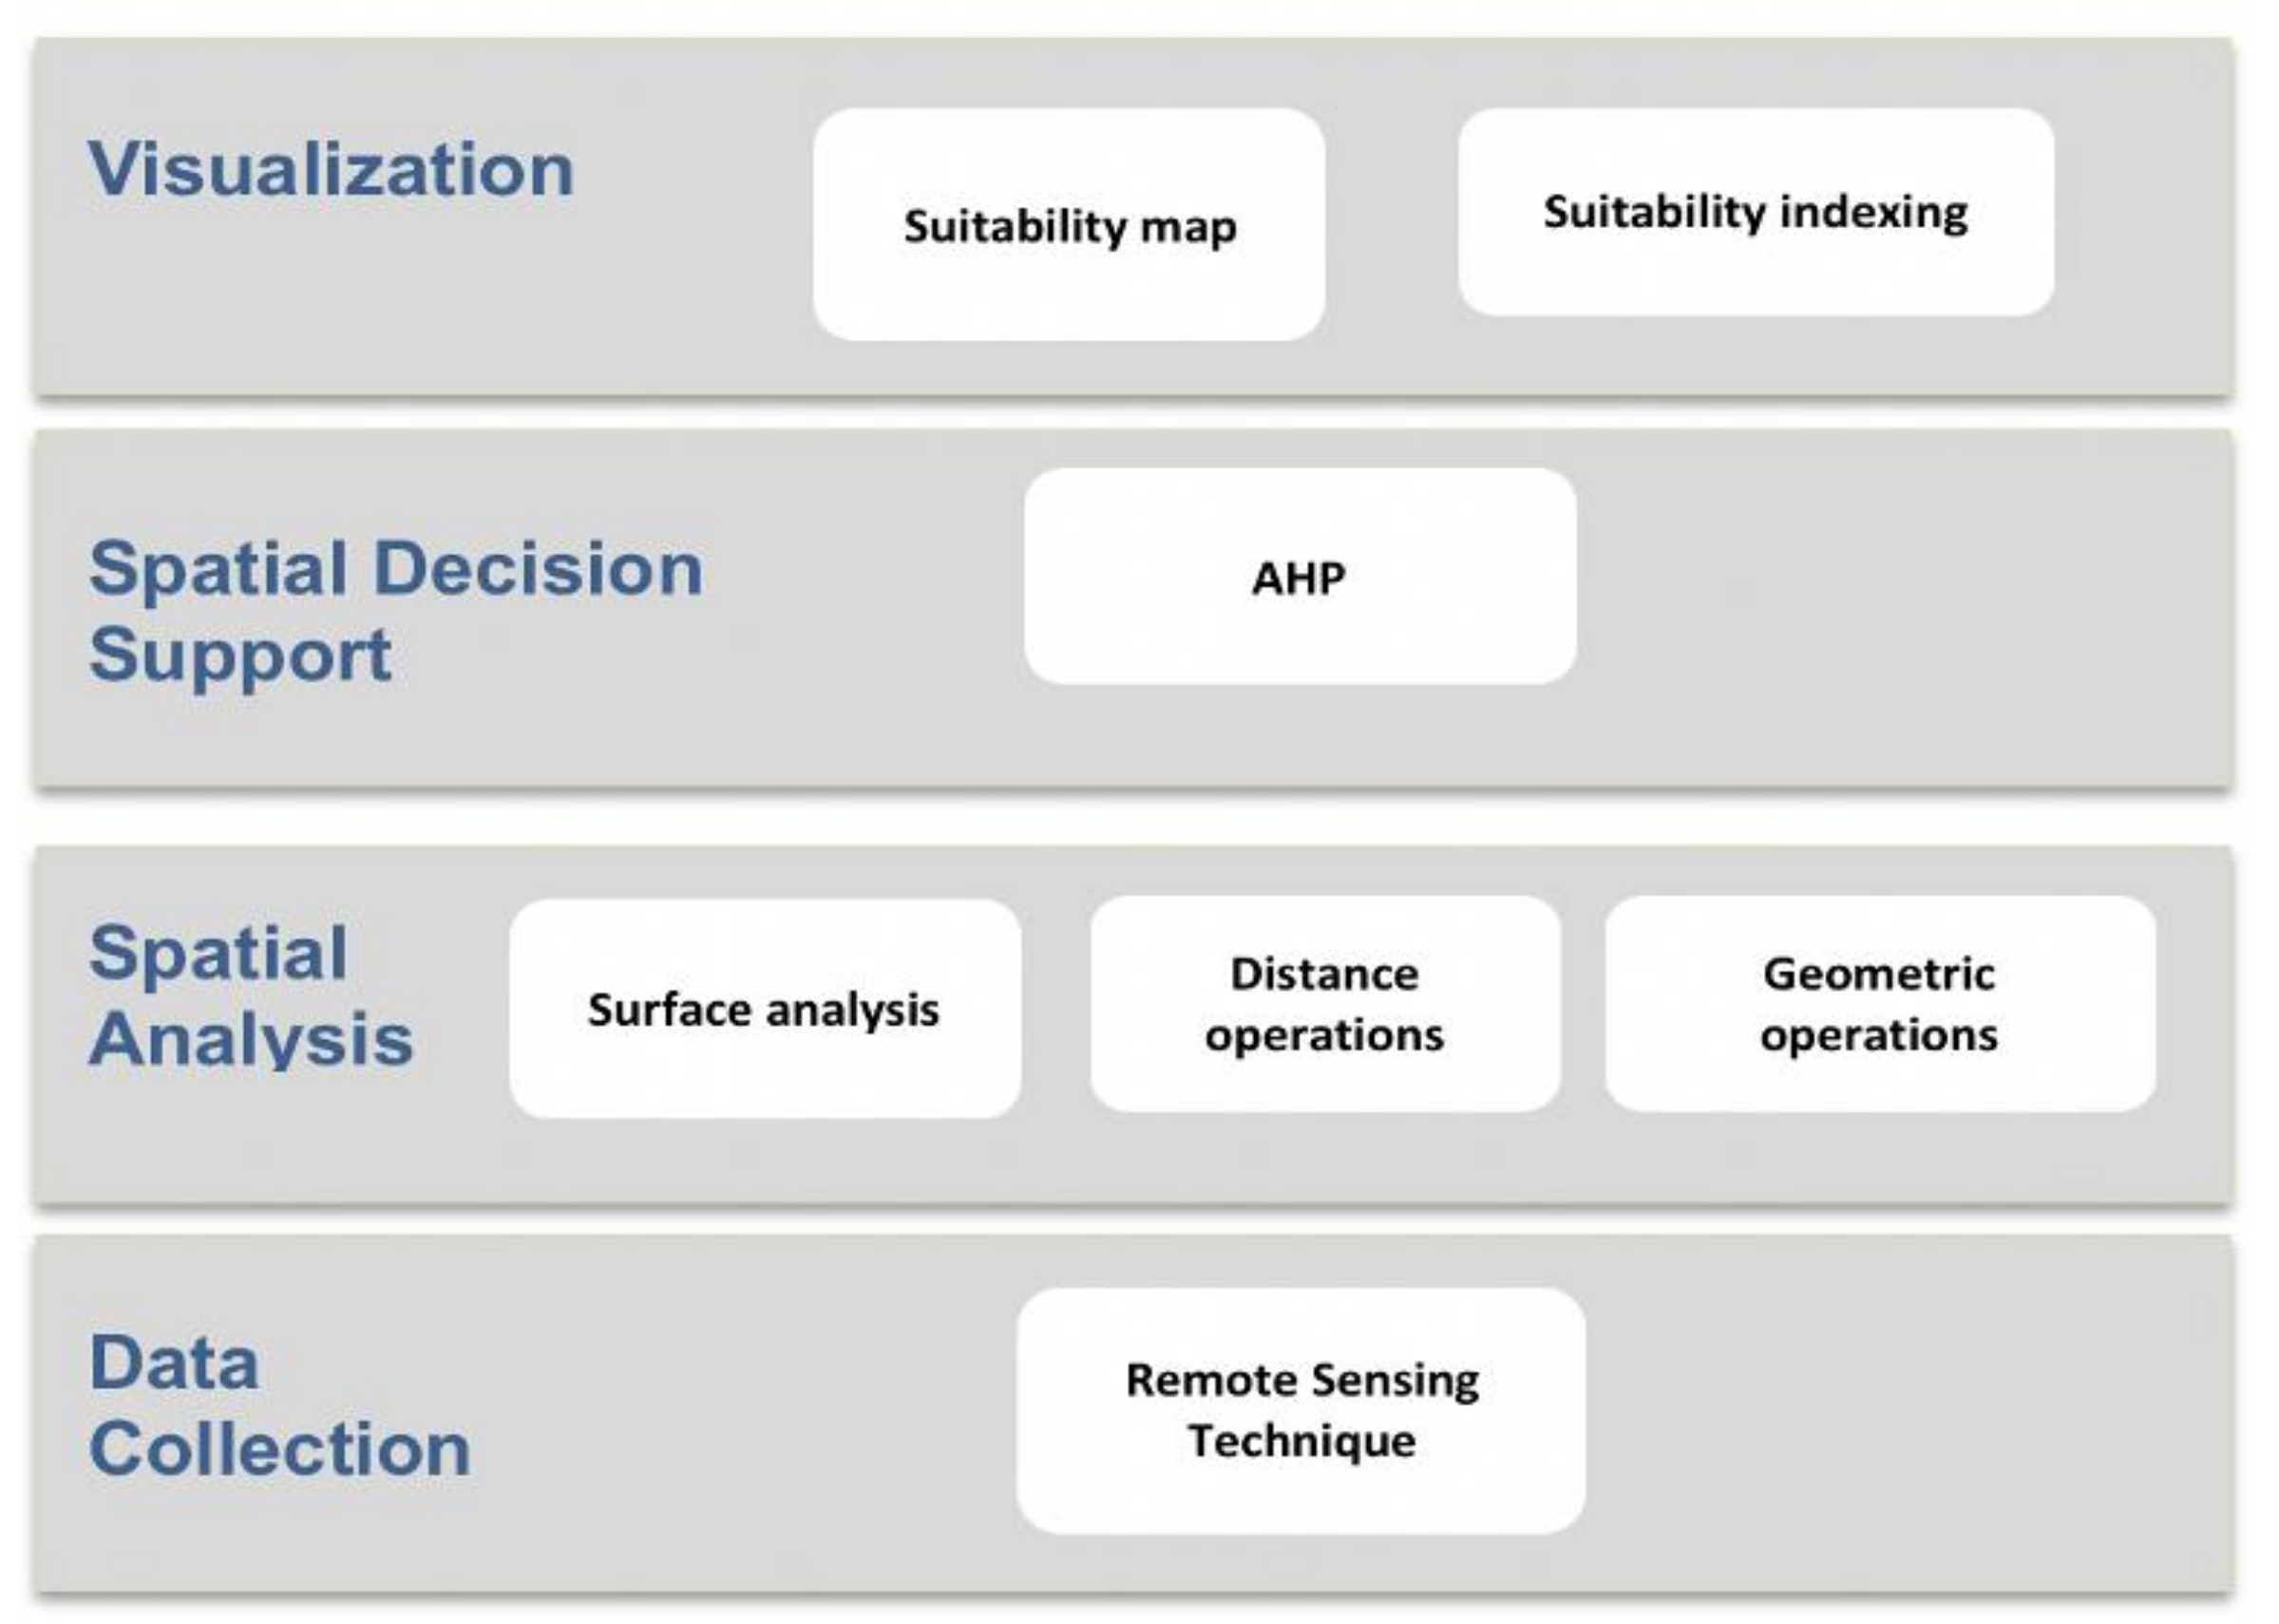
3.3. Proposed Framework
- Data collection, which includes the data collection process according to the required criteria.
- Spatial analysis, which includes the spatial analysis involving several methods such as surface analysis, geometric operations, and distance operations.
- Spatial decision support, whereby the multi-criteria decision analysis (MCDA) is applied using the analytical hierarchical process (AHP).
- Visualization, which consists of the final results of the methodology, represented by suitability maps, as well as the sensitivity analysis, which is conducted to evaluate the result.
3.3.1. Data Collection
3.3.2. Spatial Analysis
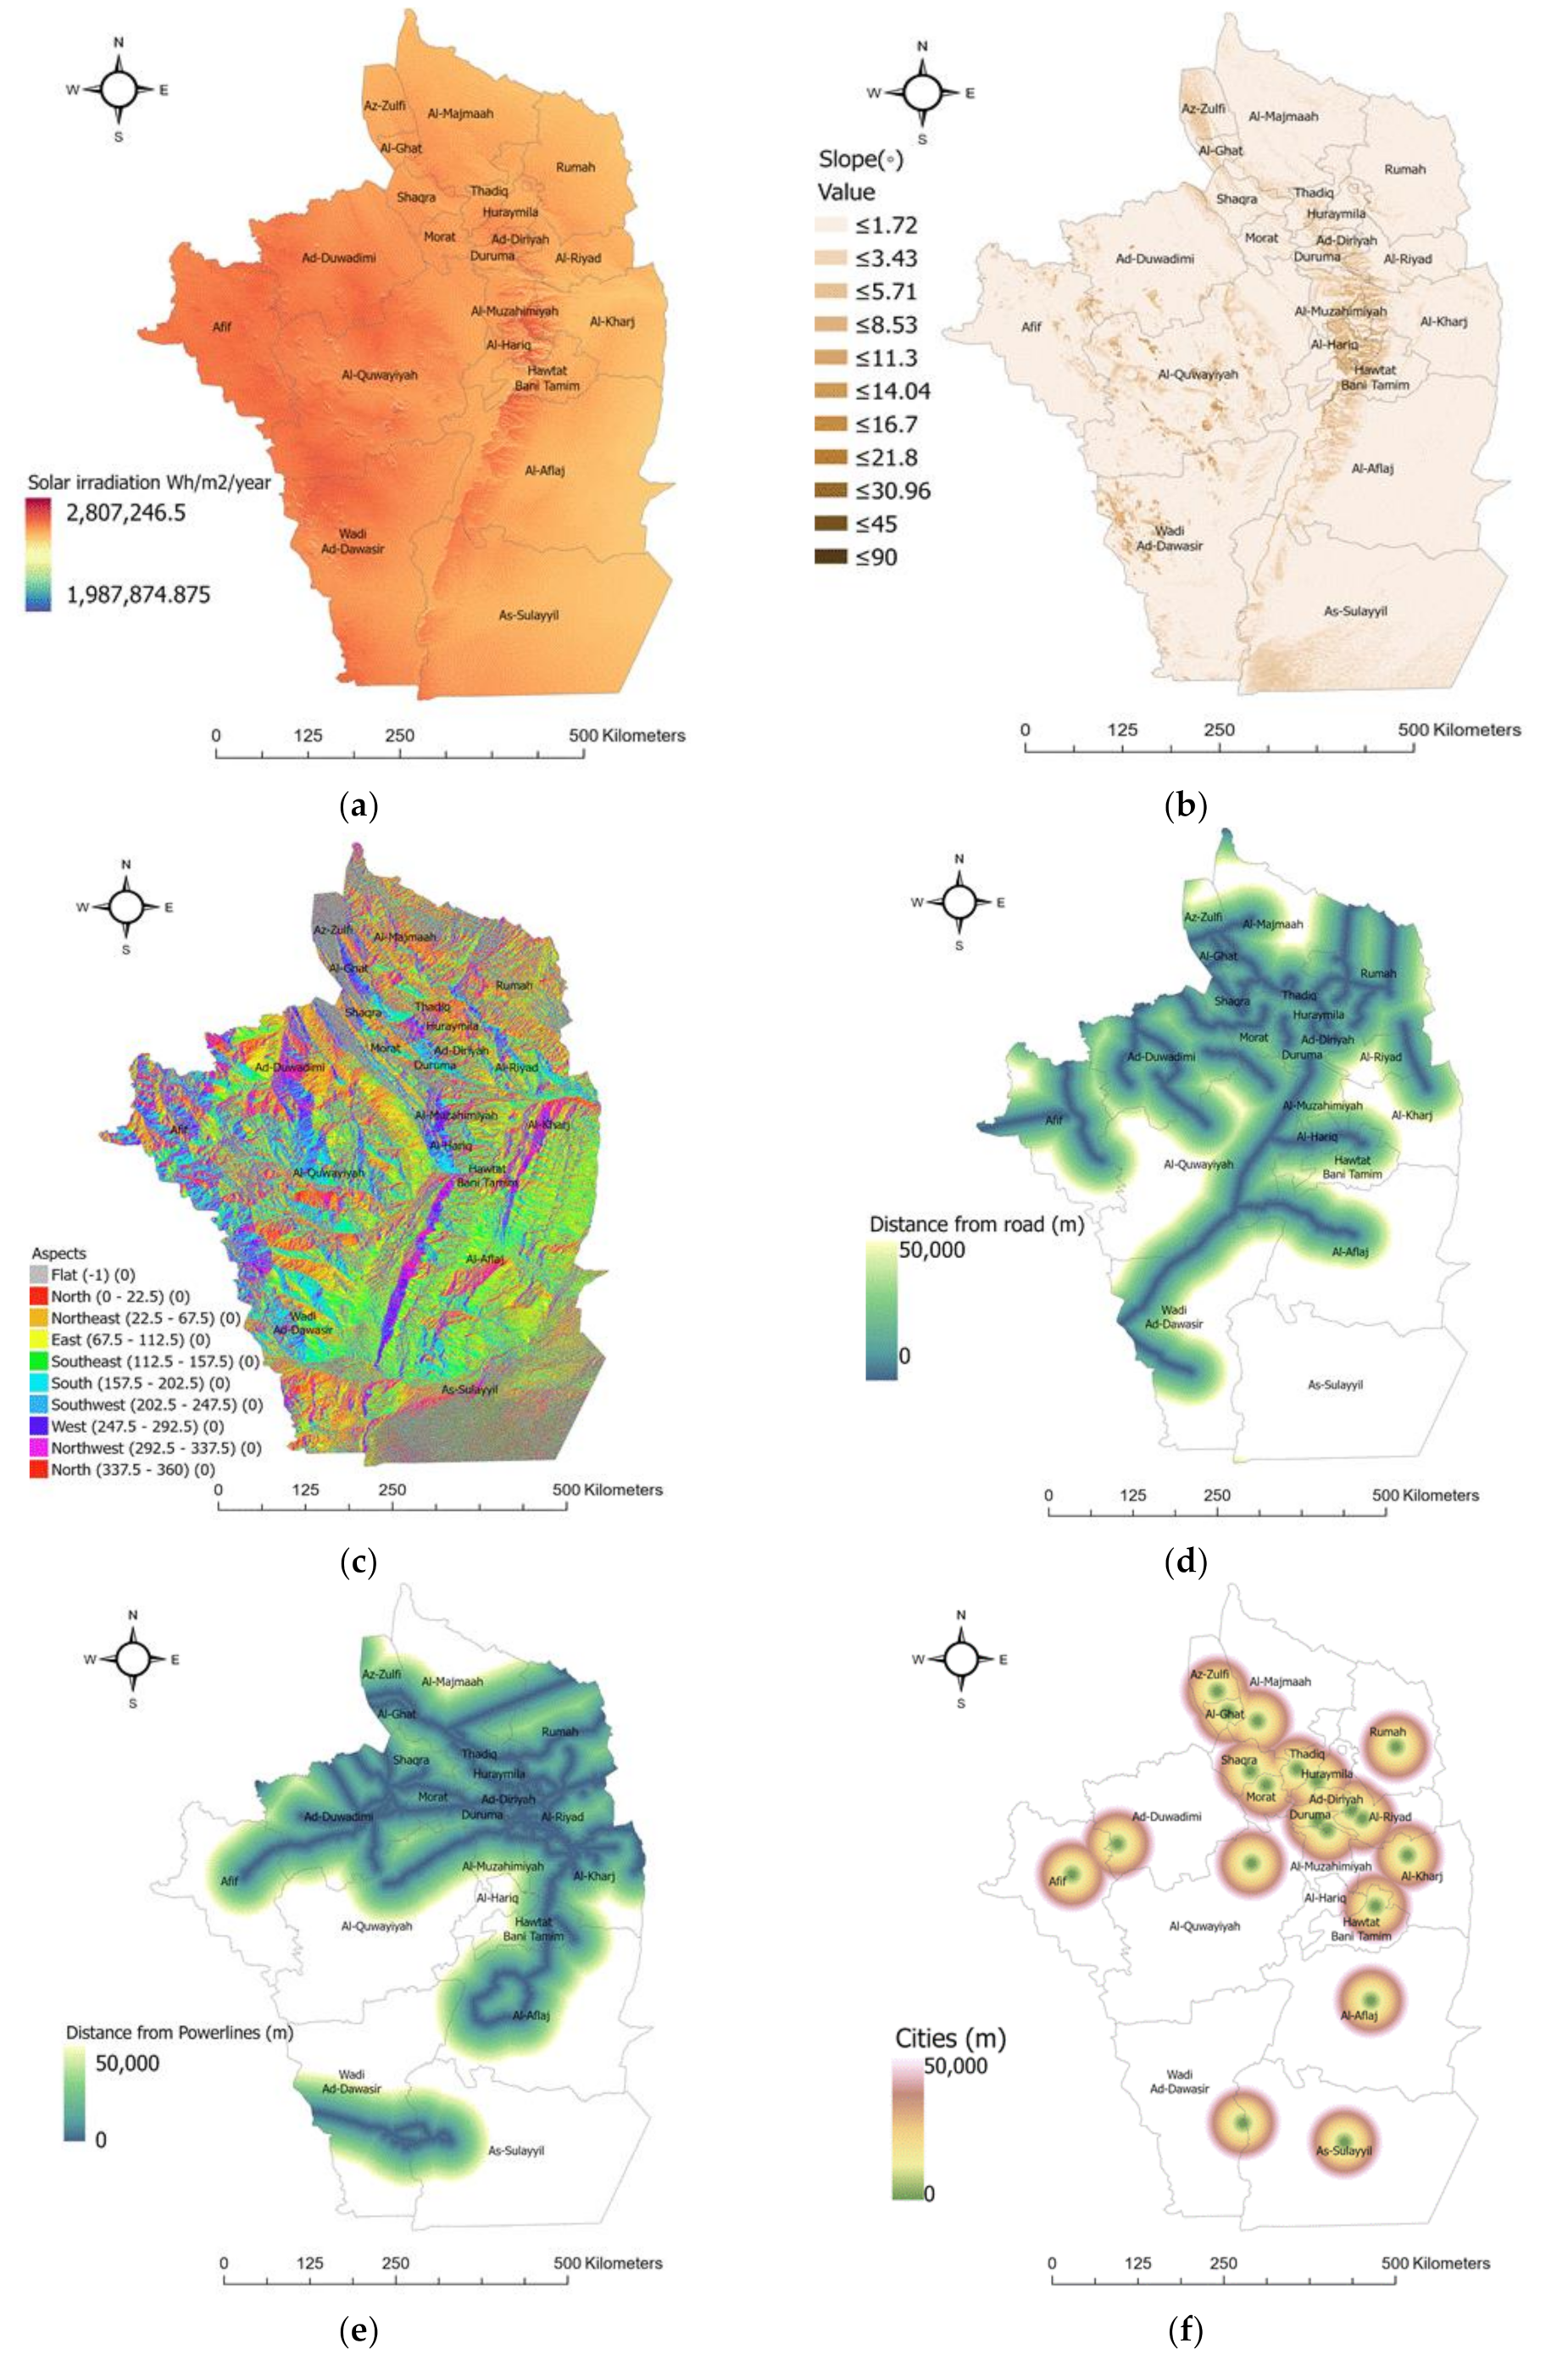
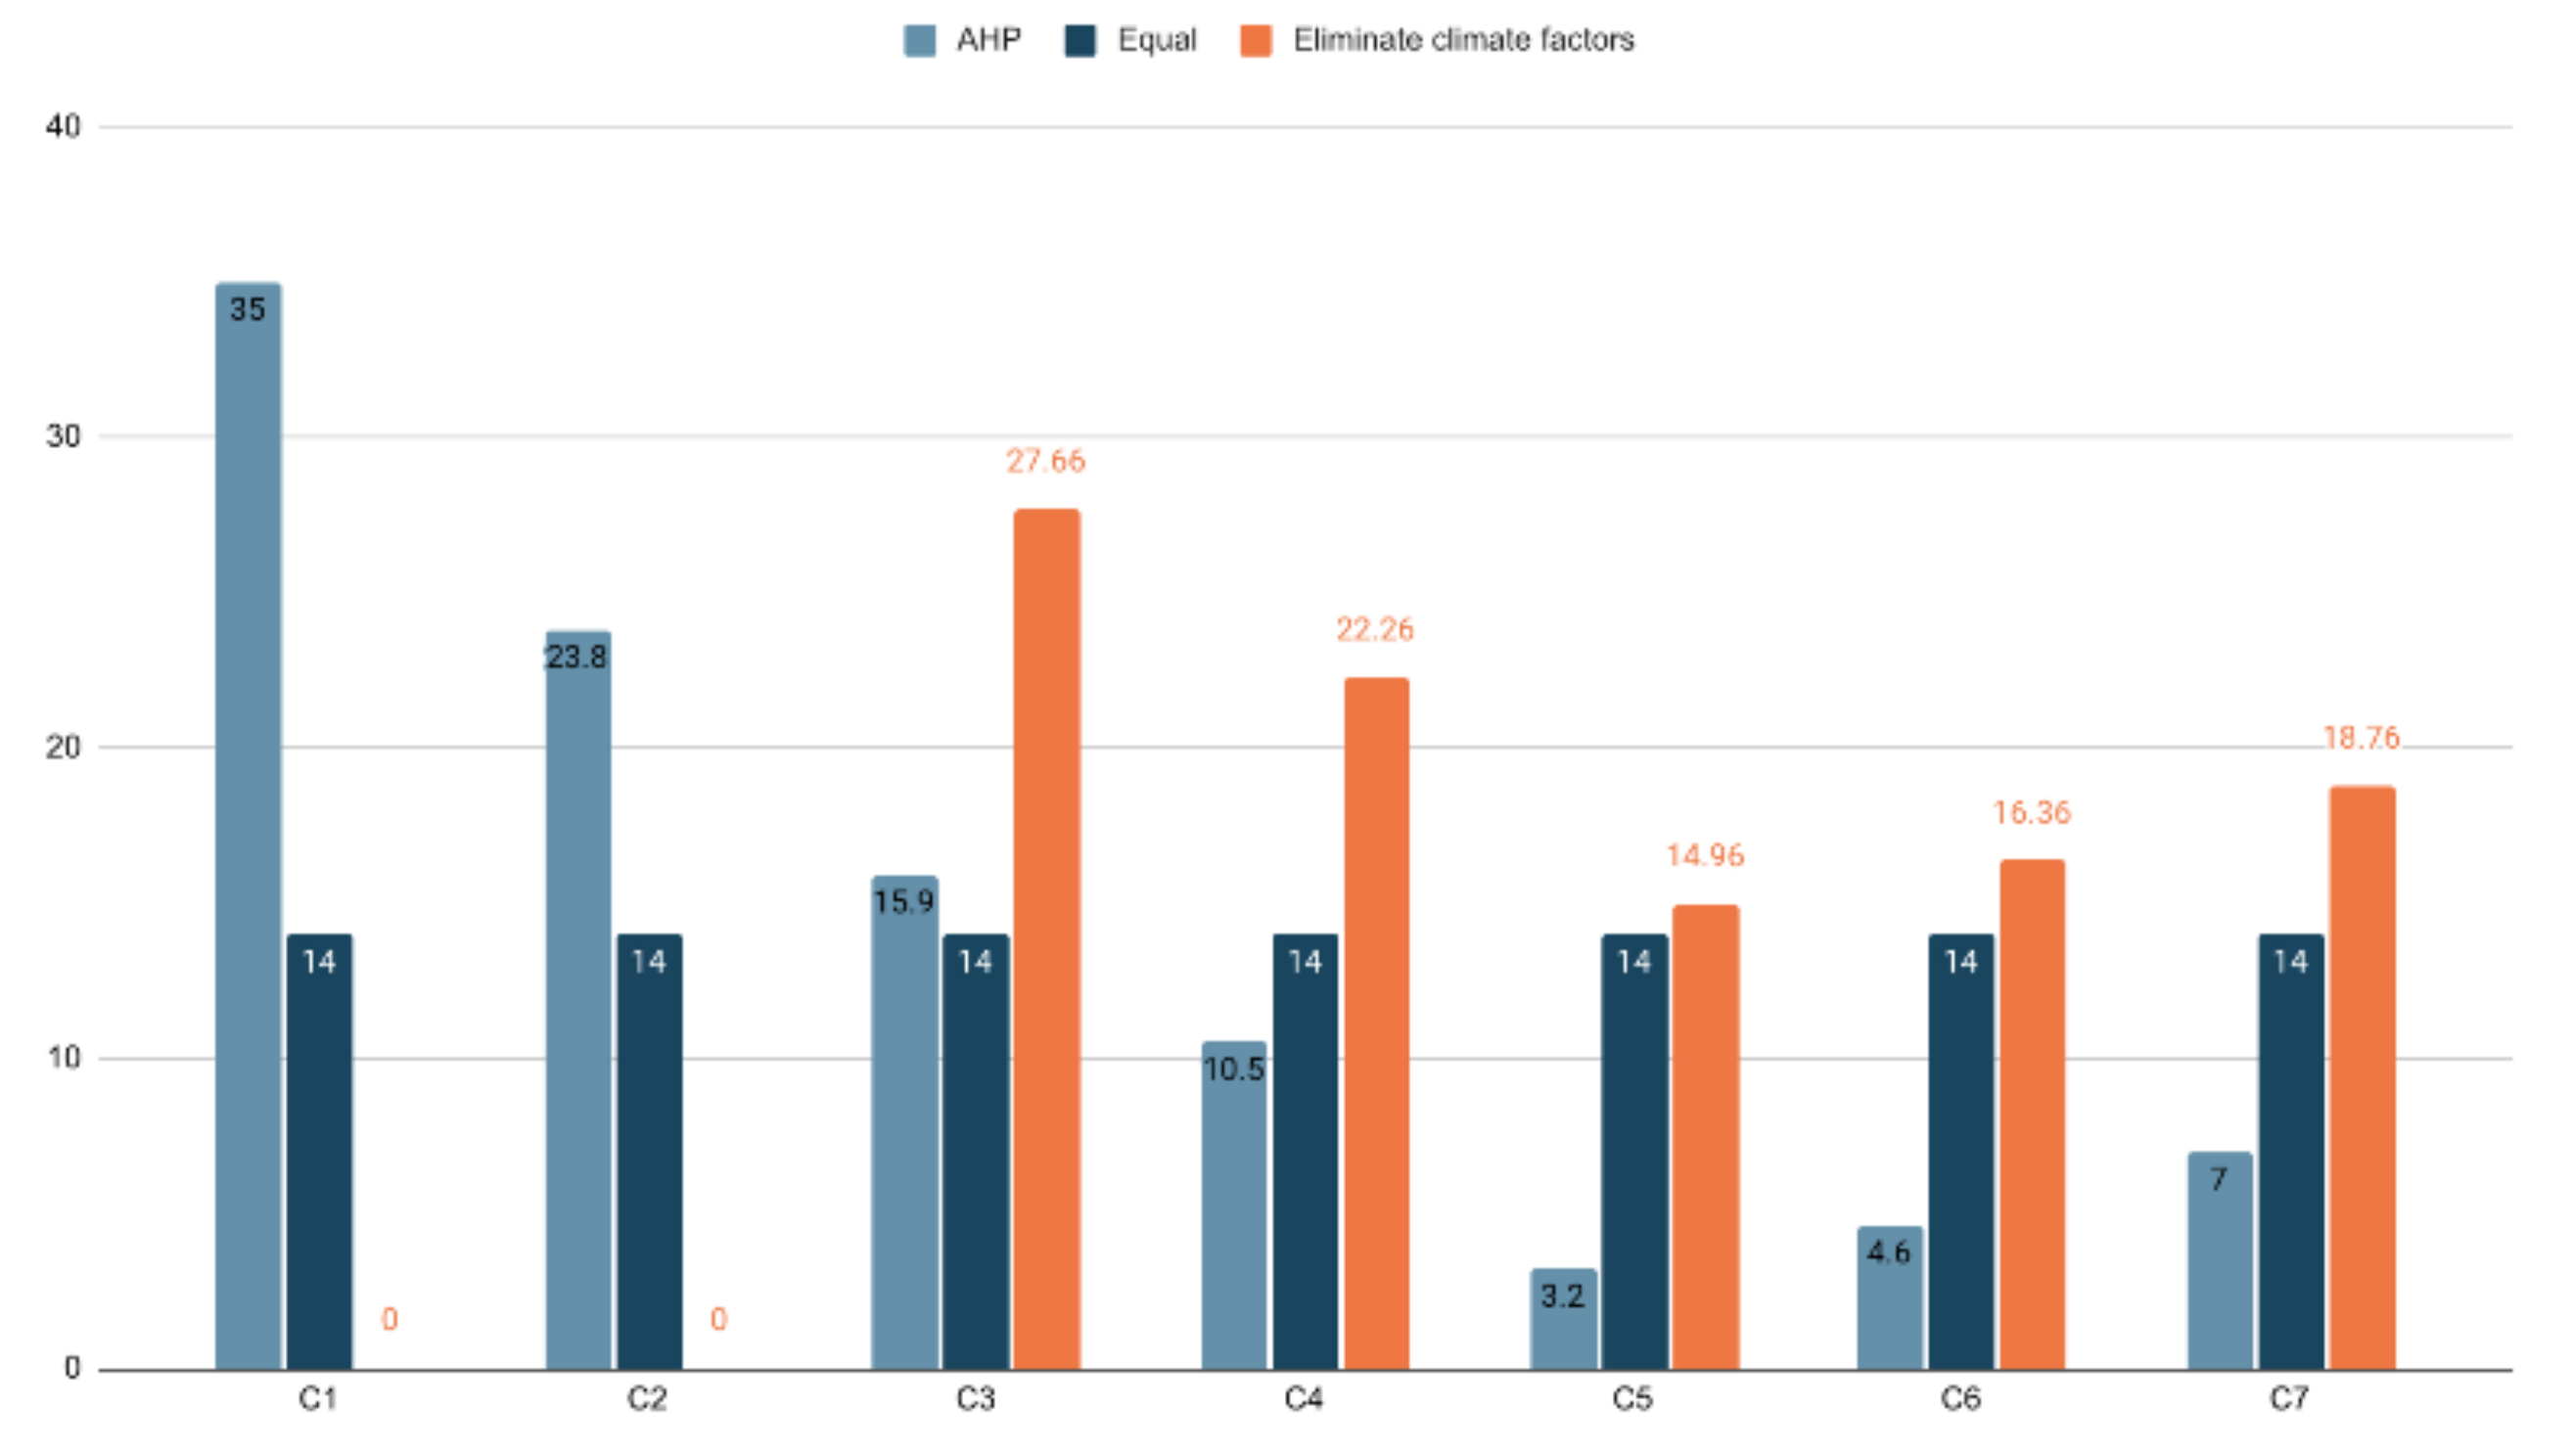
- Solar radiation (C1). The solar irradiance was calculated using the solar analyst area tool that exists in ArcGIS Pro, which takes DEM as the input. The solar tool uses three layers internally (viewshed map, sky map, and sun map) to calculate solar radiation. Table 6 shows the parameters used in the solar analyst tool [9].
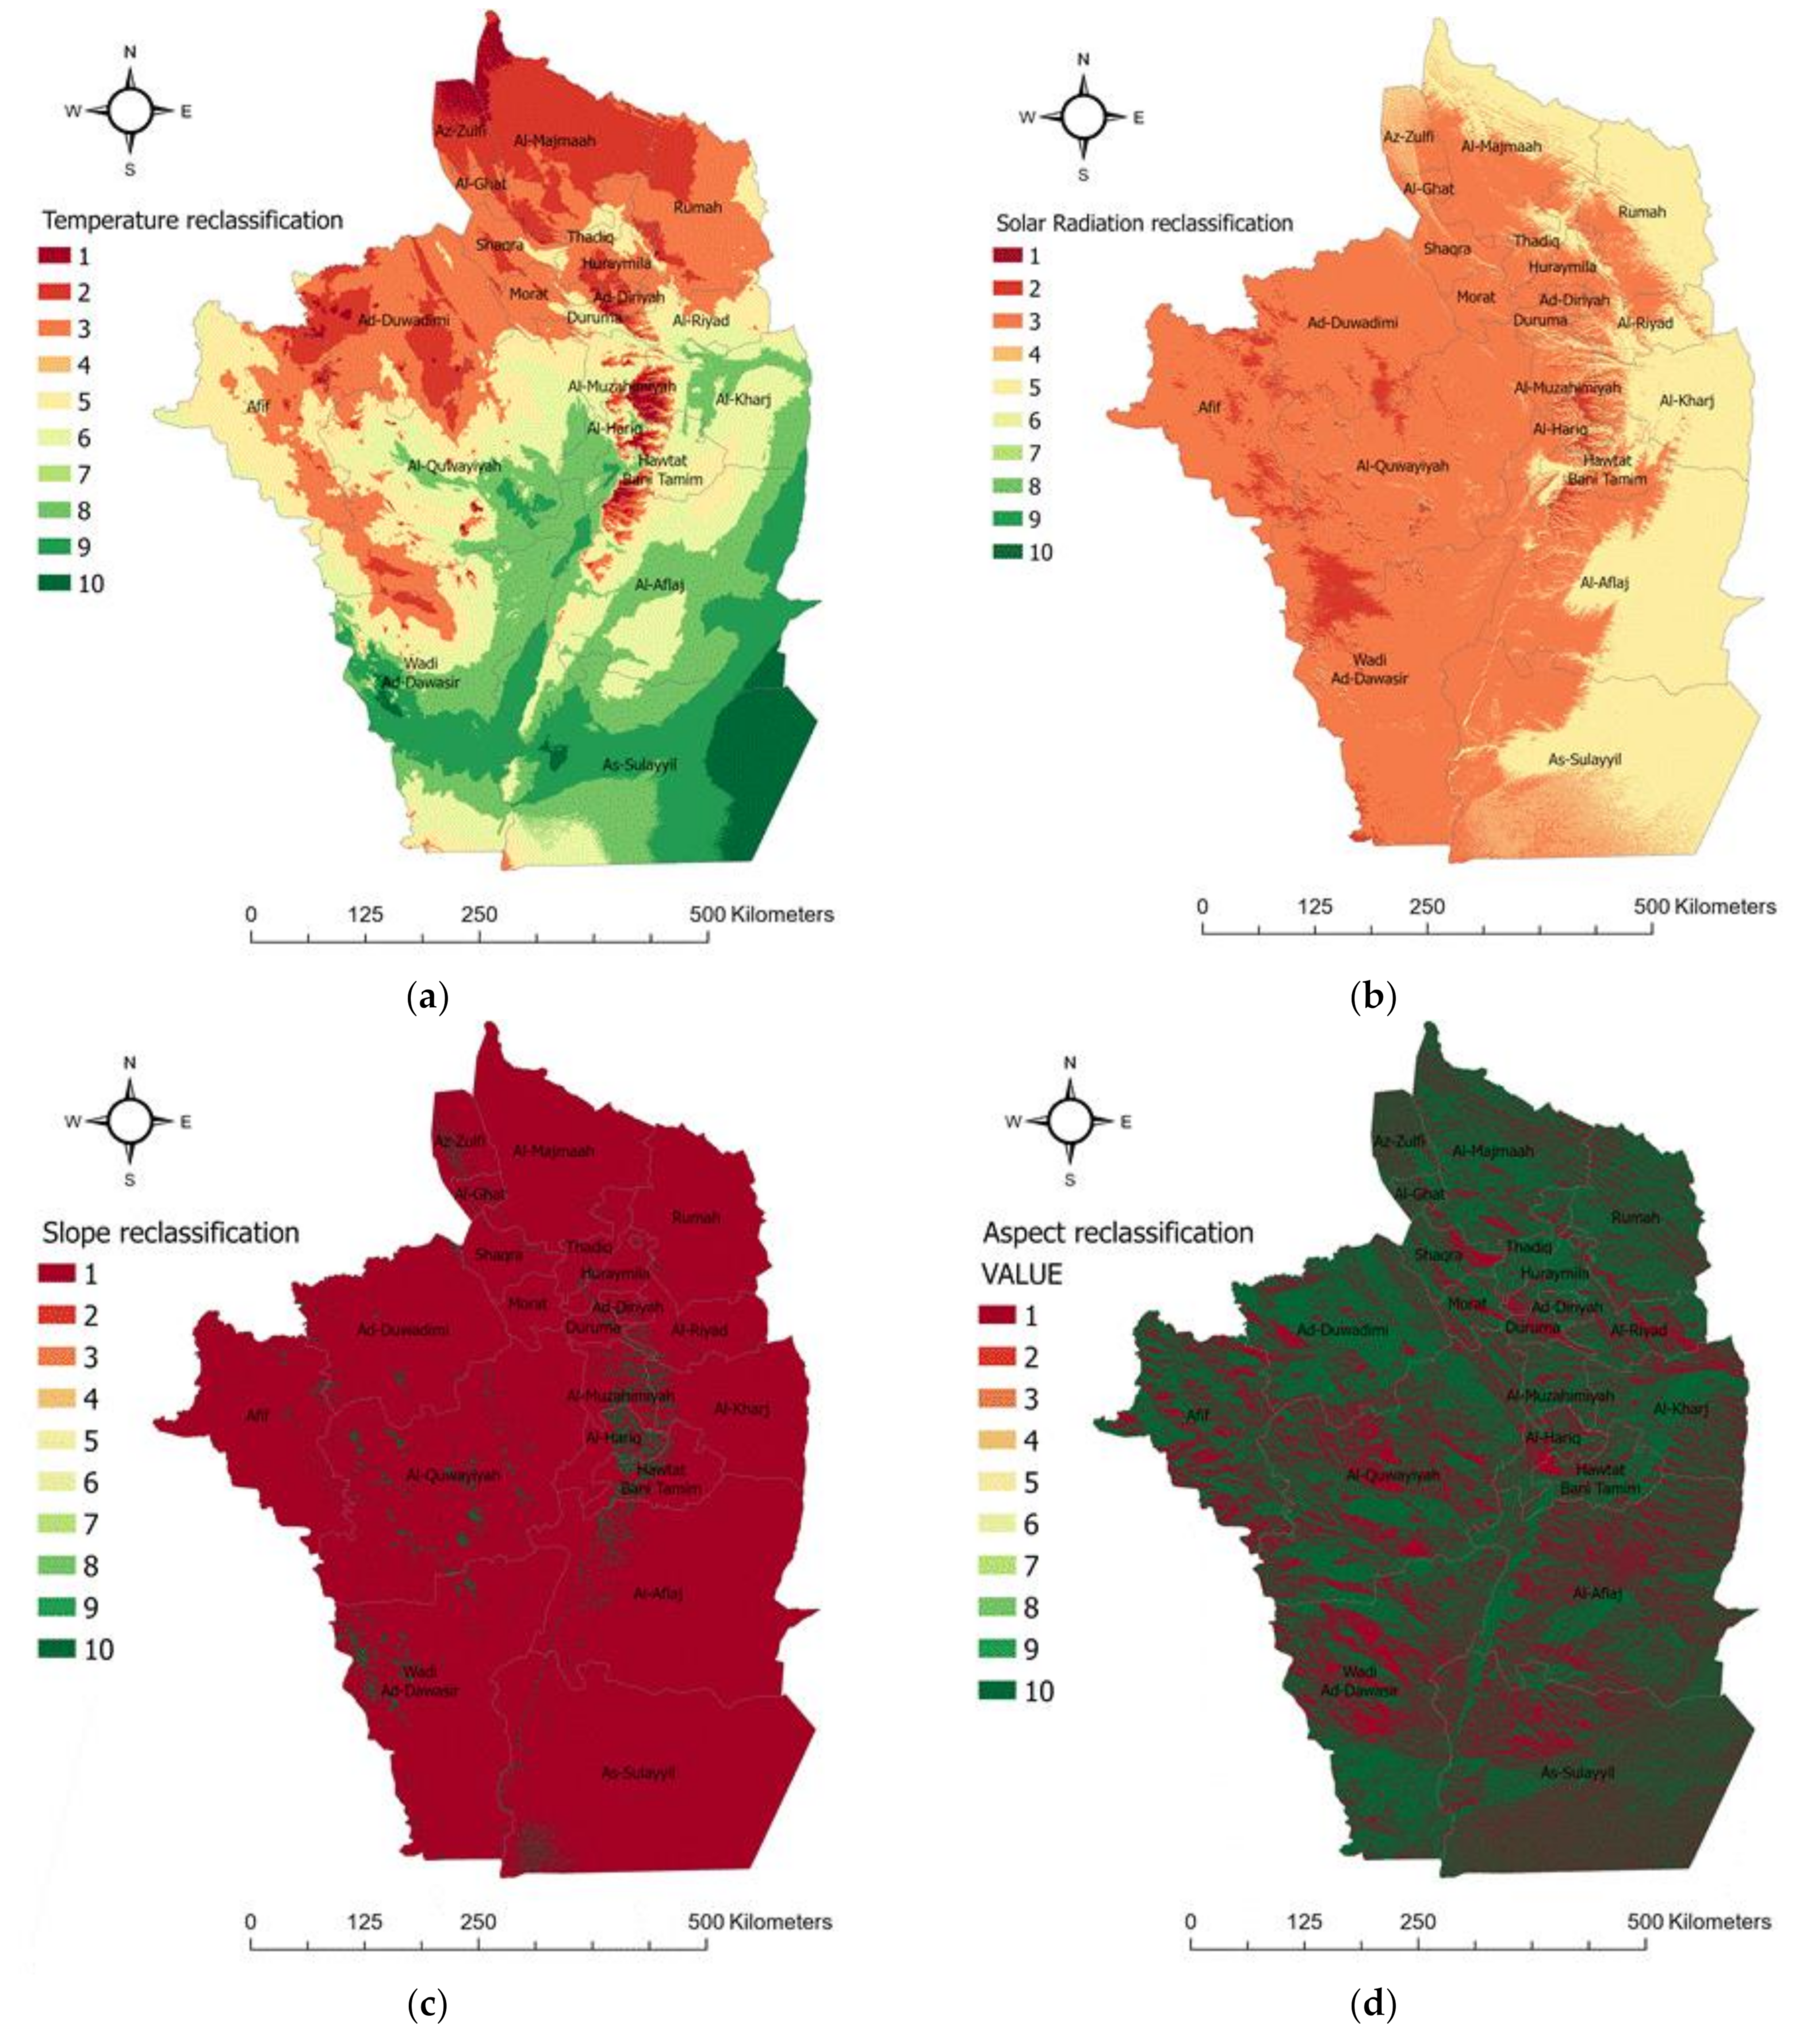
- Temperature (C2). Areas with a high temperature affect energy production negatively [9].
- Slope (C3) is the steepness of a surface and it can affect the receiving of radiation and energy production. Flat areas will receive more radiation. The slope was calculated using DEM as the input for the slope tool in ArcGIS pro [10].
- Aspect (C4) is the orientation of a surface. South-facing panels are preferable for solar energy production. The aspect was also calculated using DEM as the input for the aspect tool in ArcGIS [10].
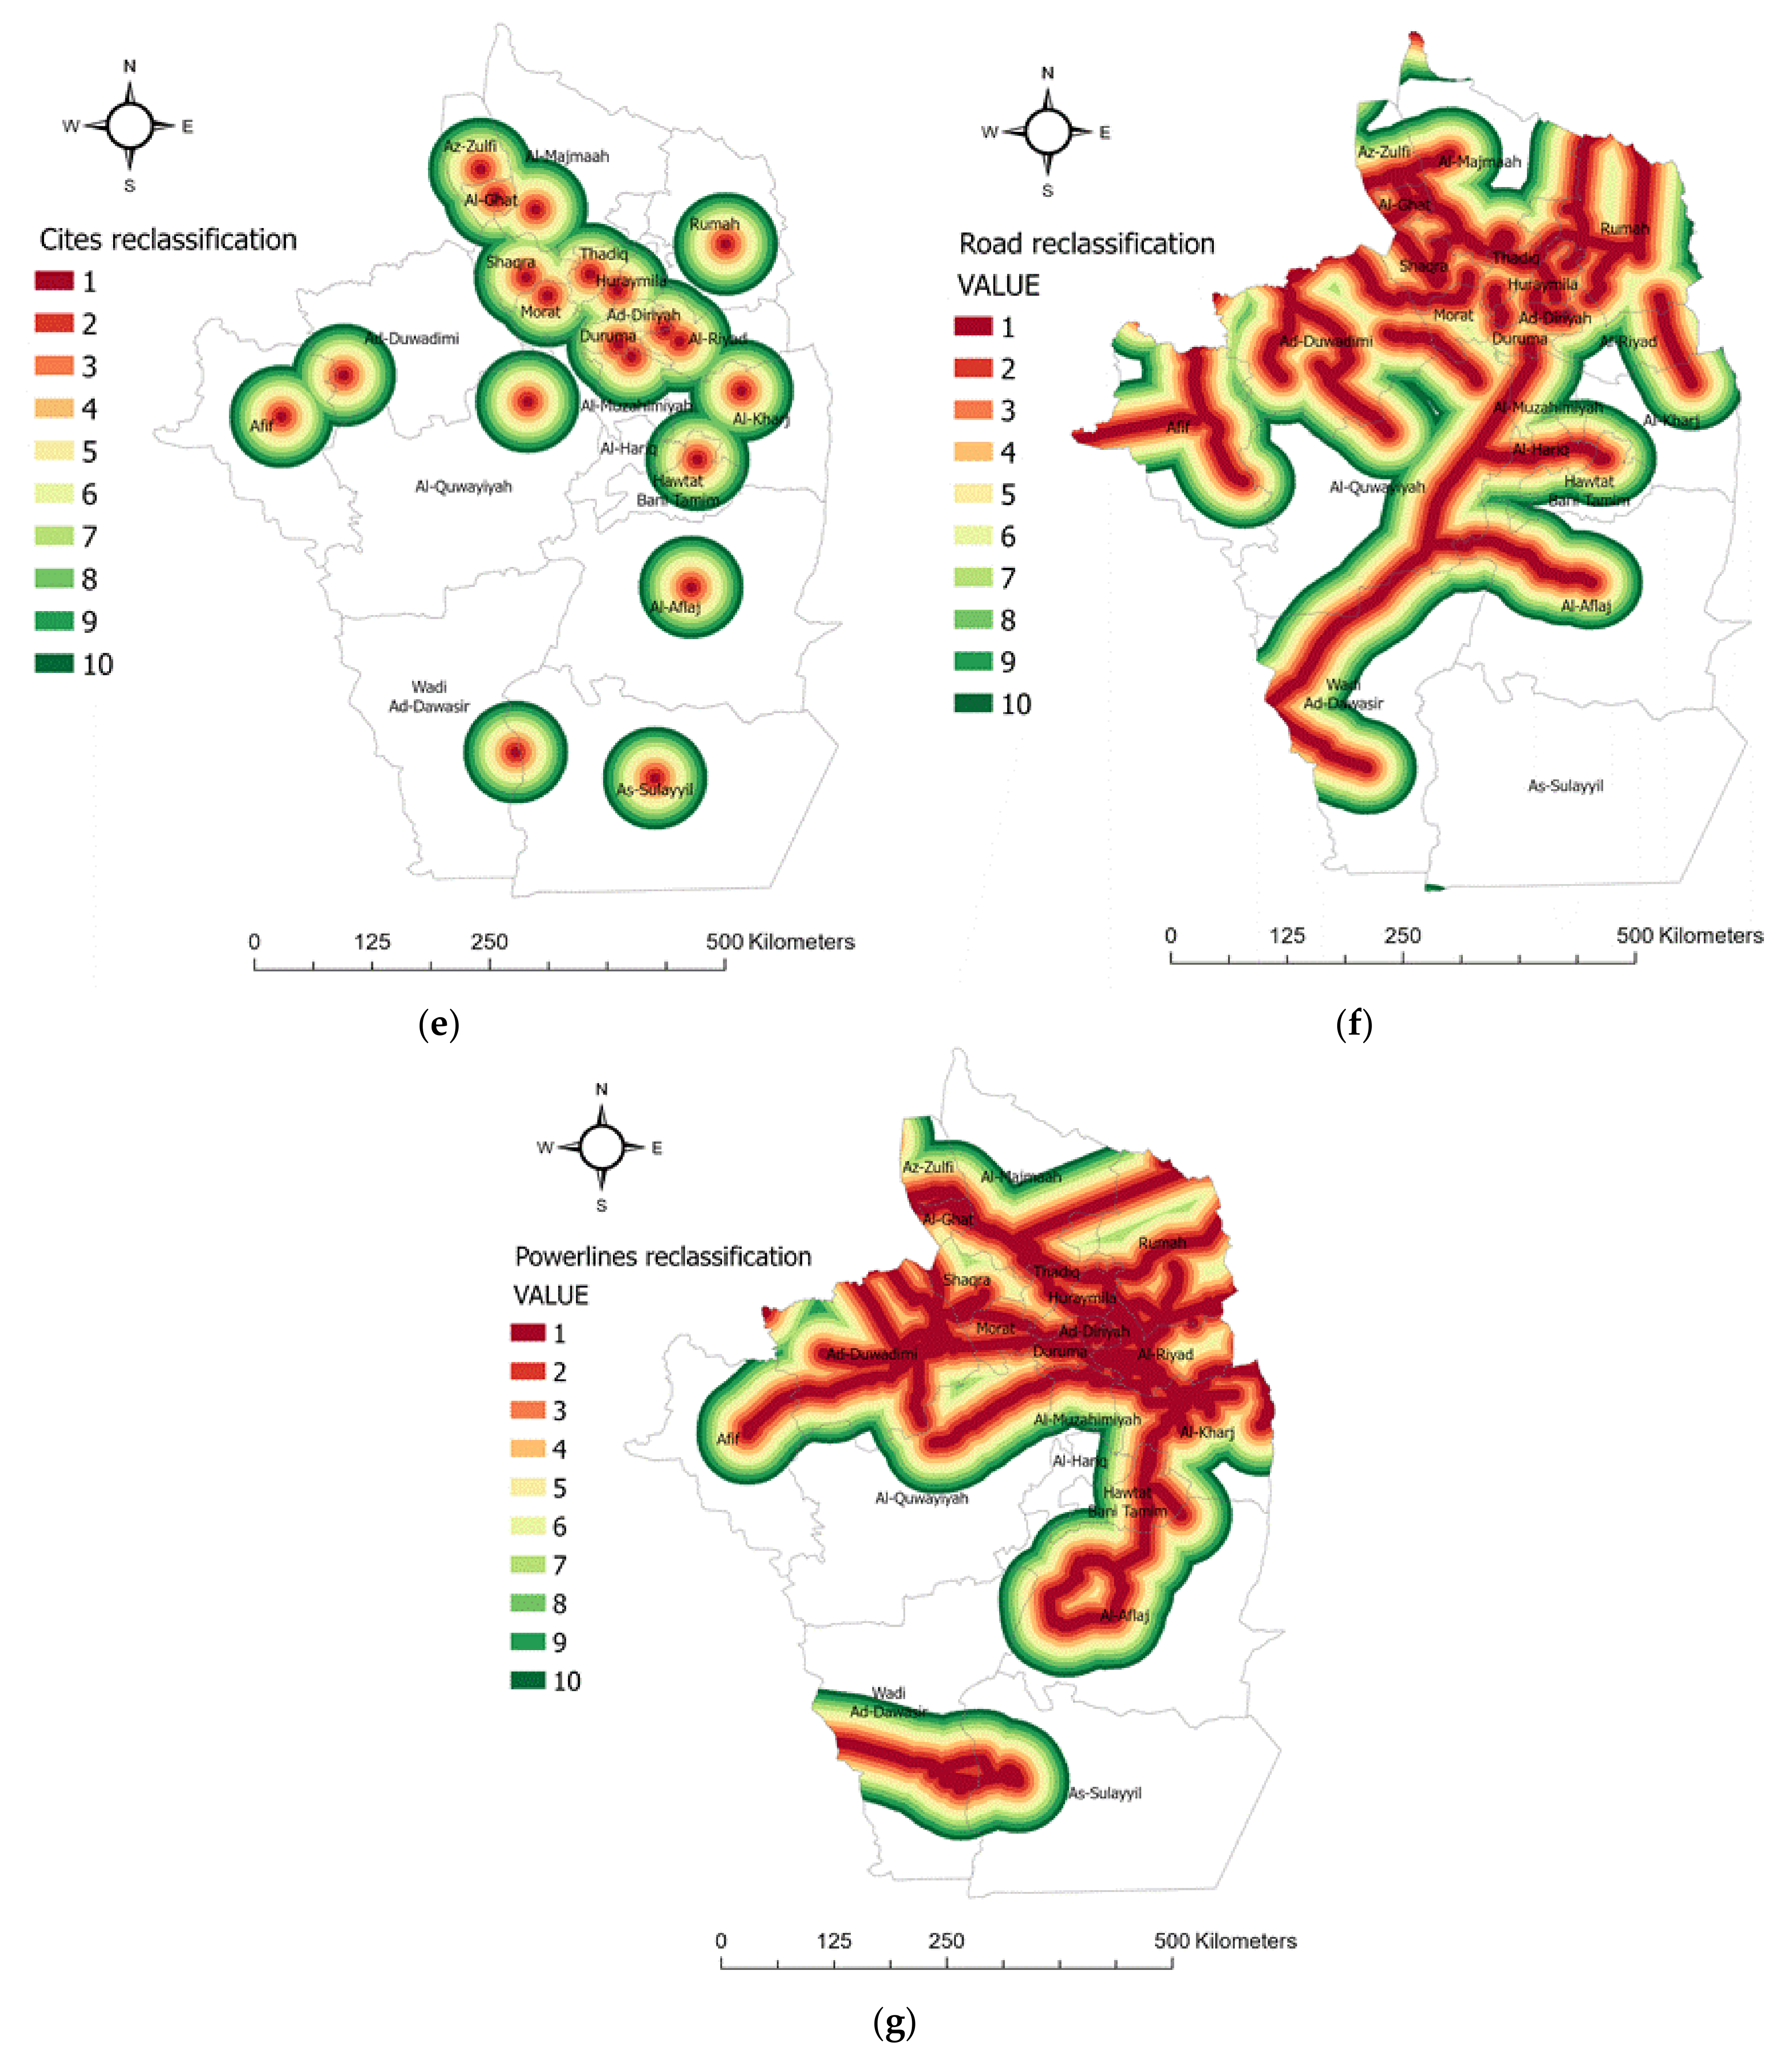
- Distance from building areas (C5), distance from main road (C6), and distance from electricity network (C7). Transportation cost is one of the dominant factors in energy production. Areas far from roads and electricity networks as well as building areas are not economically feasible and are unsuitable. Euclidean distance is the most commonly used method for creating rasters that have a distance value for each cell. The value represents the distance between the cell and vector-based data (roads, electricity network, and building areas) [9].
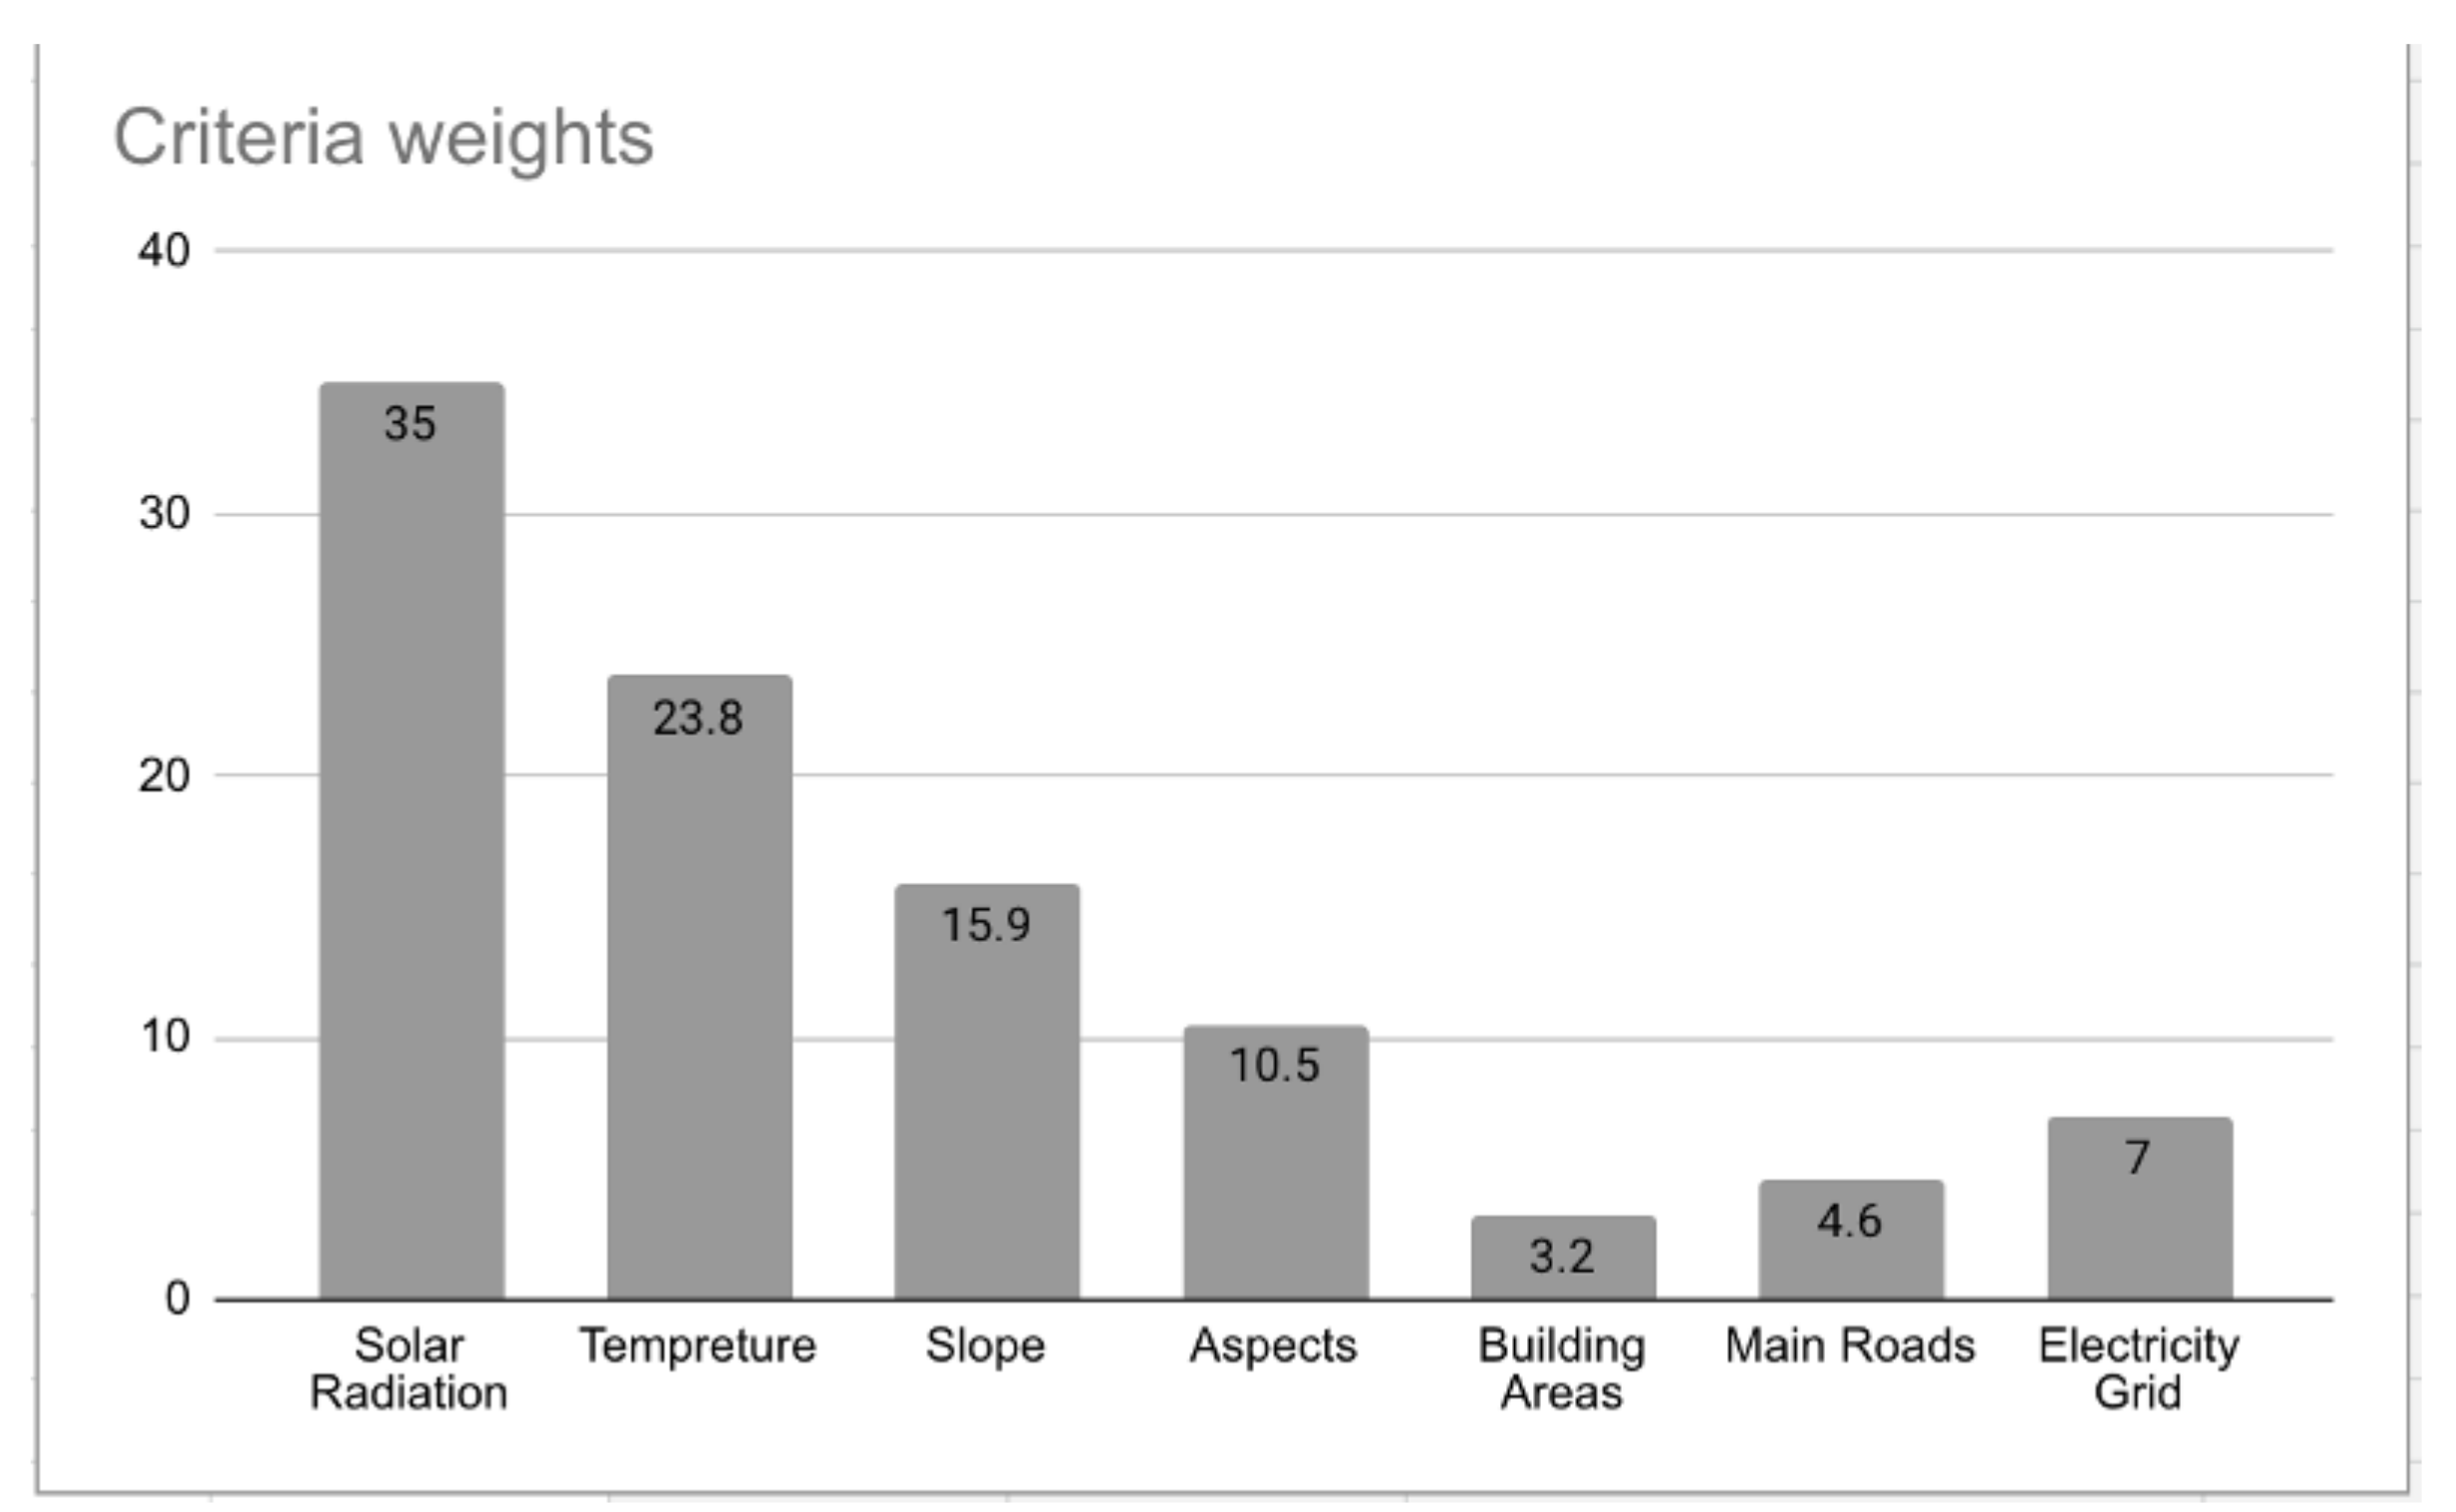
3.3.3. Spatial Decision Support System
- Sum all cells in the column.
- Divide each cell by the total of the column.
- Generate weights by calculating the average for each row.
- Multiply each value in each column in the comparison matrix as shown in Table 8 with the final generated weight of corresponding criteria resulting from step 3; this step will generate a matrix with calculation of the weighted columns.
- Sum the values in each row to generate another column with a value called the weighted sum.
- Divide the criteria’s weighted sum (obtained in the previous step) by the corresponding priority of each criterion and generate another column; the sum of this column represents a single value called
- Step 1:
- Calculate Each column sum of priority score as CS1, CS2 … CSn where n is a number of criteria.
- Step 2:
- Divide each priority score in a column by its CS and store value in
- Step 3:
- Calculate final weight by sum all for single row and then divide it by n then store in CW1, CW2, … CWn.
- Step 4:
- Calculate consistency index (C1)
- Step 5:
- Random consistency index n = 6, then RI = 1.24
- Step 6:
- Calculate the consistency ratio
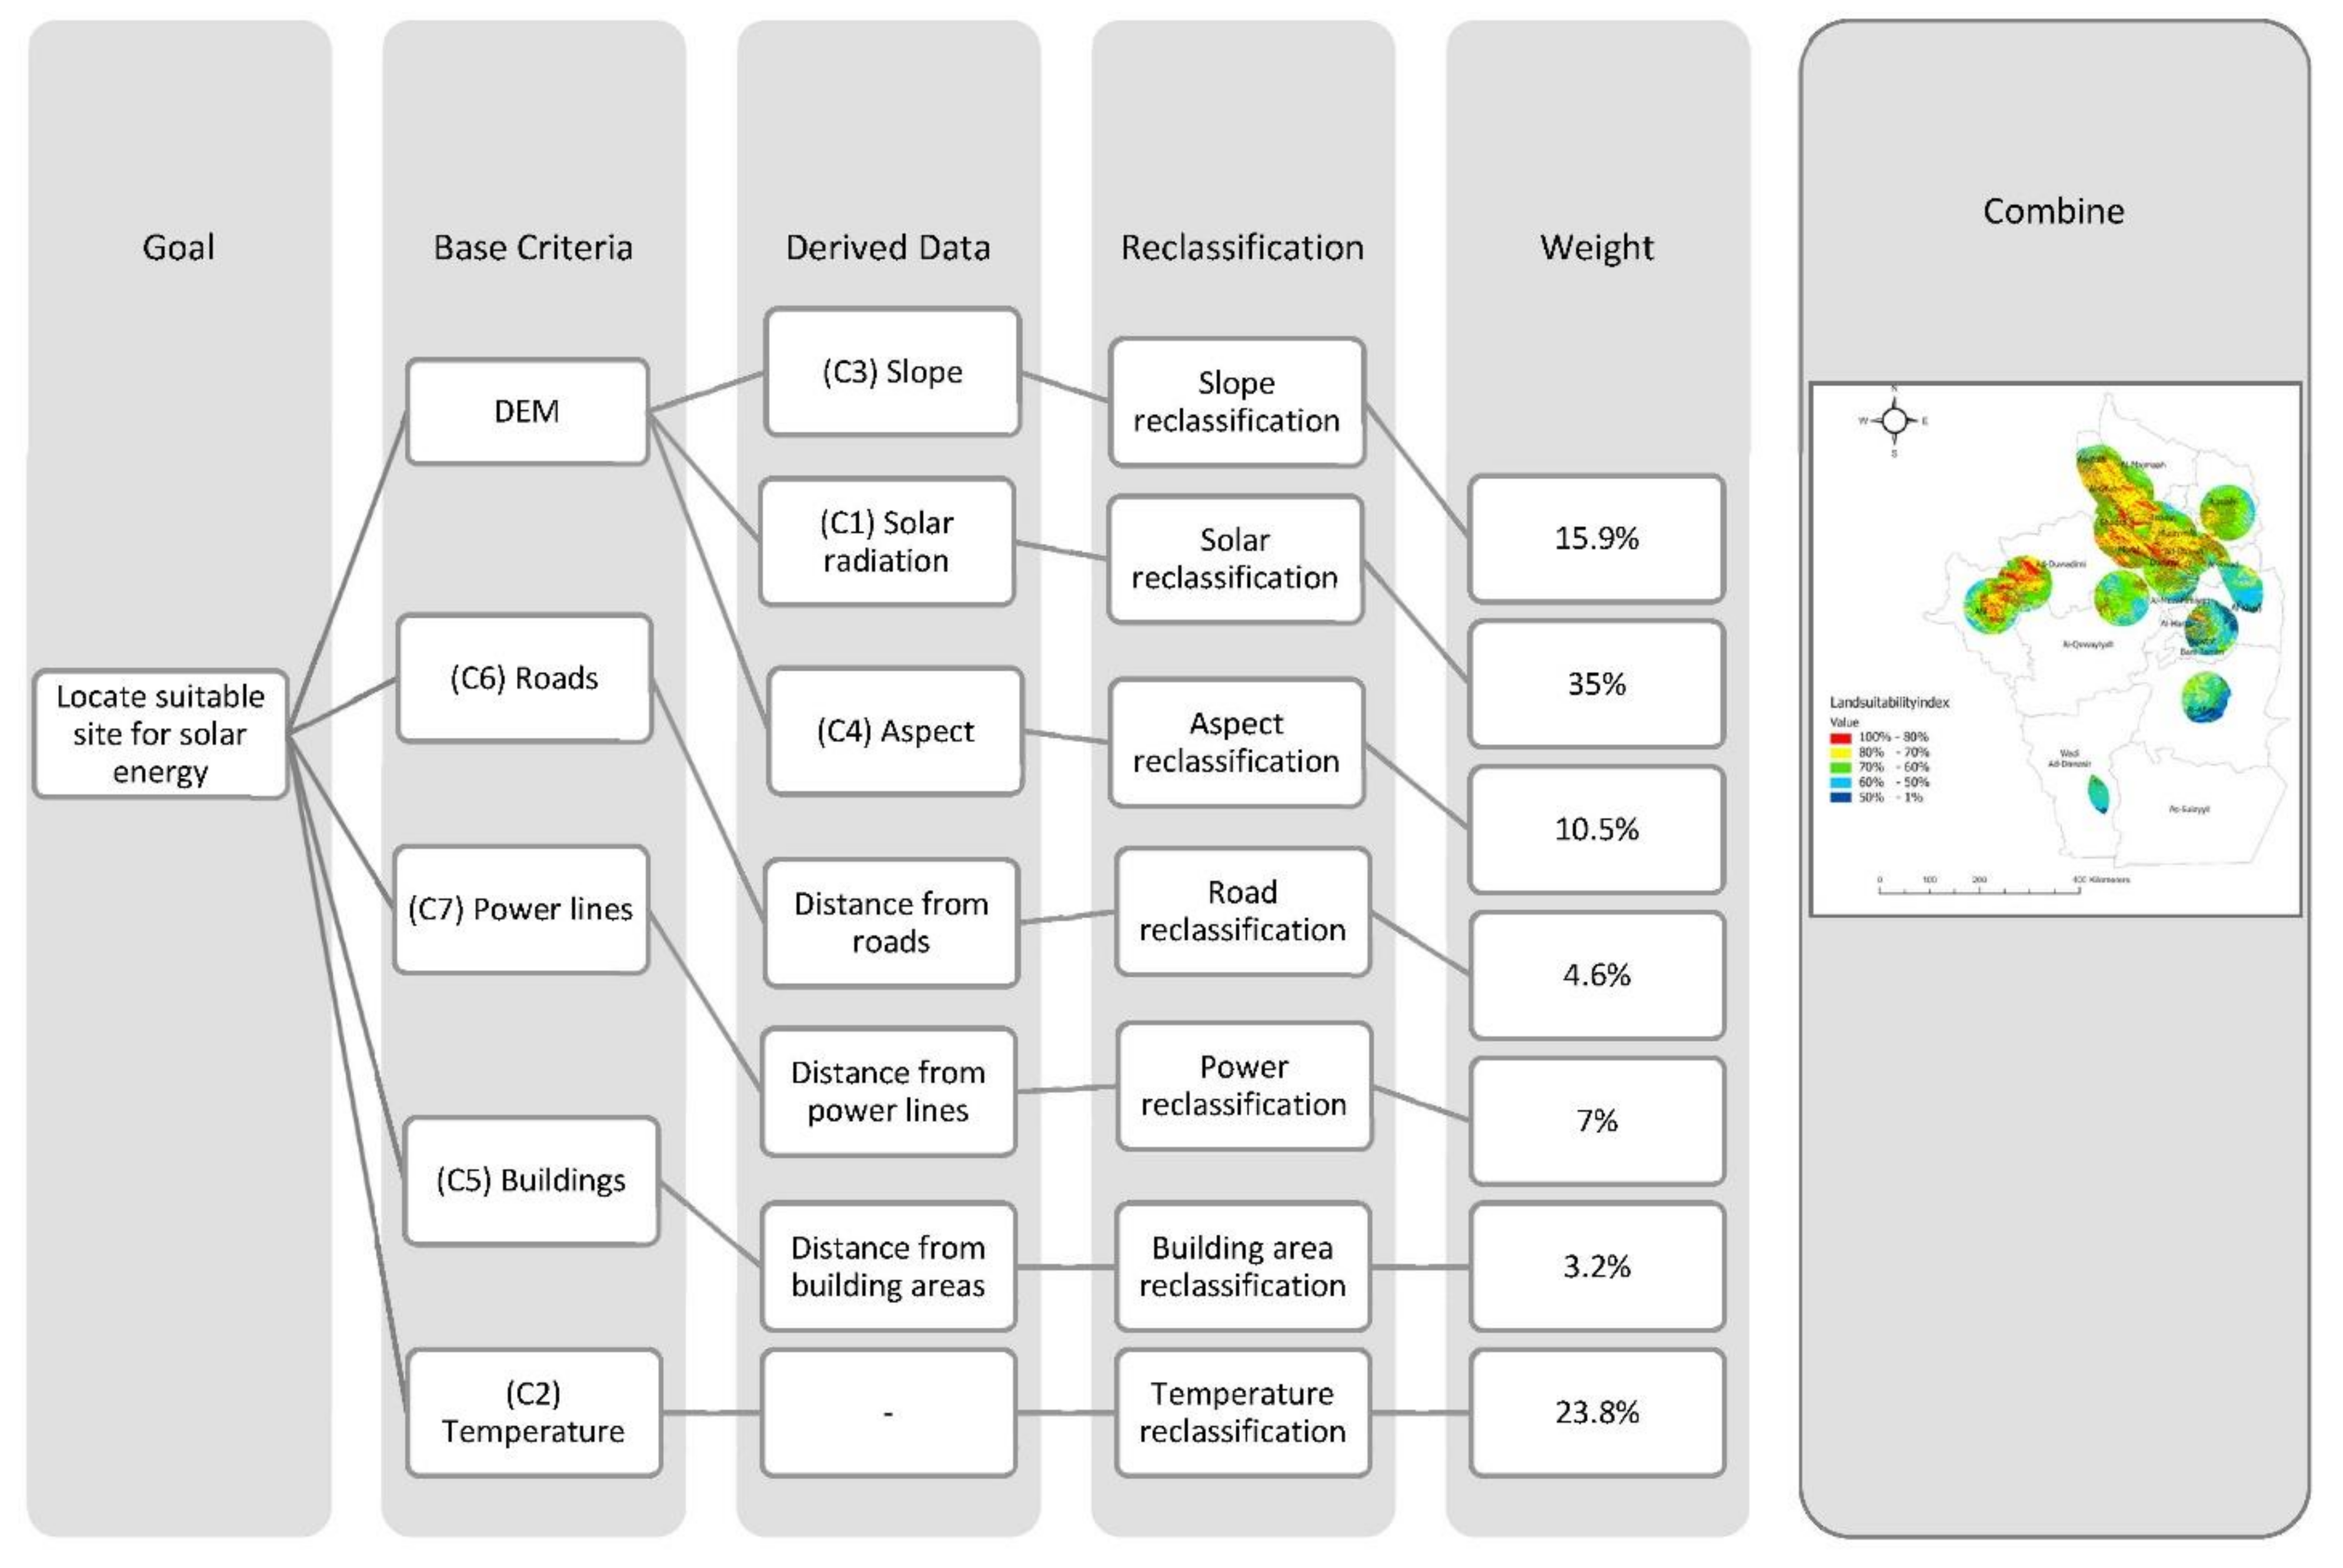
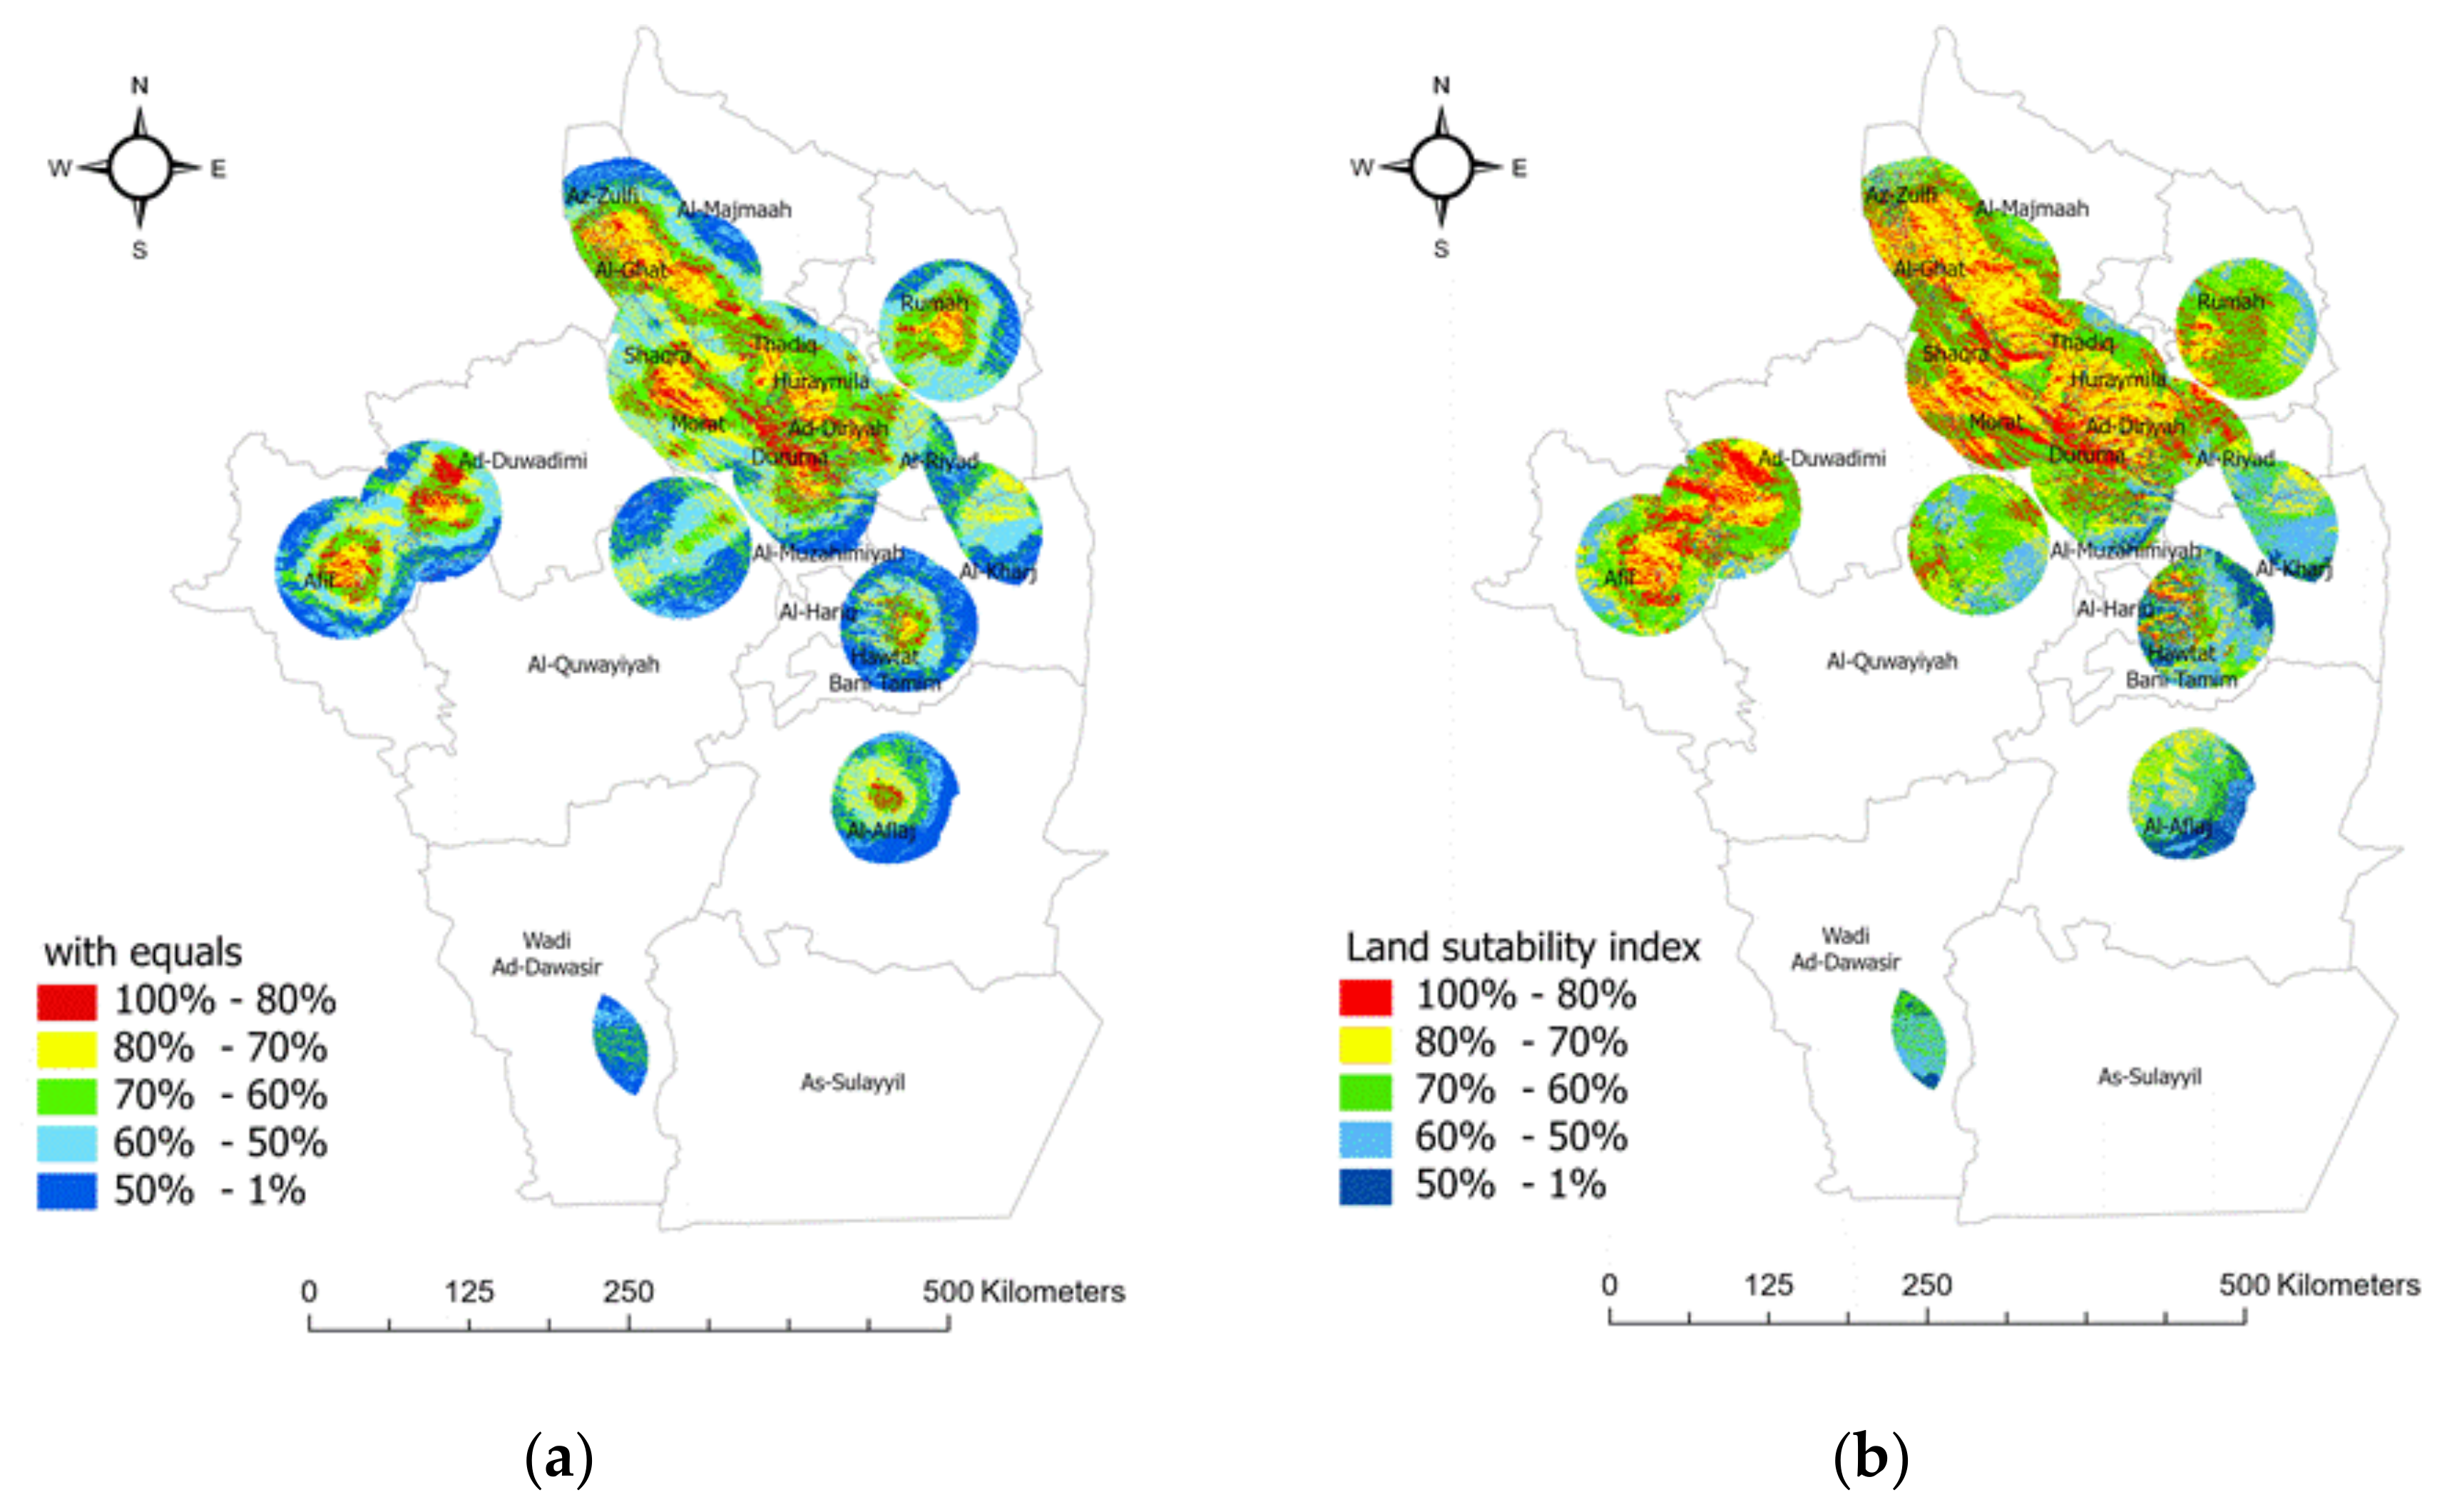
3.3.4. Visualization
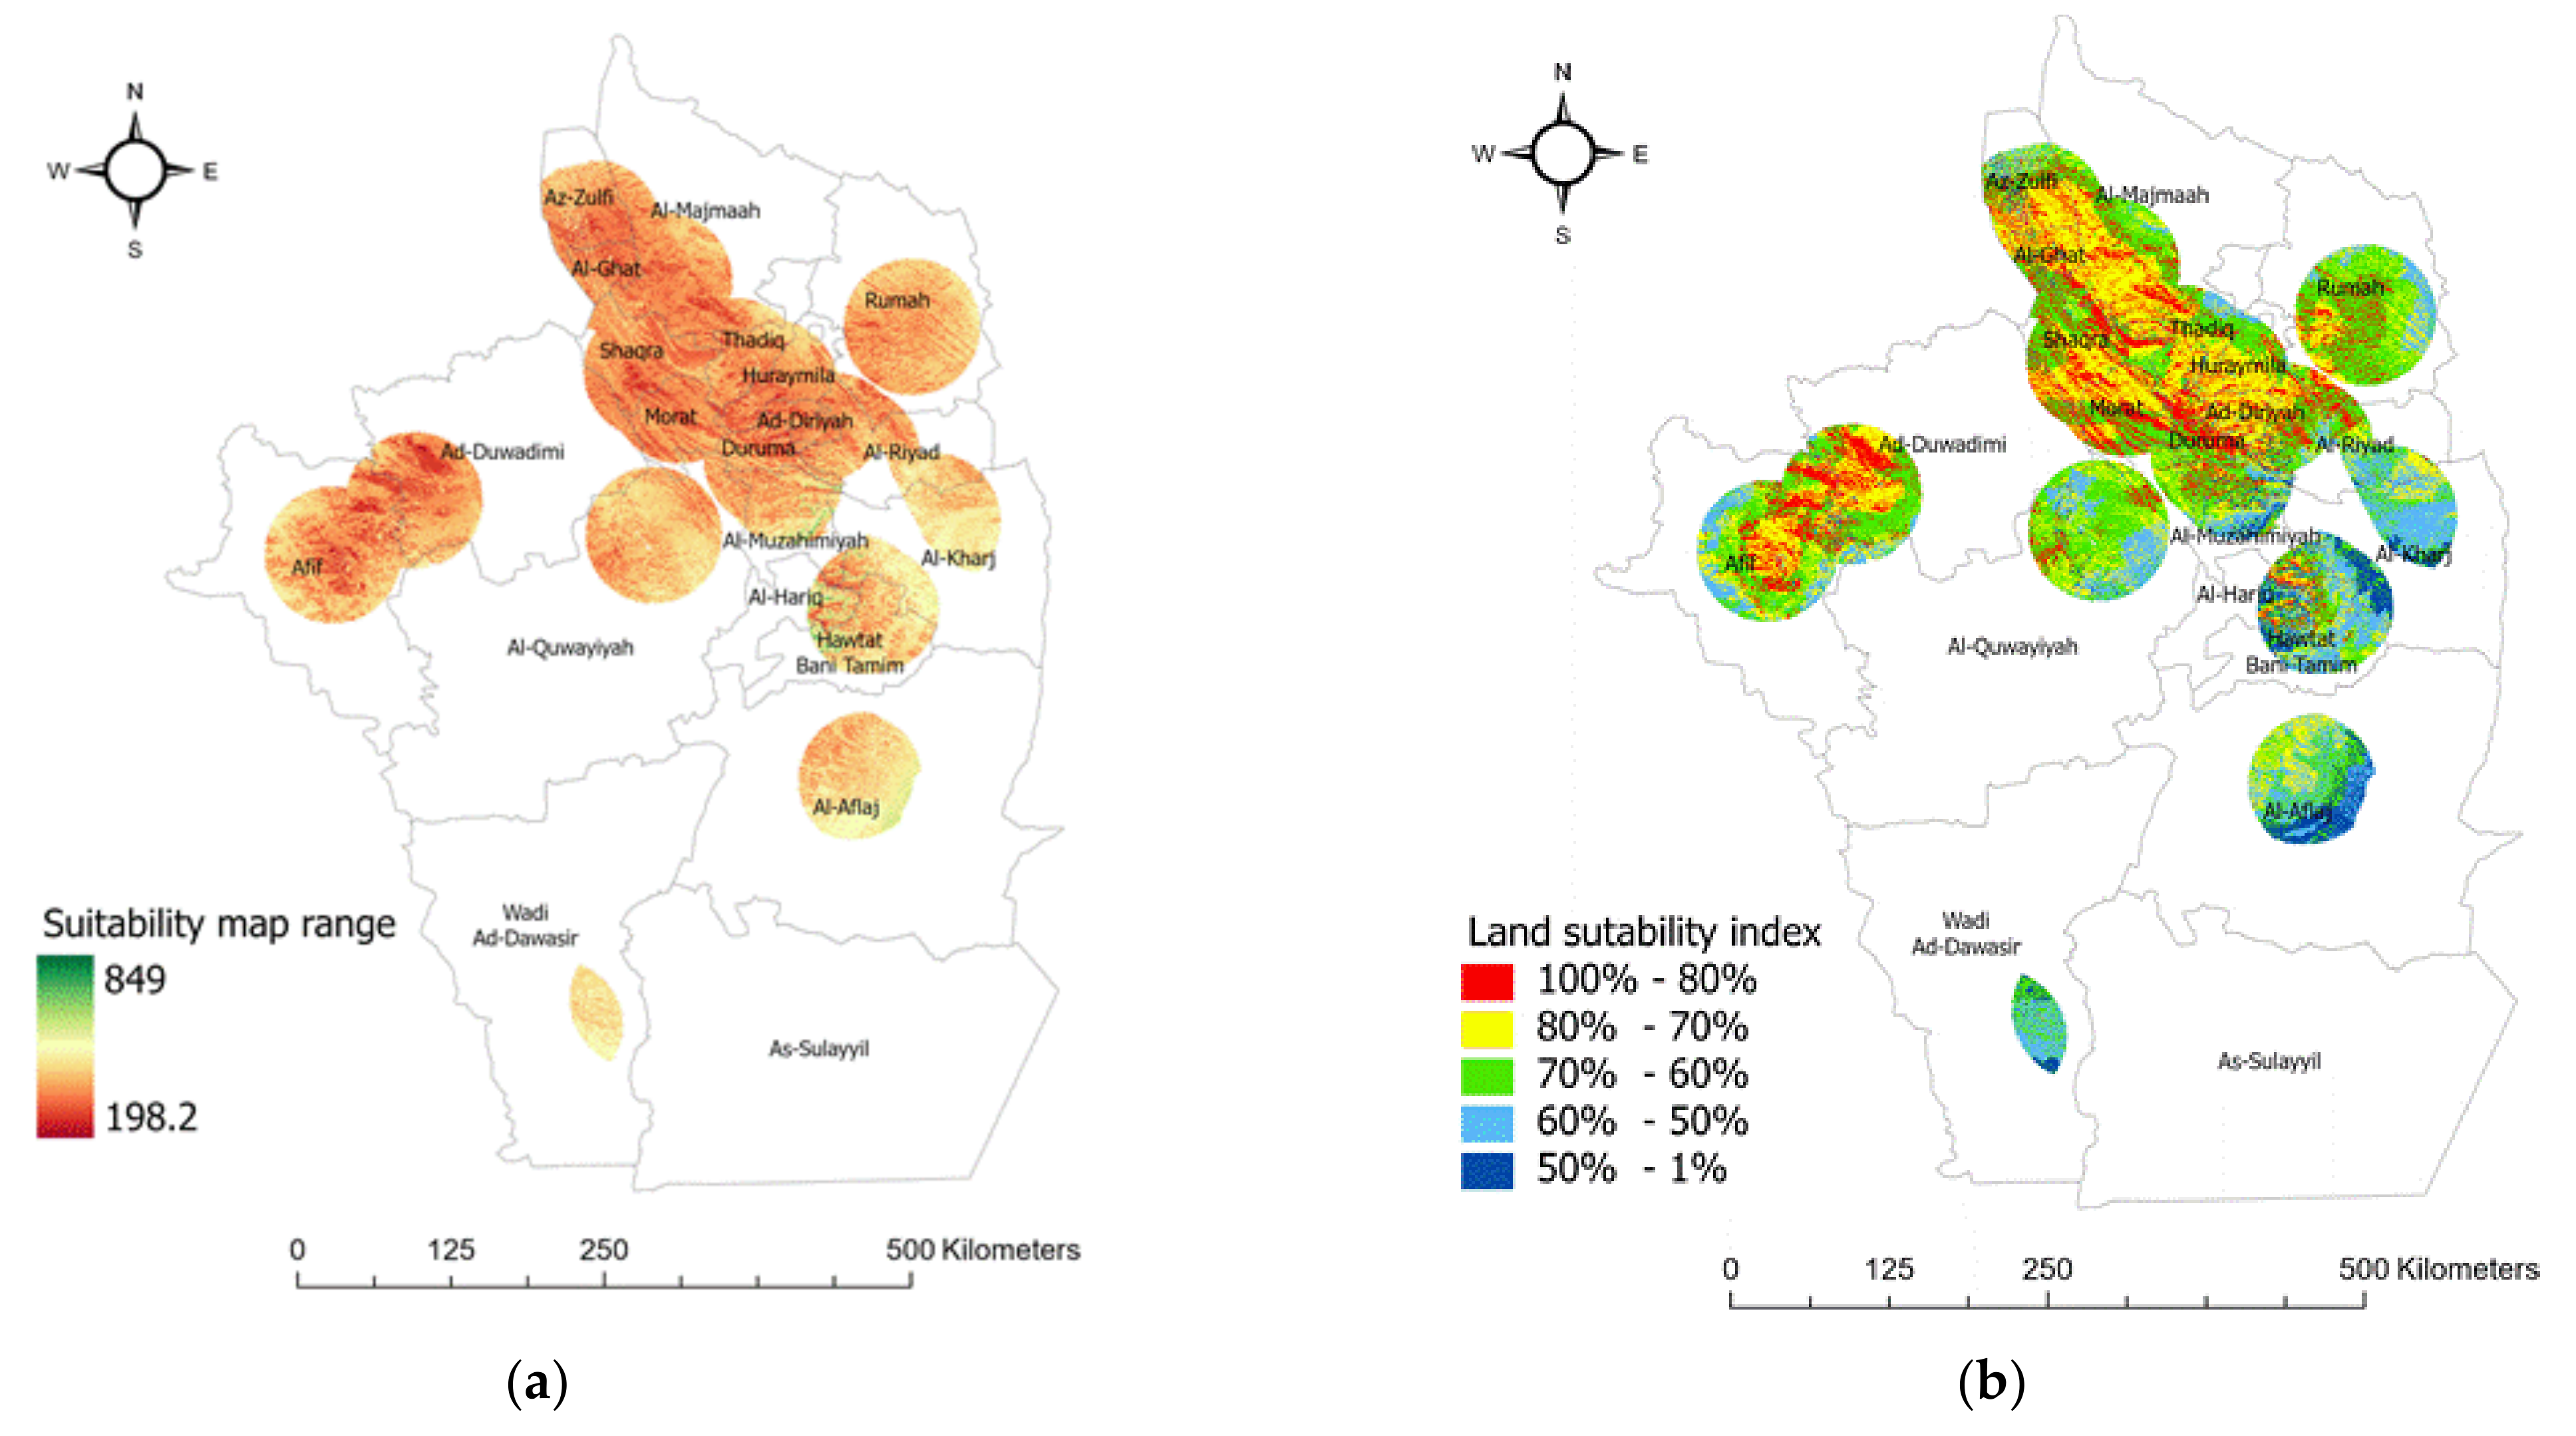
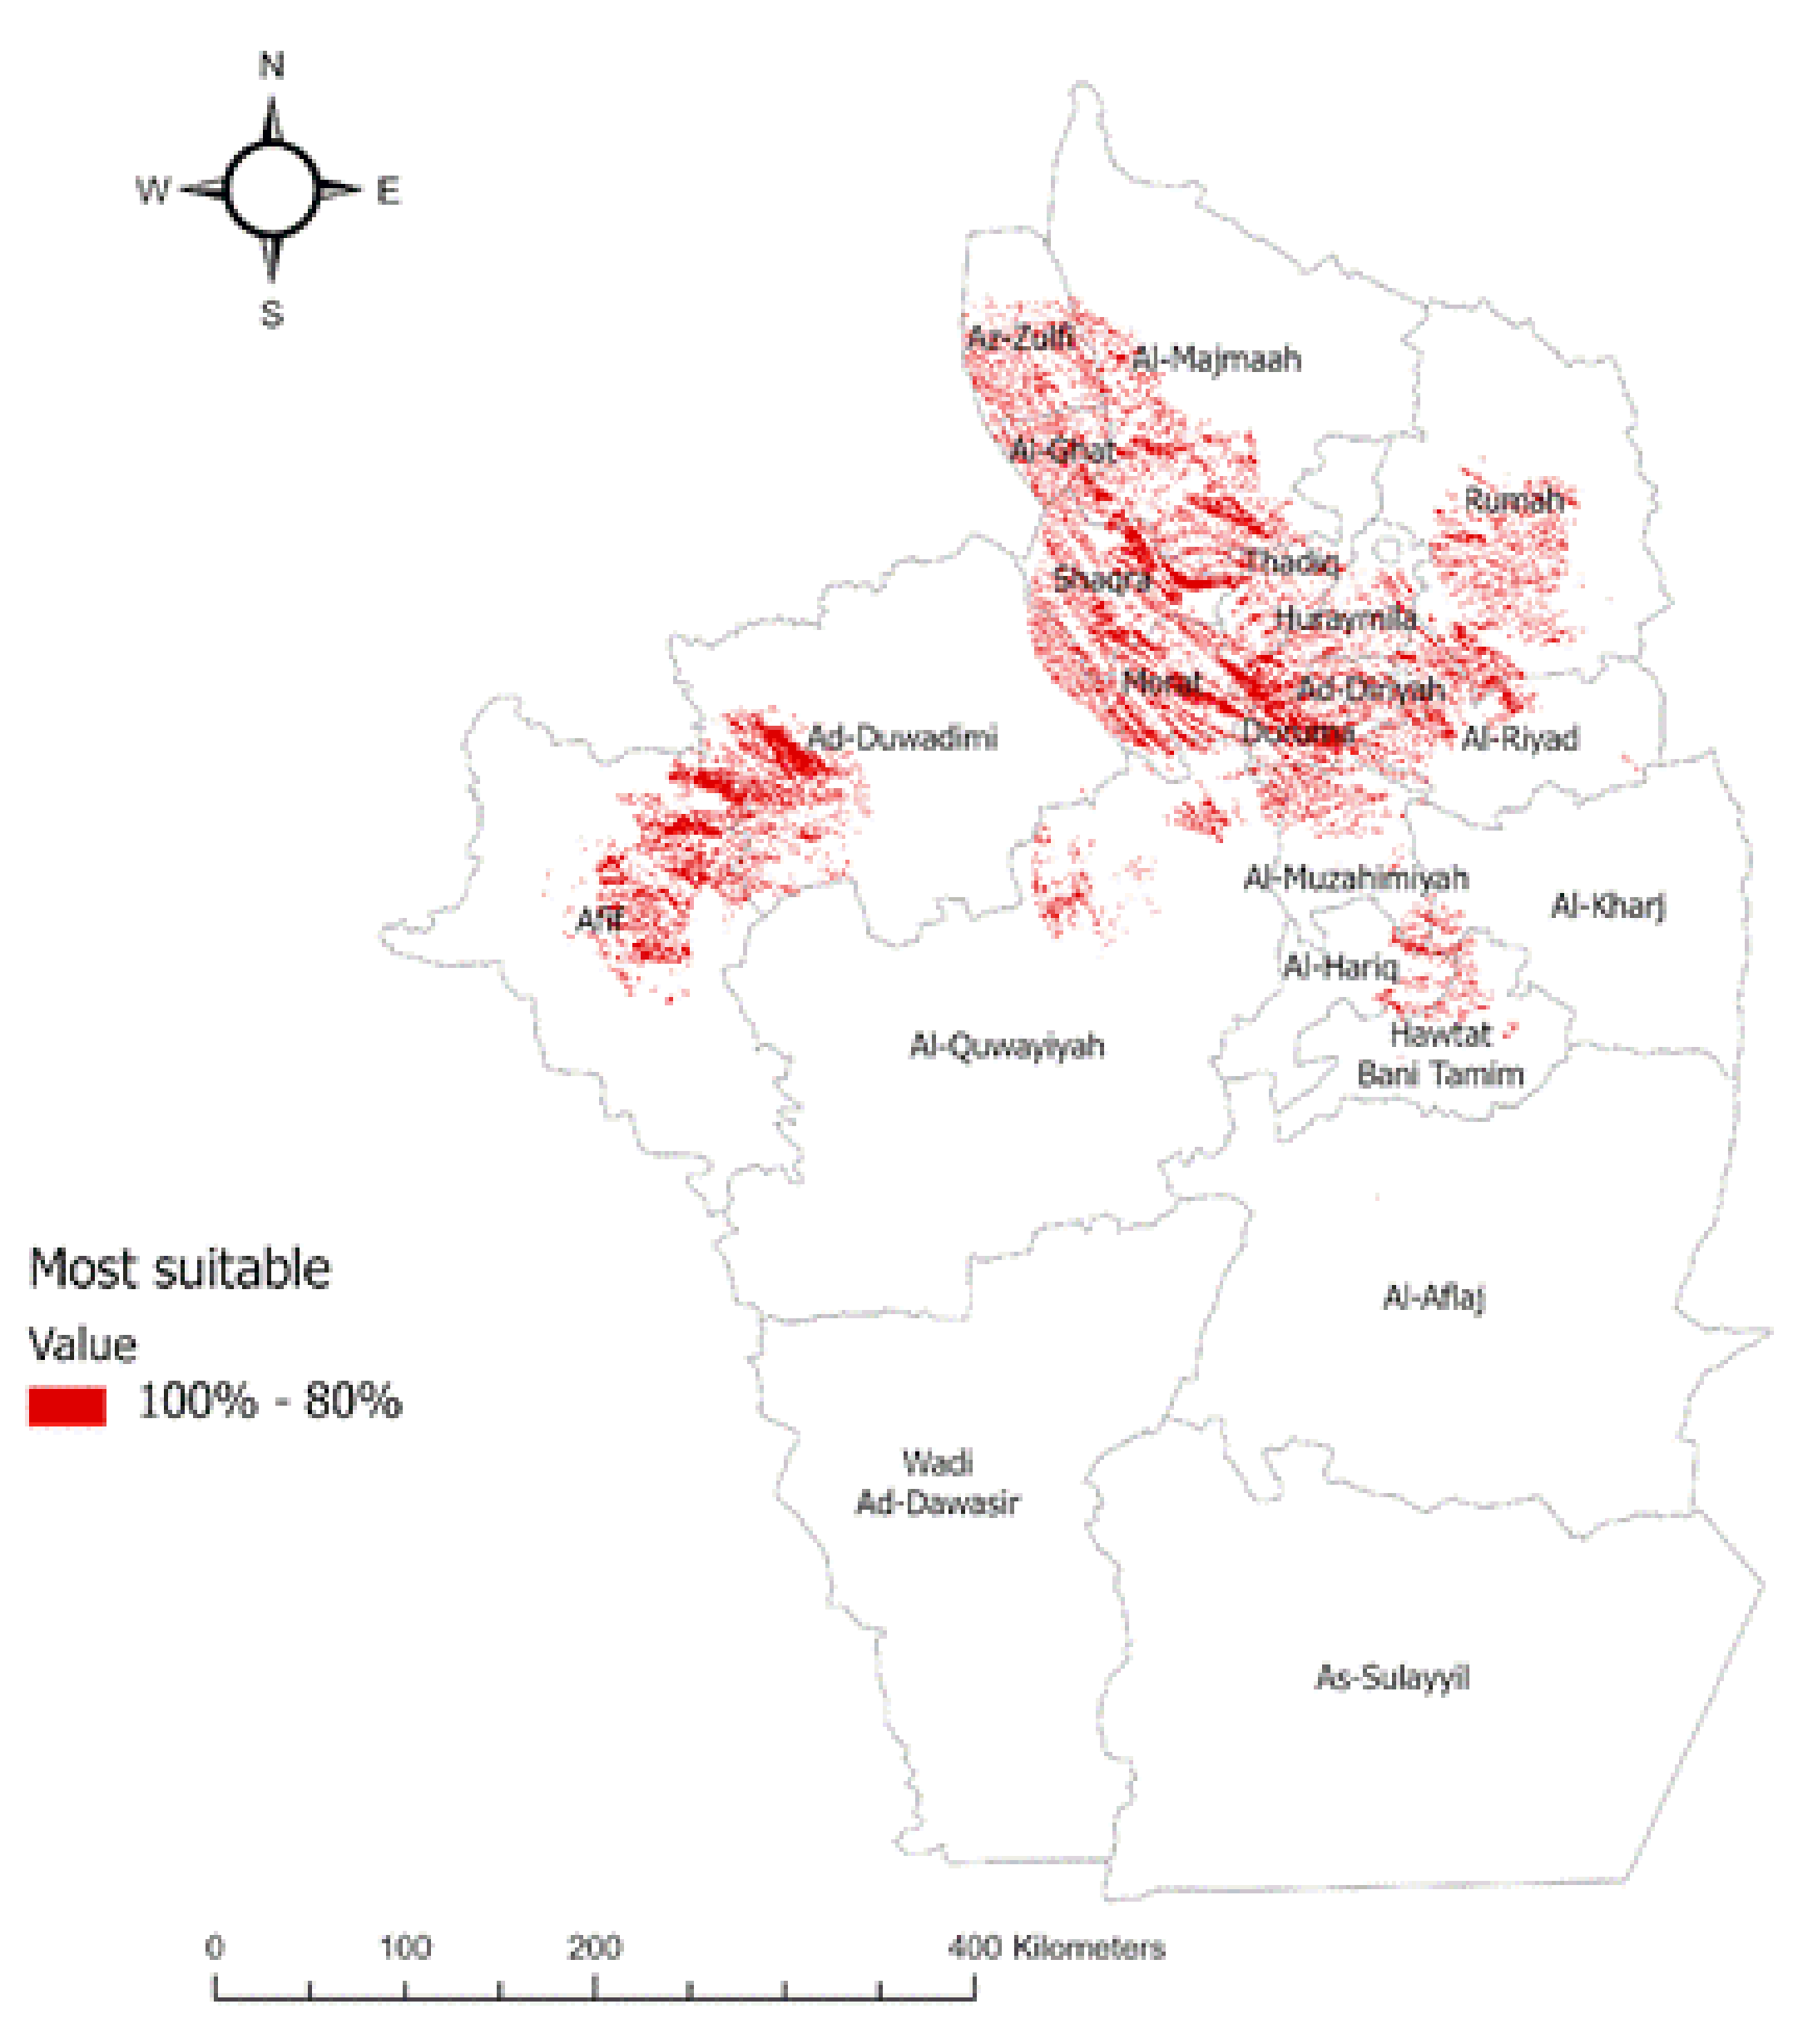
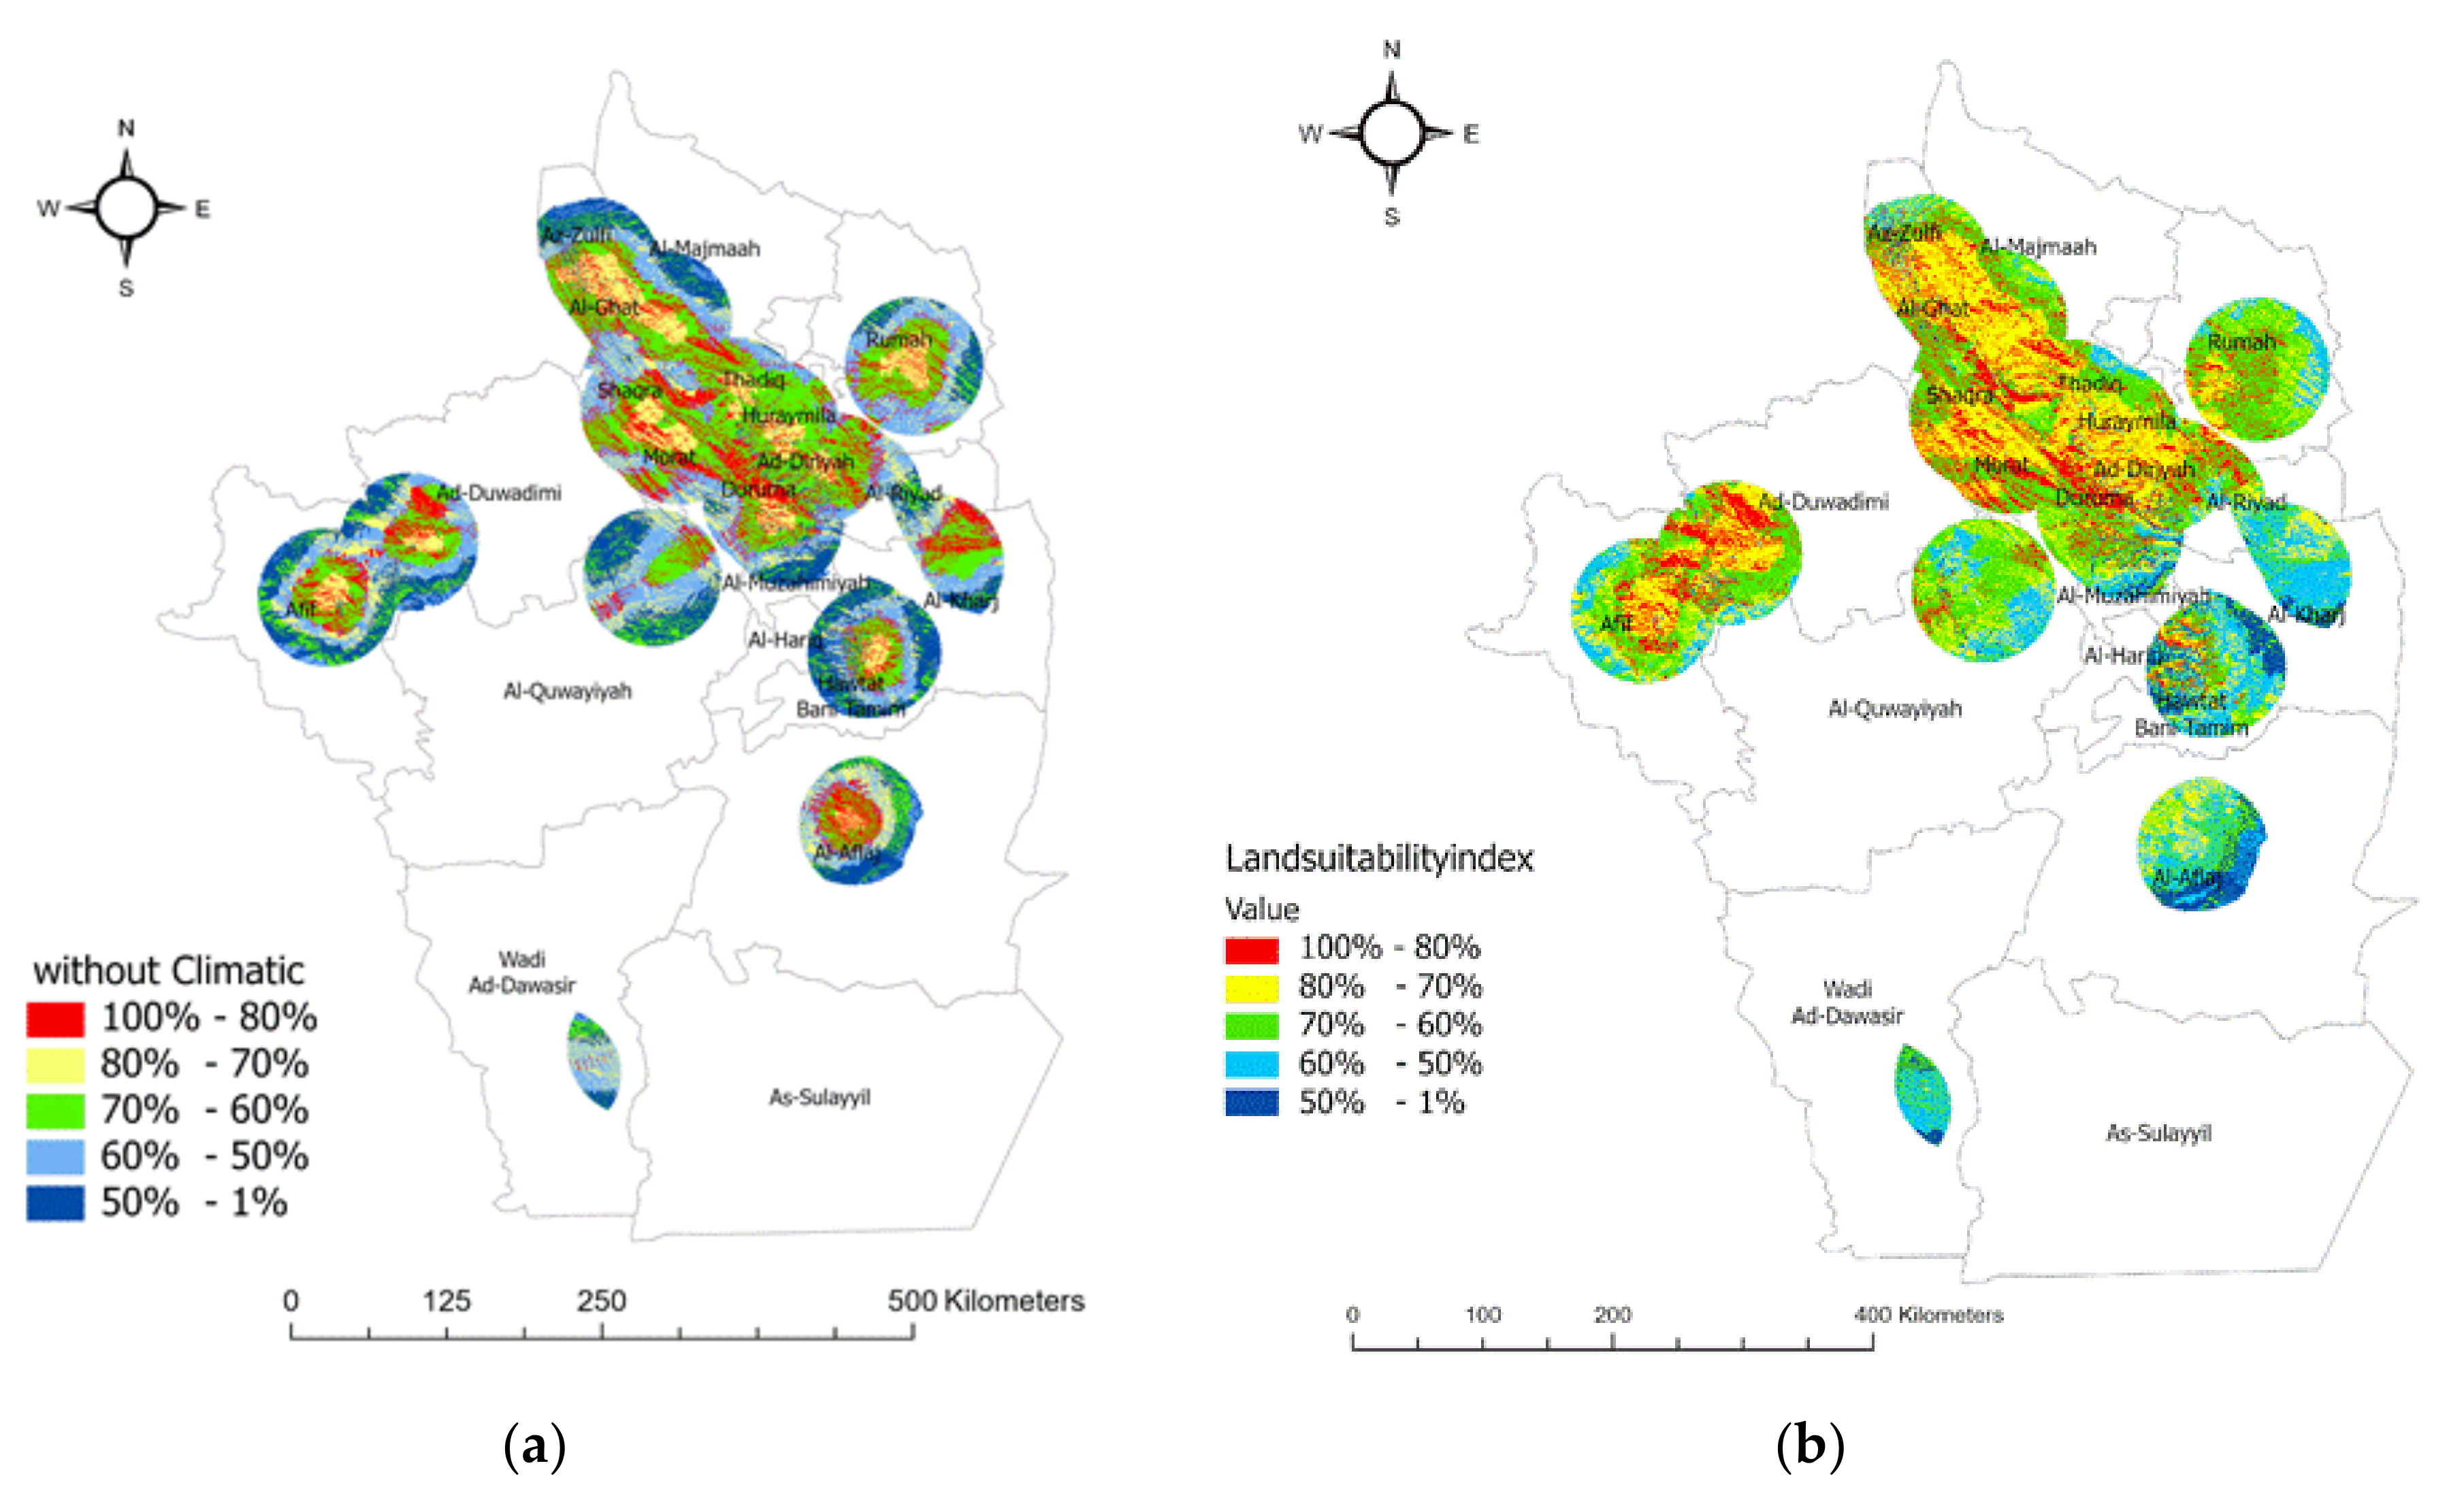
3.3.5. Solar Suitability Map
4. Results and Discussion
5. Conclusions
Author Contributions
Funding
Data Availability Statement
Acknowledgments
Conflicts of Interest
References
- Crabtree, G.W.; Lewis, N.S. Solar energy conversion. Phys. Today 2007, 60, 37–42. [Google Scholar] [CrossRef]
- Bruggink, J.; Van Der Zwaan, B. The role of nuclear energy in establishing sustainable energy paths. Int. J. Glob. Energy Issues 2002, 18, 151. [Google Scholar] [CrossRef]
- Elshurafa, A.M.; Muhsen, A.R. The Upper Limit of Distributed Solar PV Capacity in Riyadh: A GIS-Assisted Study. Sustainability 2019, 11, 4301. [Google Scholar] [CrossRef]
- Asif, M.; Hassanain, M.A.; Nahiduzzaman, K.M.; Sawalha, H. Techno-economic assessment of application of solar PV in building sector. Smart Sustain. Built Environ. 2019, 8, 34–52. [Google Scholar] [CrossRef]
- Effat, H.A. Mapping Solar Energy Potential Zones, using SRTM and Spatial Analysis, Application in Lake Nasser Region, Egypt. Int. J. Sustain. Land Use Urban Plan. 2016, 3. [Google Scholar] [CrossRef]
- Doorga, J.R.; Rughooputh, S.D.; Boojhawon, R. Multi-criteria GIS-based modelling technique for identifying potential solar farm sites: A case study in Mauritius. Renew. Energy 2019, 133, 1201–1219. [Google Scholar] [CrossRef]
- Nebey, A.H.; Taye, B.Z.; Workineh, T.G. Site Suitability Analysis of Solar PV Power Generation in South Gondar, Amhara Region. J. Energy 2020, 2020, 1–15. [Google Scholar] [CrossRef]
- Tisza, K. GIS-Based Suitability Modeling and Multi-Criteria Decision Analysis for Utility Scale Solar Plants in Four States in the Southeast US. Master’s Thesis, Clemson University, Clemson, SC, USA, 2014. [Google Scholar]
- Al Garni, H.Z.; Awasthi, A. Solar PV power plant site selection using a GIS-AHP based approach with application in Saudi Arabia. Appl. Energy 2017, 206, 1225–1240. [Google Scholar] [CrossRef]
- Al-Shammari, S.; Ko, W.; Al Ammar, E.A.; Alotaibi, M.A.; Choi, H.-J. Optimal Decision-Making in Photovoltaic System Selection in Saudi Arabia. Energies 2021, 14, 357. [Google Scholar] [CrossRef]
- Ibarra, M.; Gherboudj, I.; Al Rished, A.; Ghedira, H. Geospatial assessment of solar energy potential for utility scale parabolic trough collector power plant in Saudi Arabia. In SOLARPACES 2016: International Conference on Concentrating Solar Power and Chemical Energy Systems; AIP Publishing LLC.: Melville, NY, USA, 2017; Volume 1850, p. 160015. [Google Scholar] [CrossRef]
- Choi, Y.; Suh, J.; Kim, S.-M. GIS-Based Solar Radiation Mapping, Site Evaluation, and Potential Assessment: A Review. Appl. Sci. 2019, 9, 1960. [Google Scholar] [CrossRef]
- Li, D. Using GIS and Remote Sensing Techniques for Solar Panel Installation Site Selection. Master’s Thesis, University of Waterloo, Waterloo, ON, Canada, 2013. [Google Scholar]
- Ruiz, H.S.; Sunarso, A.; Ibrahim-bathis, K.; Murti, S.A.; Budiarto, I. GIS-AHP Multi-Decision-Criteria-Analysis for the Optimal Location of Solar Energy Plants at Indonesia. ArXiv Prepr. 2020, arXiv:200715351. [Google Scholar]
- Piirisaar, I. A Multi-Criteria GIS Analysis for Siting of Utility-Scale Photovoltaic Solar Plants in County Kilkenny, Ireland. Master’s Thesis, Geographical Information Science, Lund University, Lund, Sweden, 2019. [Google Scholar]
- Díaz-Cuevas, P.; Domínguez-Bravo, J.; Prieto-Campos, A. Integrating MCDM and GIS for renewable energy spatial models: Assessing the individual and combined potential for wind, solar and biomass energy in Southern Spain. Clean Technol. Environ. Policy 2019, 21, 1855–1869. [Google Scholar] [CrossRef]
- Noorollahi, E.; Fadai, D.; Shirazi, M.A.; Ghodsipour, S.H. Land Suitability Analysis for Solar Farms Exploitation Using GIS and Fuzzy Analytic Hierarchy Process (FAHP)—A Case Study of Iran. Energies 2016, 9, 643. [Google Scholar] [CrossRef]
- Abdelrazek, M. GIS Approach to Find Suitable Locations for Installing Renewable Energy Production Units in Sinai Peninsula. Egypt. Master’s Thesis, University of Salzburg, Salzburg, Austria, 2017; pp. 1–84. [Google Scholar]
- Senteles, A. GIS-Based Multicriteria Decision Analysis Approach on Wind Power Development: The Case Study of Nova Scotia, Canada. Master’s Thesis, Uppsala University, Uppsala, Sweden, 2018. [Google Scholar]
- Alyahya, S.; Irfan, M.A. Analysis from the new solar radiation Atlas for Saudi Arabia. Sol. Energy 2016, 130, 116–127. [Google Scholar] [CrossRef]
- Gašparović, I.; Gašparović, M. Determining Optimal Solar Power Plant Locations Based on Remote Sensing and GIS Methods: A Case Study from Croatia. Remote. Sens. 2019, 11, 1481. [Google Scholar] [CrossRef]
- Zeleny, M. Multiple Criteria Decision Making Kyoto 1975; Springer Science & Business Media: Berlin/Heidelberg, Germany, 2012; Volume 123. [Google Scholar]
- Siksnelyte-Butkiene, E.; Zavadskas, K.; Streimikiene, D. Multi-criteria decision-making (MCDM) for the assessment of renewable energy technologies in a household: A review. Energies 2020, 13, 1164. [Google Scholar] [CrossRef]
- Mahad, N.F.; Yusof, N.; Ismail, N.F. The application of fuzzy analytic hierarchy process (FAHP) approach to solve multi-criteria decision making (MCDM) problems. J. Phys. Conf. Ser. 2019, 1358, 012081. [Google Scholar] [CrossRef]
- Chan, H.K.; Sun, X.; Chung, S.-H. When should fuzzy analytic hierarchy process be used instead of analytic hierarchy process? Decis. Support Syst. 2019, 125, 113114. [Google Scholar] [CrossRef]
- ‘الهيئة العامة للإحصاء’, الهيئة العامة للإحصاء. Available online: https://www.stats.gov.sa/ar (accessed on 27 November 2020).
- KAPSARC | King Abdullah Petroleum Studies and Research Center | Home. KAPSARC. Available online: https://www.kapsarc.org/ (accessed on 21 April 2021).
- Almasoud, A.; Gandayh, H.M. Future of solar energy in Saudi Arabia. J. King Saud Univ. Eng. Sci. 2015, 27, 153–157. [Google Scholar] [CrossRef]
- ‘وزارة الطاقة’. Available online: https://www.moenergy.gov.sa/arabic/Pages/default.aspx (accessed on 9 April 2021).
- Al-Saleh, A.M. The Kirsh gneiss dome: An extensional metamorphic core complex from the SE Arabian Shield. Arab. J. Geosci. 2010, 5, 335–344. [Google Scholar] [CrossRef]
- ‘البوابة الجيومكانية’. Available online: https://geoportal.sa/ (accessed on 6 April 2021).
- National Renewable Energy Laboratory (NREL) Home Page. Available online: https://www.nrel.gov/index.html (accessed on 27 November 2020).
- ArcGIS Hub. Available online: https://hub.arcgis.com/datasets/c87aee58fb0940dc8539c60b179dee42 (accessed on 3 April 2021).
- De Smith, M.J.; Goodchild, M.F.; Longley, P. Geospatial Analysis A Comprehensive Guide to Principles Techniques and Software Tools, 6th ed.; Troubador Publishing Ltd.: Kibworth Harcourt, UK, 2018. [Google Scholar]
- Kulakowski, K. Understanding the Analytic Hierarchy Process; CRC Press: Boca Raton, FL, USA, 2020. [Google Scholar]
- Mishra, B.K.; Kumar, R. Big Data Management and the Internet of Things for Improved Health Systems; IGI Global: Raipur, India, 2018. [Google Scholar]
- Awan, A.B.; Zubair, M.; Abokhalil, A.G. Solar Energy Resource Analysis and Evaluation of Photovoltaic System Performance in Various Regions of Saudi Arabia. Sustainability 2018, 10, 1129. [Google Scholar] [CrossRef]
- Almarshoud, A. Performance of solar resources in Saudi Arabia. Renew. Sustain. Energy Rev. 2016, 66, 694–701. [Google Scholar] [CrossRef]
- Saiu, V. The Three Pitfalls of Sustainable City: A Conceptual Framework for Evaluating the Theory-Practice Gap. Sustainability 2017, 9, 2311. [Google Scholar] [CrossRef]
- Fang, H.; Li, J.; Song, W. Sustainable site selection for photovoltaic power plant: An integrated approach based on prospect theory. Energy Convers. Manag. 2018, 174, 755–768. [Google Scholar] [CrossRef]


| Method | Ref, Year | Study Area | Data | GIS Tool | Result | Validation Model |
|---|---|---|---|---|---|---|
| GIS-AHP | Ref. [9], 2017 | Saudi Arabia | Renewable Atlas, (K.A.CARE) | ArcGIS | Suitability map | Sensitivity analysis |
| Ref. [14], 2020 | Indonesia | One Map Kalbar, WebGIS DEN, IMEF WebGIS, PLN, (WBG) | ArcGIS | Suitability map | Sensitivity study | |
| Ref. [5], 2016 | Lake Nasser, Egypt | SRTM, Landsat ETM+, Egyptian General Survey Authority | ArcGIS | Suitability index | Model validation | |
| Ref. [6], 2019 | Mauritius | Government agency | ArcMap | Suitability map | Sensitivity analysis | |
| Ref. [7], 2020 | Amhara | NASA | ArcGIS | Suitability map | Sensitivity analysis | |
| Ref. [13], 2013 | Waterloo | GRCA, Regional Municipality, Municipal Data, DMTI, MNR | ArcGIS | Determined potential sites for solar power production | On-site feasibility assessment | |
| Ref. [15], 2019 | Kilkenny, Ireland | Irish National Grid | ArcGIS | Suitability map | Sensitivity analysis | |
| TOPSIS | Ref. [8], 2014 | Southeast US | National Renewable Energy Laboratory (NREL) | ArcGIS | Three suitability maps | Sensitivity |
| AHP- TOPSIS | Ref. [10], 2021 | Saudi Arabia | K.A. CARE, Alaska Satellite facilities, KAPSARK | PVGIS | Suitability map | None |
| Ref. [16], 2013 | Southeast Spain | Government | gvSIG | Suitability map | Sensitivity study | |
| AHP Fuzzy | Ref. [17], 2016 | Iran | National Oceanic and Atmospheric Administration (NOAA) | ArcGIS | Suitability map | No |
| Weighted Linear Combination (WLC) | Ref. [19], 2018 | Nova Scotia, Canada | NS Gov, OpenStreetMap, Open Government | ArcGIS | Suitability map for wind | Sensitivity analysis |
| Ref. [11] | Saudi Arabia | WBD, Arabia Renewable Resource Atlas | WebGIS | Suitability map | None | |
| Ref. [18], 2017 | Sinai, Egypt | Global Solar Atlas, SRTM, FAO, Egyptian Survey Authority, WDPA, | ArcGIS | Suitability map | Sensitivity analysis |
| Methods | Strengths | Weaknesses |
|---|---|---|
| Analytic Hierarchy Process (AHP) | -Computational simplicity -Method adaptability and applicability -Evaluates qualitative and quantitative criteria and alternatives on a similar preference scale -Intuitive method of problem solving -Hierarchical structure offers excellent focus on each criterion used in the calculation | -Results are affected by interdependence between objectives and criteria -Model complexity increases when more decision makers are involved -Additional analysis is required to verify the results |
| Weighted Linear Combination (WLC) | -Very simple computation process -Suitable for managing single-dimension problems | -It does not integrate multiple preferences -Only one dimension-Issues with weight allocation for objective functions -Does not achieve optimal solutions in non-convex problems |
| Technique for Order of Preference by Similarity to Ideal Solution (TOPSIS) | -Works with a fundamental ranking -Uses all allocated information -Interdependency of attribute preferences is not required -Rational and comprehensible logic -Simple mathematical form | -Based on Euclidean distance; negative and positive values do not influence calculations -A strong deviation of one indicator from the ideal solution strongly influences the results -The method is only suitable when the indicators of alternatives do not vary very strongly -All attribute values must be numeric |
| Fuzzy Analytic Hierarchy Process (FAHP) | -Takes into consideration the vagueness, imprecision, and uncertainty associated with the process | -Affected by stakeholder preferences |
| Criteria | Description |
|---|---|
| Solar radiation | The most crucial factor in finding the most suitable locations for solar power plants. These locations should receive sufficient sunlight throughout the year [18]. |
| Temperature | PV performance can be affected by the increasing temperature of PV cells. The best value of temperature in solar energy production is lower than 25 °C. Every increase of 1 °C will lead to a decrease in the power output (PV) of 0.4–0.5% [13]. |
| Distance from roads | Proximity to roads reduces the cost of constructing and maintaining the infrastructure of a solar energy project [13]. |
| Distance from power lines | Proximity of solar projects to an electricity network infrastructure is preferable to connect supply with demand [13]. |
| Distance from building areas | Close proximity to the city is preferable to support buildings with energy and decrease economic effects [9]. |
| Elevation | The elevation of a geographic location is its height above or below a fixed reference point, such as Earth’s sea level. Higher elevation shows a greater result in receiving solar radiation compared with lower elevation [13]. |
| Slope | The gradient of the land will affect the reception of solar radiation; with flatter land, more radiation will be received [7]. |
| Aspect (orientation) | A critical topographical factor that plays a considerable role in land suitability for PV system location, where south-facing is the best for PVs [10]. |
| No. | Constraint |
|---|---|
| 1 | Based on the NREL report, areas with less than 3.56 kWh/m2 solar irradiance per day were considered as unsuitable in this study because it is not economically feasible [7]. |
| 2 | Areas with a slope of more than 5° were excluded in order to avoid the shadow effect on the generation of the PV system [10]. |
| 3 | Maximum distance of 50 km from roads to obtain an optimum location of the PV system [9]. |
| 4 | Areas at a distance of more than 50 km from the electricity grid were excluded to obtain an optimum location of the PV system [9]. |
| 5 | Areas at a distance of more than 50 km from building areas were excluded to obtain an optimum location of the PV system [10]. |
| 6 | 500-meter buffer to roads [9]. |
| 7 | Excluded non-south-facing aspects in order to avoid the shadow effect on the generation of the PV system [10]. |
| Dataset | Resolution | Source | Format |
|---|---|---|---|
| Temperature | 800 m | 2019 The World Bank, Source: Global Solar Atlas 2.0, Solar resource data: SolarGIS. | Raster |
| Elevation (DEM) | 90 m | Saudi Geological Survey www.gasgi.gov.sa (accessed on 22 March 2021) | Raster |
| Distance from power lines | 500 m | OpenStreetMap https://data.nextgis.com/en/region/SA/ (accessed on 22 March 2021) | Vector |
| Distance from roads network | 500 m | Saudi Geological Survey www.gasgi.gov.sa (accessed on 22 March 2021) | Vector |
| Distance from building areas | 500 m | Mapcruzin https://mapcruzin.com/free-saudi-arabia-country-city-place-gis-shapefiles.htm (accessed on 22 March 2021) | Vector |
| Parameters | Value | Parameters | Value |
|---|---|---|---|
| DEM | 90 resolution | Diffuse Model Type | Uniform_sky |
| Time configuration | Whole year 2020 | Diffuse Proportion | 0.36 |
| Z unit | 1 | Transmissivity | 0.65 |
| Verbal Judgements of Preferences | Numerical Rating |
|---|---|
| Ci is equally important to Cj | 1 |
| Ci is slightly more important than Cj | 3 |
| Ci is strongly more important than Cj | 5 |
| Ci is very strongly more important than Cj | 7 |
| Ci is extremely more important than Cj | 9 |
| Intermediate values | 2,4,6,8 |
| Criteria | C1 | C2 | C3 | C4 | C5 | C6 | C7 |
|---|---|---|---|---|---|---|---|
| C1 | 1 | 2 | 3 | 4 | 7 | 6 | 5 |
| C2 | 1/2 | 1 | 2 | 3 | 6 | 5 | 4 |
| C3 | 1/3 | 1/2 | 1 | 2 | 5 | 4 | 3 |
| C4 | 1/4 | 1/3 | 1/2 | 1 | 4 | 3 | 2 |
| C5 | 1/7 | 1/6 | 1/5 | 1/4 | 1 | 1/2 | 1/3 |
| C6 | 1/6 | 1/5 | 1/4 | 1/3 | 2 | 1 | 1/2 |
| C7 | 1/5 | 1/4 | 1/3 | 1/2 | 3 | 2 | 1 |
| Number of Criteria | 4 | 5 | 6 | 7 |
|---|---|---|---|---|
| RI | 0.9 | 1.12 | 1.24 | 1.32 |
| ID | Name | C1 (kWh/m2/Year) | C1 (kWh/m2/Day) | C2 (°C) | C3 (°) | C4 | C5 | C6 | C7 |
|---|---|---|---|---|---|---|---|---|---|
| 100 | Riyadh | 2559.5 | 7.1 | 26.6 | Under 5° | South | 50 km2 | 500 m2 | 1000 m2 |
| 101 | Diriyah | 2587.4 | 7.2 | 25.9 | Under 5° | South | 50 km2 | 500 m2 | 1000 m2 |
| 102 | Al Kharj | 2542.3 | 7.1 | 27.1 | Under 5° | South | 50 km2 | 500 m2 | 1000 m2 |
| 103 | Dawadmi | 2612.4 | 7.3 | 25.9 | Under 5° | South | 50 km2 | 500 m2 | 1000 m2 |
| 104 | Al Majma’ah | 2561.9 | 7.1 | 25.6 | Under 5° | South | 50 km2 | 500 m2 | 1000 m2 |
| 105 | Al-Quwai’yah | 2608.9 | 7.2 | 26.7 | Under 5° | South | 50 km2 | 500 m2 | 1000 m2 |
| 106 | Wadi ad-Dawasir | 2603.4 | 7.2 | 27.3 | Under 5° | South | 50 km2 | 500 m2 | 1000 m2 |
| 107 | Al-Aflaj | 2554.1 | 7.1 | 27.4 | Under 5° | South | 50 km2 | 500 m2 | 1000 m2 |
| 108 | Zulfi | 2563.9 | 7.1 | 25.5 | Under 5° | South | 50 km2 | 500 m2 | 1000 m2 |
| 109 | Shaqra | 2584.2 | 7.2 | 26. | Under 5° | South | 50 km2 | 500 m2 | 1000 m2 |
| 110 | Huta Bani Tamim | 2563.7 | 7.1 | 26.9 | Under 5° | South | 50 km2 | 500 m2 | 1000 m2 |
| 111 | Afif | 2631.7 | 7.3 | 26.3 | Under 5° | South | 50 km2 | 500 m2 | 1000 m2 |
| 112 | As Sulayyil | 2556.3 | 7.1 | 27.9 | Under 5° | South | 50 km2 | 500 m2 | 1000 m2 |
| 113 | Durrma | 2583.4 | 7.2 | 26.2 | Under 5° | South | 50 km2 | 500 m2 | 1000 m2 |
| 114 | Muzahmiyah | 2586.3 | 7.2 | 26.4 | Under 5° | South | 50 km2 | 500 m2 | 1000 m2 |
| 115 | Rumah | 2550.7 | 7.1 | 26 | Under 5° | South | 50 km2 | 500 m2 | 1000 m2 |
| 116 | Thadiq | 2571.2 | 7.1 | 26.1 | Under 5° | South | 50 km2 | 500 m2 | 1000 m2 |
| 117 | Huryimla | 2577.5 | 7.2 | 26 | Under 5° | South | 50 km2 | 500 m2 | 1000 m2 |
| 118 | Hariq | 2579.9 | 7.2 | 26.9 | Under 5° | South | 50 km2 | 500 m2 | 1000 m2 |
| 119 | Ghat | 2576.1 | 7.2 | 25.9 | Under 5° | South | 50 km2 | 500 m2 | 1000 m2 |
| 120 | Murat | 2584.9 | 7.2 | 26.1 | Under 5° | South | 50 km2 | 500 m2 | 1000 m2 |
| Suitability Rate | Land Suitability Index | Area (km2) |
|---|---|---|
| 80–100% | 1 (198–328) Most suitable | 16,748 |
| 70–80% | 2 (328–393) Highly suitable | 27,393 |
| 60–70% | 3 (393–458) Moderately suitable | 35,222 |
| 50–60% | 4 (458–523) Marginally suitable | 17,529 |
| 1–50% | 5 (523–849) Least suitable | 5228 |
| Cities | Area (Km2) | % | Scoring |
|---|---|---|---|
| Afif | 2178 | 13.01230732 | 1 |
| Dawadmi | 1933 | 11.54857211 | 2 |
| Al Majma’ah | 1895 | 11.32154379 | 3 |
| Shaqra | 1638 | 9.786115426 | 4 |
| Rumah | 1473 | 8.800334568 | 5 |
| Murat | 1325 | 7.916119011 | 6 |
| Zulfi | 860 | 5.13800932 | 7 |
| Durrma | 860 | 5.13800932 | 8 |
| Huryimla | 786 | 4.695901541 | 9 |
| Riyadh | 760 | 4.540566376 | 10 |
| Al-Quwai’yah | 696 | 4.158202892 | 11 |
| Muzahmiyah | 517 | 3.088780022 | 12 |
| Ghat | 511 | 3.052933445 | 13 |
| Thadiq | 500 | 2.987214721 | 14 |
| Diriyah | 343 | 2.049229299 | 15 |
| Huta Bani Tamim | 185 | 1.105269447 | 16 |
| Hariq | 174 | 1.039550723 | 17 |
| Al Kharj | 104 | 0.621340662 | 18 |
| ALL | 16,738 | 100% |
| Suitability Rate | Land Suitability Index | Area (km2) |
|---|---|---|
| 80–100% | 1 (171–311) Most suitable | 9352 |
| 70–80% | 2 (311–381) Highly suitable | 17,889 |
| 60–70% | 3 (381–451) Moderately suitable | 24,633 |
| 50–60% | 4 (451–521) Marginally suitable | 25,386 |
| 1–50% | 5 (521–871) Least suitable | 24,854 |
| Suitability Rate | Land Suitability Index | Area (km2) |
|---|---|---|
| 80–100% | 1 (100–276) Most suitable | 16,737 |
| 70–80% | 2 (276–364) Highly suitable | 16,148 |
| 60–70% | 3 (364–452) Moderately suitable | 25,975 |
| 50–60% | 4 (452–540) Marginally suitable | 24,051 |
| 1–50% | 5 (540–981) Least suitable | 19,215 |
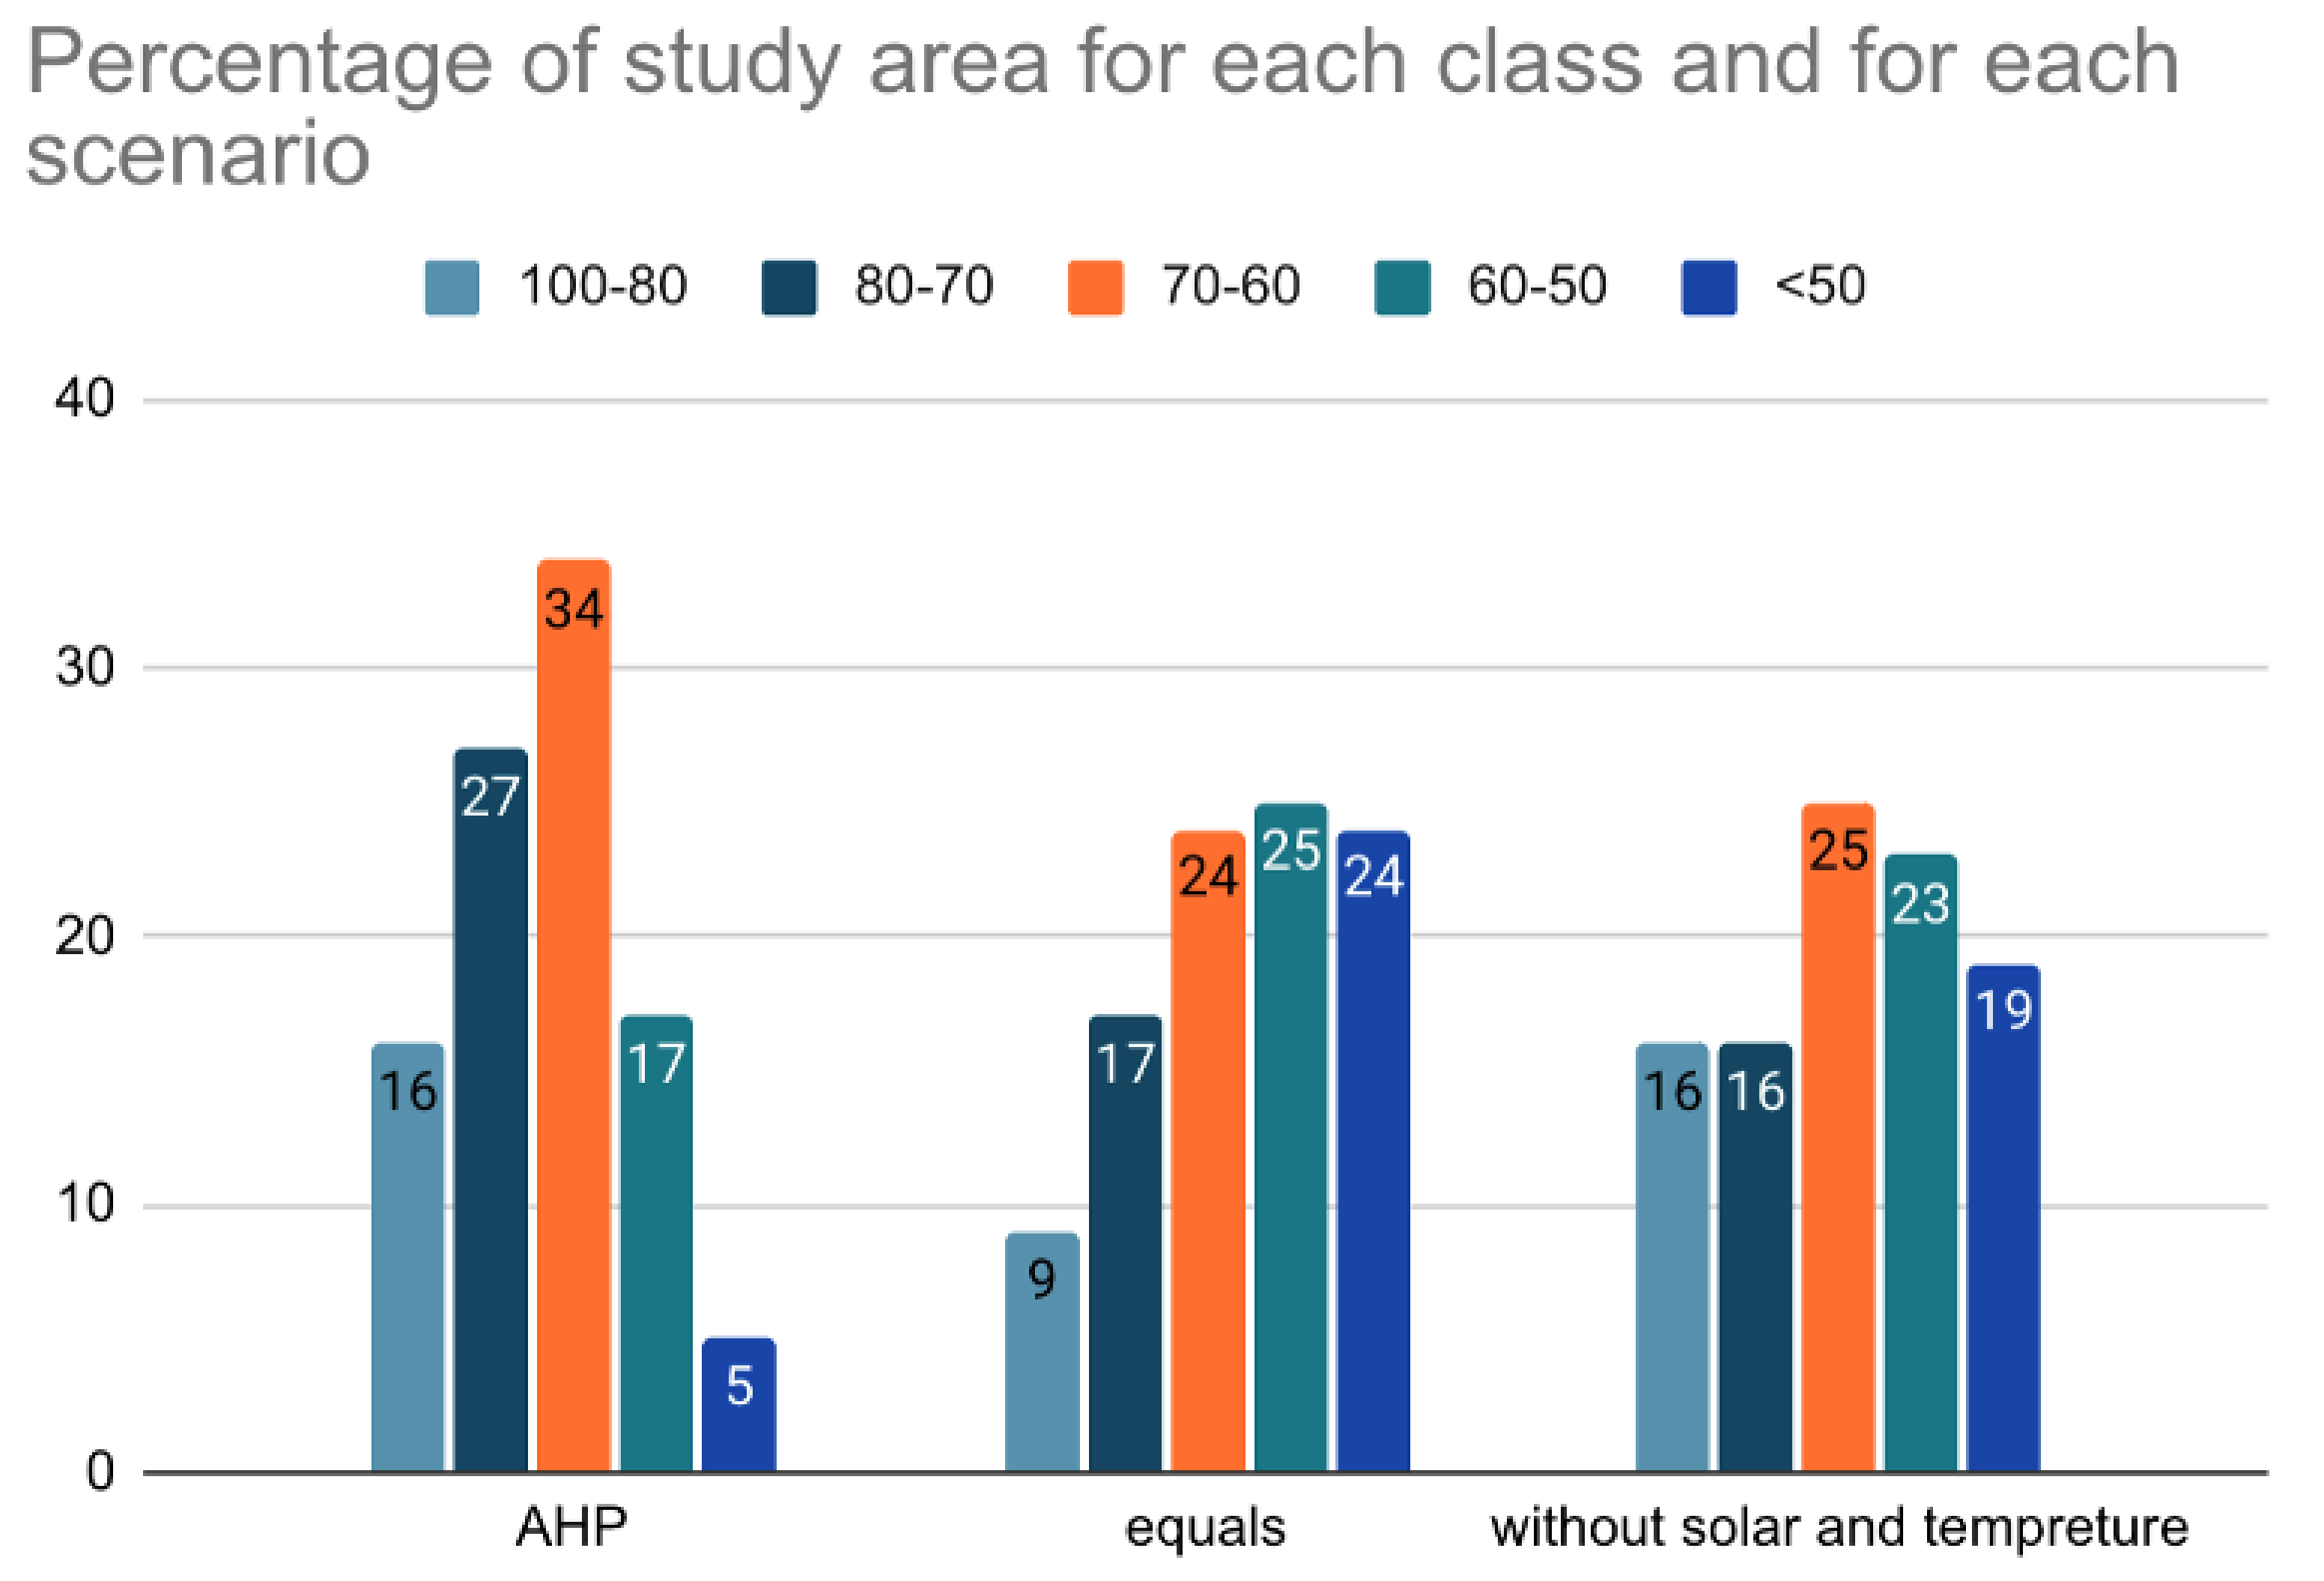
| Class | Equal | Without Solar Radiation and Temperature |
|---|---|---|
| 100–80% | Decreased by 7% | Decreased by 0.01% |
| 80–70% | Decreased by 10% | Decreased by 11% |
| 70–60% | Decreased by 10% | Decreased by 9% |
| 60–50% | Increased by 8% | Increased by 6% |
| <50% | Increased by 19% | Increased by 14% |
Publisher’s Note: MDPI stays neutral with regard to jurisdictional claims in published maps and institutional affiliations. |
© 2021 by the authors. Licensee MDPI, Basel, Switzerland. This article is an open access article distributed under the terms and conditions of the Creative Commons Attribution (CC BY) license (https://creativecommons.org/licenses/by/4.0/).
Share and Cite
Albraheem, L.; Alabdulkarim, L. Geospatial Analysis of Solar Energy in Riyadh Using a GIS-AHP-Based Technique. ISPRS Int. J. Geo-Inf. 2021, 10, 291. https://doi.org/10.3390/ijgi10050291
Albraheem L, Alabdulkarim L. Geospatial Analysis of Solar Energy in Riyadh Using a GIS-AHP-Based Technique. ISPRS International Journal of Geo-Information. 2021; 10(5):291. https://doi.org/10.3390/ijgi10050291
Chicago/Turabian StyleAlbraheem, Lamya, and Leena Alabdulkarim. 2021. "Geospatial Analysis of Solar Energy in Riyadh Using a GIS-AHP-Based Technique" ISPRS International Journal of Geo-Information 10, no. 5: 291. https://doi.org/10.3390/ijgi10050291
APA StyleAlbraheem, L., & Alabdulkarim, L. (2021). Geospatial Analysis of Solar Energy in Riyadh Using a GIS-AHP-Based Technique. ISPRS International Journal of Geo-Information, 10(5), 291. https://doi.org/10.3390/ijgi10050291