1. Introduction
One of the main goals of crime prediction is to efficiently guide police deployment such that predicted crimes can be dealt with effectively [
1]. In this context, researchers and police practitioners worldwide are increasingly looking into efficient methods for predictive policing [
2]. Many types of data have been used to improve the efficiency and accuracy of crime prediction results, including historical crime records and socioenvironmental data [
1,
3,
4,
5].
Retrospective studies using historical crime records are commonly related to hotspot analysis. Using recent crime data, hotspots are detected and mapped to identify emerging crimes [
6,
7]. In this context, crime hotspots are assumed to be stable over time [
8,
9]. This assumption may work well for long-term high-crime areas due to the concentrated disadvantages [
10]. In order to improve the accuracy of short-term predictions, recent crimes are used to predict high-crime areas, for example via self-exciting point process models and near-repeat approaches [
11,
12,
13]. Moreover, criminology theories are proposed to interpret why crimes tend to happen at a specific place and time [
10,
14,
15,
16], and some methods such as geographically weighted regression and geographical and temporal weighted regression have been used to explore the environmental factors of crime distribution [
17,
18]. However, the dynamic nature of crime calls for more proactive methods [
19,
20].
In practice, the predicted crime risk may exist for a short time but dissipate rapidly due to unexpected activities (e.g., the disappearance of criminogenic opportunities) [
21]. In addition, a small time window may reduce the significance of historic data and lead to greater noise in crime prediction [
9,
22]. This makes it difficult to effectively predict emerging crimes, limiting the success of traditional methods for short-term prediction. Hence, short-term prediction is urgently needed in policing practice.
Fortunately, the development of deep learning has made it possible to perform effective short-term crime prediction, facilitated by socioeconomic factors as well as historical crime data [
23,
24,
25]. For example, Alexander et al. used a deep neural network model for crime prediction using historical crime data, demographic data, weather records, and transportation sites [
26]. When the time window is small, the neural network model does not perform well, with even further calculations being performed. To address this shortcoming, He et al. presented a deep residual network (ResNet) model to improve the model performance when the time window is small [
27]. Zhang et al. applied this model to hourly crowd prediction by adapting it to the time dimension [
28]. Using an ST-ResNet model that can capture spatial structures with convolutional neural networks (CNNs) and learn temporal dependencies with recurrent neural networks (RNNs), Wang et al. provided an hourly crime prediction method based on weather record and historical crime data from Los Angeles [
29].
It is well known that crime is not evenly distributed in space [
30,
31]. Most crimes are more likely to be committed at specific times of day [
30]. The clustering nature of crime is often interpreted by repeat and near-repeat phenomena, which have been identified for many crime types, including vehicle thefts, street robberies, residential burglaries, etc. [
32,
33,
34]. Repeat and near-repeat phenomena confirm the strong relationship between crimes’ proximity in space and time [
23]. The Knox method is often used to quantify the influence of this phenomenon [
35]. Many studies have proven that repeat and near-repeat patterns vary in different regions. For example, there was a significant near-repeat pattern for 2 months within 400 m in Merseyside, UK, but in Nanjing, China, this pattern occurred within 14 days and 300 m [
19,
36]. The analysis of repeat and near-repeat phenomena is crucial for practical crime prediction [
37,
38].
Grid cell size is an important parameter in crime prediction, and crime forecasts are sensitive to the spatial discretization scheme used [
7,
31,
39,
40,
41]. Scale problems of the modifiable areal unit problem can impact the proportion of difference related to surrounding areas [
42]. It varies between crime types and study regions [
39]. To find an optimal unit for mapping crime, some different approaches have been explored. Oberwittler and Wikström analyzed robustness and internal uniformity in order to choose the optimal area for regressions [
39]. Gerell et al. computed intraclass correlations (ICCs) as a criterion by hierarchical linear modeling to select an optimal surrounding environment size for an understanding of the geography of arson incidents [
43]. Malleson et al. estimated the similarity between spatial point patterns at each resolution to determine an adequate unit when aggregating point data to areas [
44]. Ramos et al. balanced robustness to error and internal uniformity to determine an optimal granularity to produce more reliable crime maps [
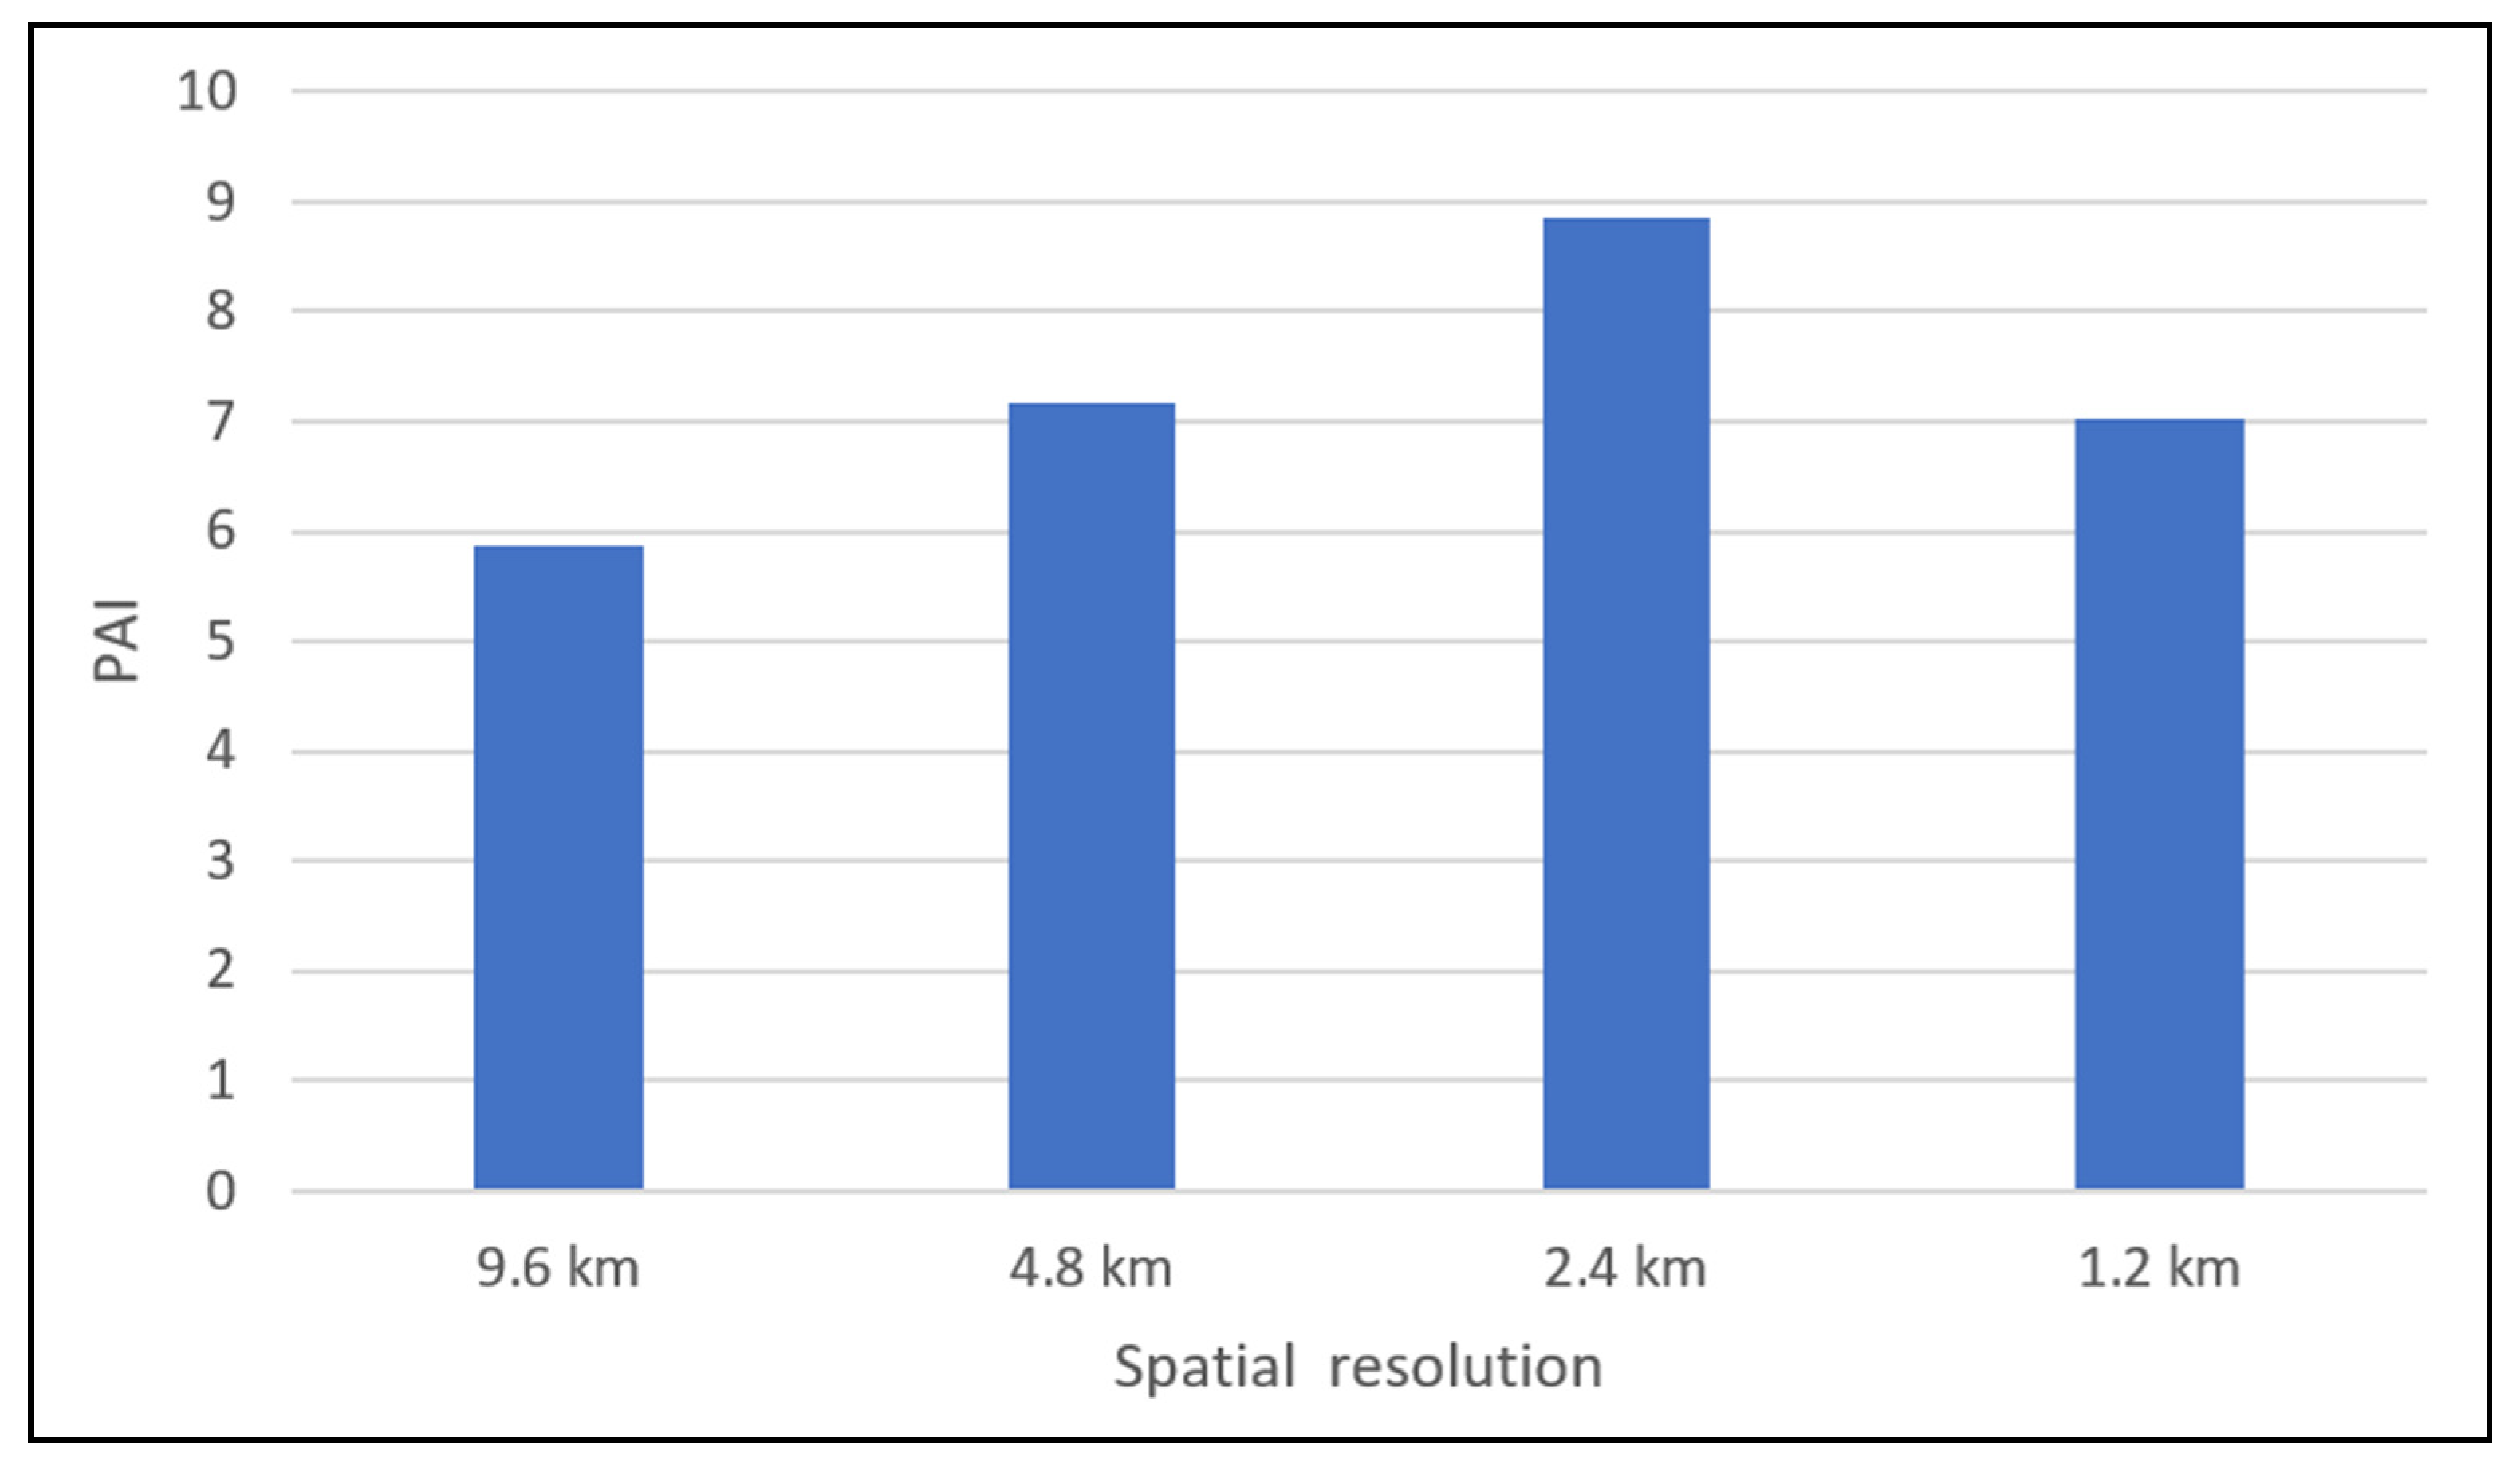
45]. The criteria of the optimal unit in crime mapping vary depending on the purpose of crime analysis. In this paper, we focus on the accuracy of hourly crime prediction when selecting the optimal unit, and choose the prediction accuracy index (PAI), which can measure the accuracy level of model results, as a criterion to meet the needs of the actual patrol [
6]. The deep learning model ST-ResNet is constructed to extract the feature of a sparse matrix of hourly crime data. The influence of different spatial resolutions on prediction results is analyzed iteratively, and the highest PAI is calculated in the optimal resolution for the model. The time cost of deep learning models for short-term prediction is higher than that of traditional models for long-time prediction. To reduce the computational cost, we adopt a hierarchical pyramid structure to provide different resolutions by an automated process.
In order to select the best spatial resolution in crime prediction at hourly temporal scales, we propose an adaptive spatial resolution method. A data pyramid is built to obtain information at different resolutions. The ST-ResNet models are constructed to predict crimes at different scales by analyzing the heterogeneity of crime and weather data. Then, the accuracy of prediction results at each resolution is compared based on the PAI. The validation and accuracy assessments indicate that our method can achieve ideal hourly forecasting results to satisfy the specific requirements of public security prevention and control.
The rest of this paper is organized as follows.
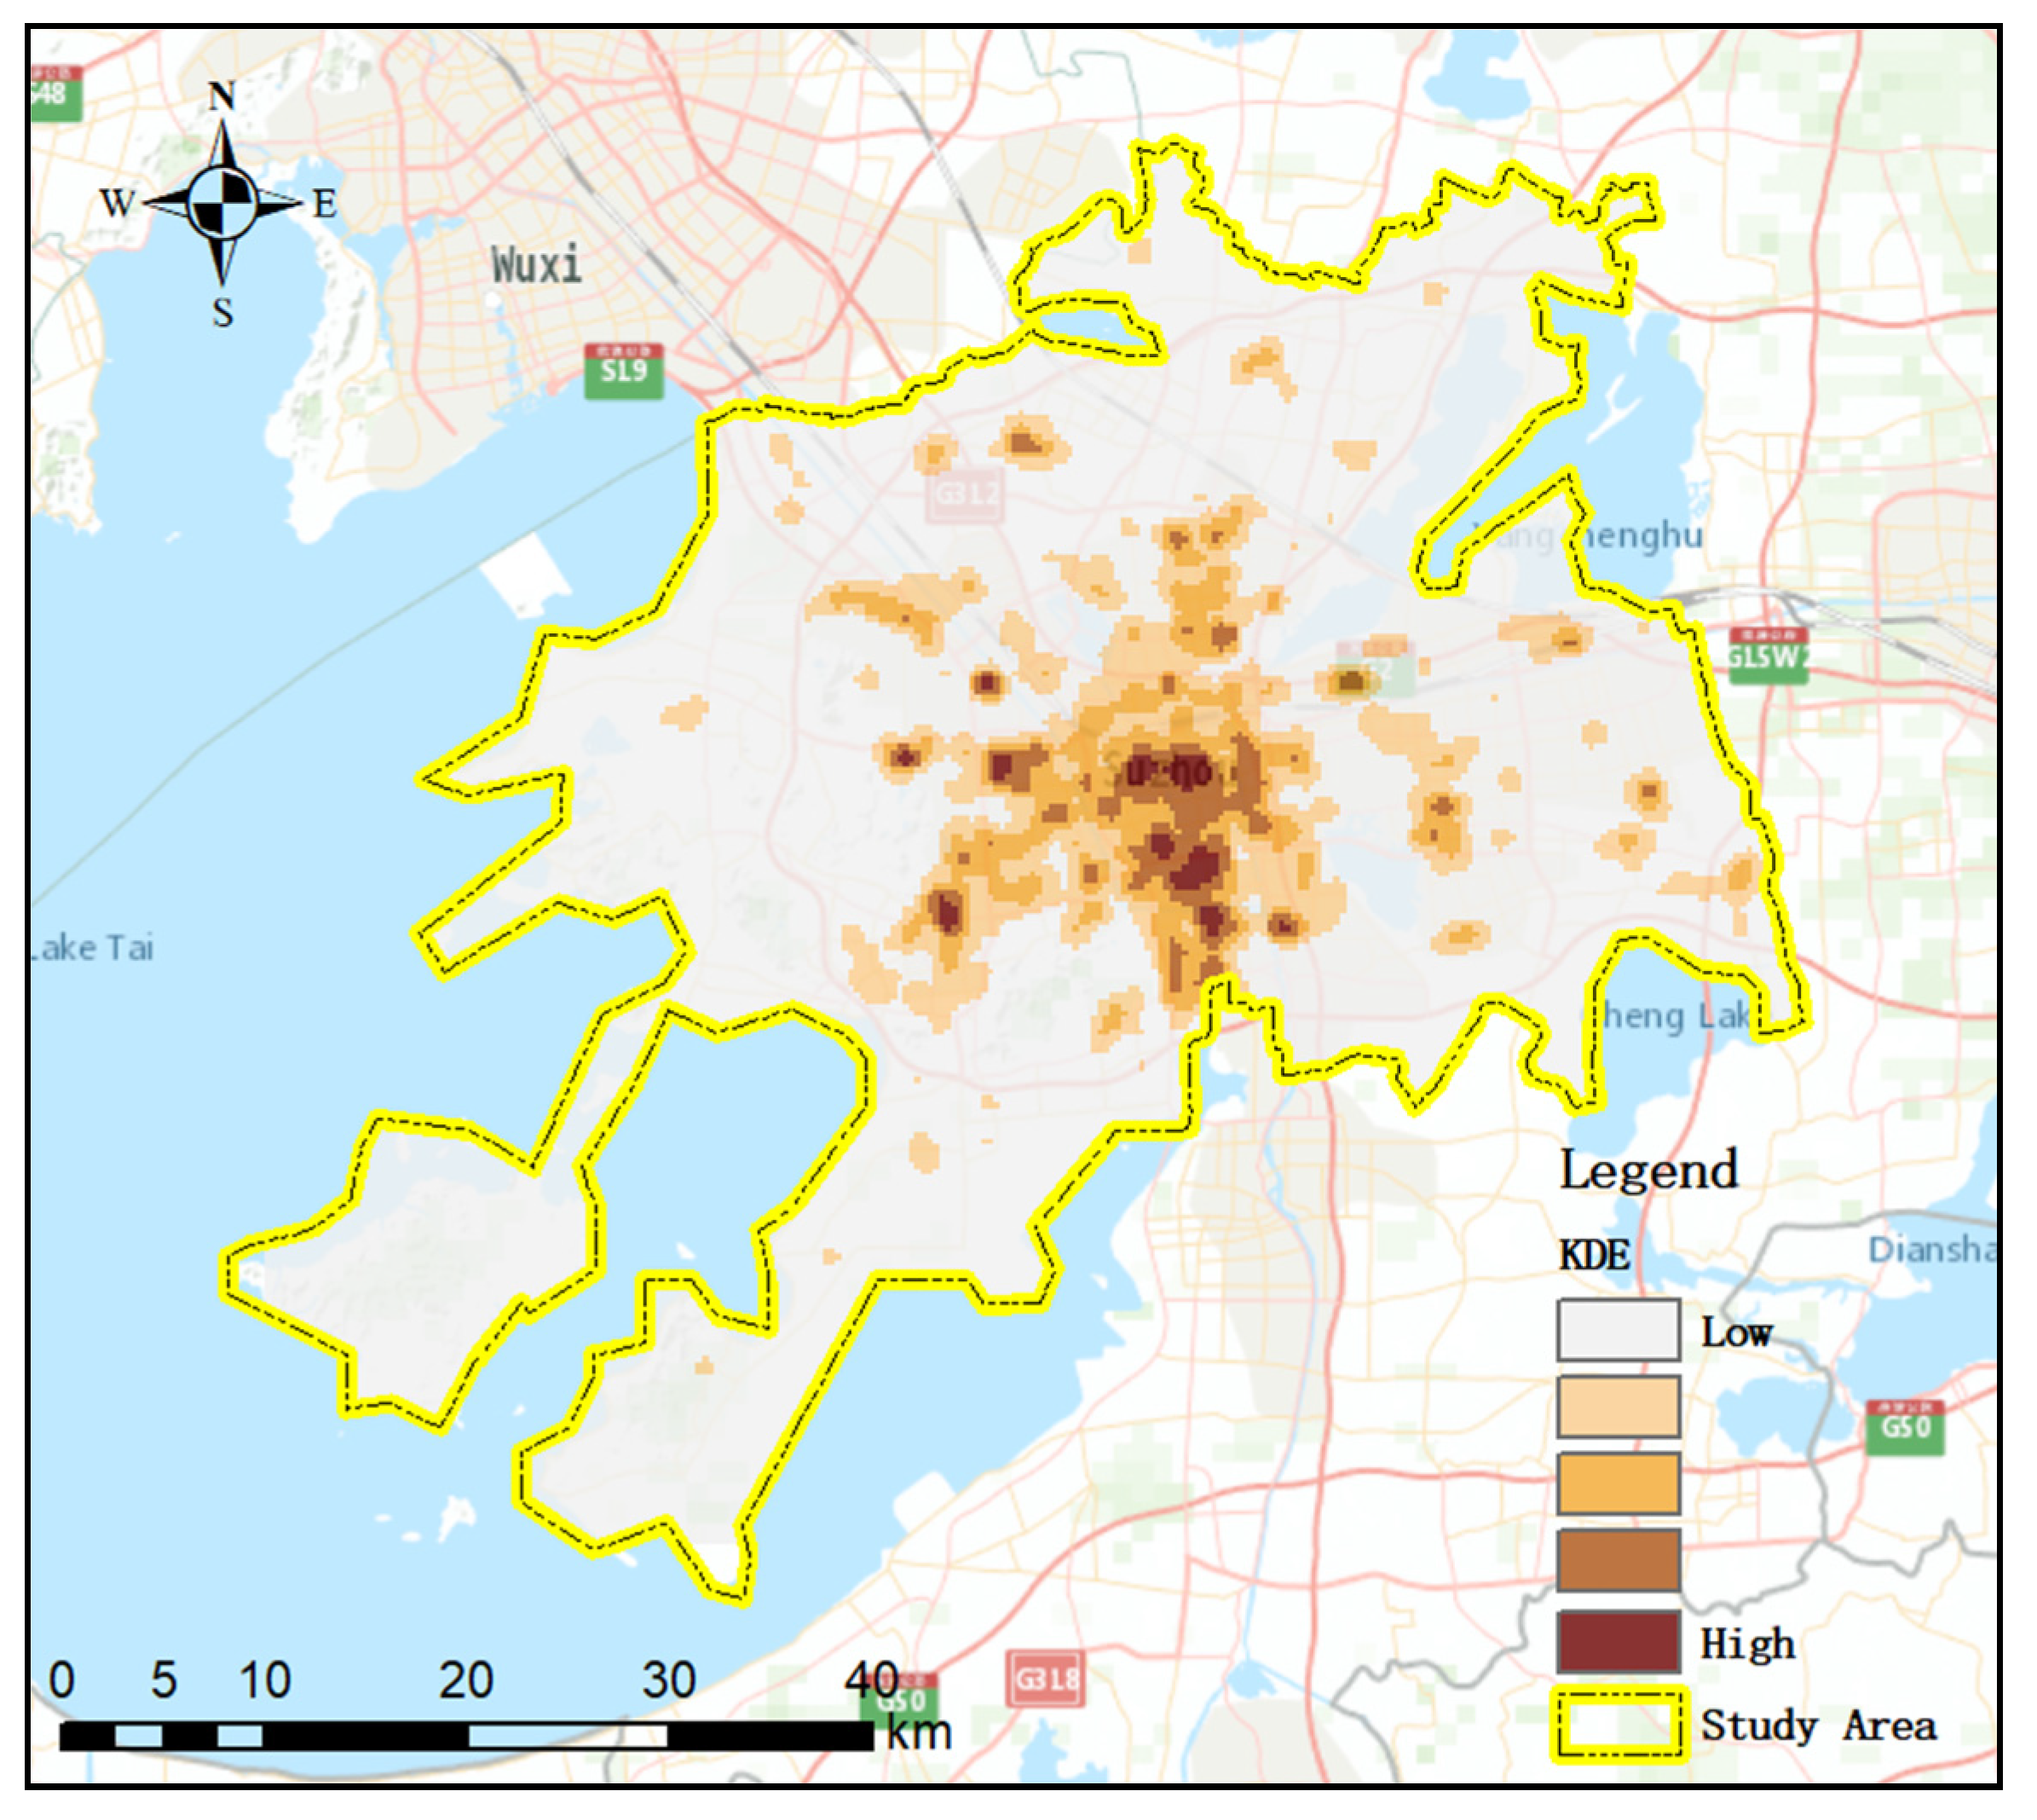
Section 2 describes the study area and data.
Section 3 defines the methodology used to achieve the best prediction effectiveness.
Section 4 presents and discusses the prediction results. Finally,
Section 5 summarizes the conclusions and directions of future work.
3. Methodology
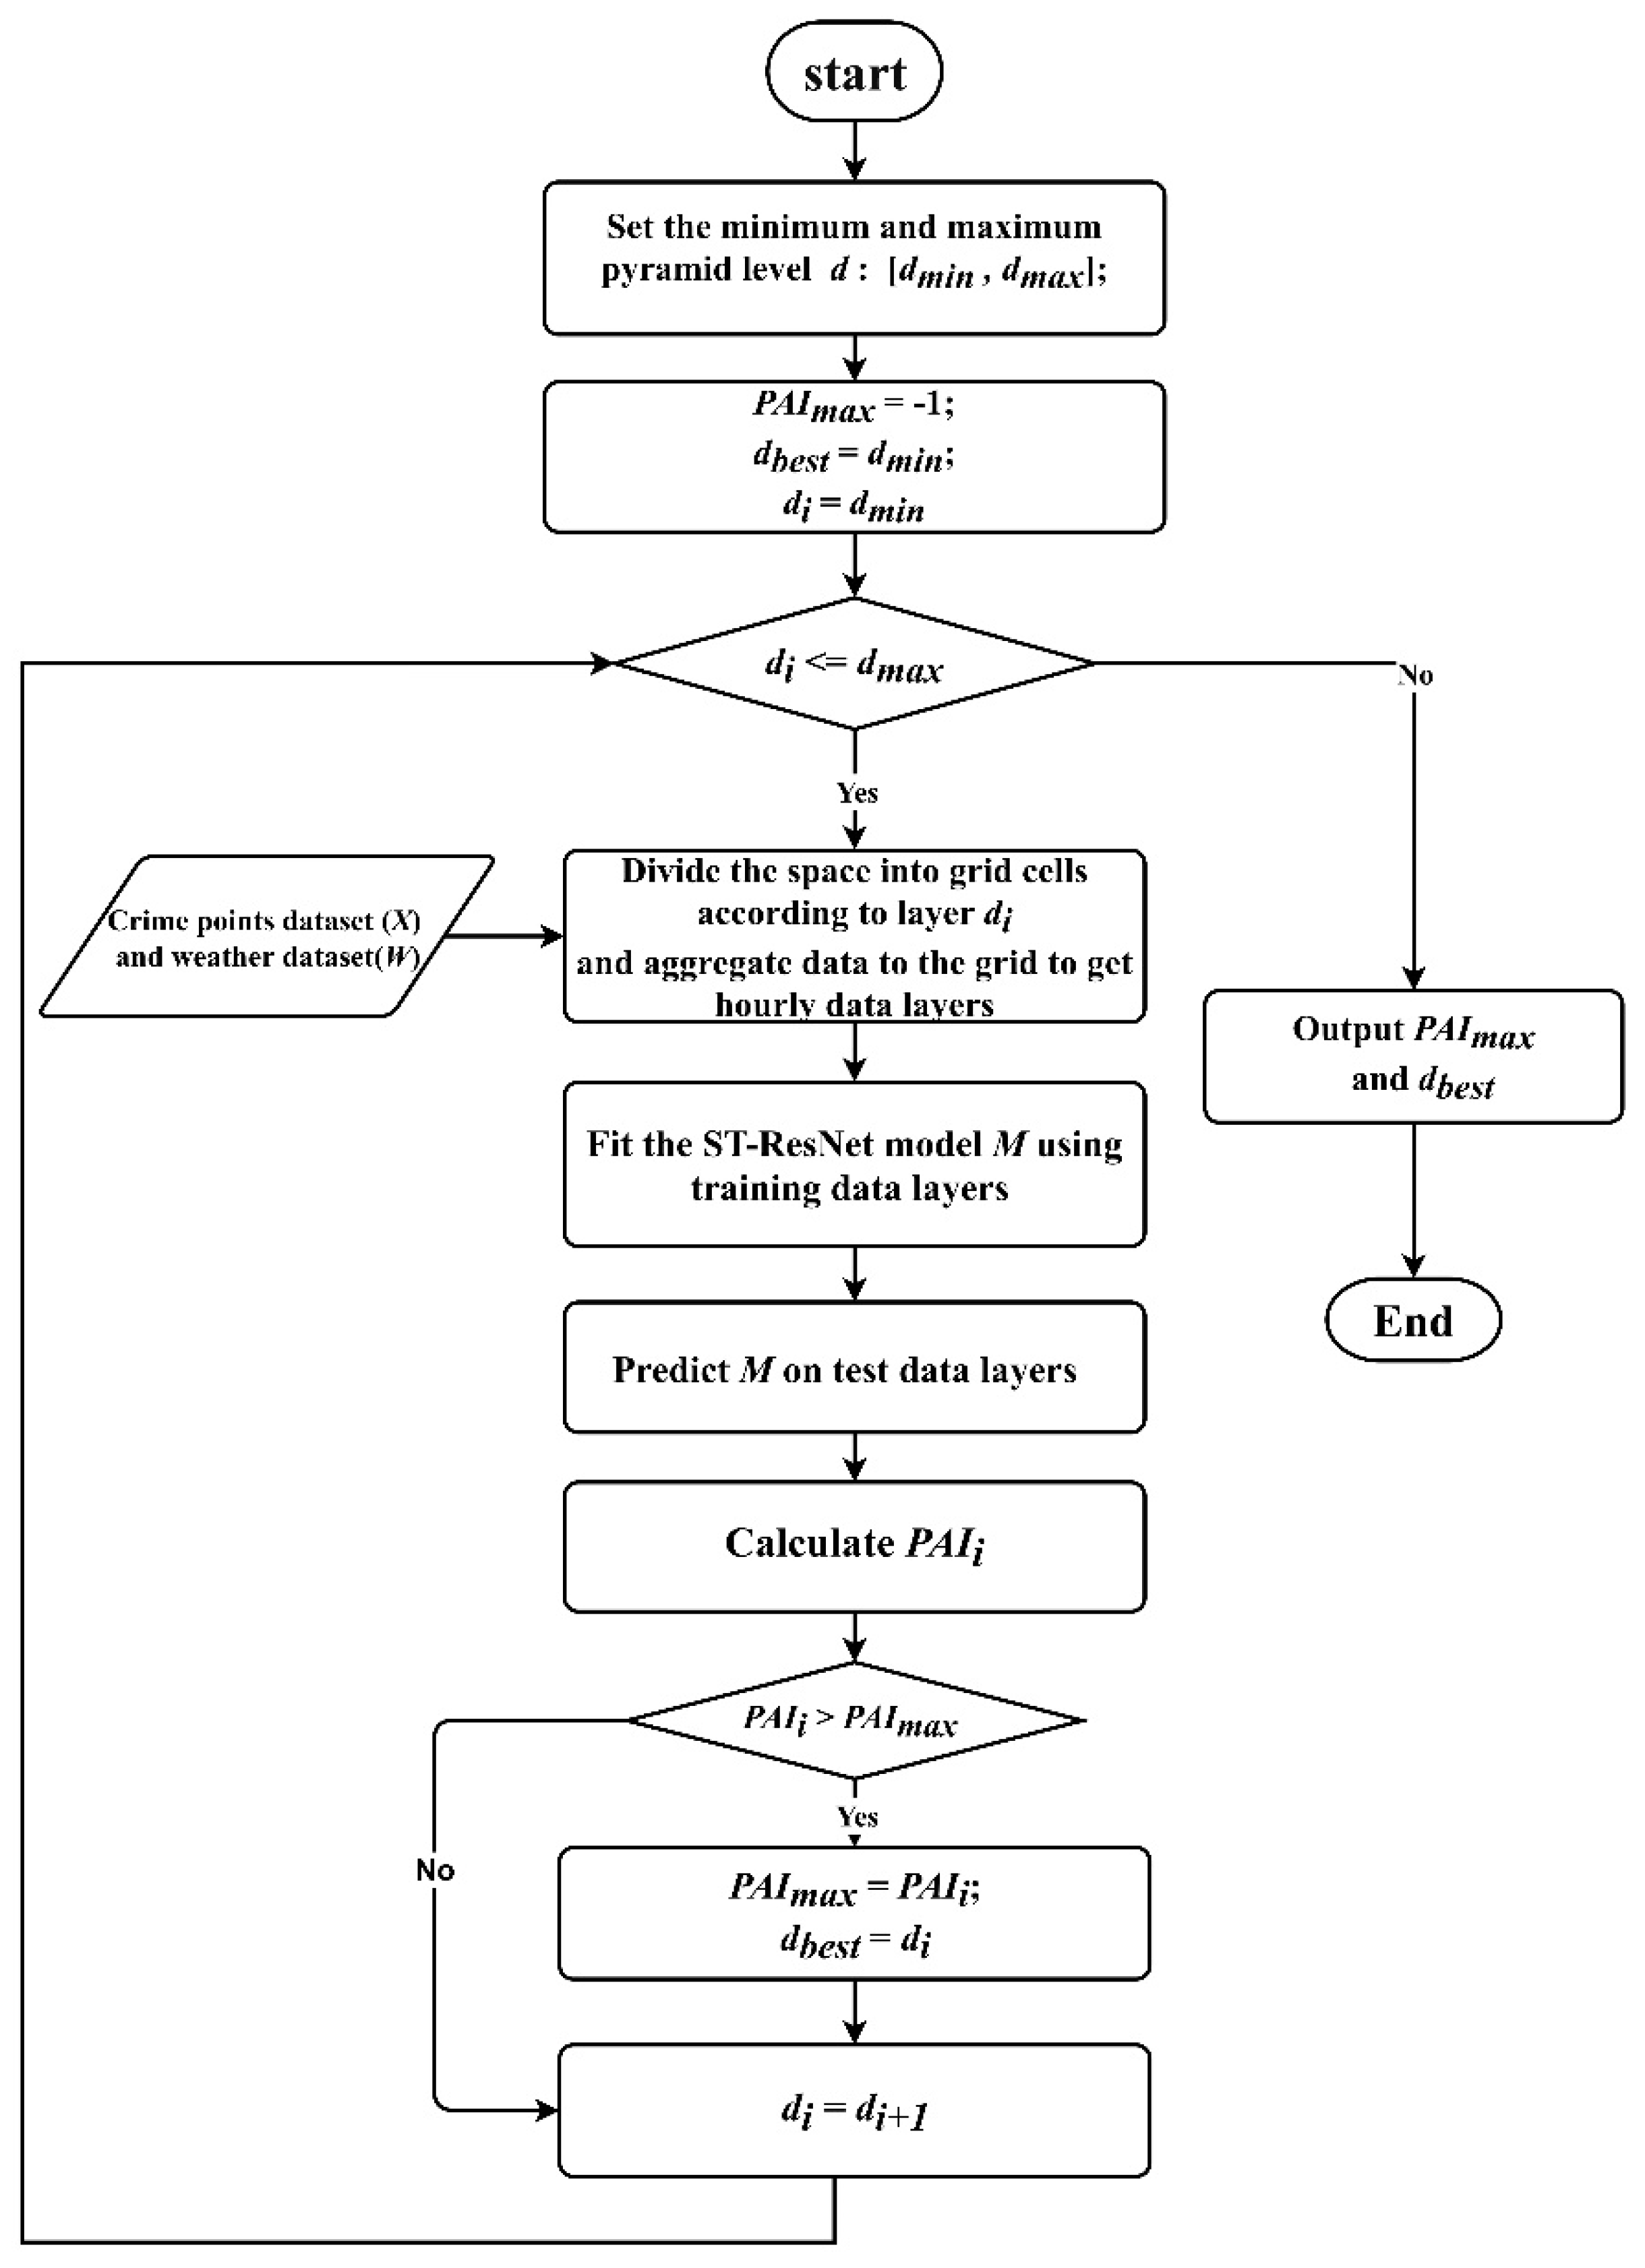
To improve the effectiveness of hourly crime prediction, we proposed an adaptive spatial resolution method to select the optimal unit for crime prediction models. The ST-ResNet model was used to predict the crime risk. The PAI was used to measure the accuracy of the results at different spatial resolutions [
29].
Figure 2 indicates the procedure of the method.
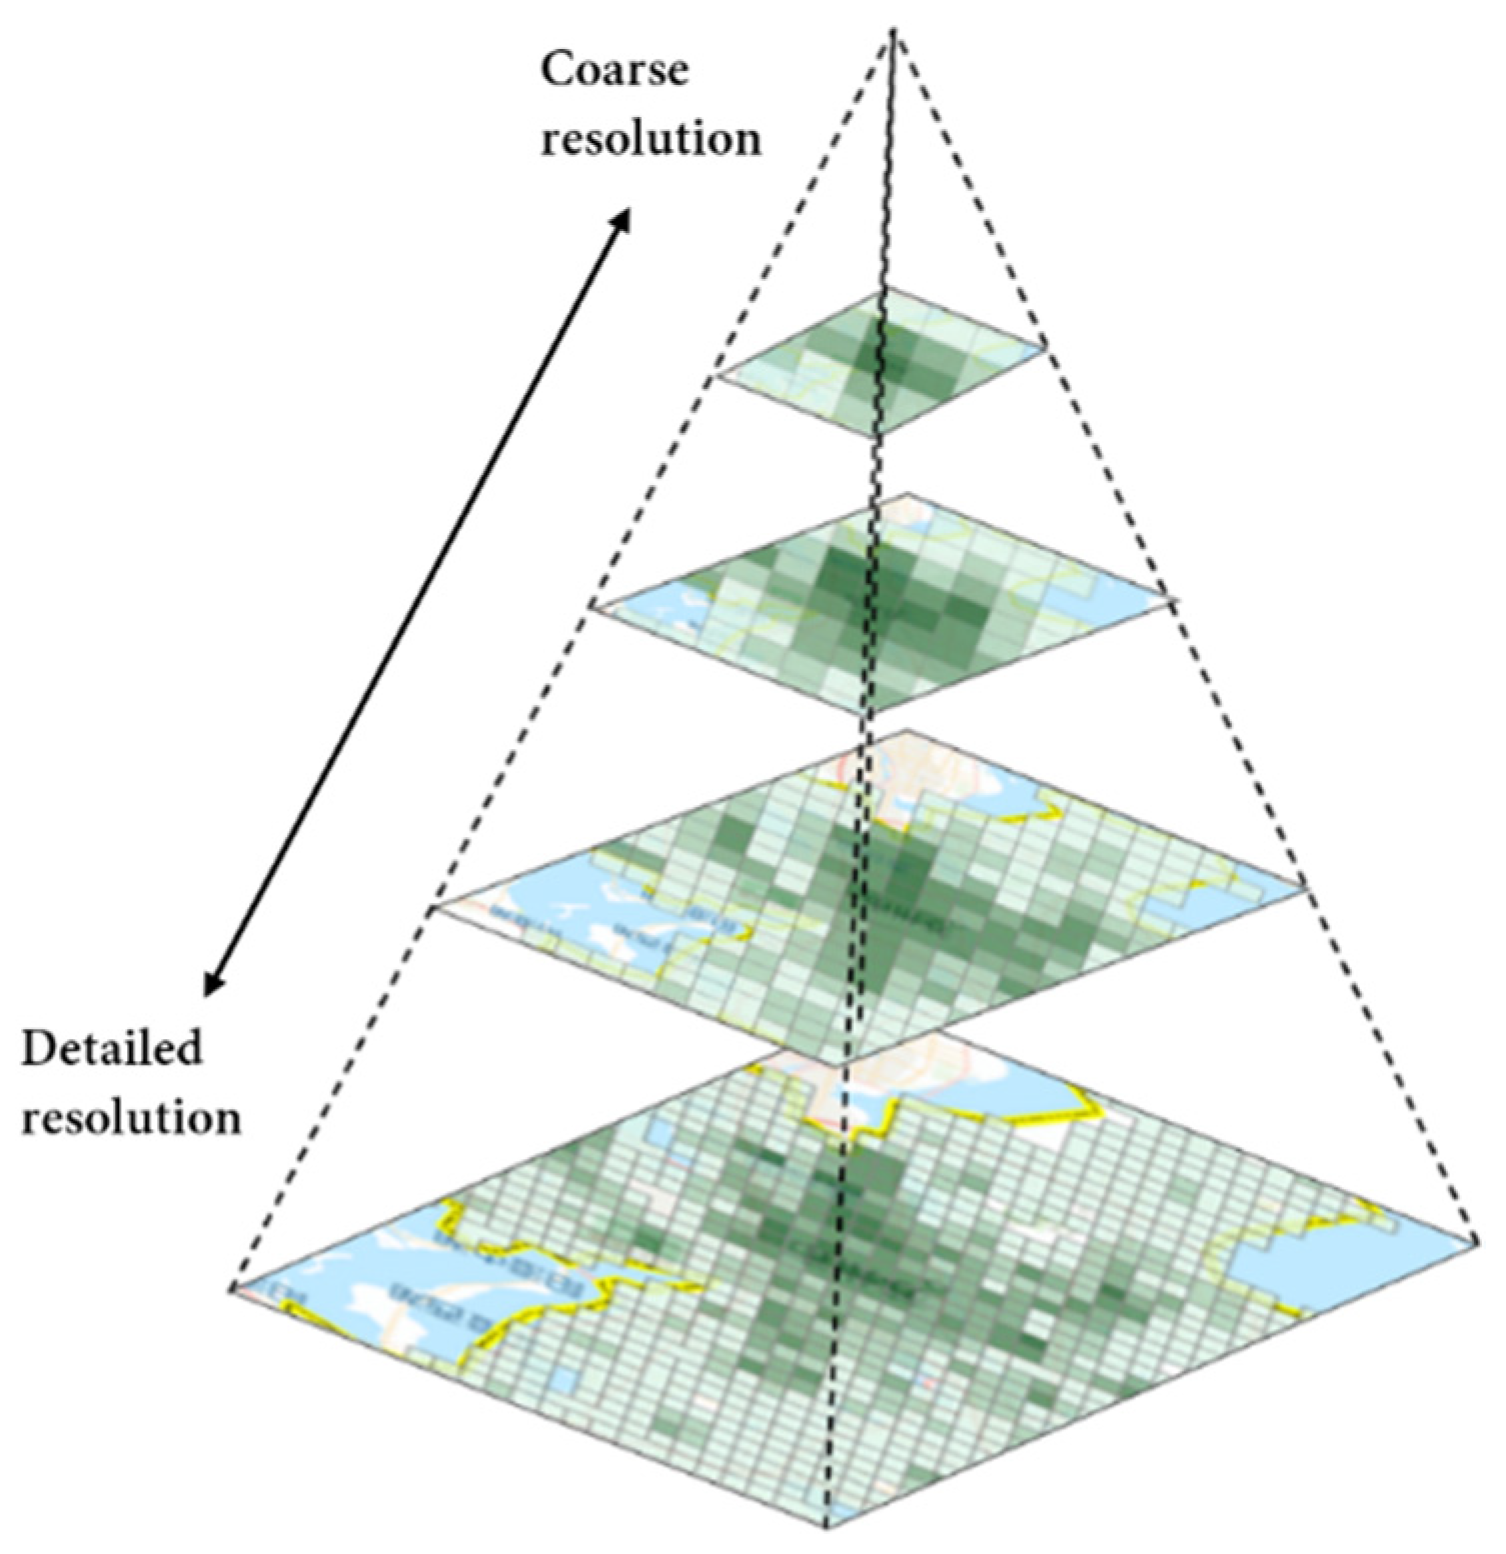
A data pyramid [
56] was produced to aggregated points to the grid at multiple scales, as shown in
Figure 3. Most web mapping services like Google Maps and Microsoft Bing Maps adopt the pyramid technique to provide on-demand map content to users [
57,
58]. The discretization method we used is the same as in these web mapping services. The procedure starts with a coarse resolution and then recursively generates the other resolutions. The points are aggregated to the layers in each calculation of the ST-ResNet model. The base resolution is set to 9.6 km, which corresponds to the 12th level of the pyramid according to the local maximum patrol area.
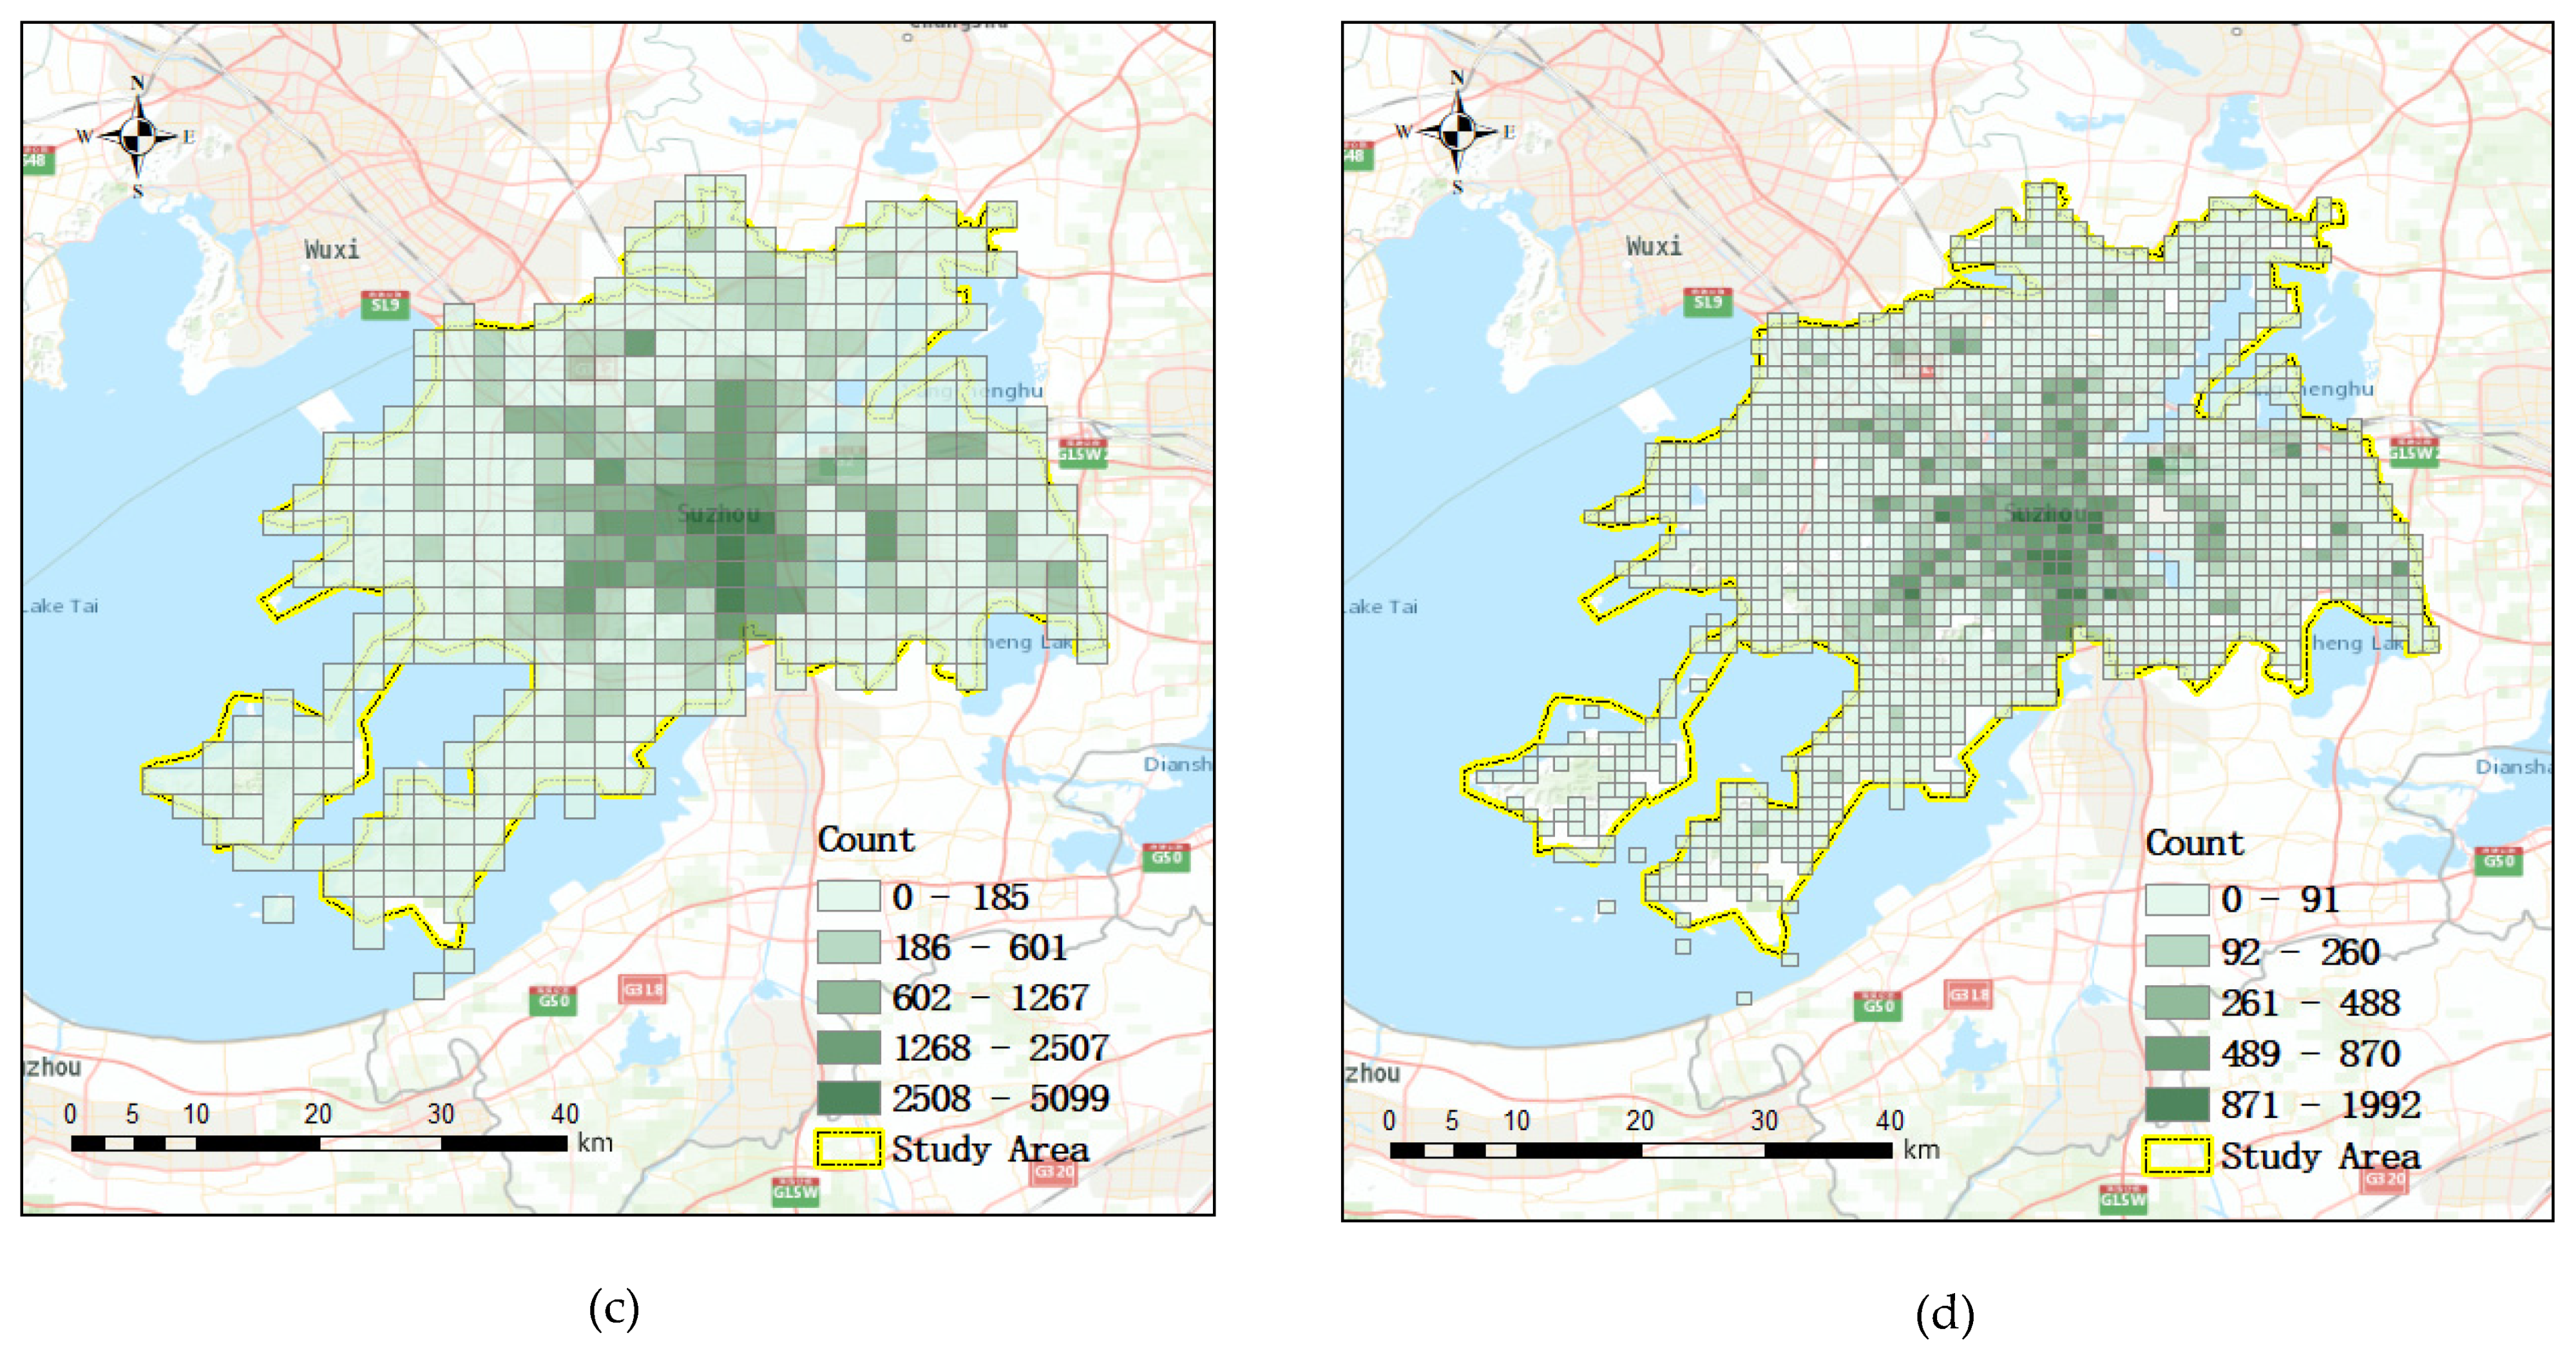
The research area was overlaid by grid cells of various resolutions. The high-resolution layer has small grids that cover a small area and the low-resolution layer has large grids that cover a large area. The crimes were aggregated to the space time grids based on their geocoordinates and time. The number of crimes was counted by grid and assigned to the corresponding cells of a layer.
For the weather data, the grid cells of a time layer share the same value because the weather is homogeneous over the research area. The established layers were divided into training data and test data. Training data were used to train the ST-ResNet model M (as discussed in
Section 3.1) and identify the optimal parameters in a certain spatial resolution. Then, the crime risk was calculated with test data evaluated by the PAI.
By increasing the level of layer d in the pyramid, the resolution of the grid is increased. The crimes were re-aggregated to the grids of another layer. To minimize the influence of time variation of crime, crimes committed over 12 months were selected as training data and the crimes committed in the following month were selected to verify the accuracy of the model. This process was carried out recursively for certain times until the highest-resolution layer was obtained. PAI was included in the model to evaluate the accuracy of the calculations.
3.1. ST-ResNet Model
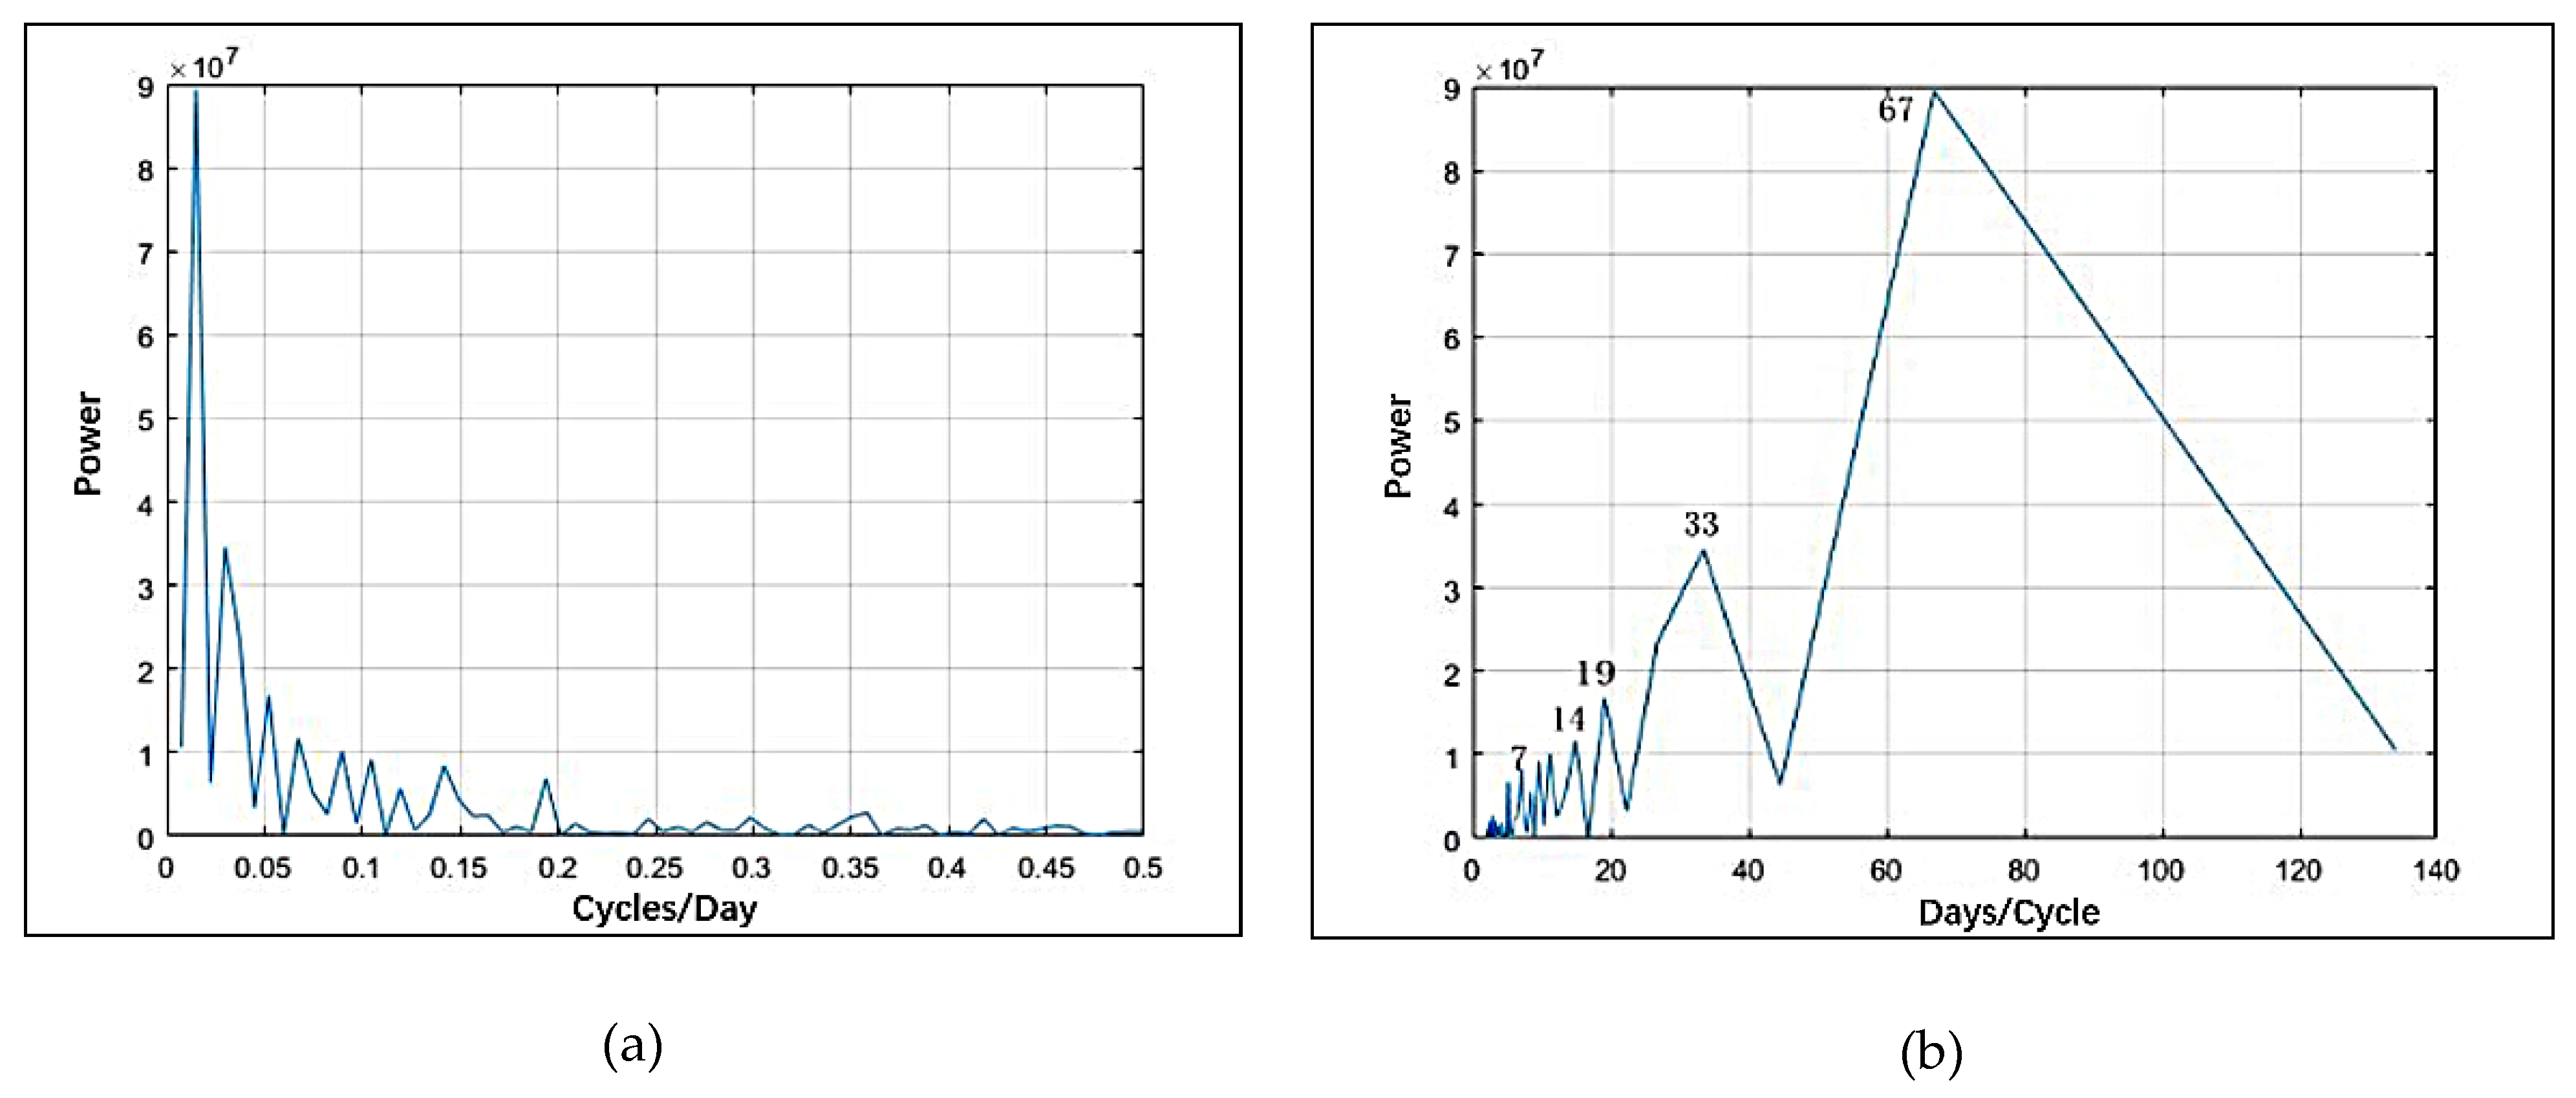
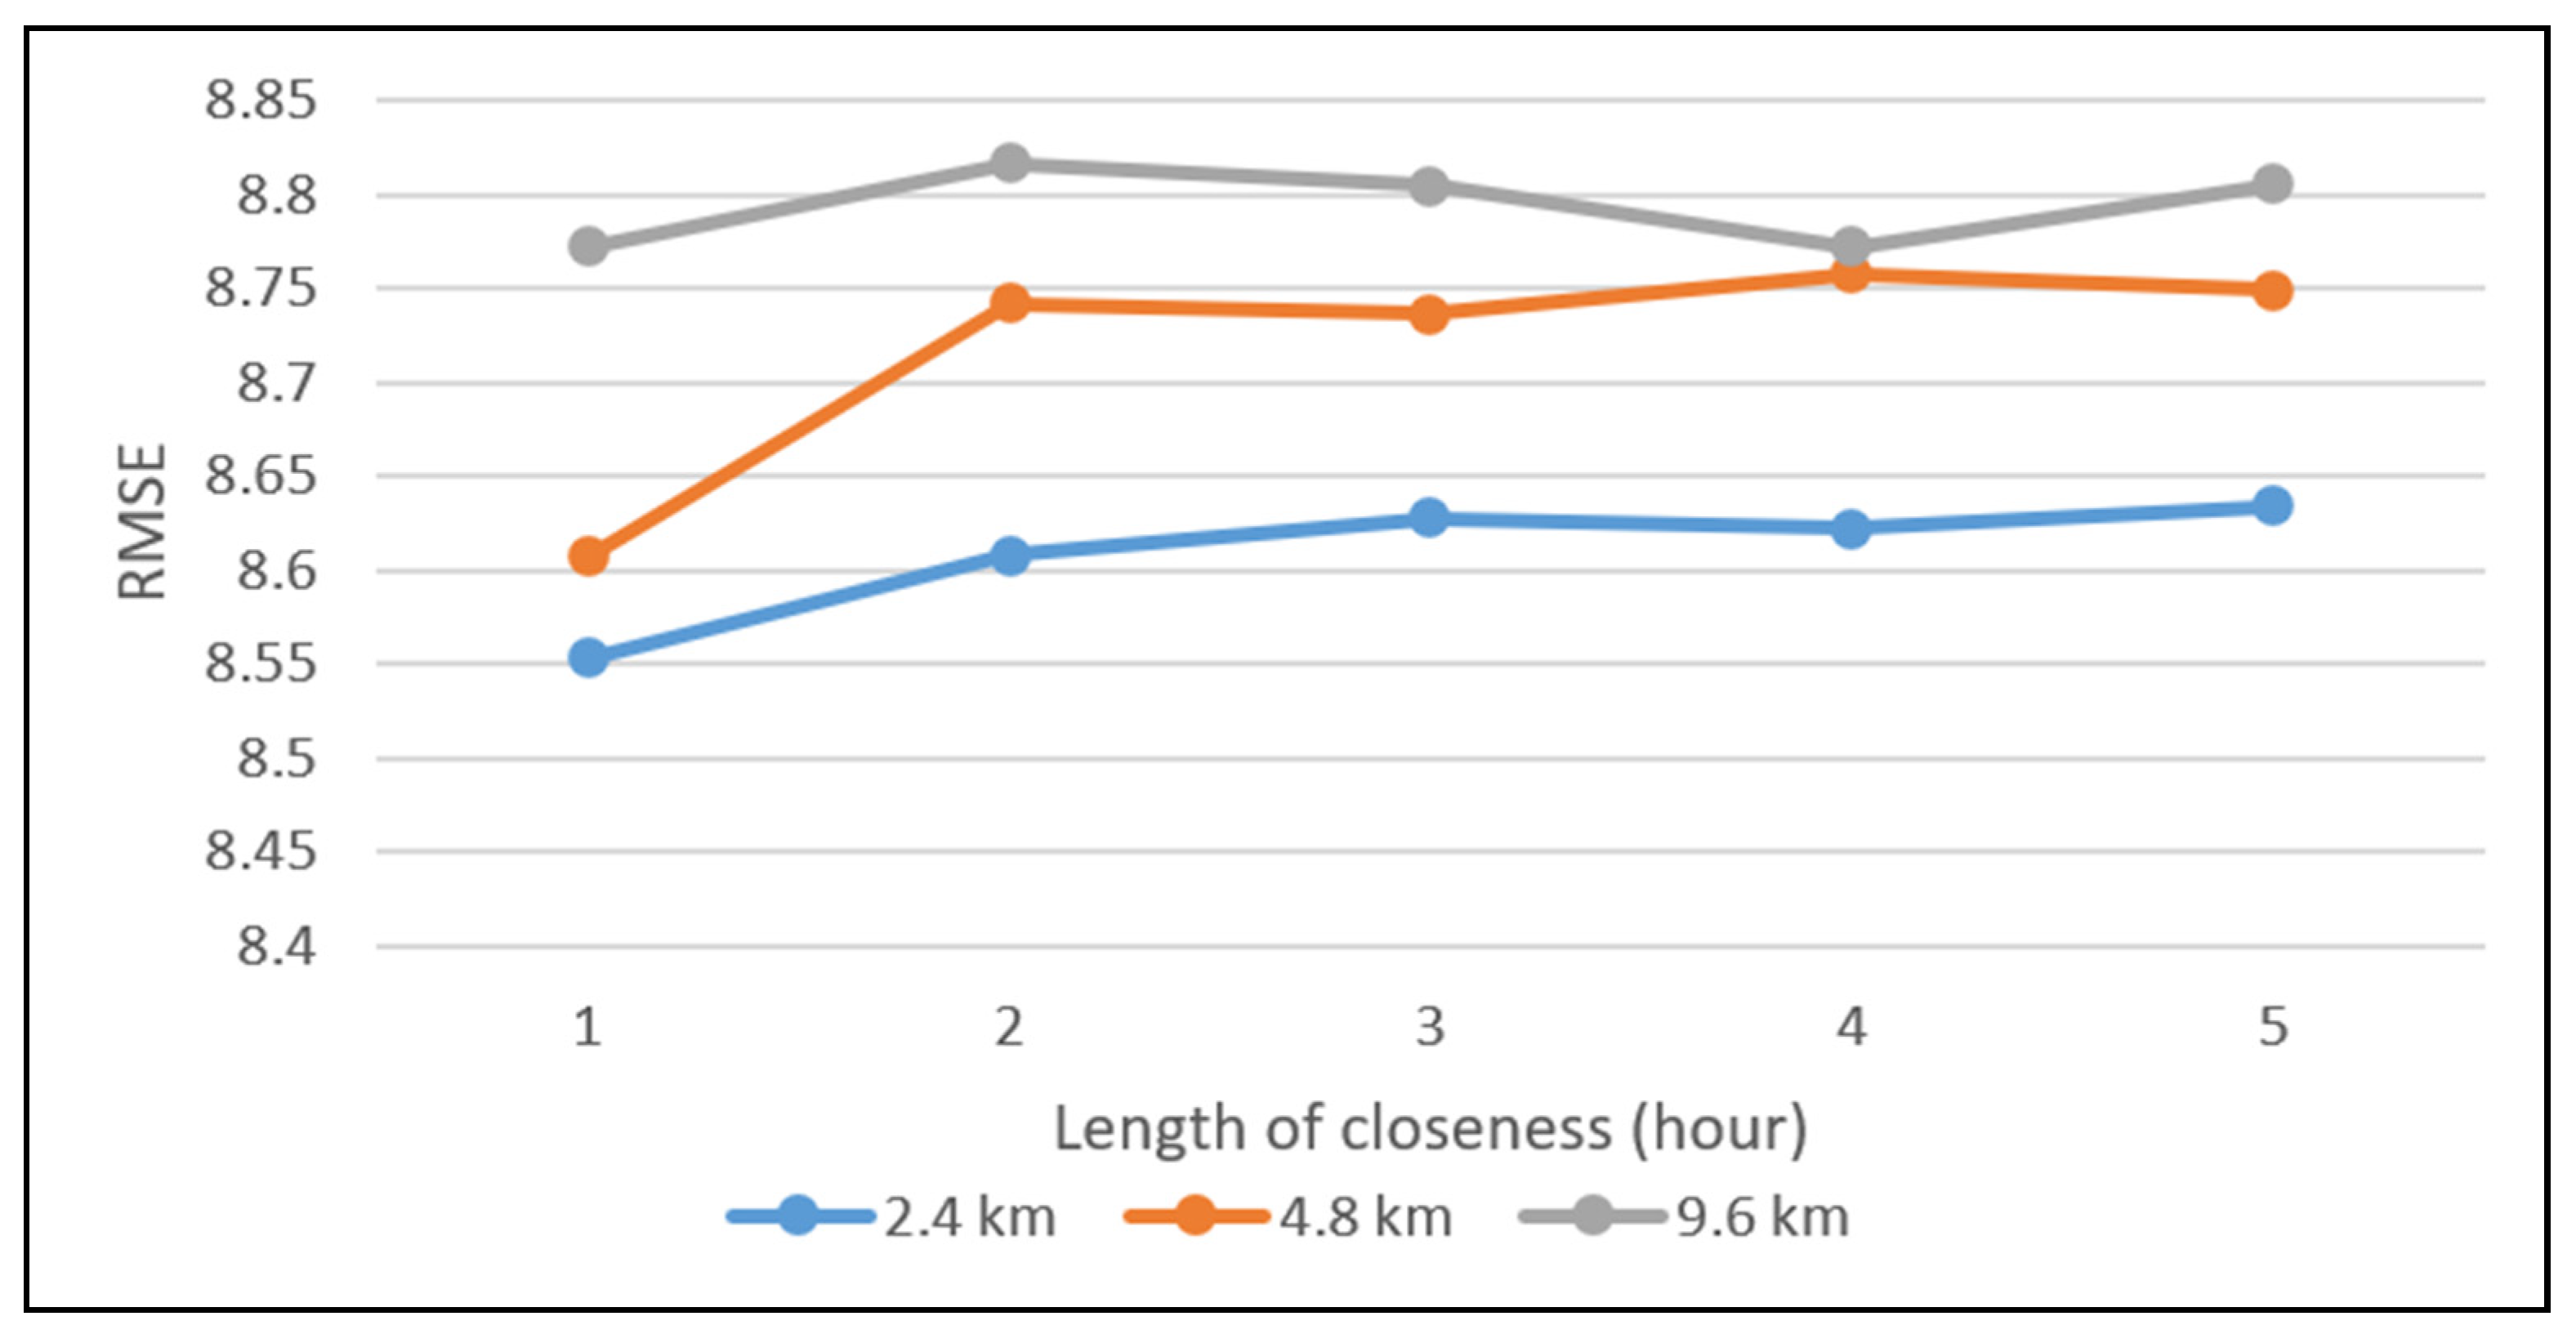
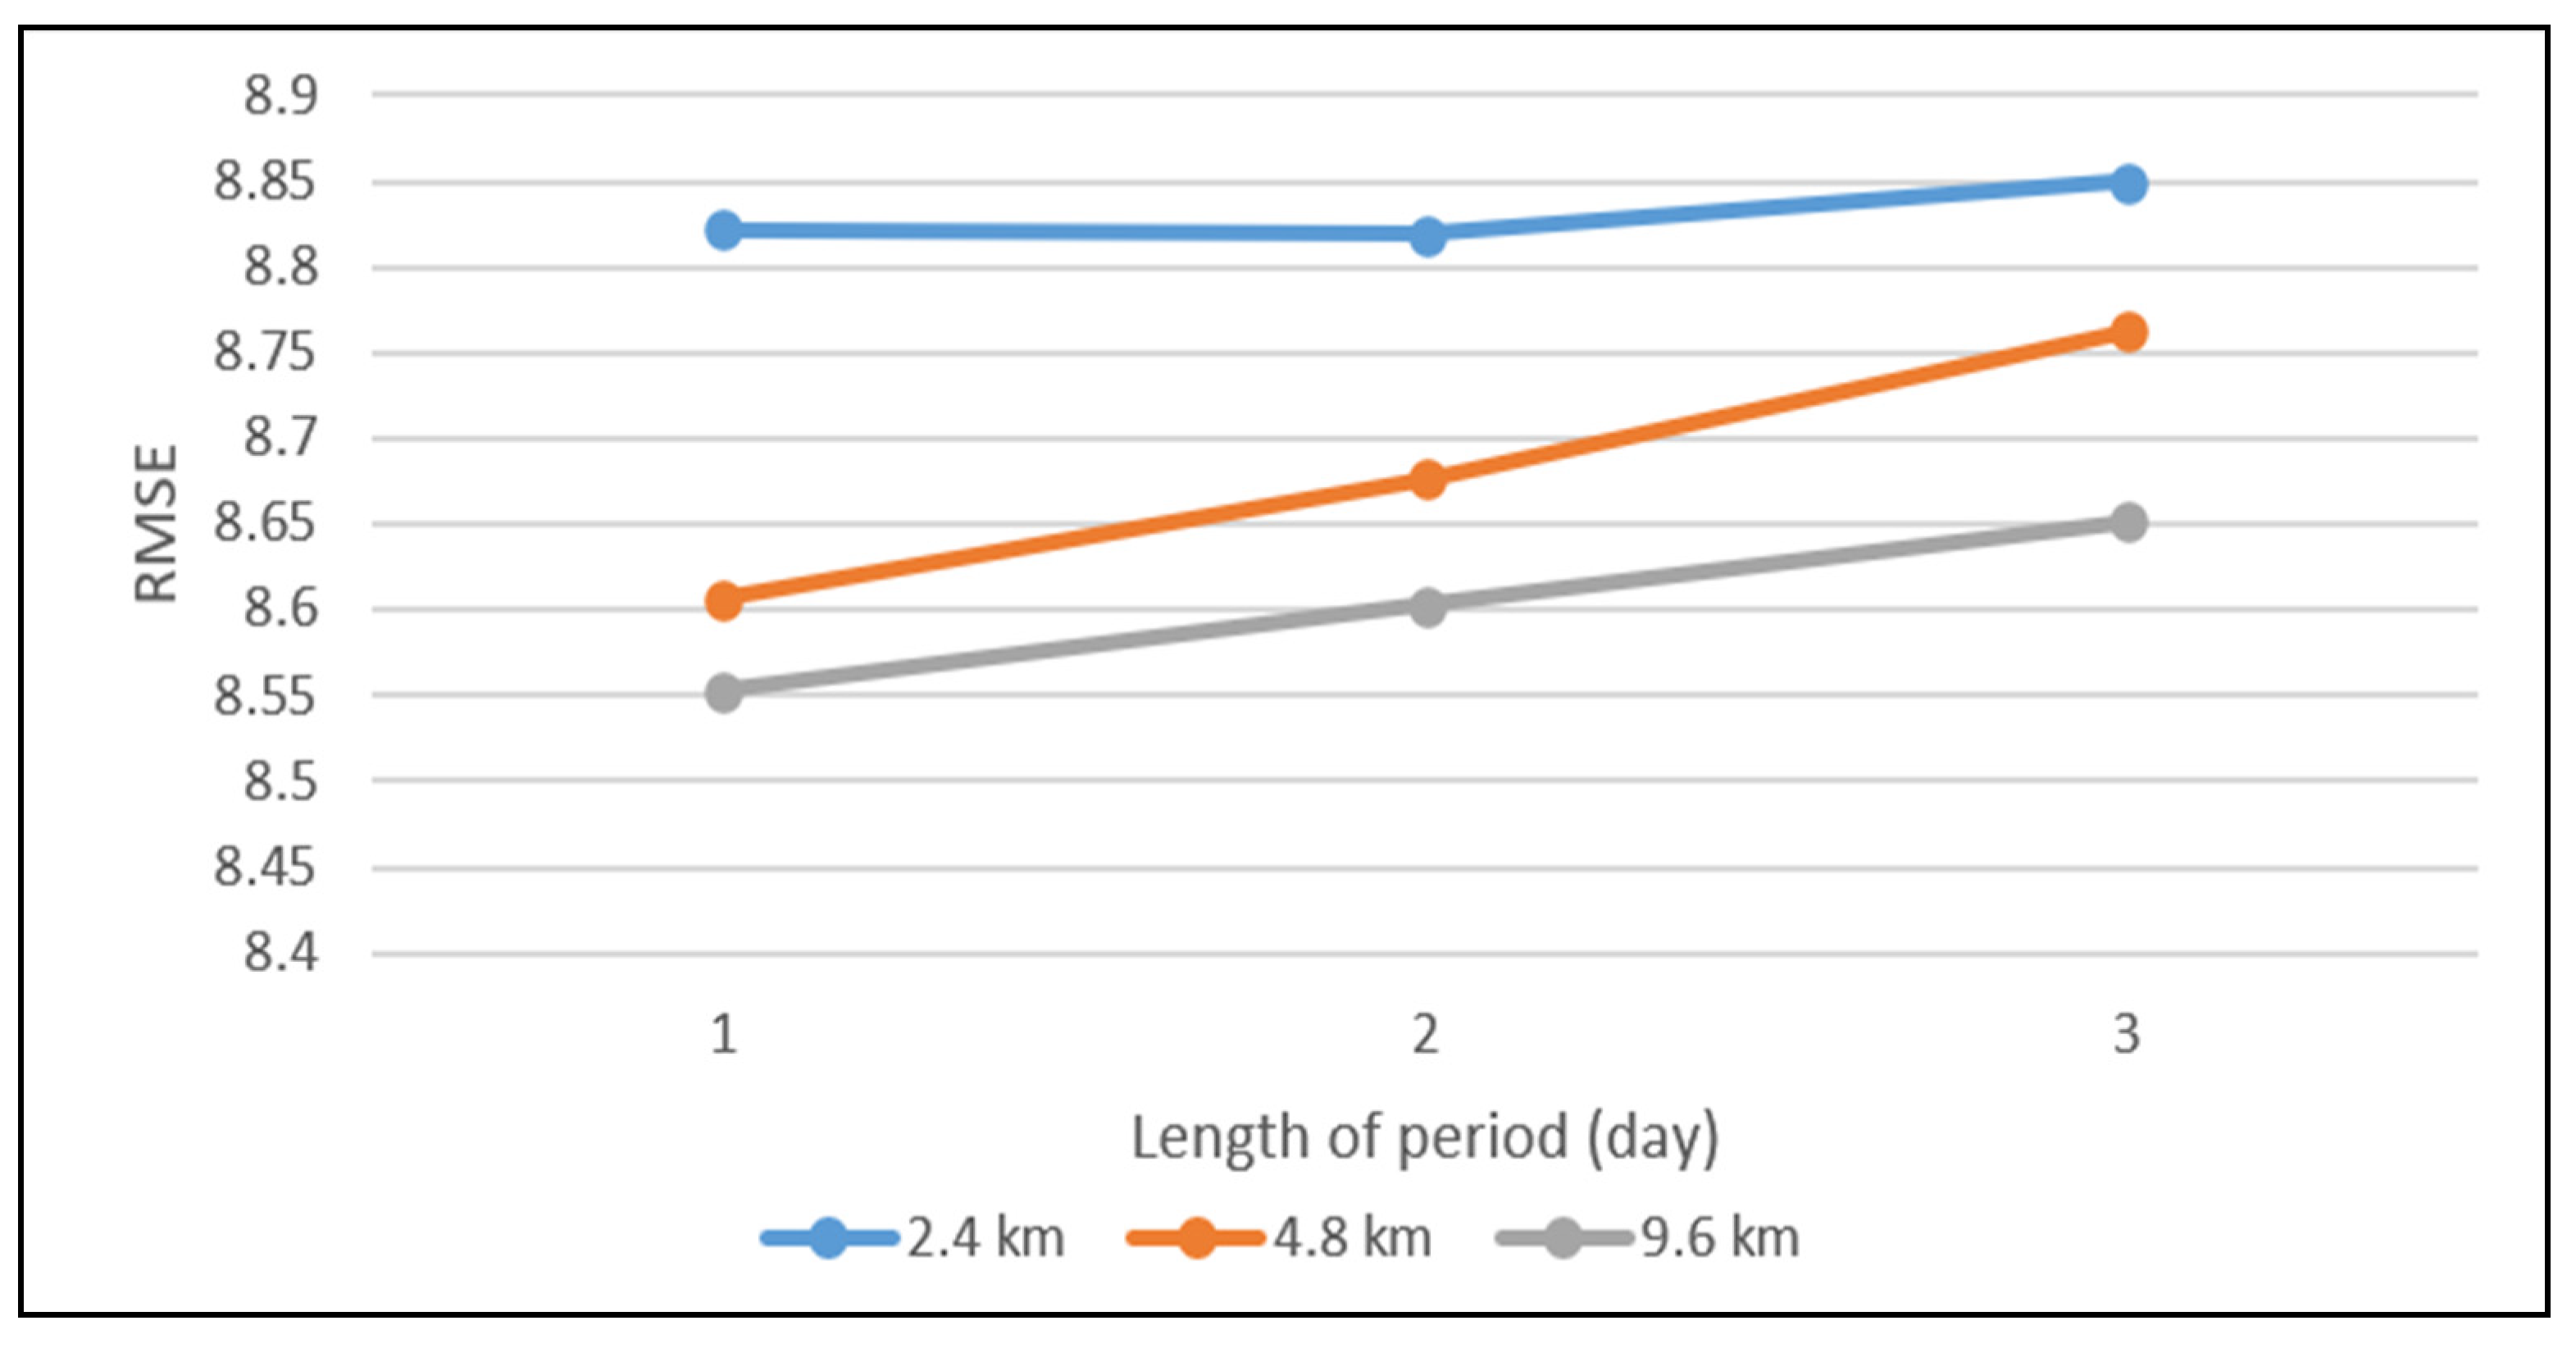
The ST-ResNet model predicts crime risk based on weather records as well as crime patterns including trend, period, and closeness (
Figure 4). The trend indicates the tendency of the number of crimes to increase or decrease. The period refers to the periodic pattern of crime at a certain time scale. Compared with distant ones, crimes committed closer together in time are more likely to be related. Therefore, “closeness” refers to the time distance between crime pairs. Following the research of Wang (2019), the experiment adopted hourly, daily, and weekly levels as the time spacings of the 3 crime periodic characteristics [
29].
Figure 4 shows the process of the ST-ResNet model. In the convolution step, multilayer convolution is selected to measure the relationship between nonadjacent regions. The 3 periodic components and the external component (weather) are fused via a parametric-matrix-based fusion method.
The model utilizes the historical crime spatial distributions and weather records to predict crime spatial distribution at time , where , ,…, are the layers representing crime spatial distributions at times , ,…, and , ,…, are the weather layers.
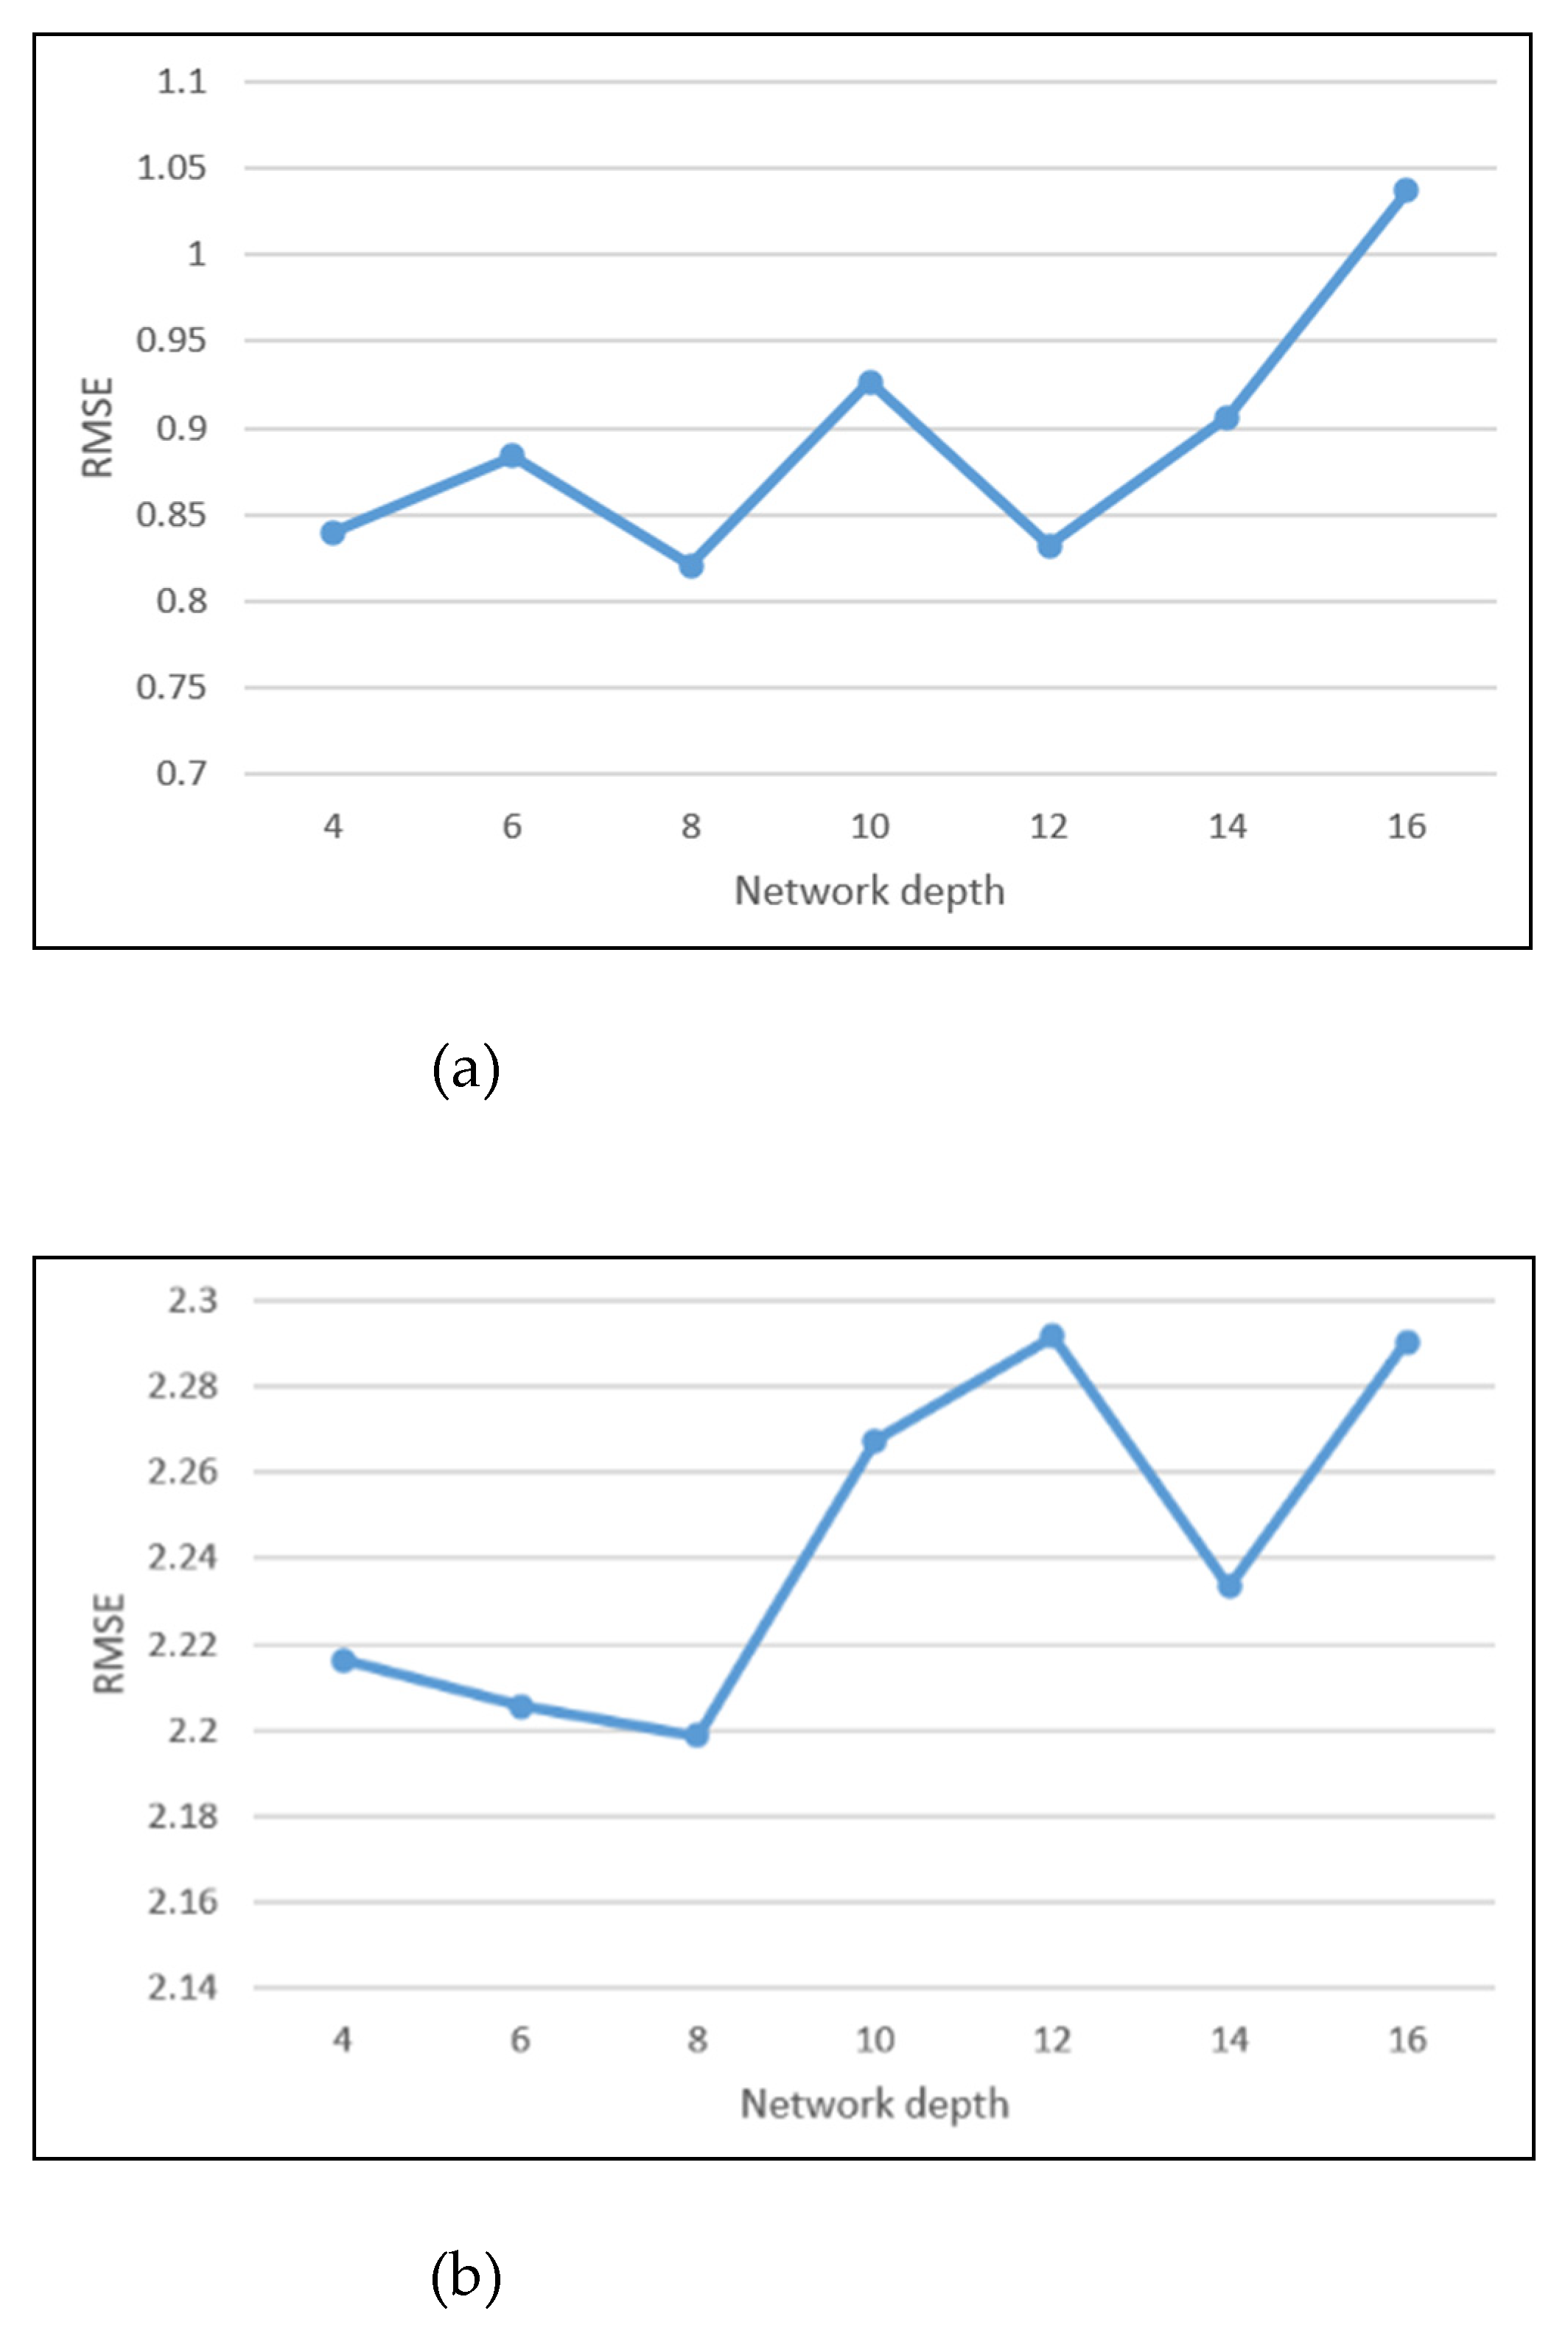
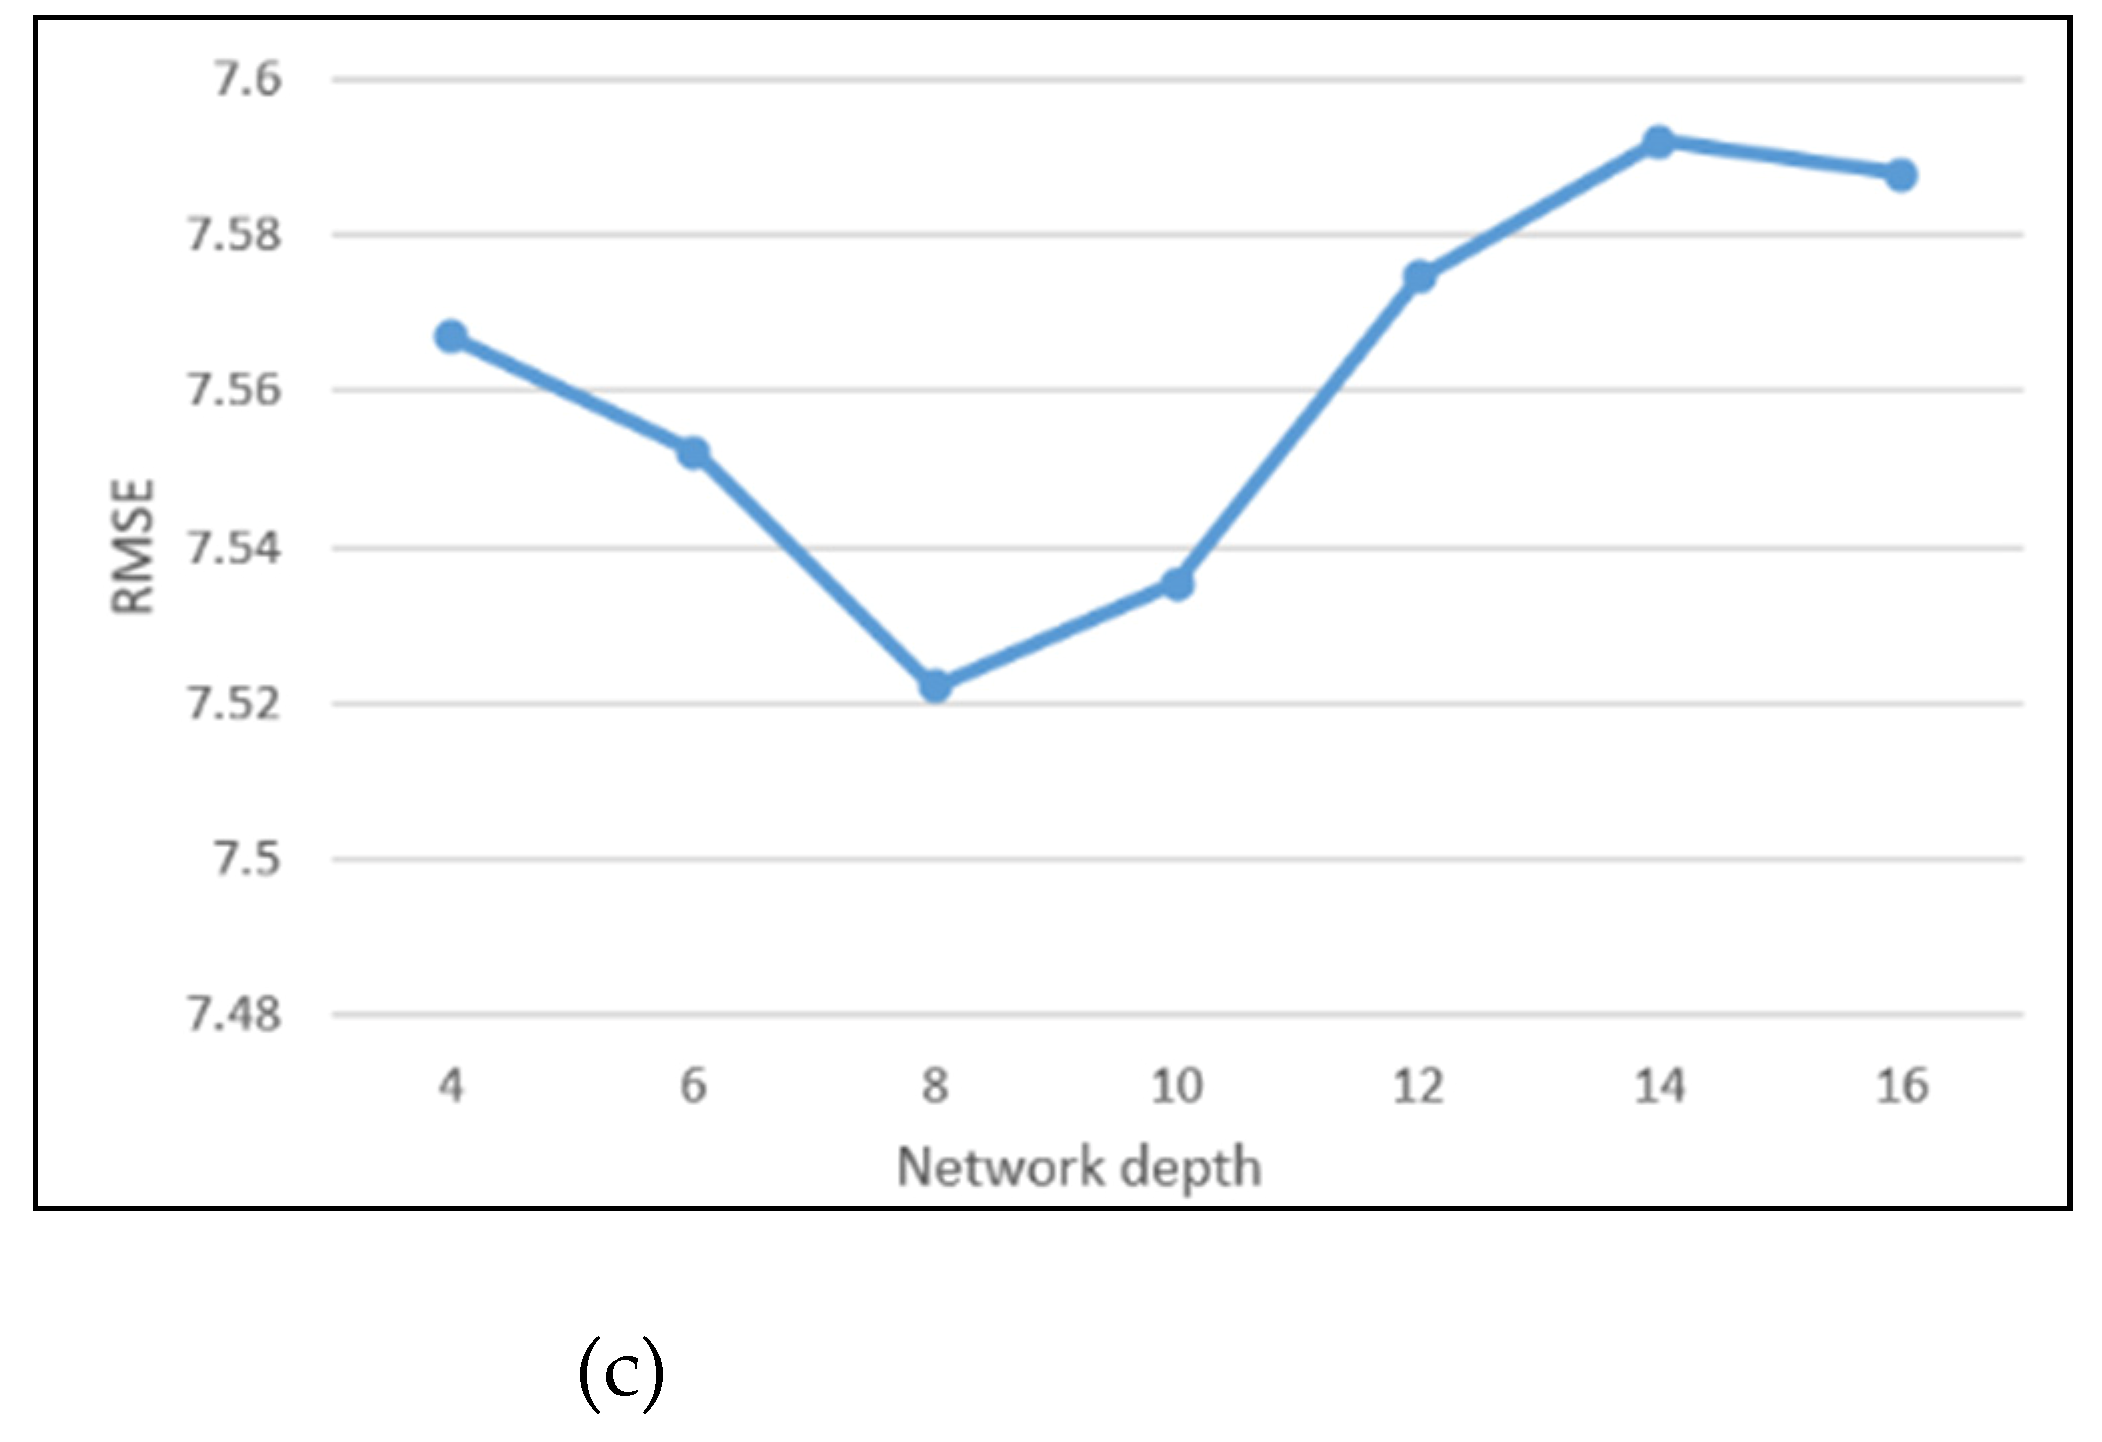
We minimized the root-mean-square error (RMSE) between the predicted crime matrix and the true crime matrix to train the model:
where
is the true value,
is the predicted value, and
Z is the number of training data points [
59].
The modeling process was conducted as follows: A training dataset (from January 2012 to December 2012) was used to train the model with cross-validation (20% validation ratio), and a test set (from January 2013 to October 2013) was used to test the final model. The model was trained over multiple iterations to select the final model, with the optimal tuning parameters based on minimizing the cross-validation error. Then, we made predictions about the test set using the final model and evaluated the prediction effect. Accounting for the fact that seasonal differences potentially influence results, for each month of the test set we repeatedly predicted crime events for each variation of the methodological parameters. That is, for each variation, predictions were made using a rolling window (e.g., when predicting for January 2013 using 1 year of historical data, the data from January 2012 to December 2012 were used for training; when predicting for February 2013, data from February 2012 to January 2013 were used; and so on): the prediction accuracy was calculated for each month and then averaged for each variation for the test set.
3.2. Accuracy Evaluation
The RMSE, which evaluates the difference between the predicted and the values observed, and the F1 score [
60], which evaluates the precision and recall, are scale-dependent. A commonly used crime prediction evaluation index is the prediction accuracy index (PAI) [
6]. This can be used to compare the accuracy of hotspots calculated by different methods via extremely simple calculations and can compare the prediction results at different resolutions and magnitudes. The general form of this variable is as follows:
where
is the number of crime events in areas where crimes are predicted to occur.
is the number of actual crime events in the whole study area.
is the area of regions where crimes are predicted to occur.
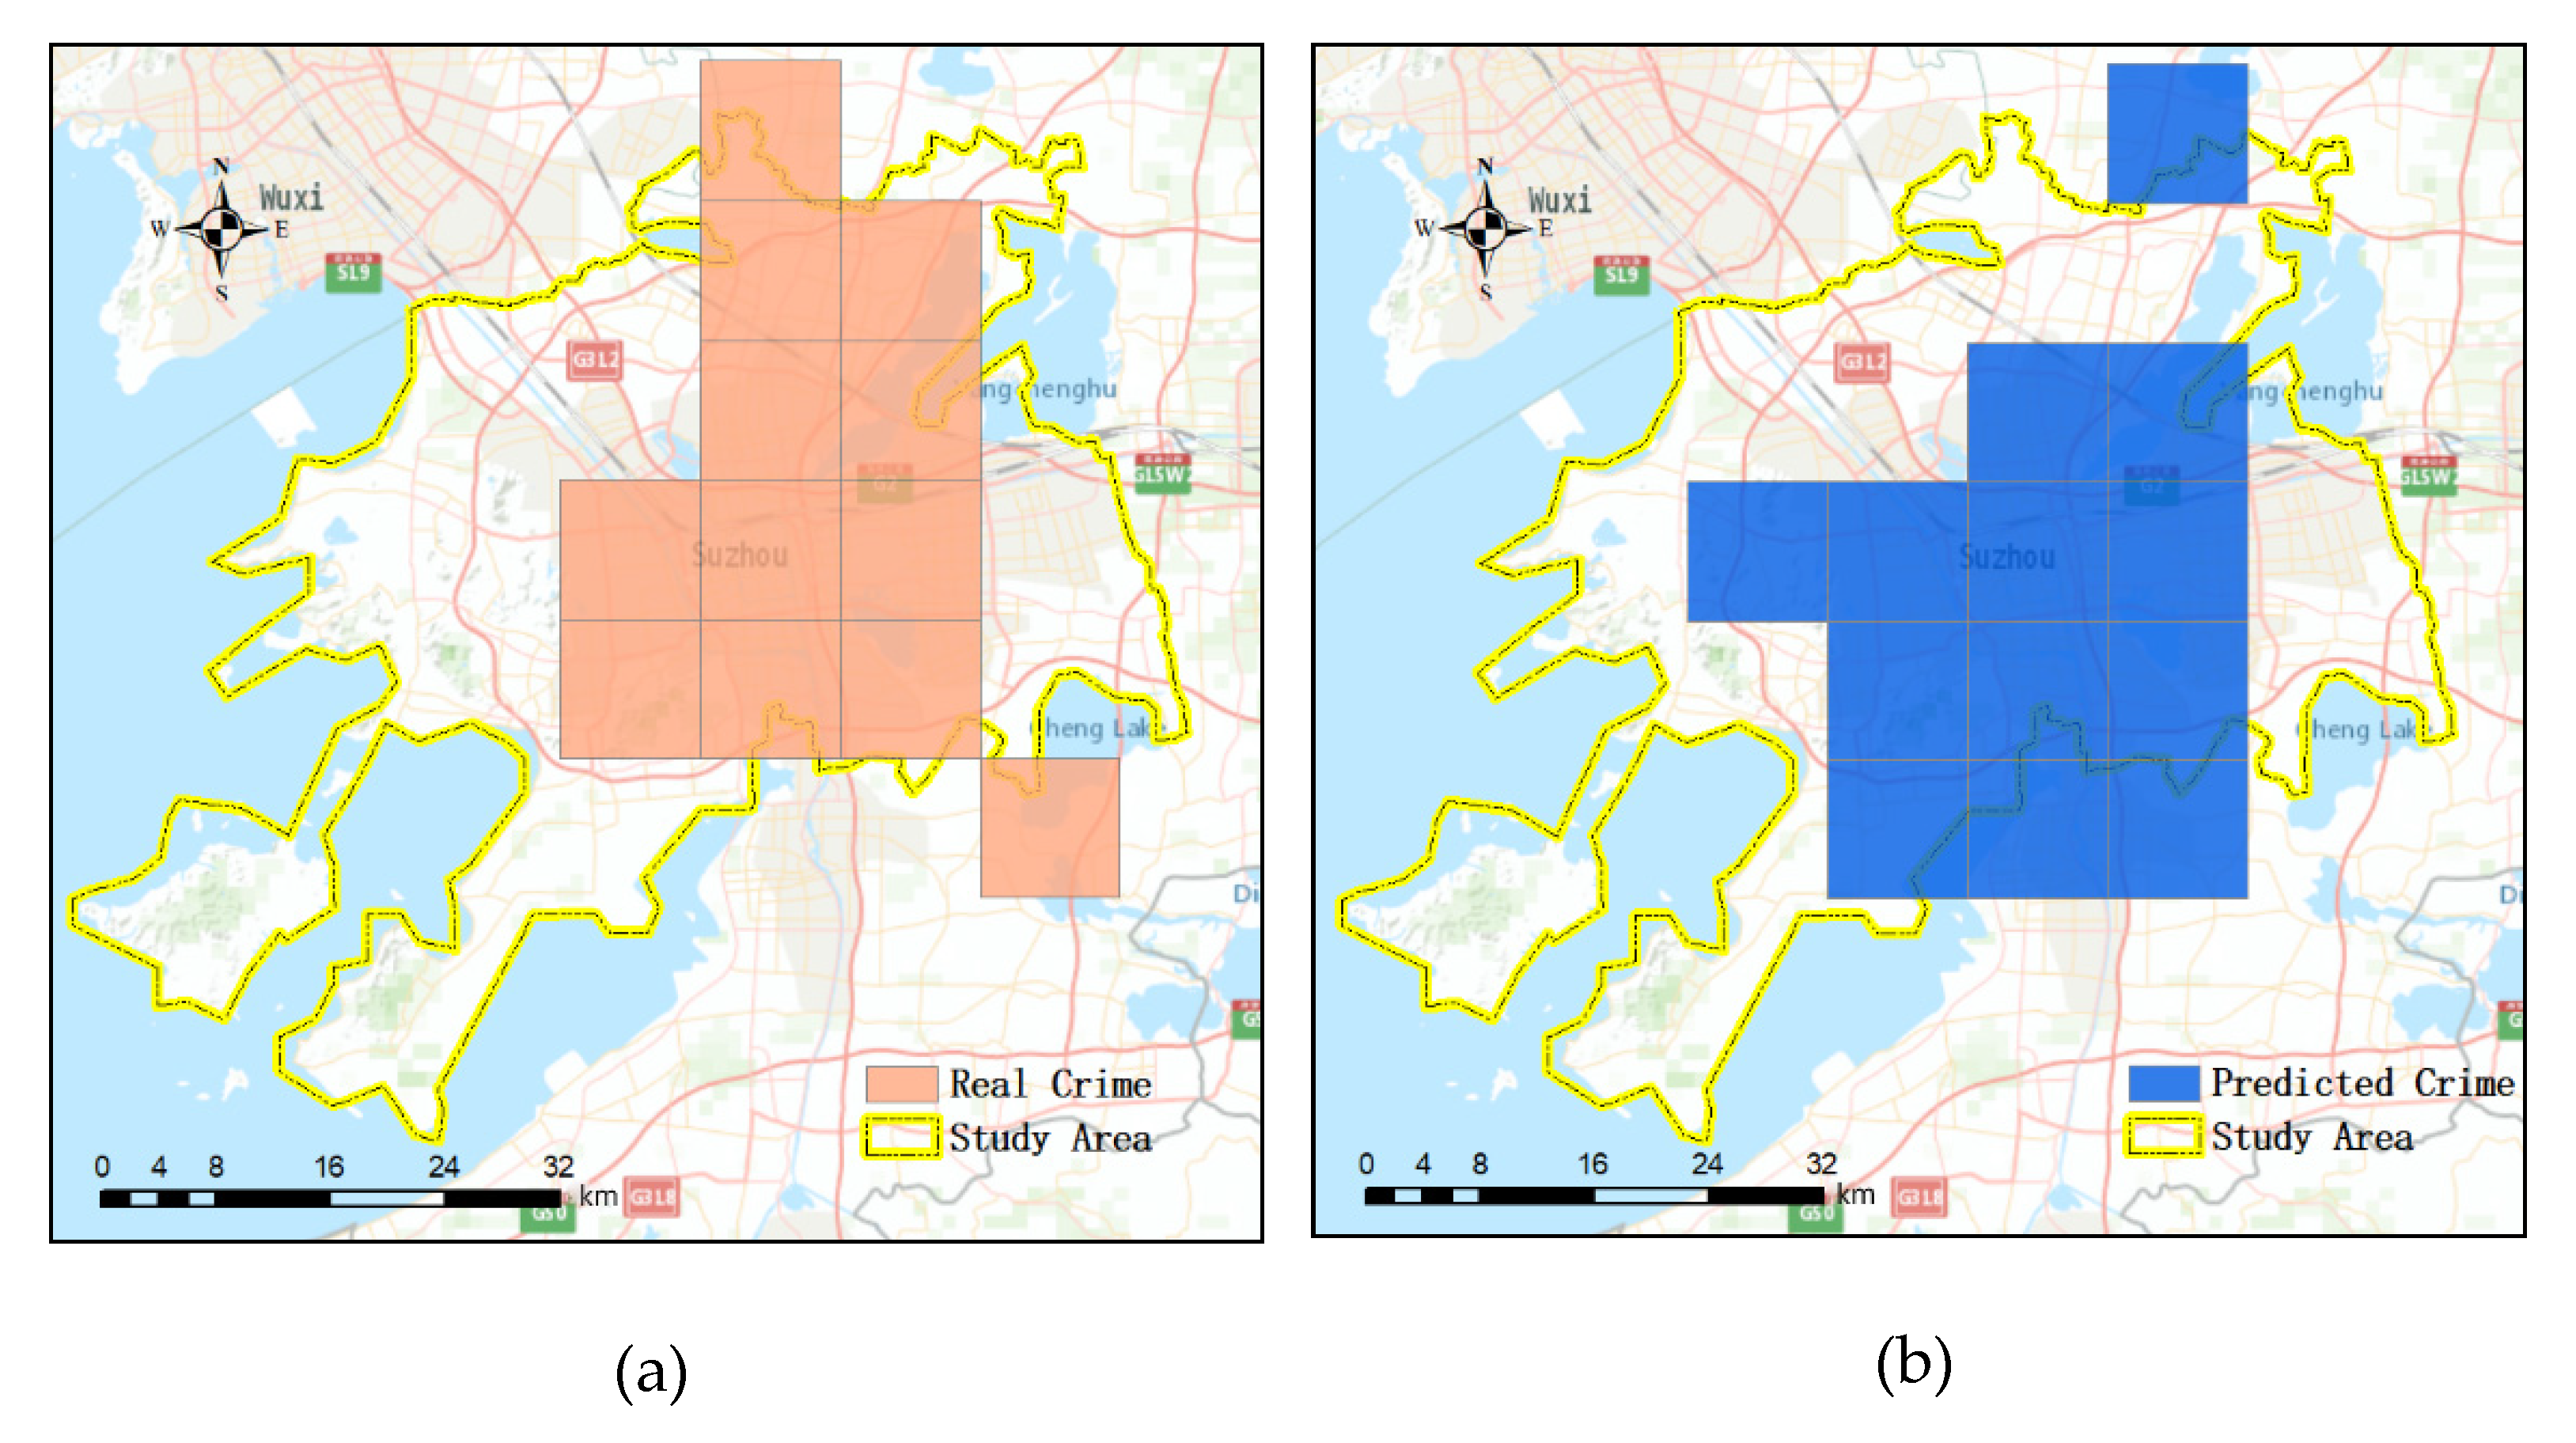
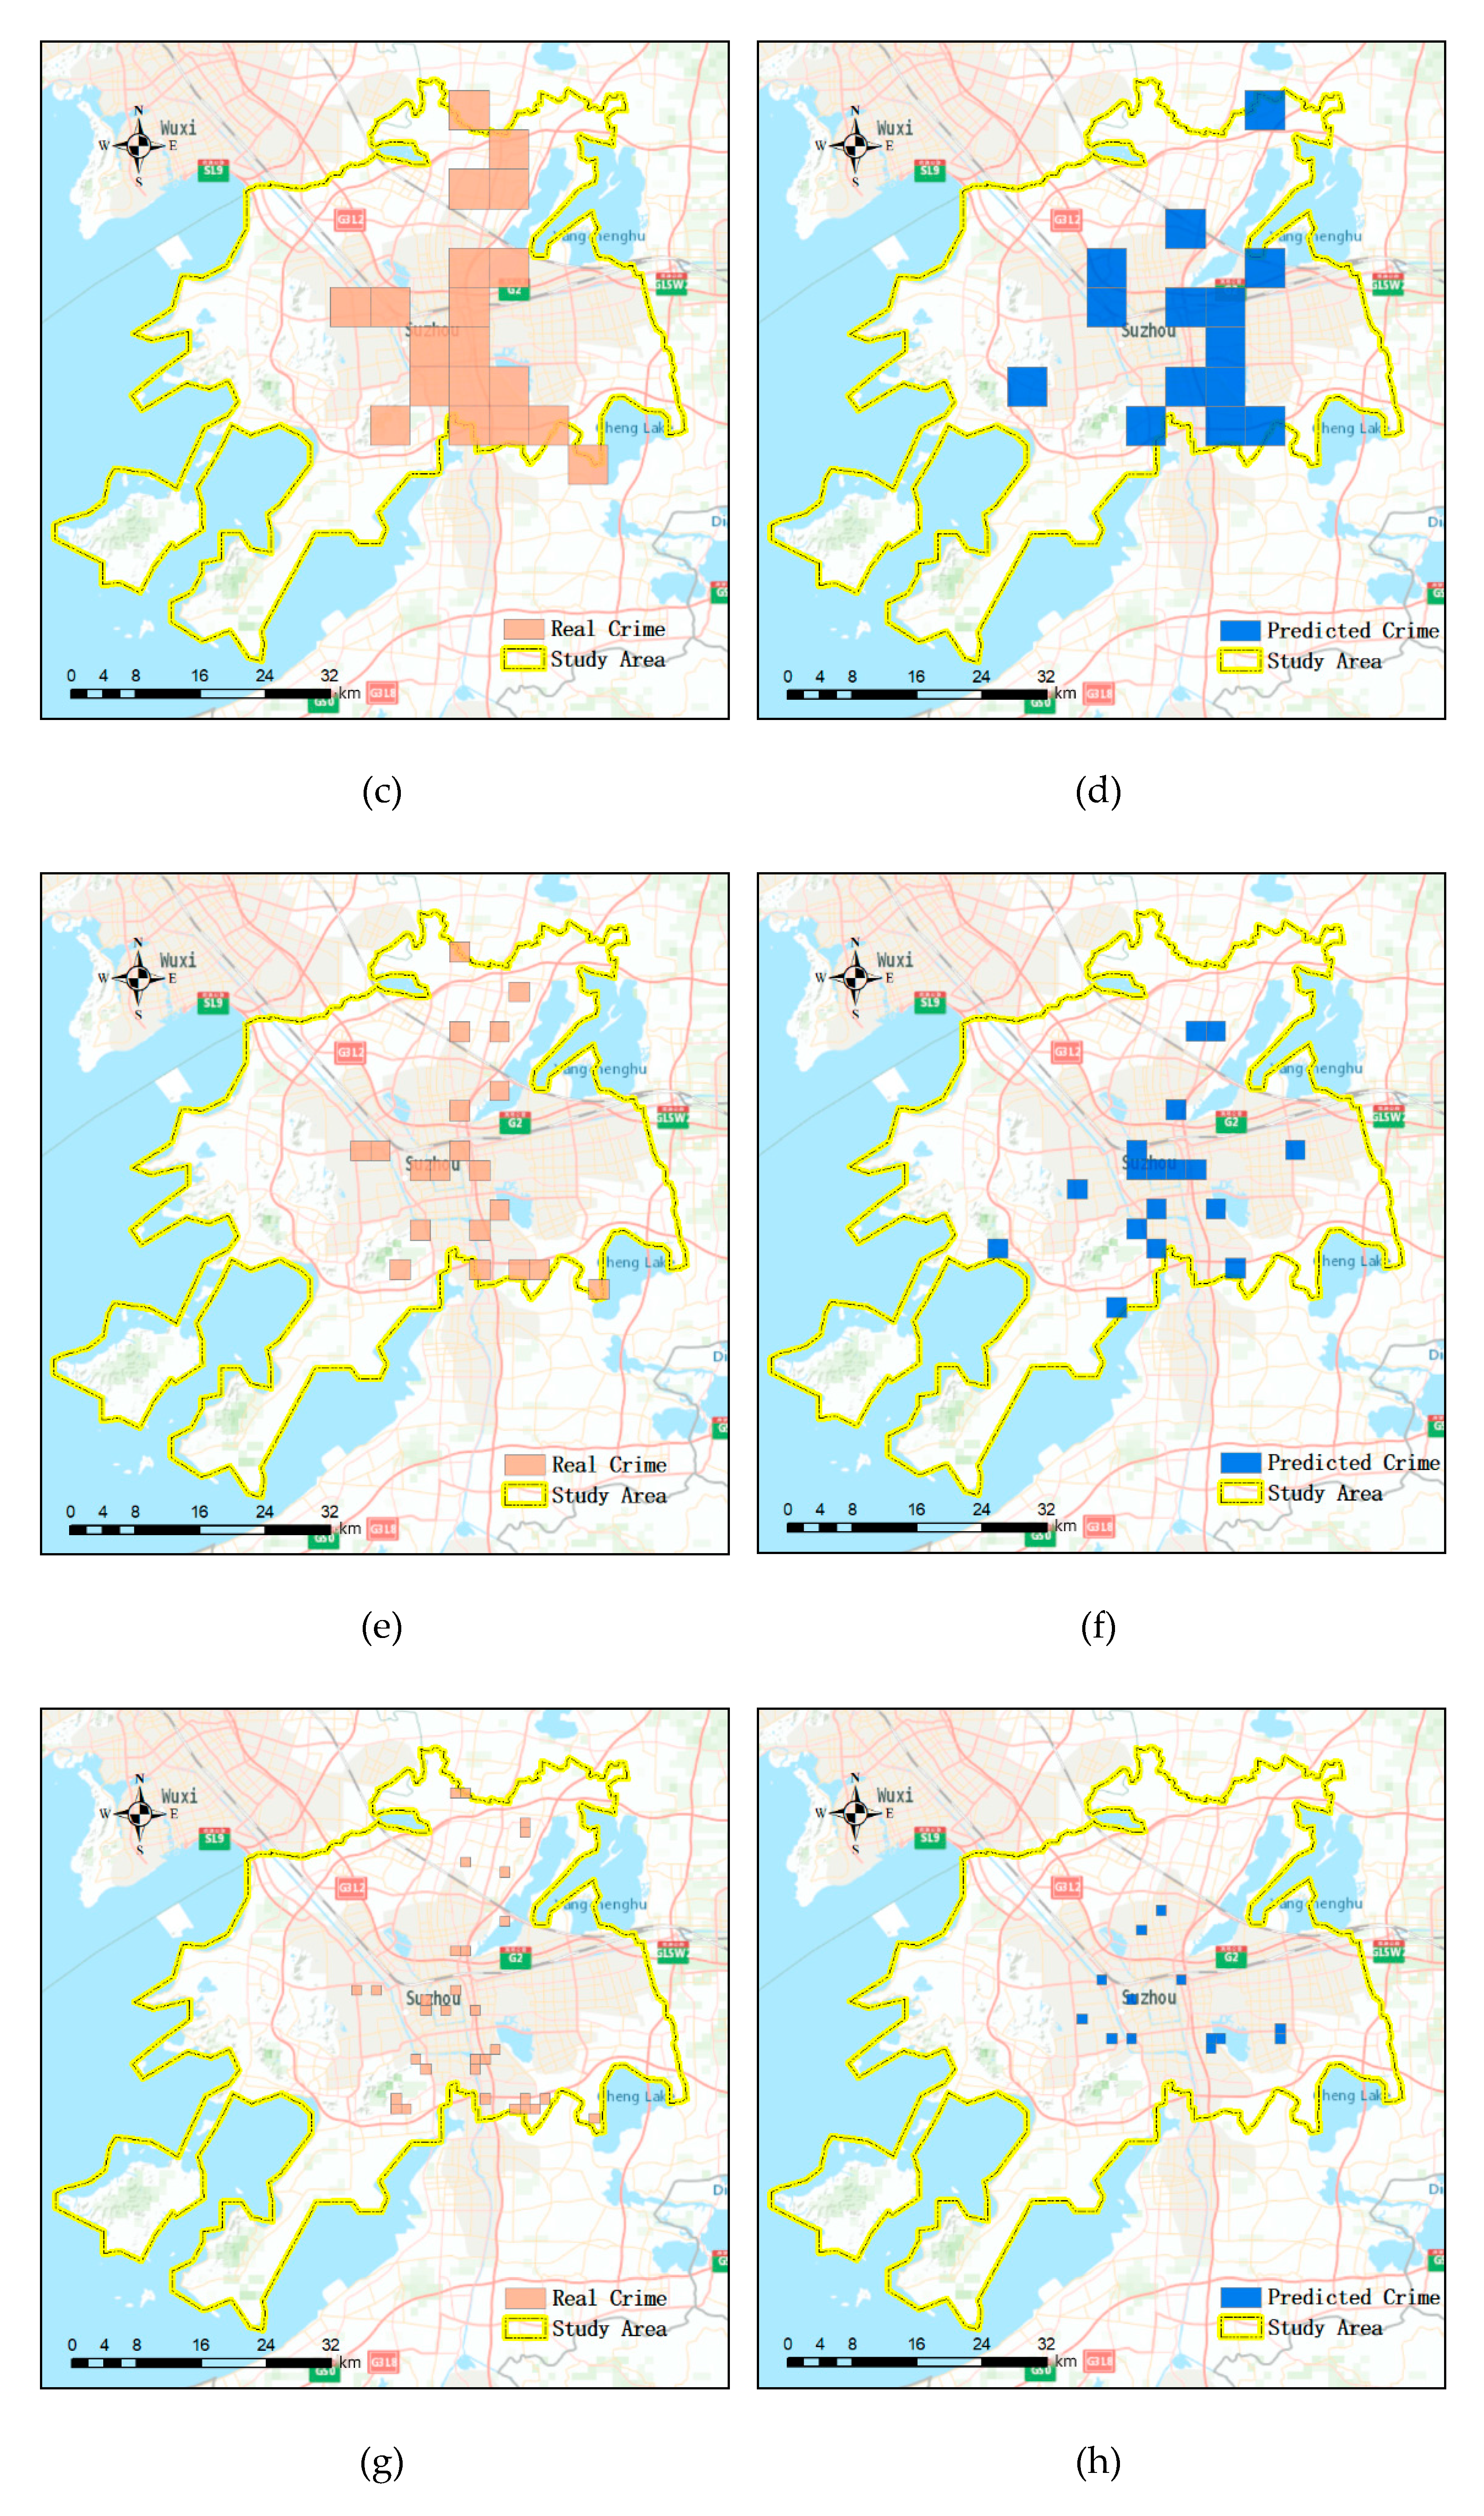
is the area of the study area. The PAI can be considered as the hit rate in areas where crimes are predicted to occur with respect to the size of the study area. The higher the hit rate and the better the prediction effect, the higher the PAI will be.
5. Conclusions and Future Work
We proposed an adaptive spatial resolution method to select the best spatial resolution for crime prediction at hourly temporal scales based on the ST-ResNet model. In this paper, we discussed the property crime distribution characteristics and the corresponding weather impact factors. Interactive relationships between crimes close in time were confirmed. The periodic characteristic of crime in days and weeks was tested. Spatially, crimes are often clustered, and the degrees of regional crime event clustering at different spatial resolutions are distinct. A pyramid layering model was built to perform the information of different resolutions. The method we proposed can improve the accuracy of the hourly crime prediction model adopted in the research of Wang (2019) by selecting an optimal resolution for it [
29]. We believe the current results can be used to allocate police resources more efficiently.
In this study, the results showed that the optimal unit of analysis was neither the finest nor the broadest considered, but an intermediate unit. This is consistent with the research of Ramos et al. (2020) and Malleson et al. (2019) [
44,
45]. Ramos et al. (2020) recommended crime maps with intermediate granularity as being the most reliable, because coarse granularities may mask crime hotspots and too-fine granularities may make crime counts unstable and unrepresentative [
45]. Similarly, Malleson et al. (2019) recommended medium-granularity maps for point data aggregation because they can balance the benefits of smaller units (important heterogeneity which will probably be hidden in larger units is apparent when using smaller units) and the drawbacks of larger ones (including unstable and unrepresentative crime counts) [
44].
By contrast, some researchers concluded that “smaller is better” in granularity choice for crime analysis [
39,
43]. These studies focus on the impact of the social environment on crime level from a micro view. A micro-view analysis may provide the relationship between crime level and its impact factors in small areas. However, these results cannot be used for police deployment. Our method is used to find the most appropriate unit for improving the hit rate of the predicted crime hotspots. The result is expected to improve the local police deployment and deter crime.
Many factors can affect criminal behaviors, and their impact varies in different situations. The occurrence of crime is usually the result of multiple factors. This paper only discusses the temperature factor, and the auxiliary explanation is insufficient. More factors will be considered in future work. Their impact on crime will be analyzed and combined to improve the interpretation of crime to improve the prediction accuracy.


