
Assessment and Visualization of OSM Consistency for European Cities


Abstract
:1. Introduction
2. Background
2.1. VGI Quality Assessment
- Coherence with other sources of corresponding data (which are not considered as references) through comparison (e.g., geometric attributes such as the distance between corresponding elements or overlaps);
- External logical consistency between VGI and non-corresponding data available in other data sources;
- Internal logical consistency of the VGI dataset itself;
- Metadata (e.g., the number of versions, features corrections, stability against changes, observation methods, used equipment, and date of observation).
2.2. VGI Quality Visualization
2.3. VGI Consistency
3. Assessment and Visualization of Topo-Semantic Consistency in OSM
3.1. Internal Logical Consistency
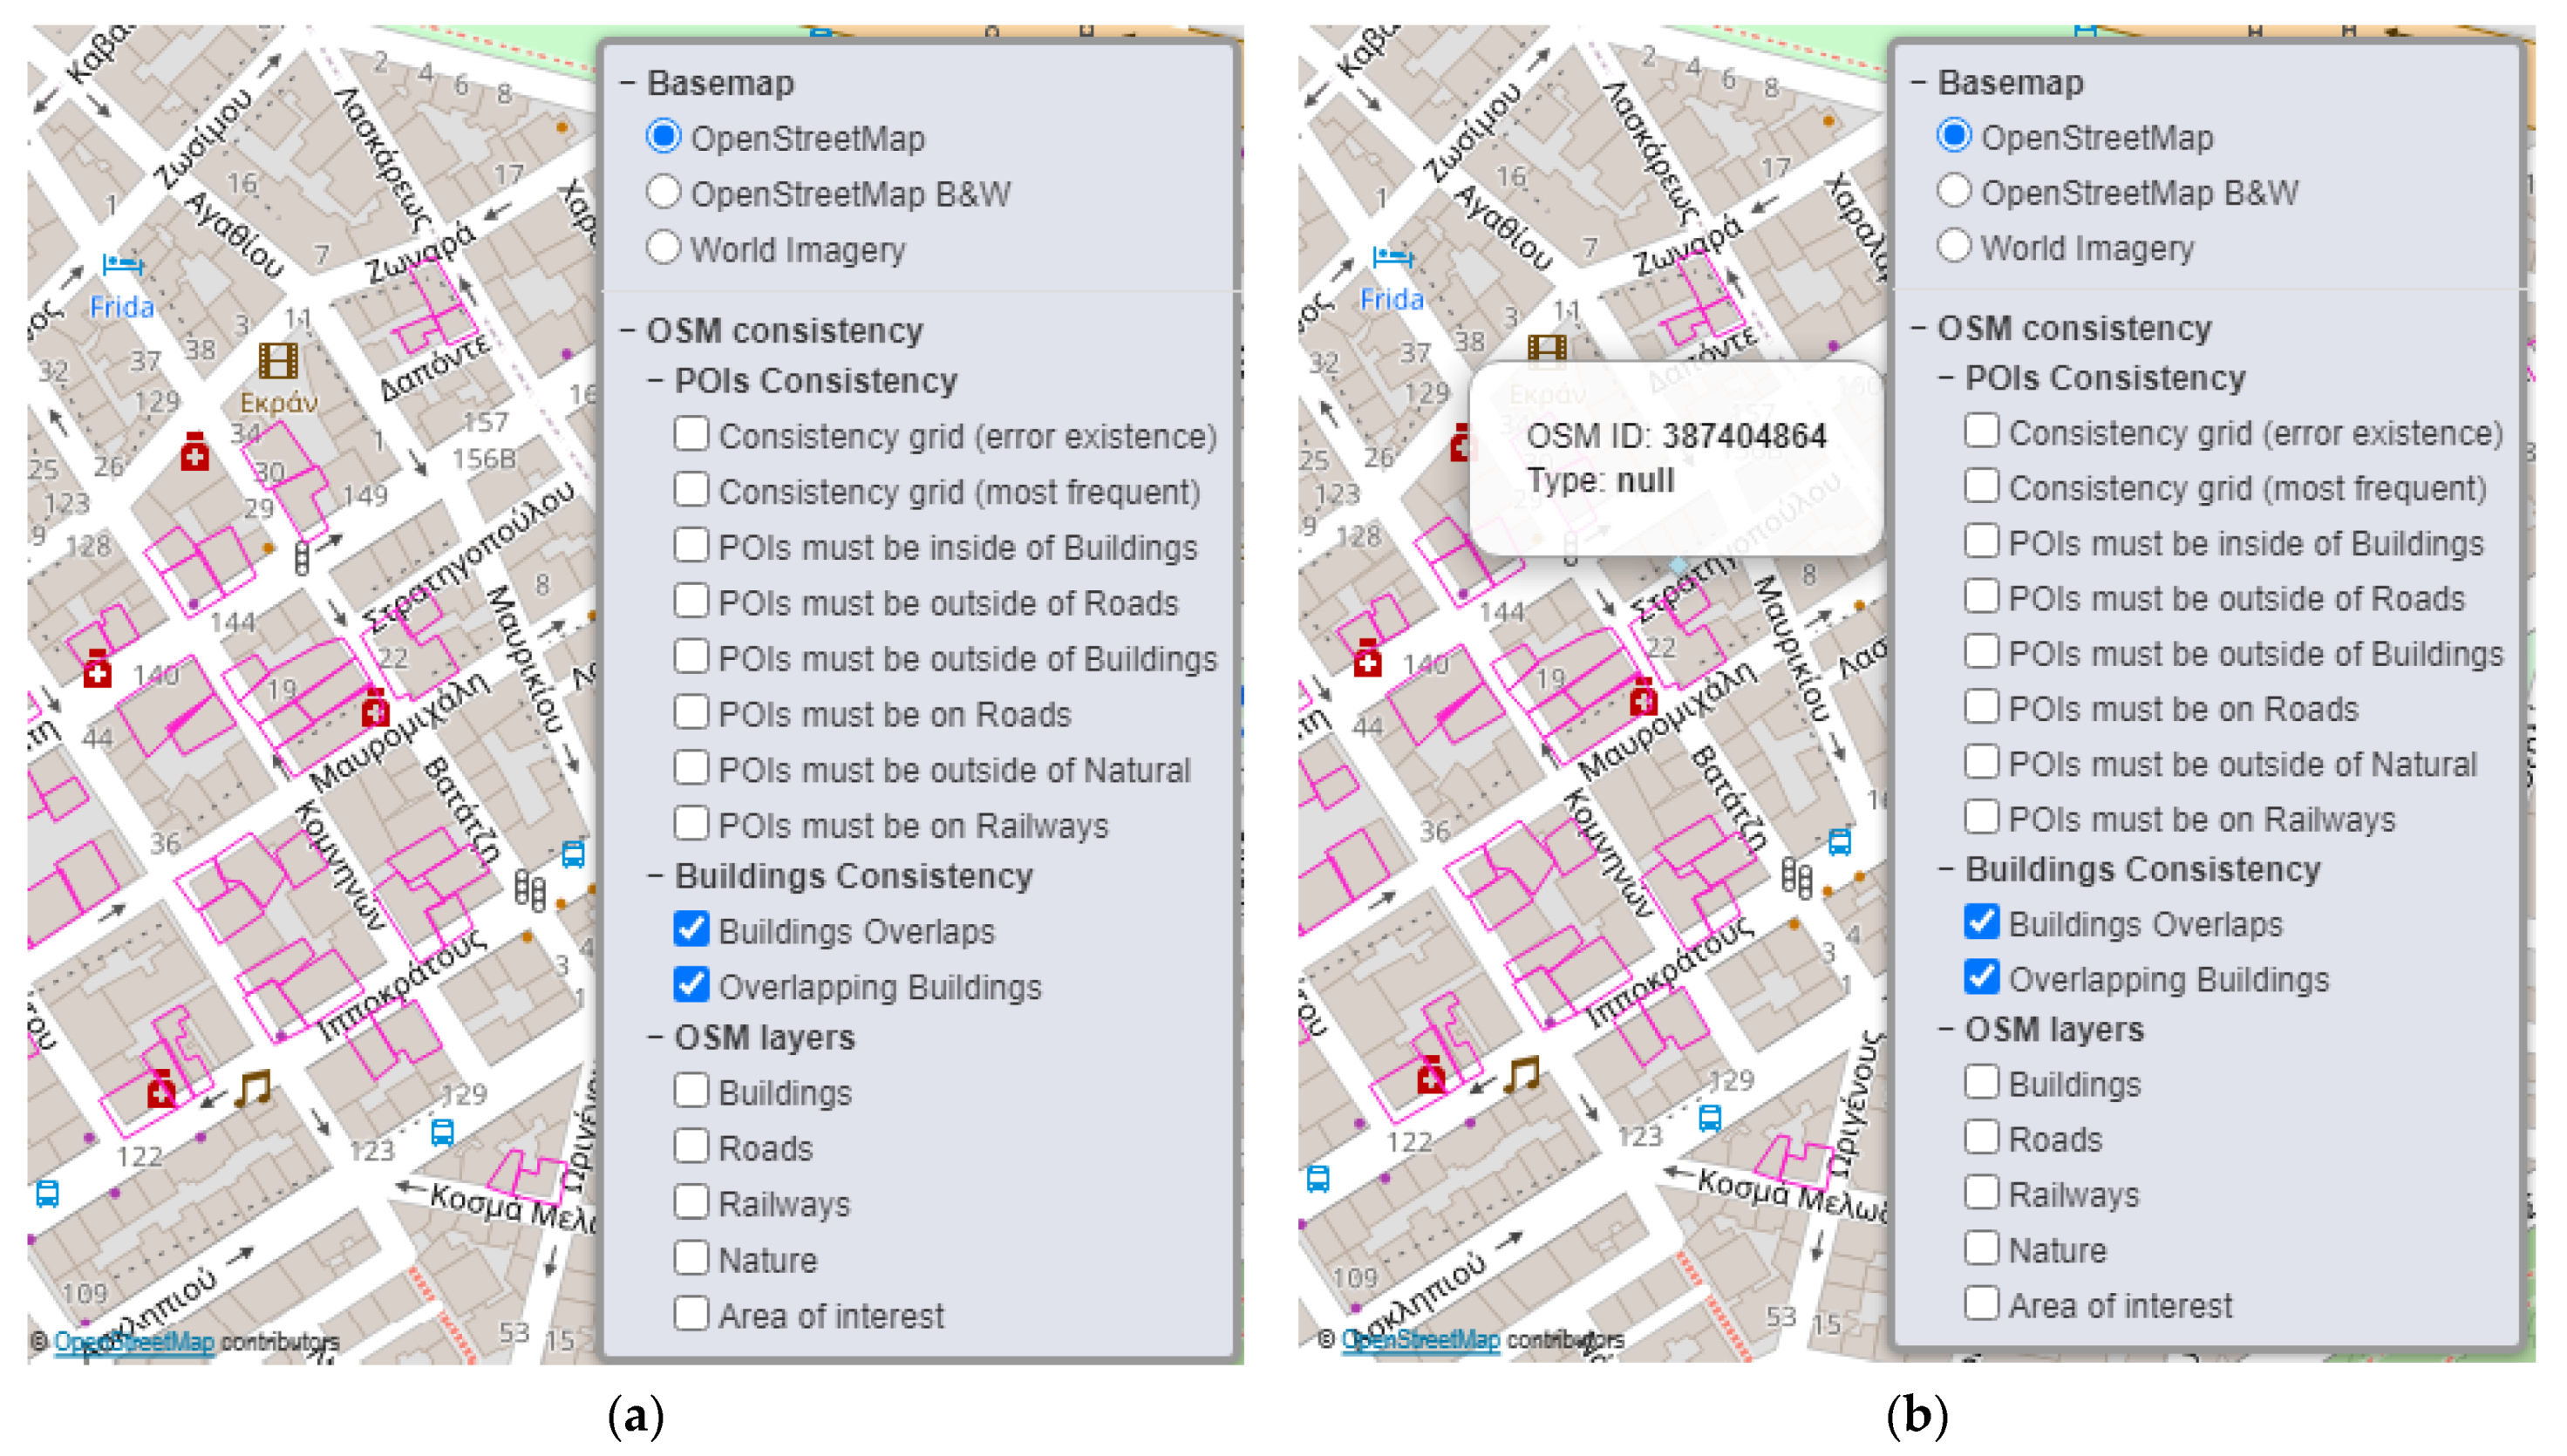
- Buildings must not overlap;
- Roads must not overlap, must not self-overlap, must not self-intersect, must not overlap with railways, and must not overlap with waterways.
3.2. External Logical Consistency
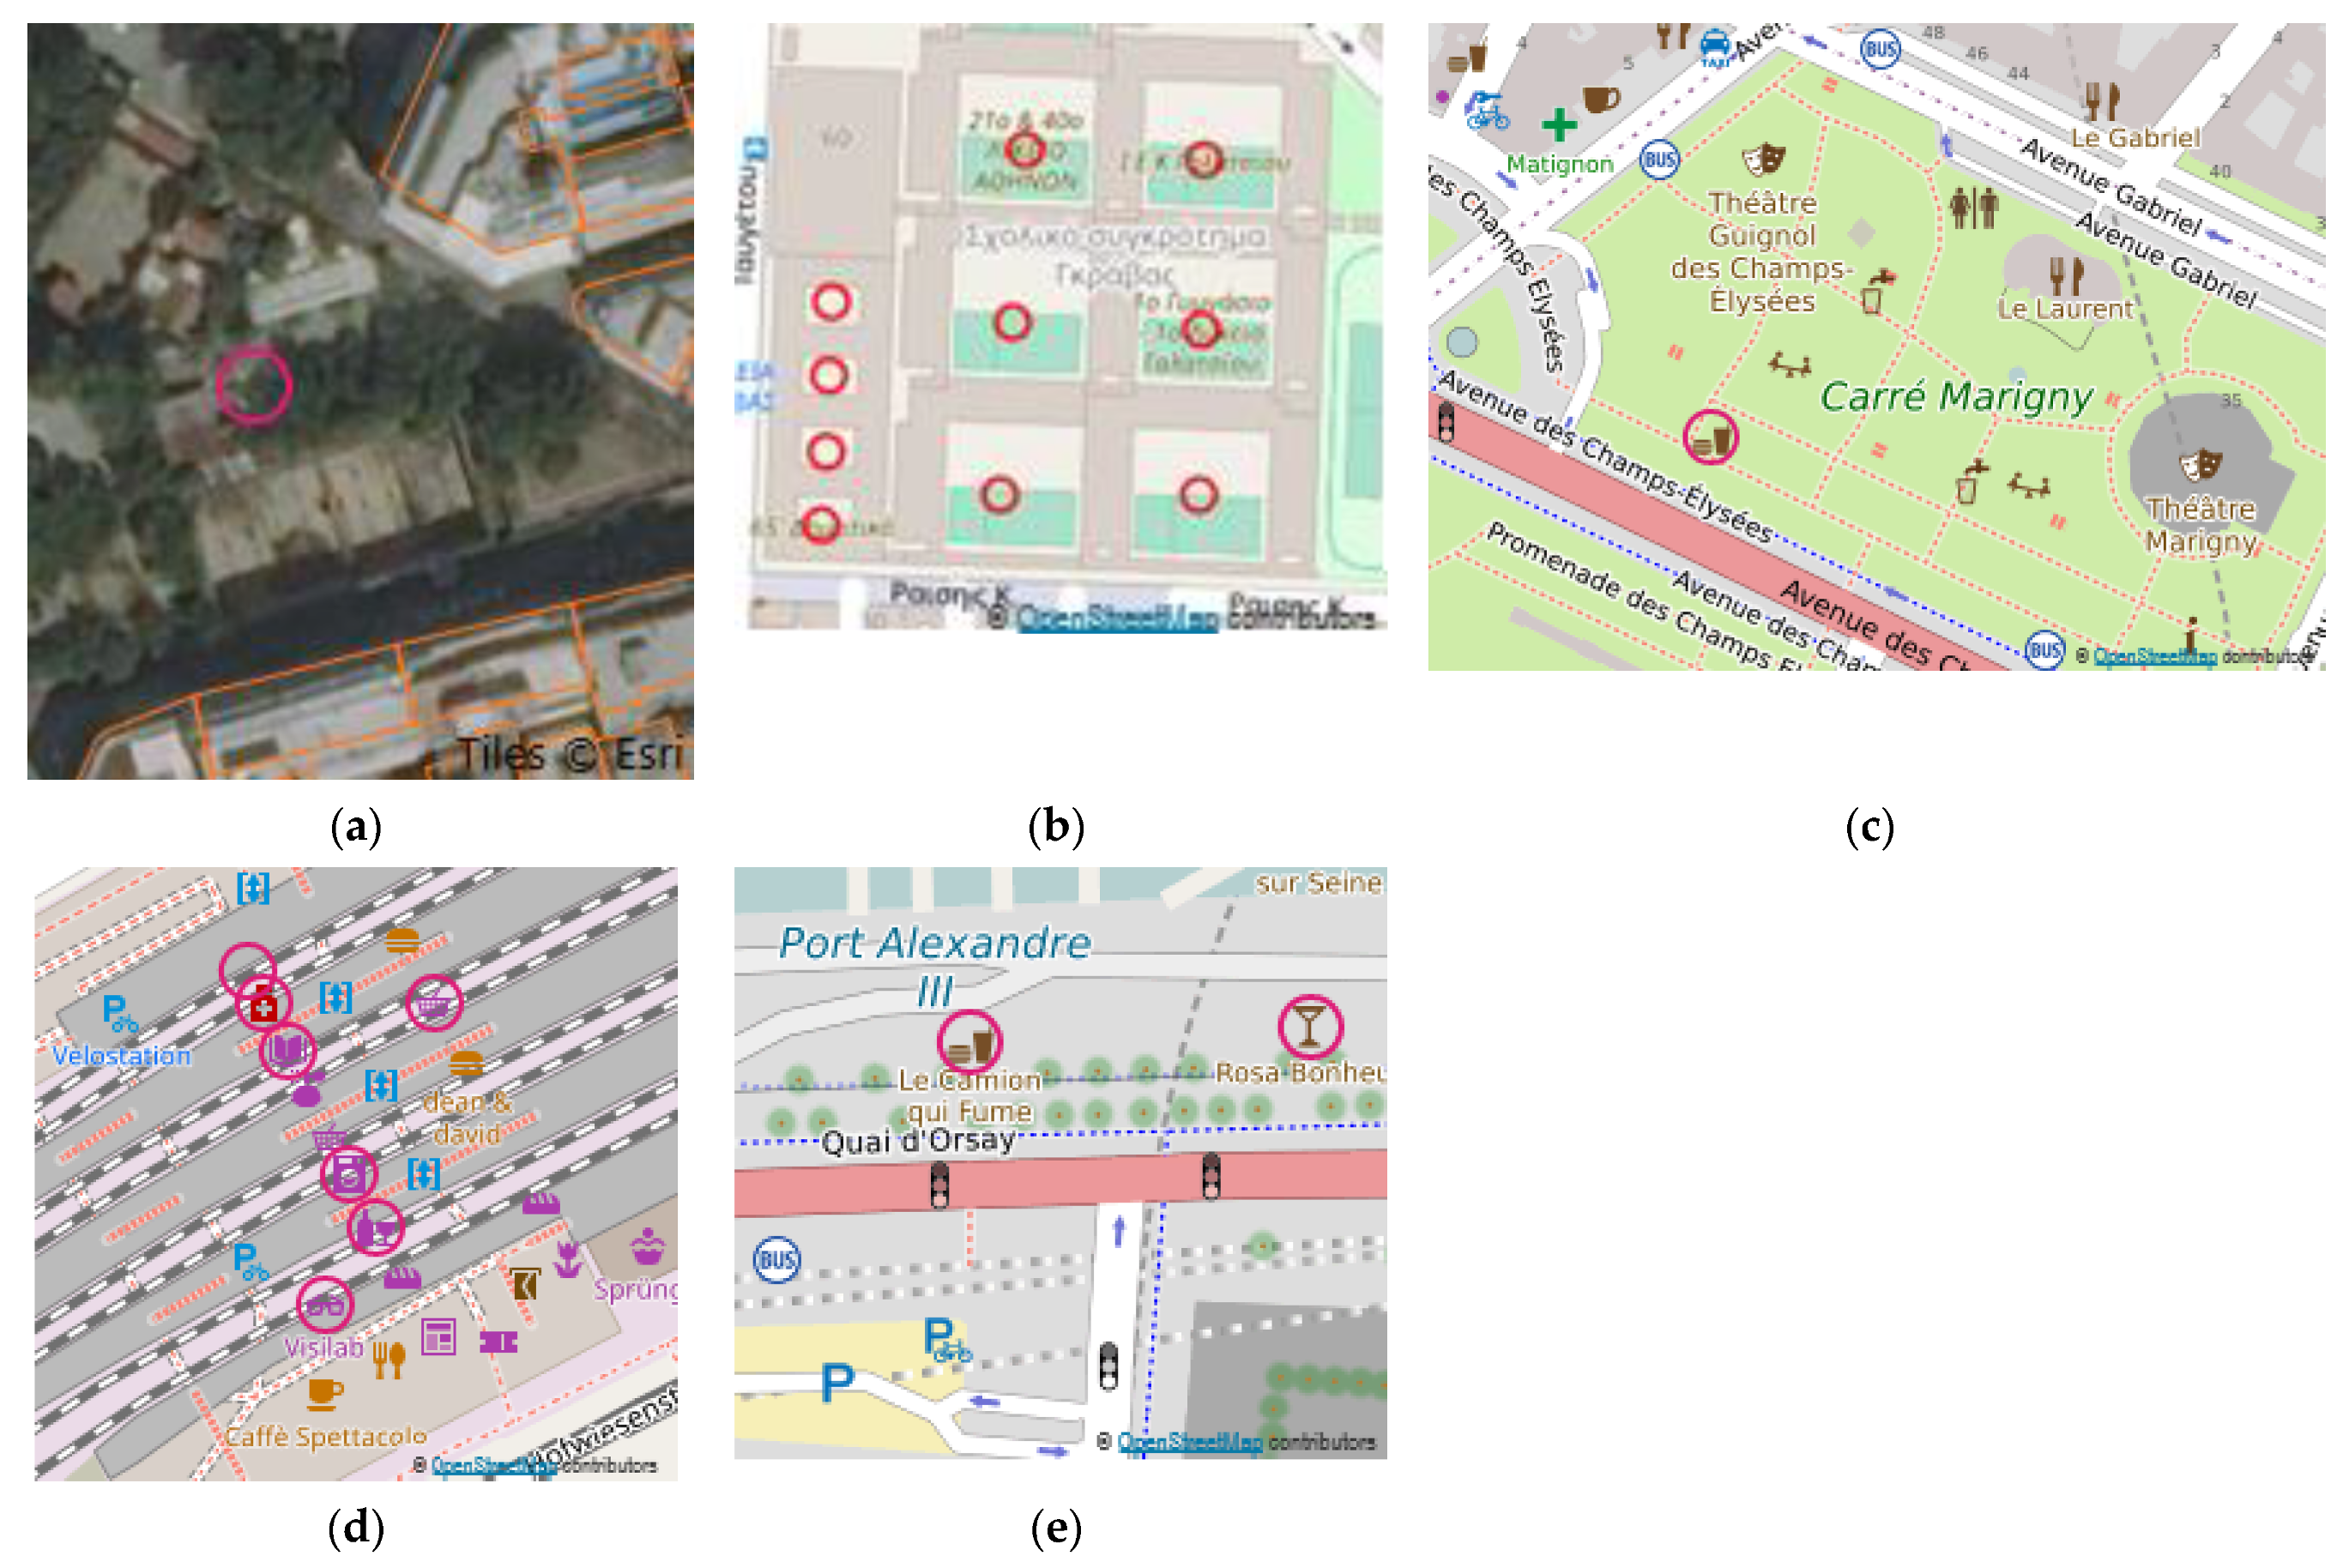
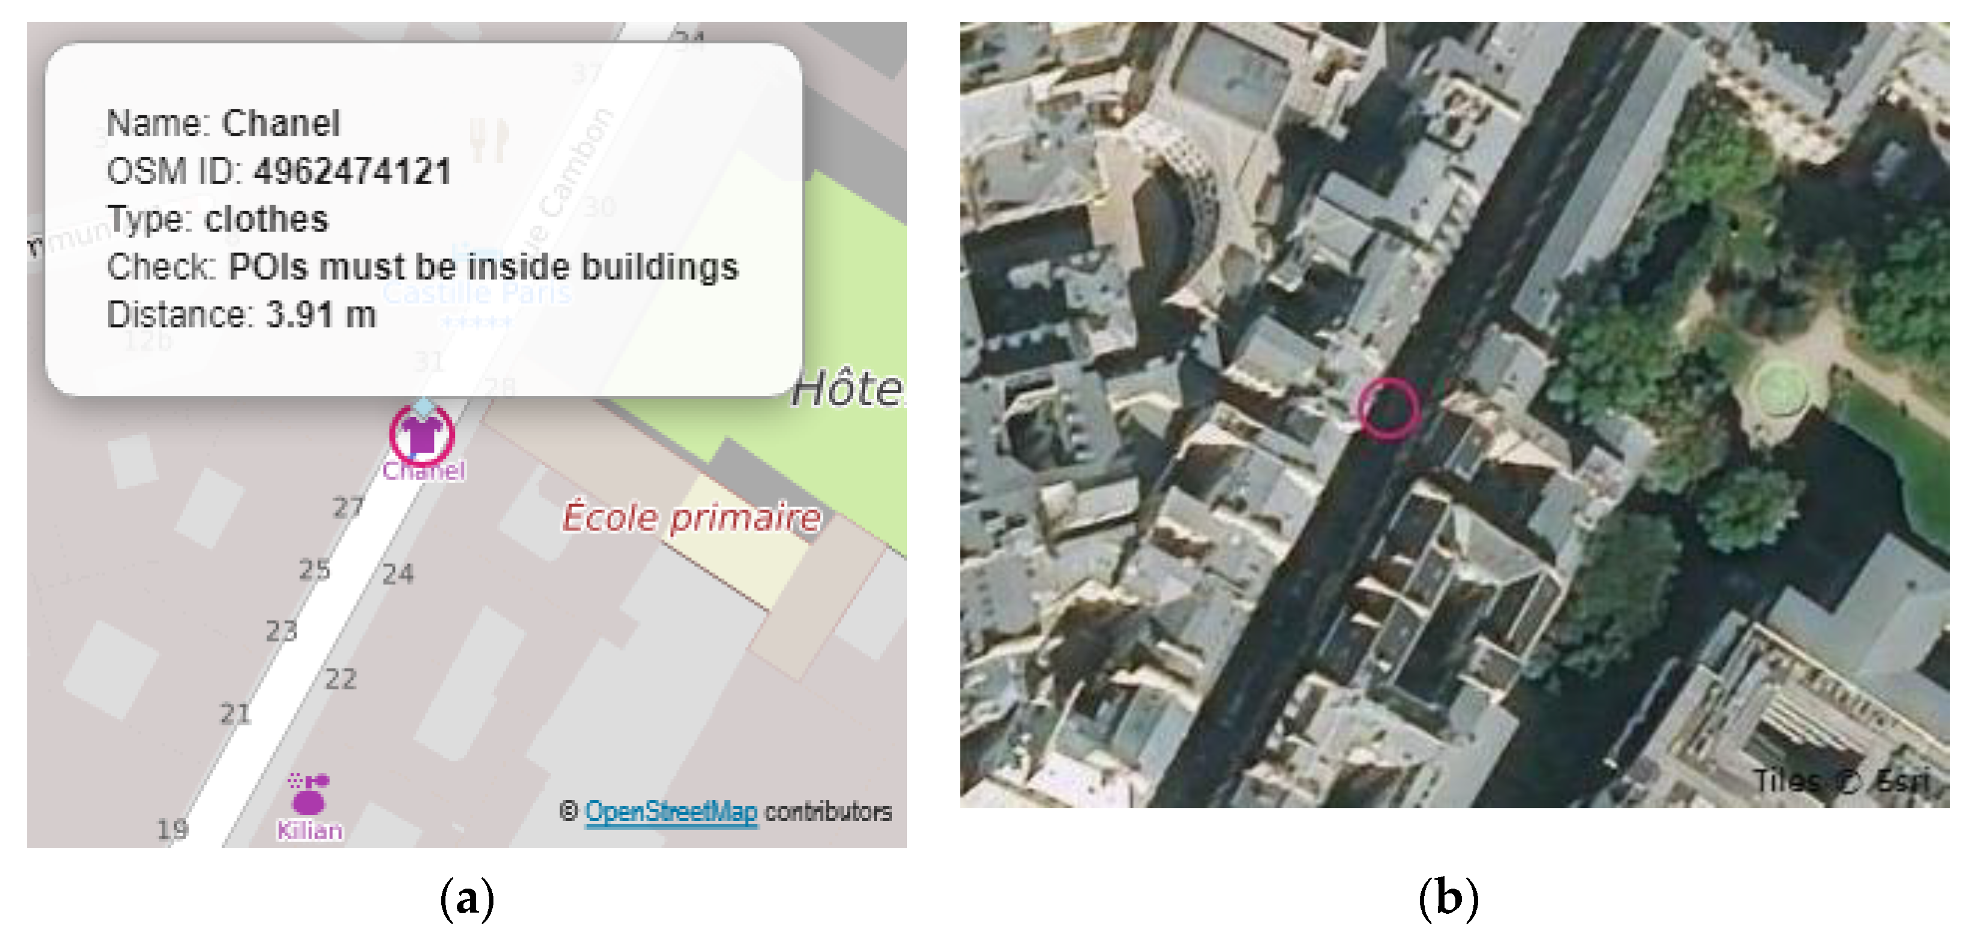
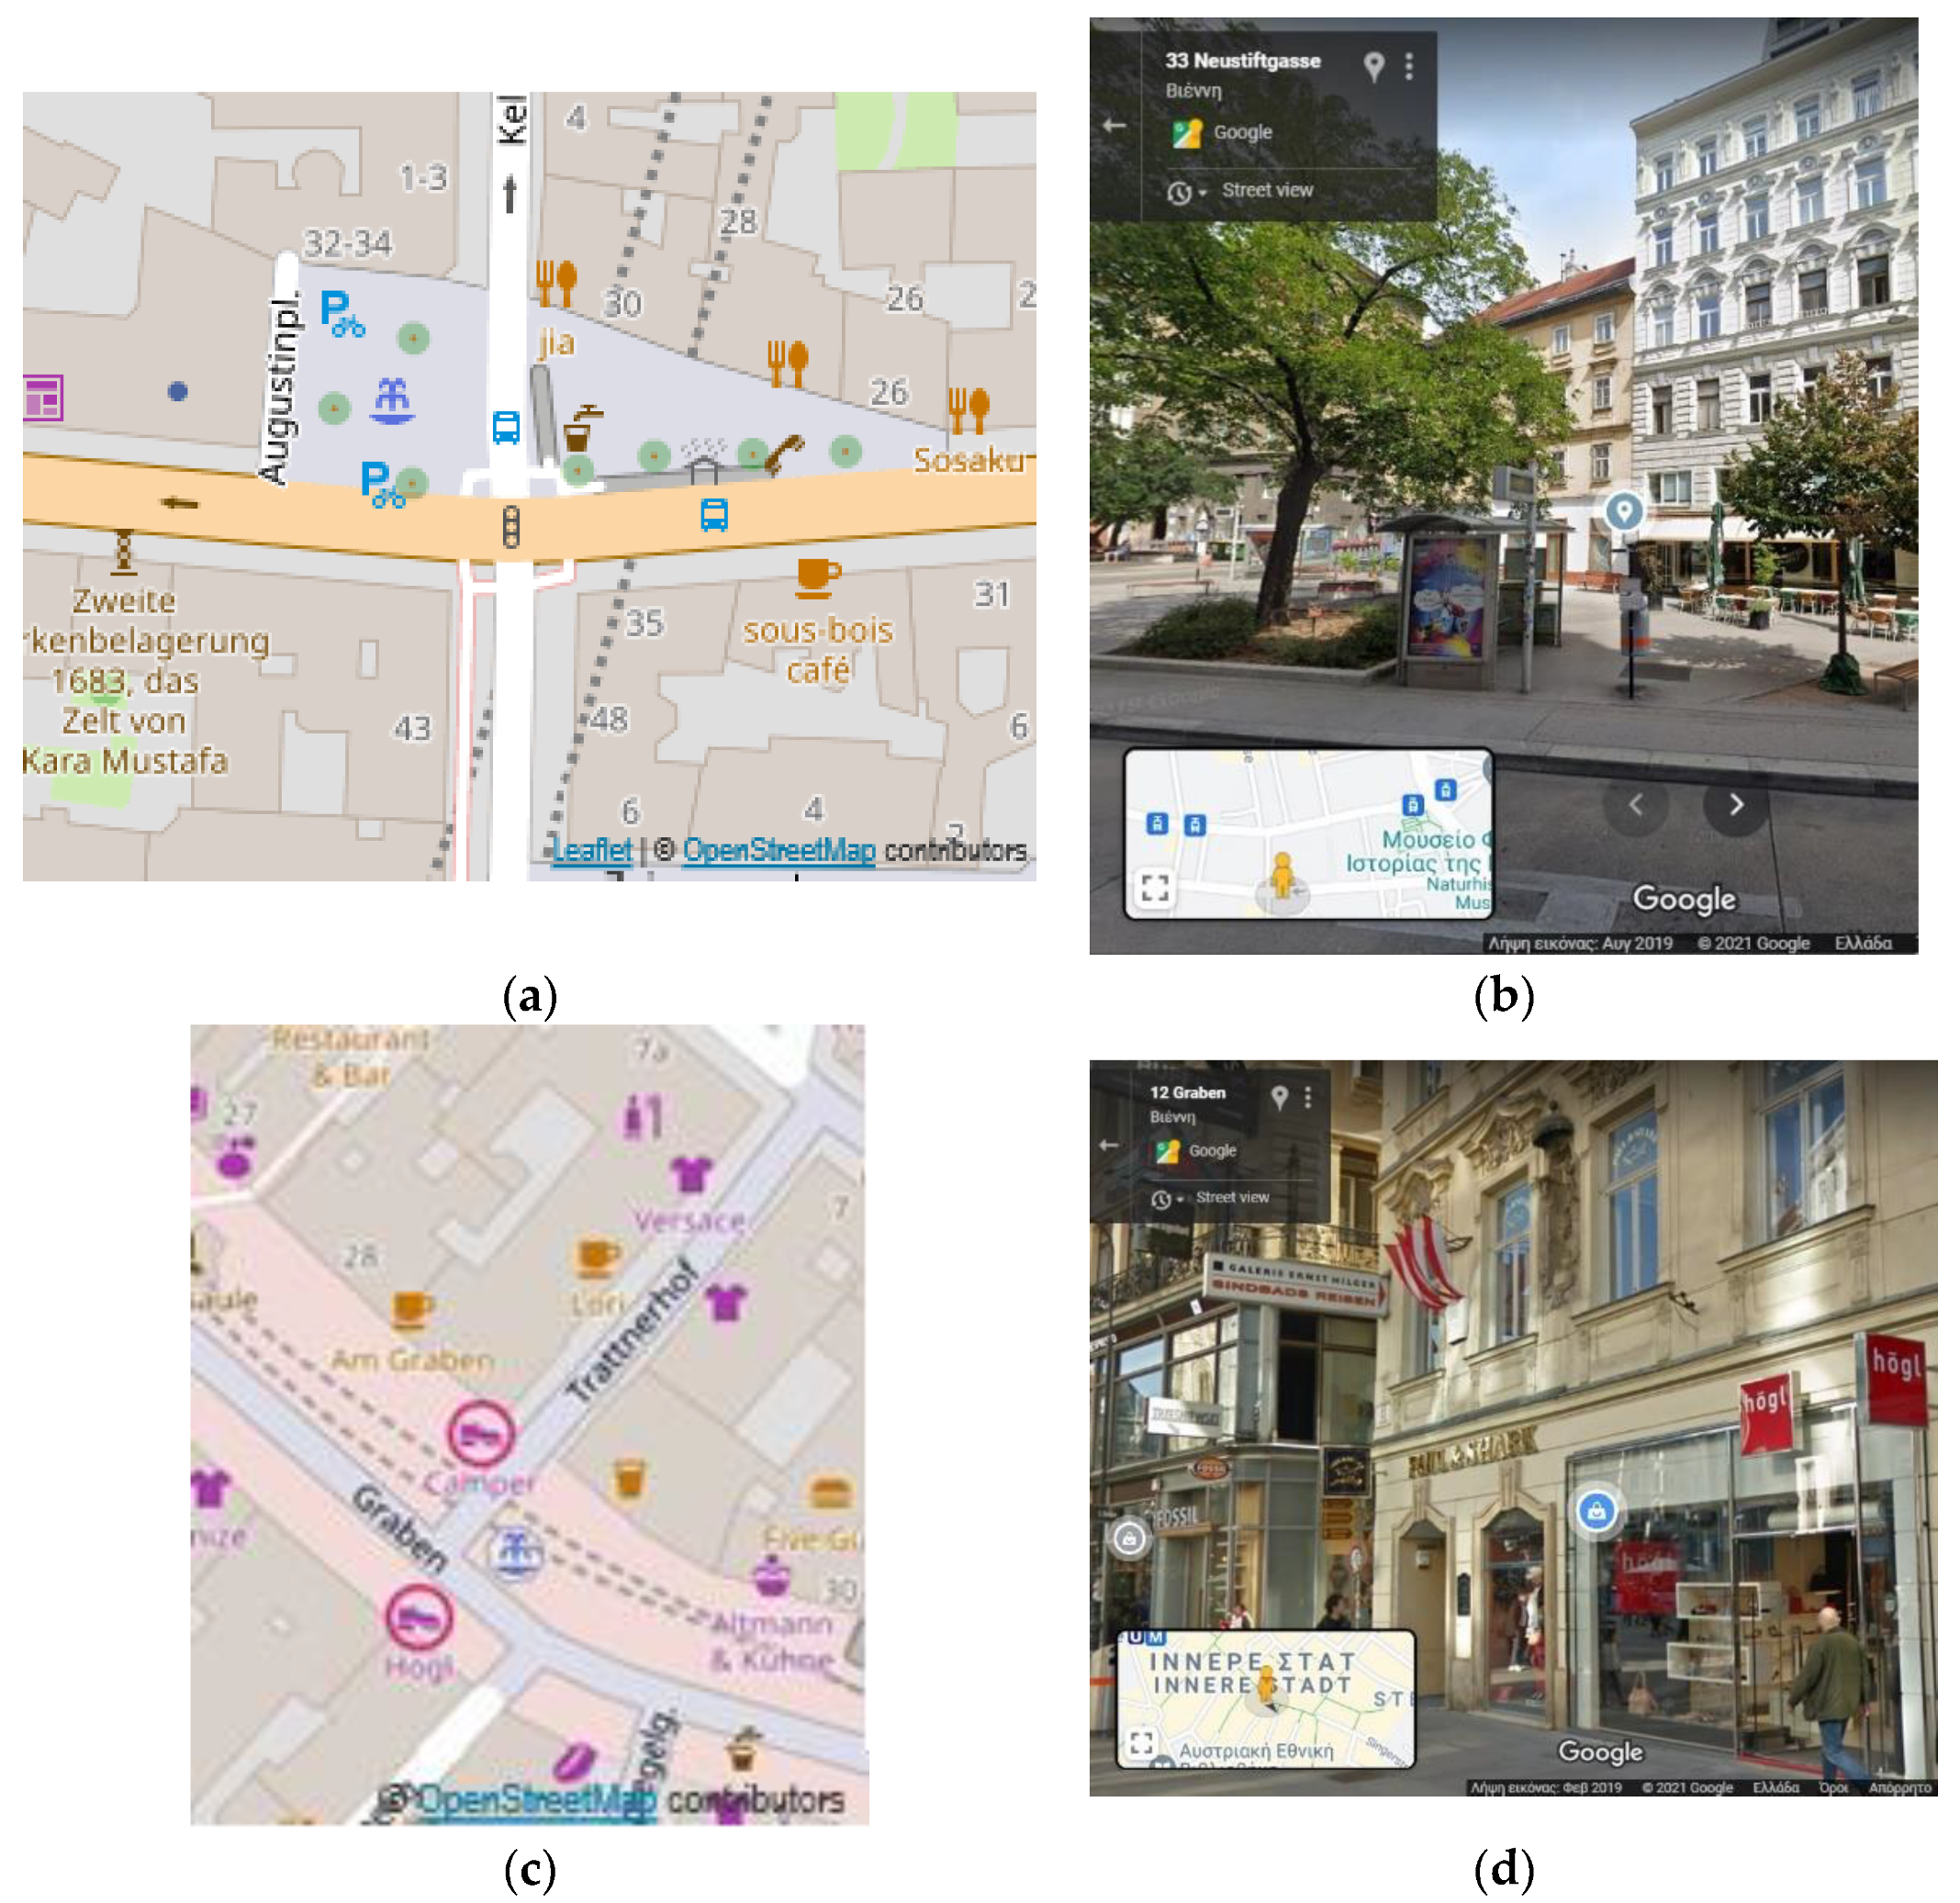
- POIs must be inside buildings (Check 1: POIs must be inside buildings) (Figure 2a). This category includes POIs such as cafes, schools, pharmacies, and supermarkets, which should be located within the building polygons;
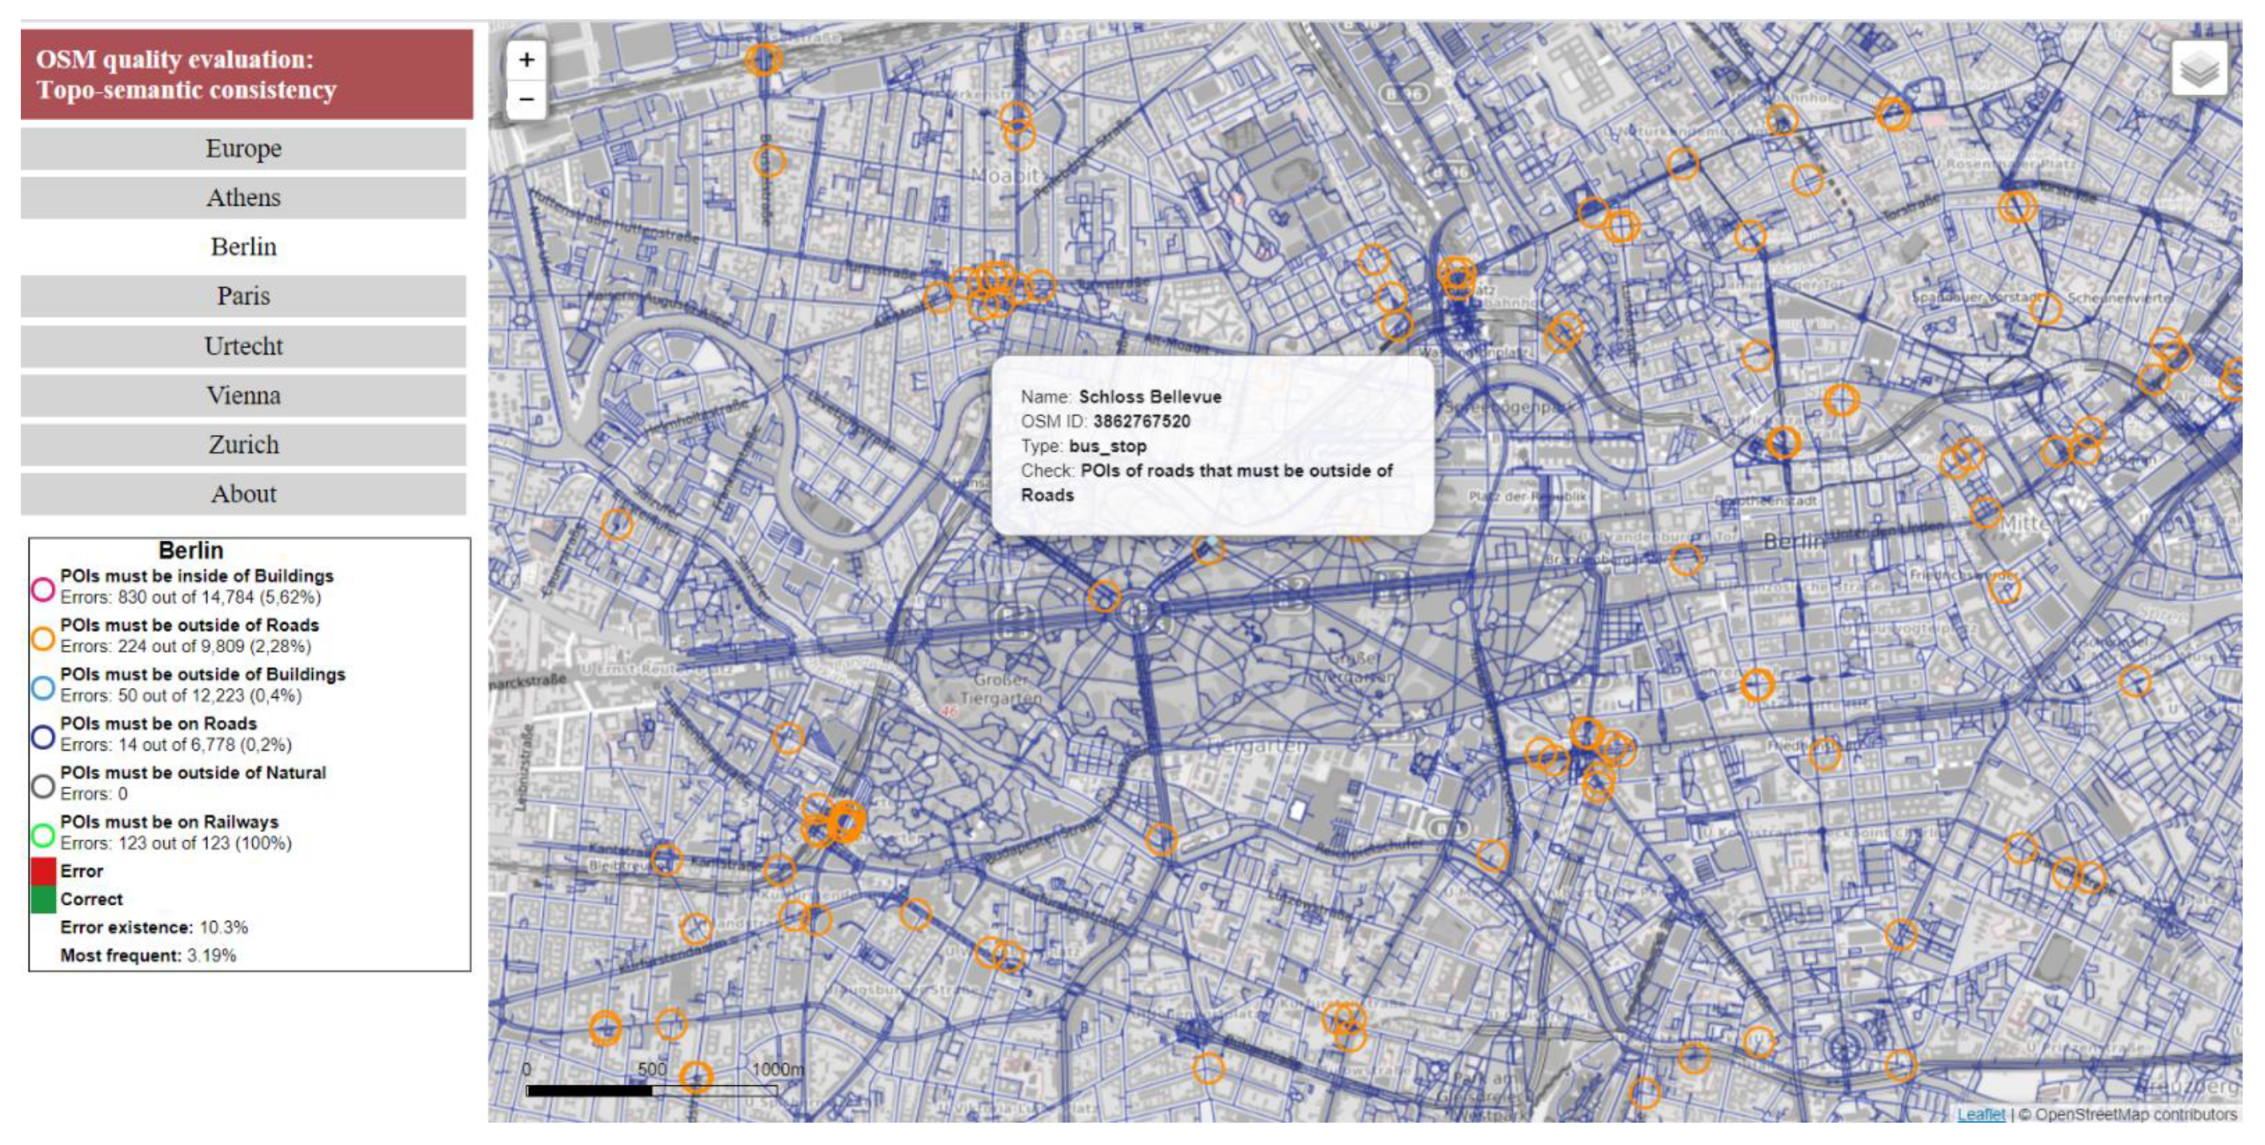
- POIs that are semantically related to the road network and must be outside the road network (Check 2: POIs must be outside of roads) (Figure 2b). This includes POIs such as bus stops, parking, and street lamps, which are related to the roads and are usually located very close to them but not on them;
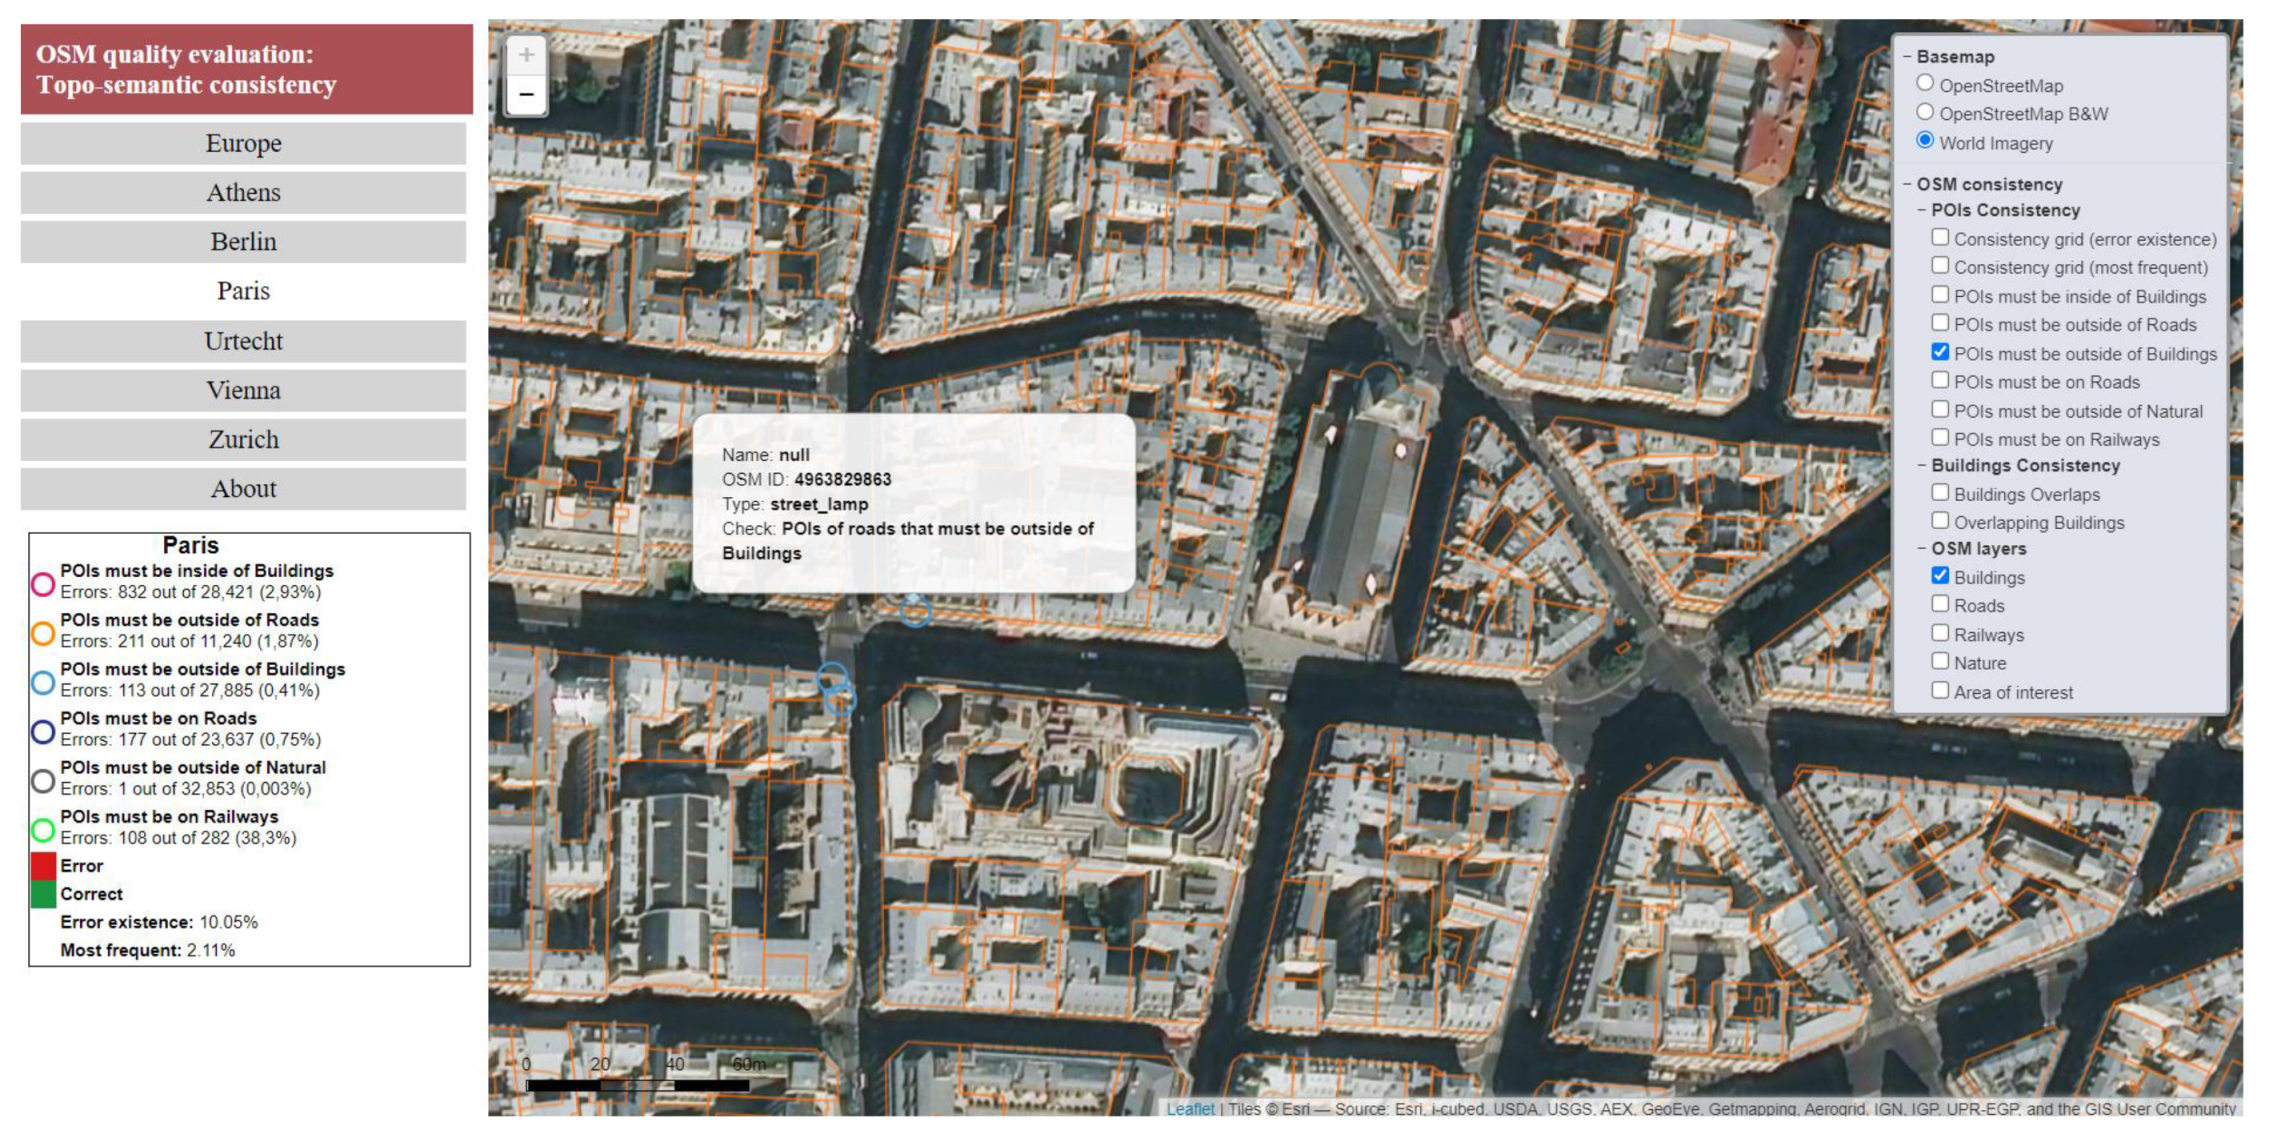
- POIs that are semantically related to the road network and must be located outside buildings (Check 3: POIs must be outside of buildings) (Figure 2c). This includes POIs such as bus stops, junctions, and traffic lights, which should not be located within buildings;
- POIs that are semantically related to the road network and must be on the road network (Check 4: POIs must be on roads) (Figure 2d). This includes POIs such as junctions, traffic lights, and turning points that that should be located on the road network;
- POIs must be outside the polygons of nature (Check 5: POIs must be outside of nature) (Figure 2e). This includes POIs such as department stores, hotels, car rentals, and cinemas, which must be outside the nature polygons;
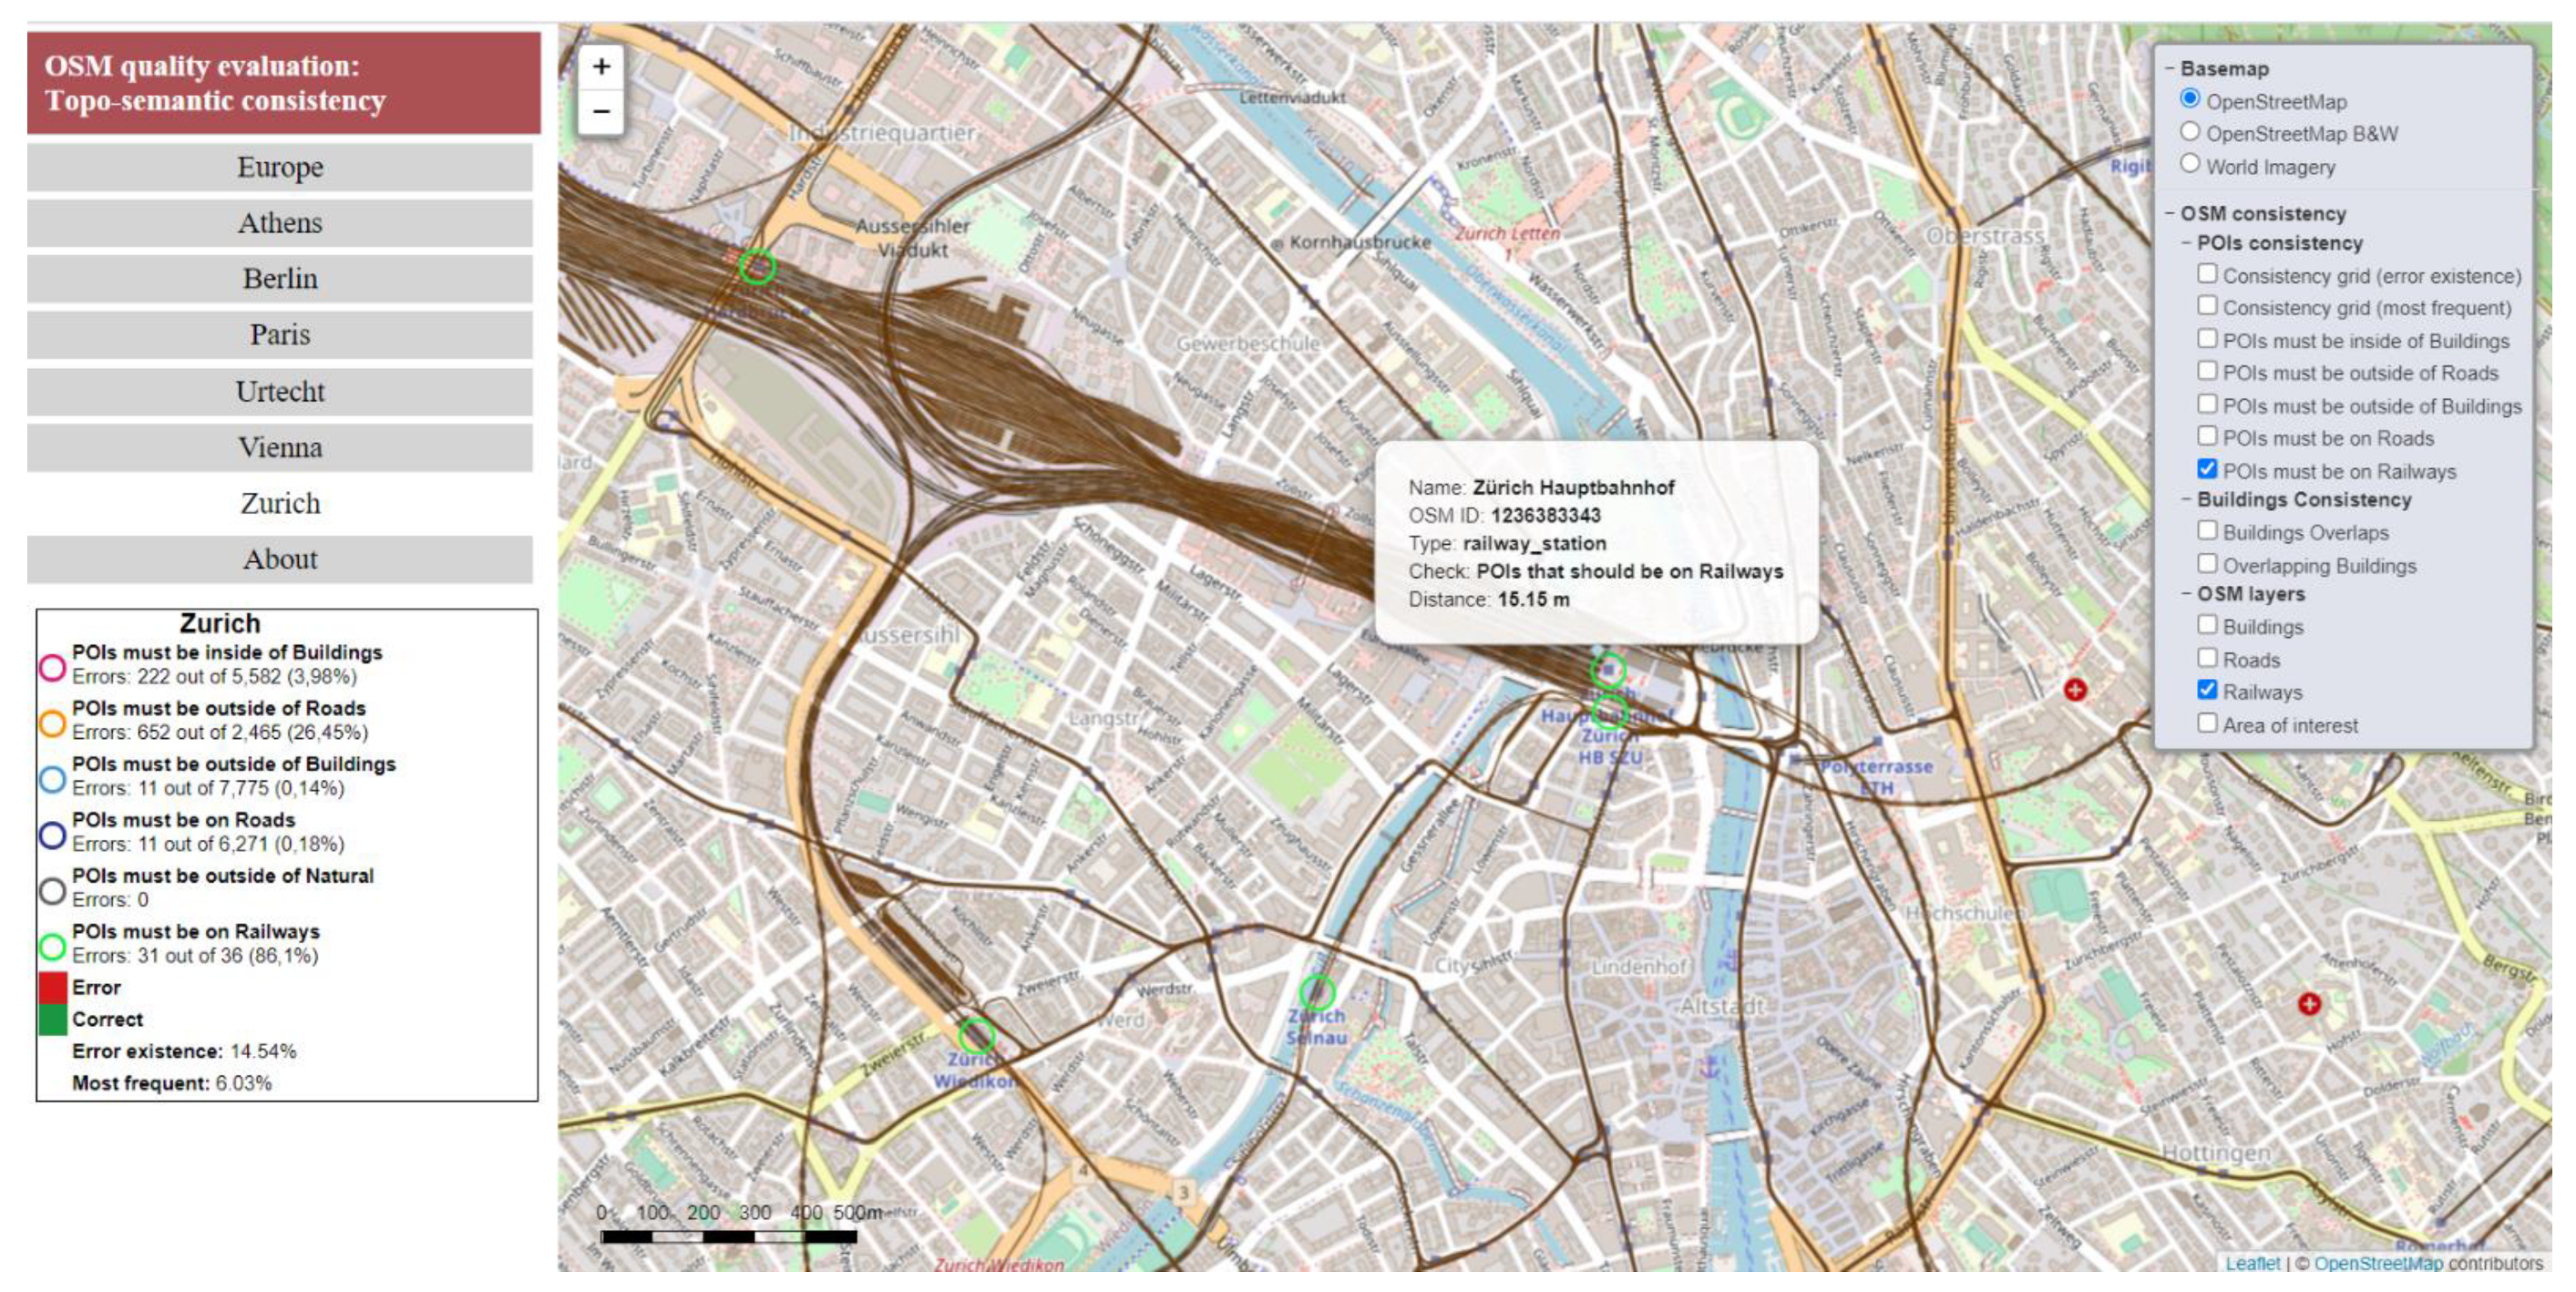
- POIs that are semantically related to the rail network and must be located on the rail network (Check 6: POIs must be on railways) (Figure 2f). This includes only one kind of POI: the railway stops that should be located on railways.
3.3. A Tool for Checking Topo-Semantic Consistency
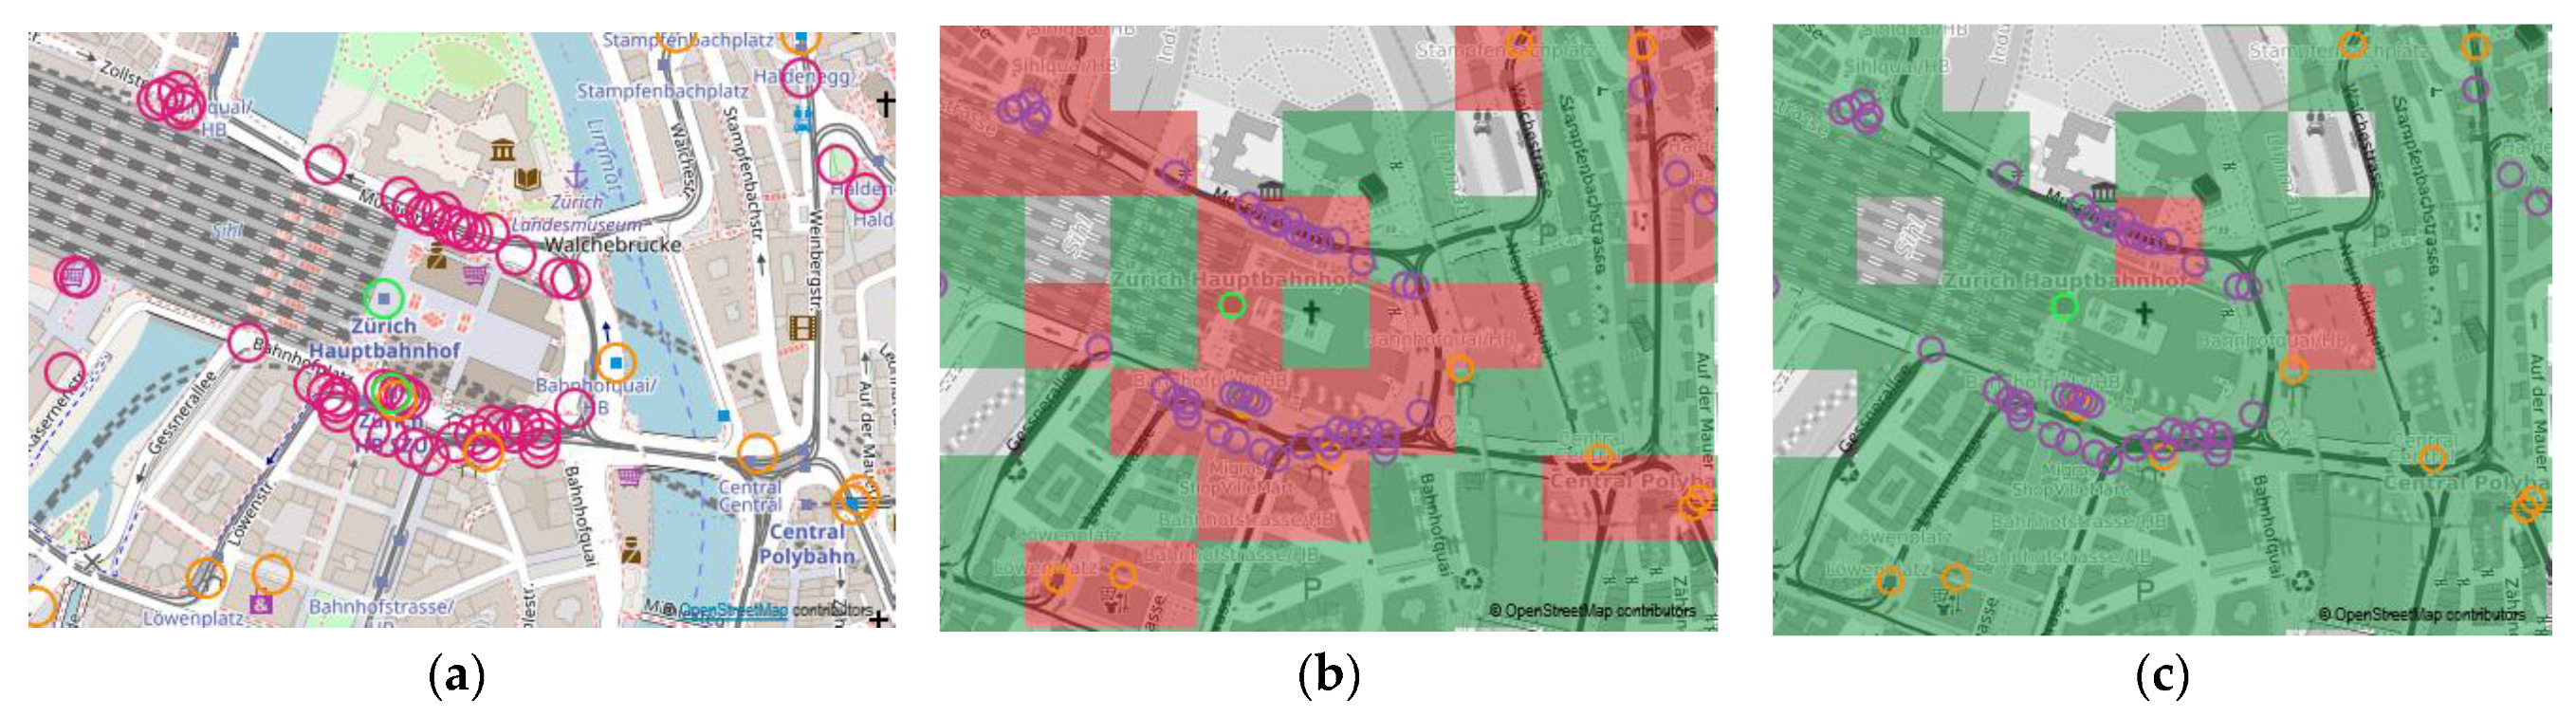
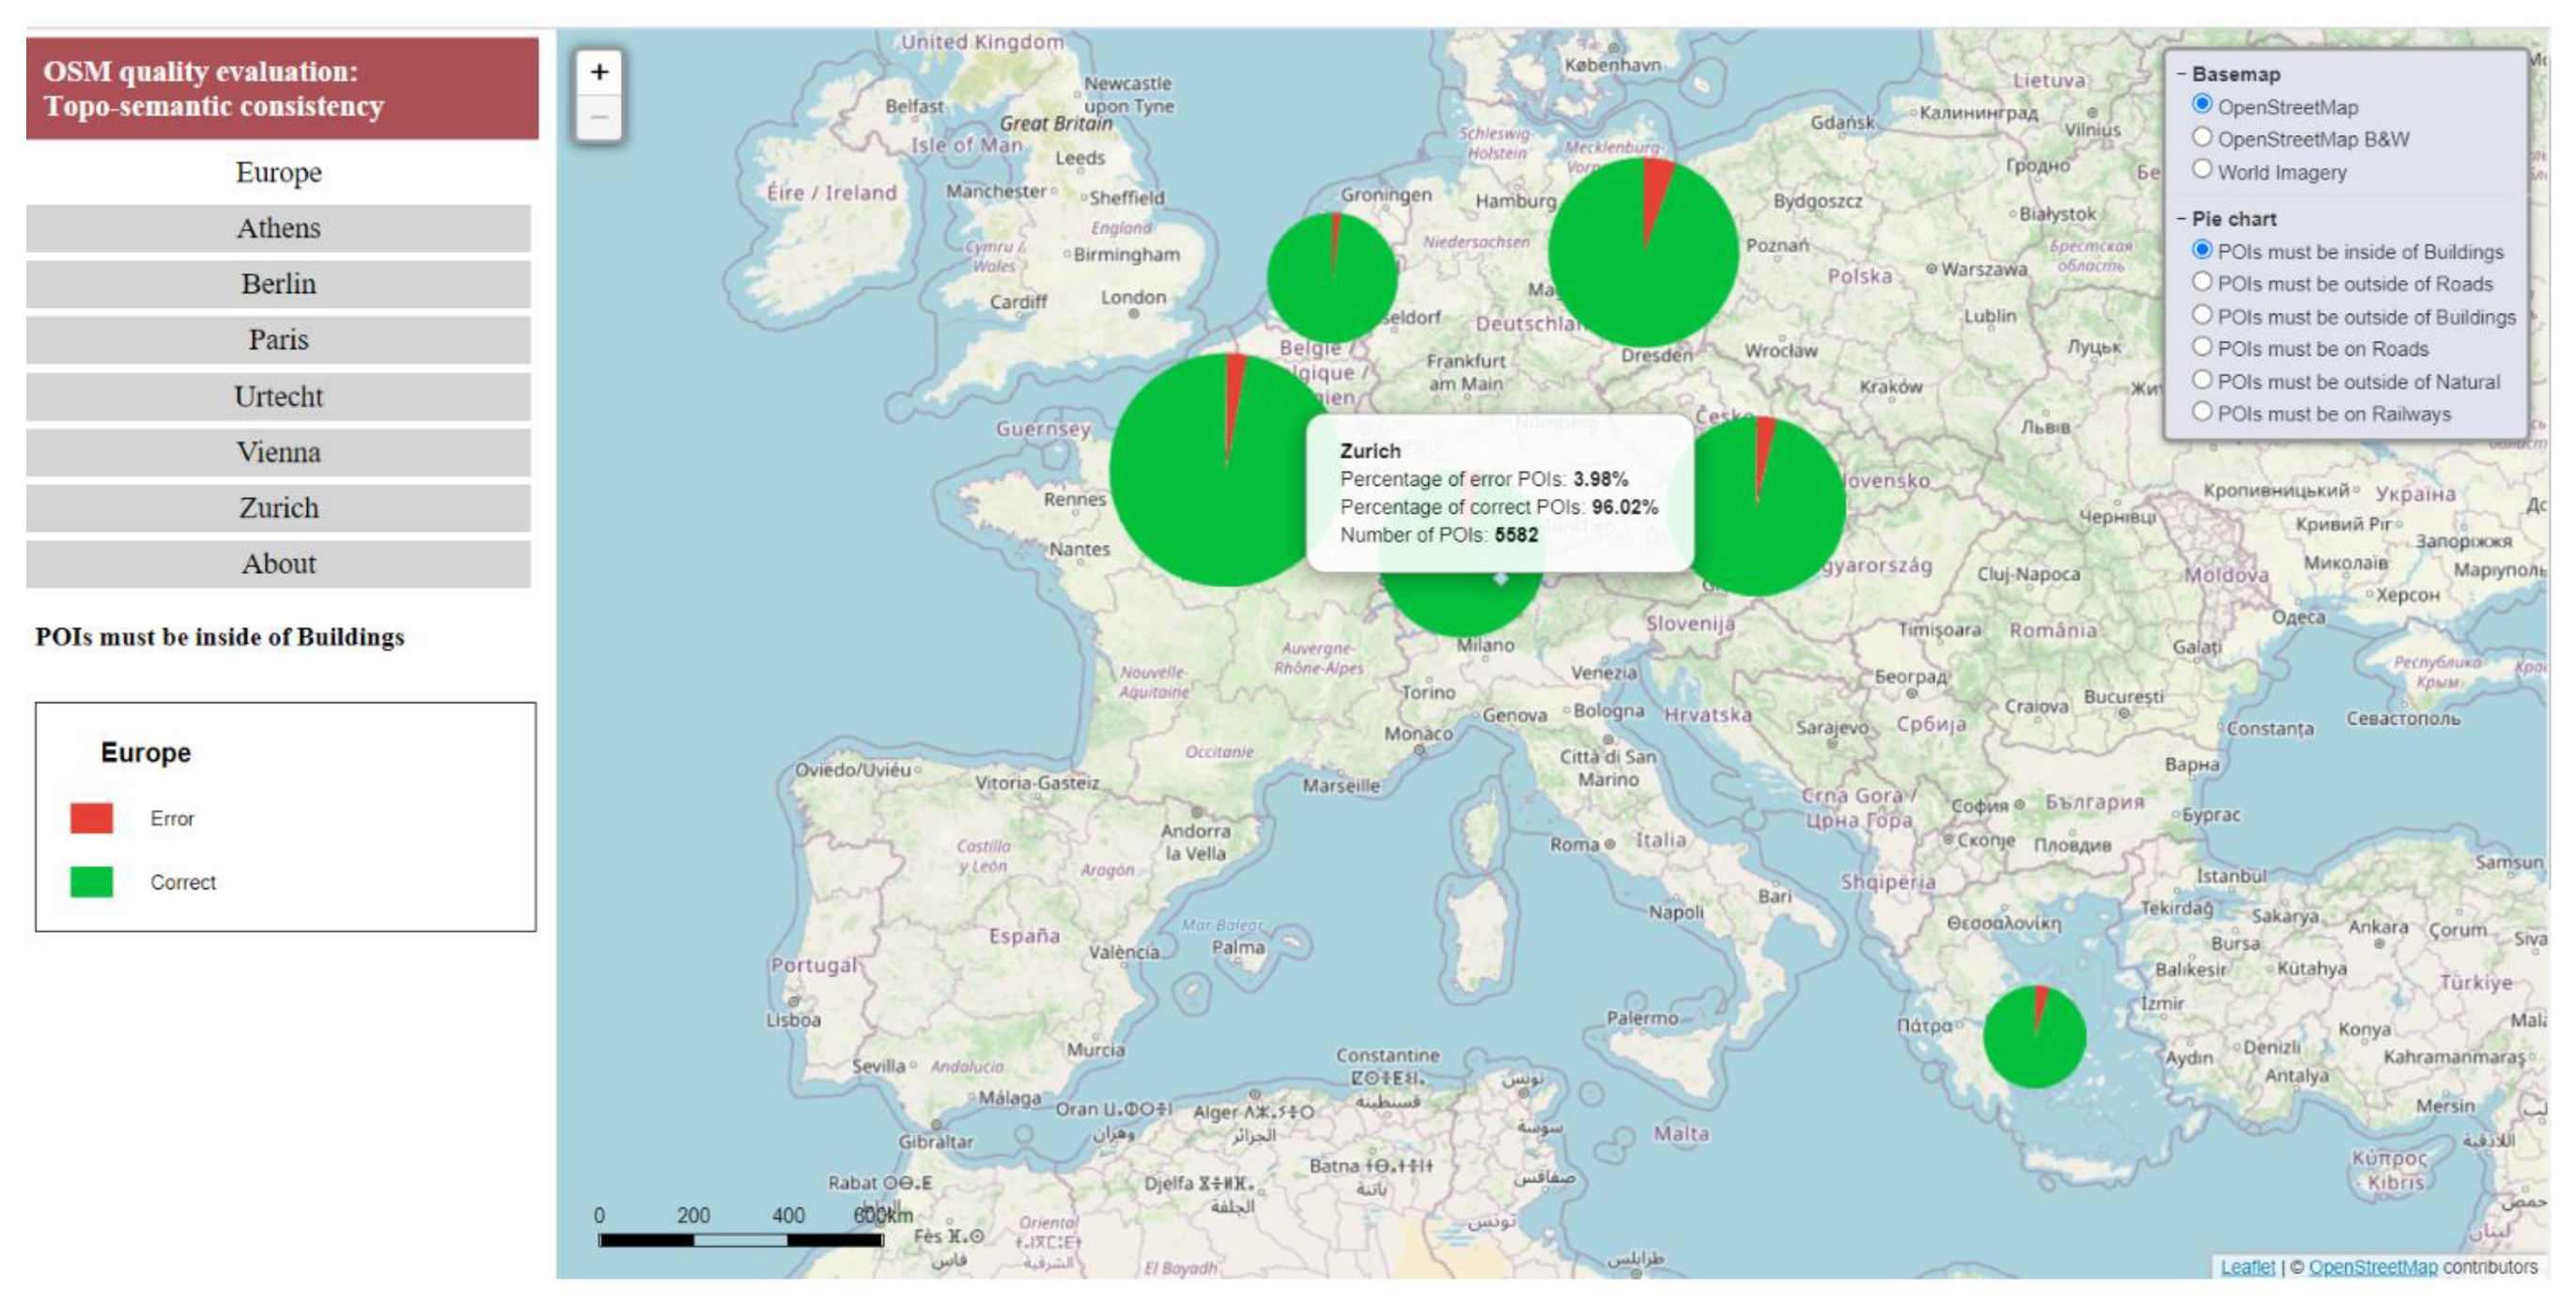
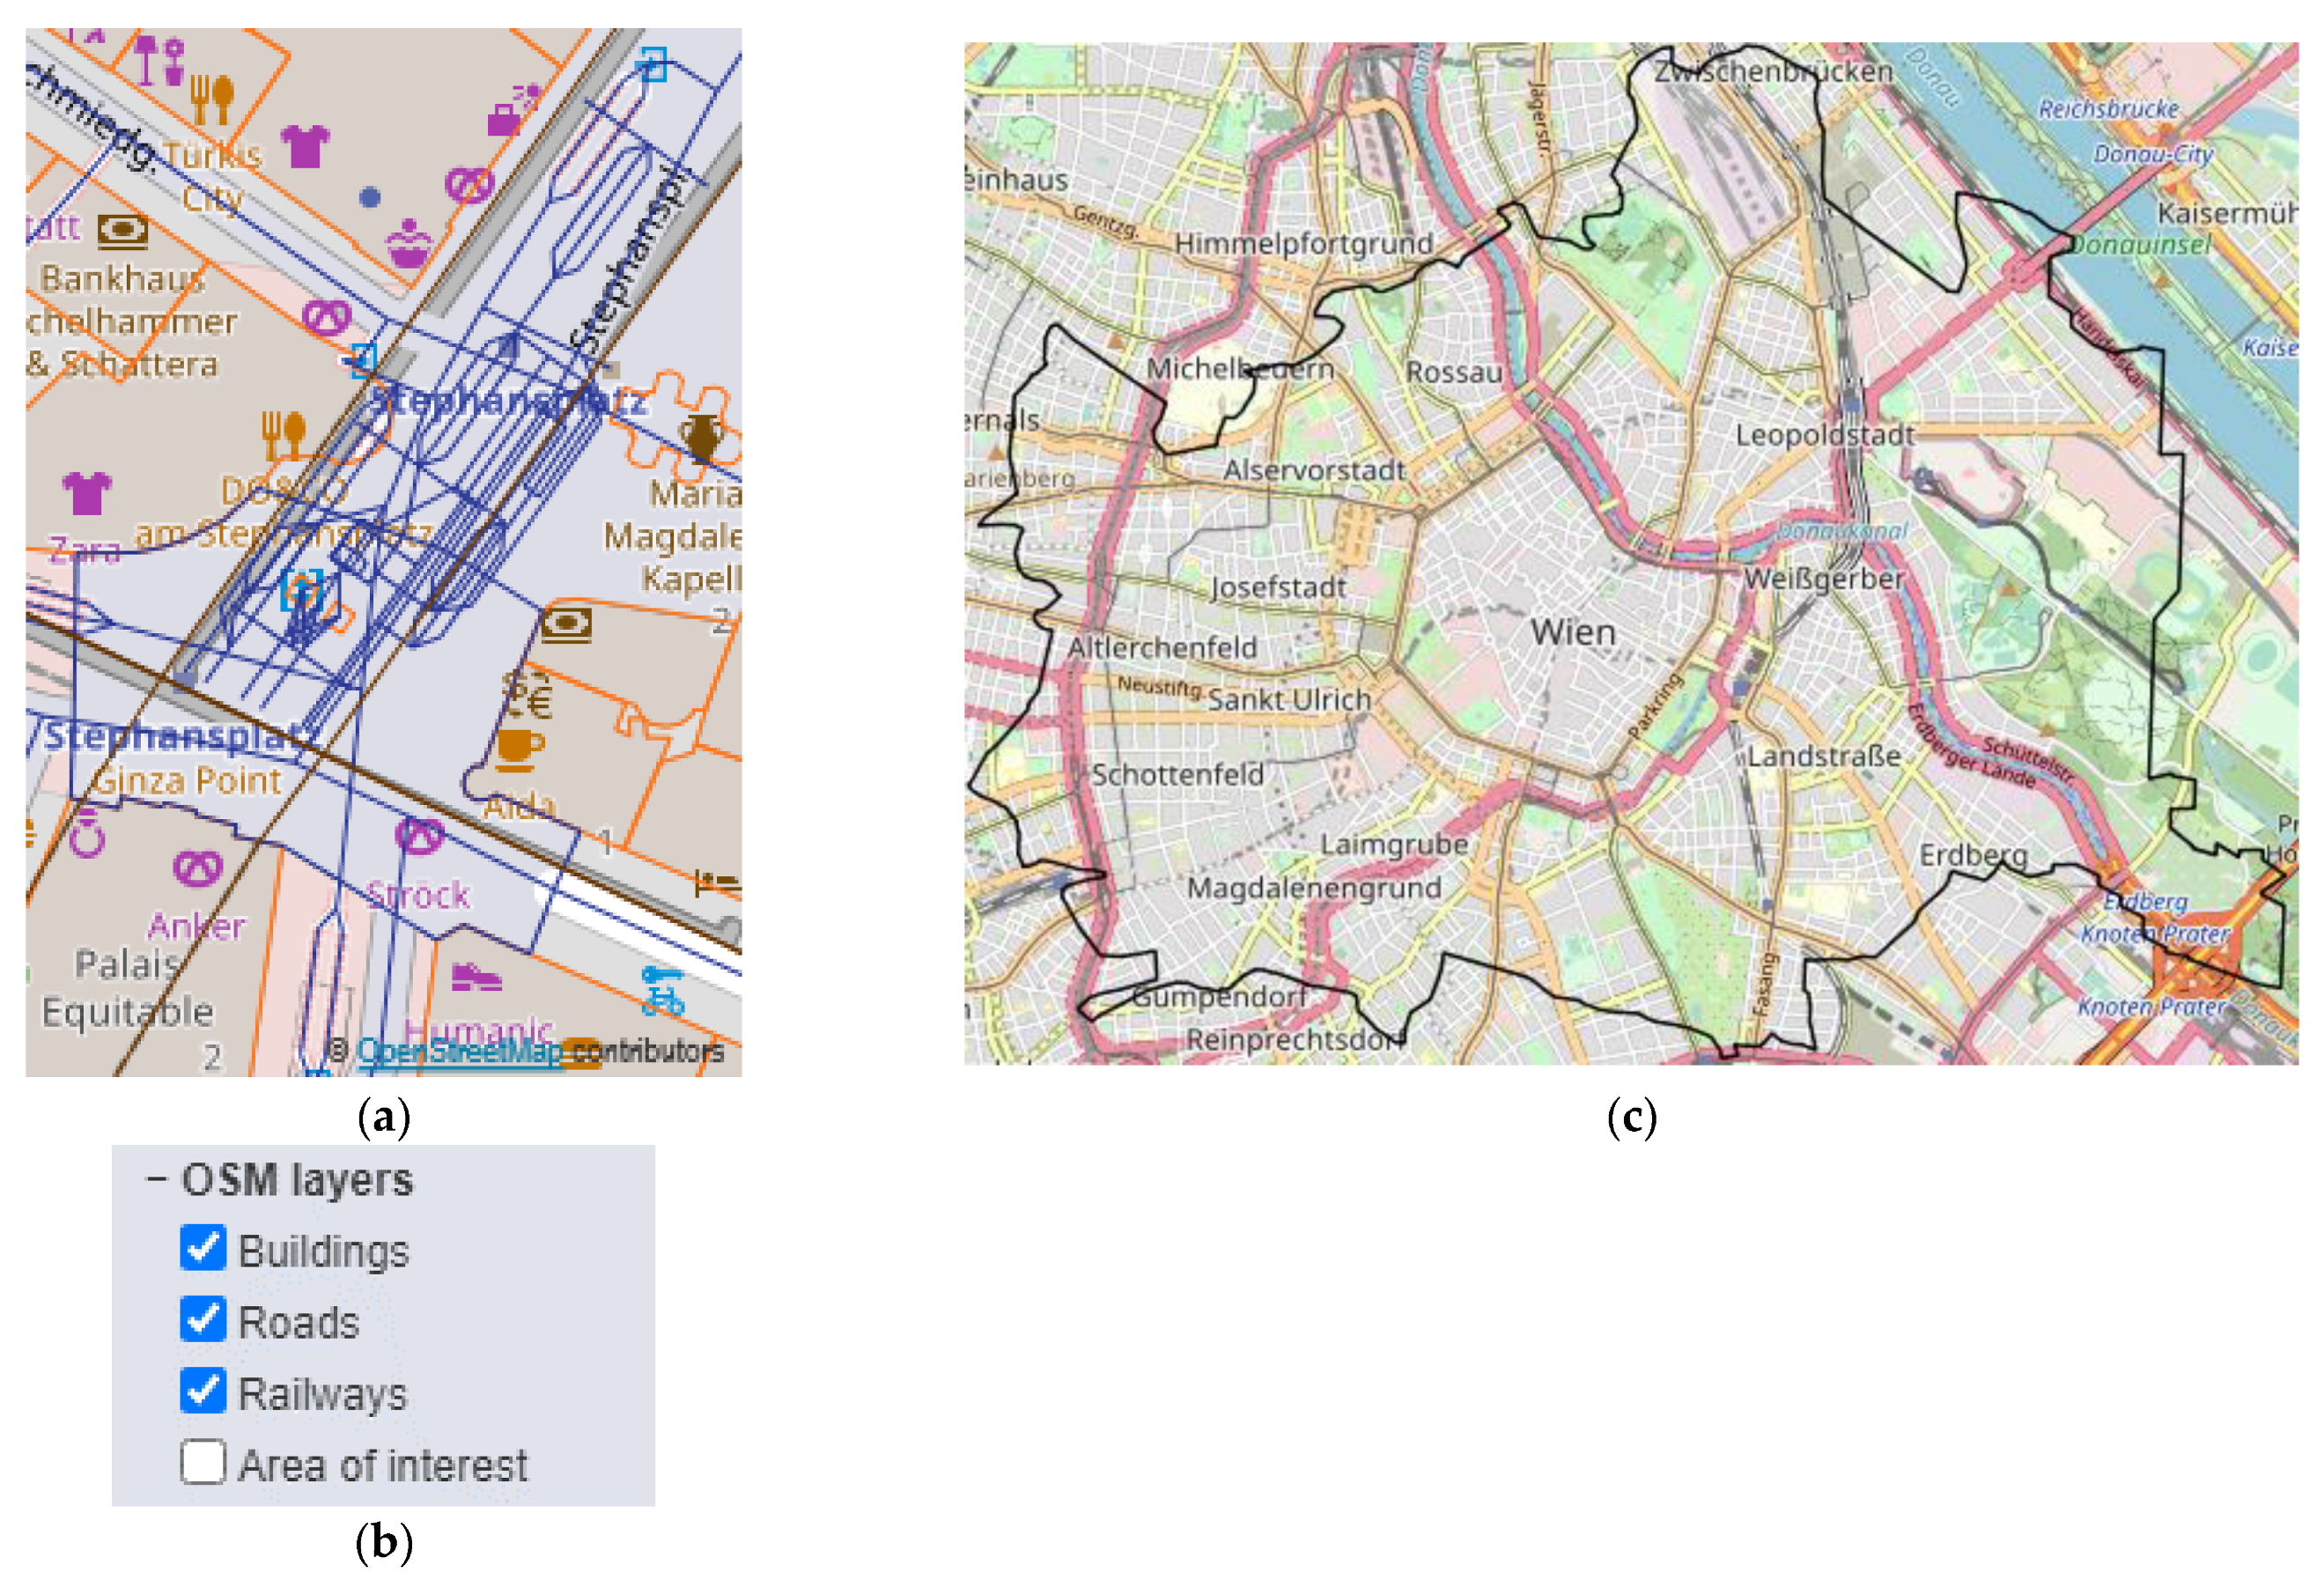
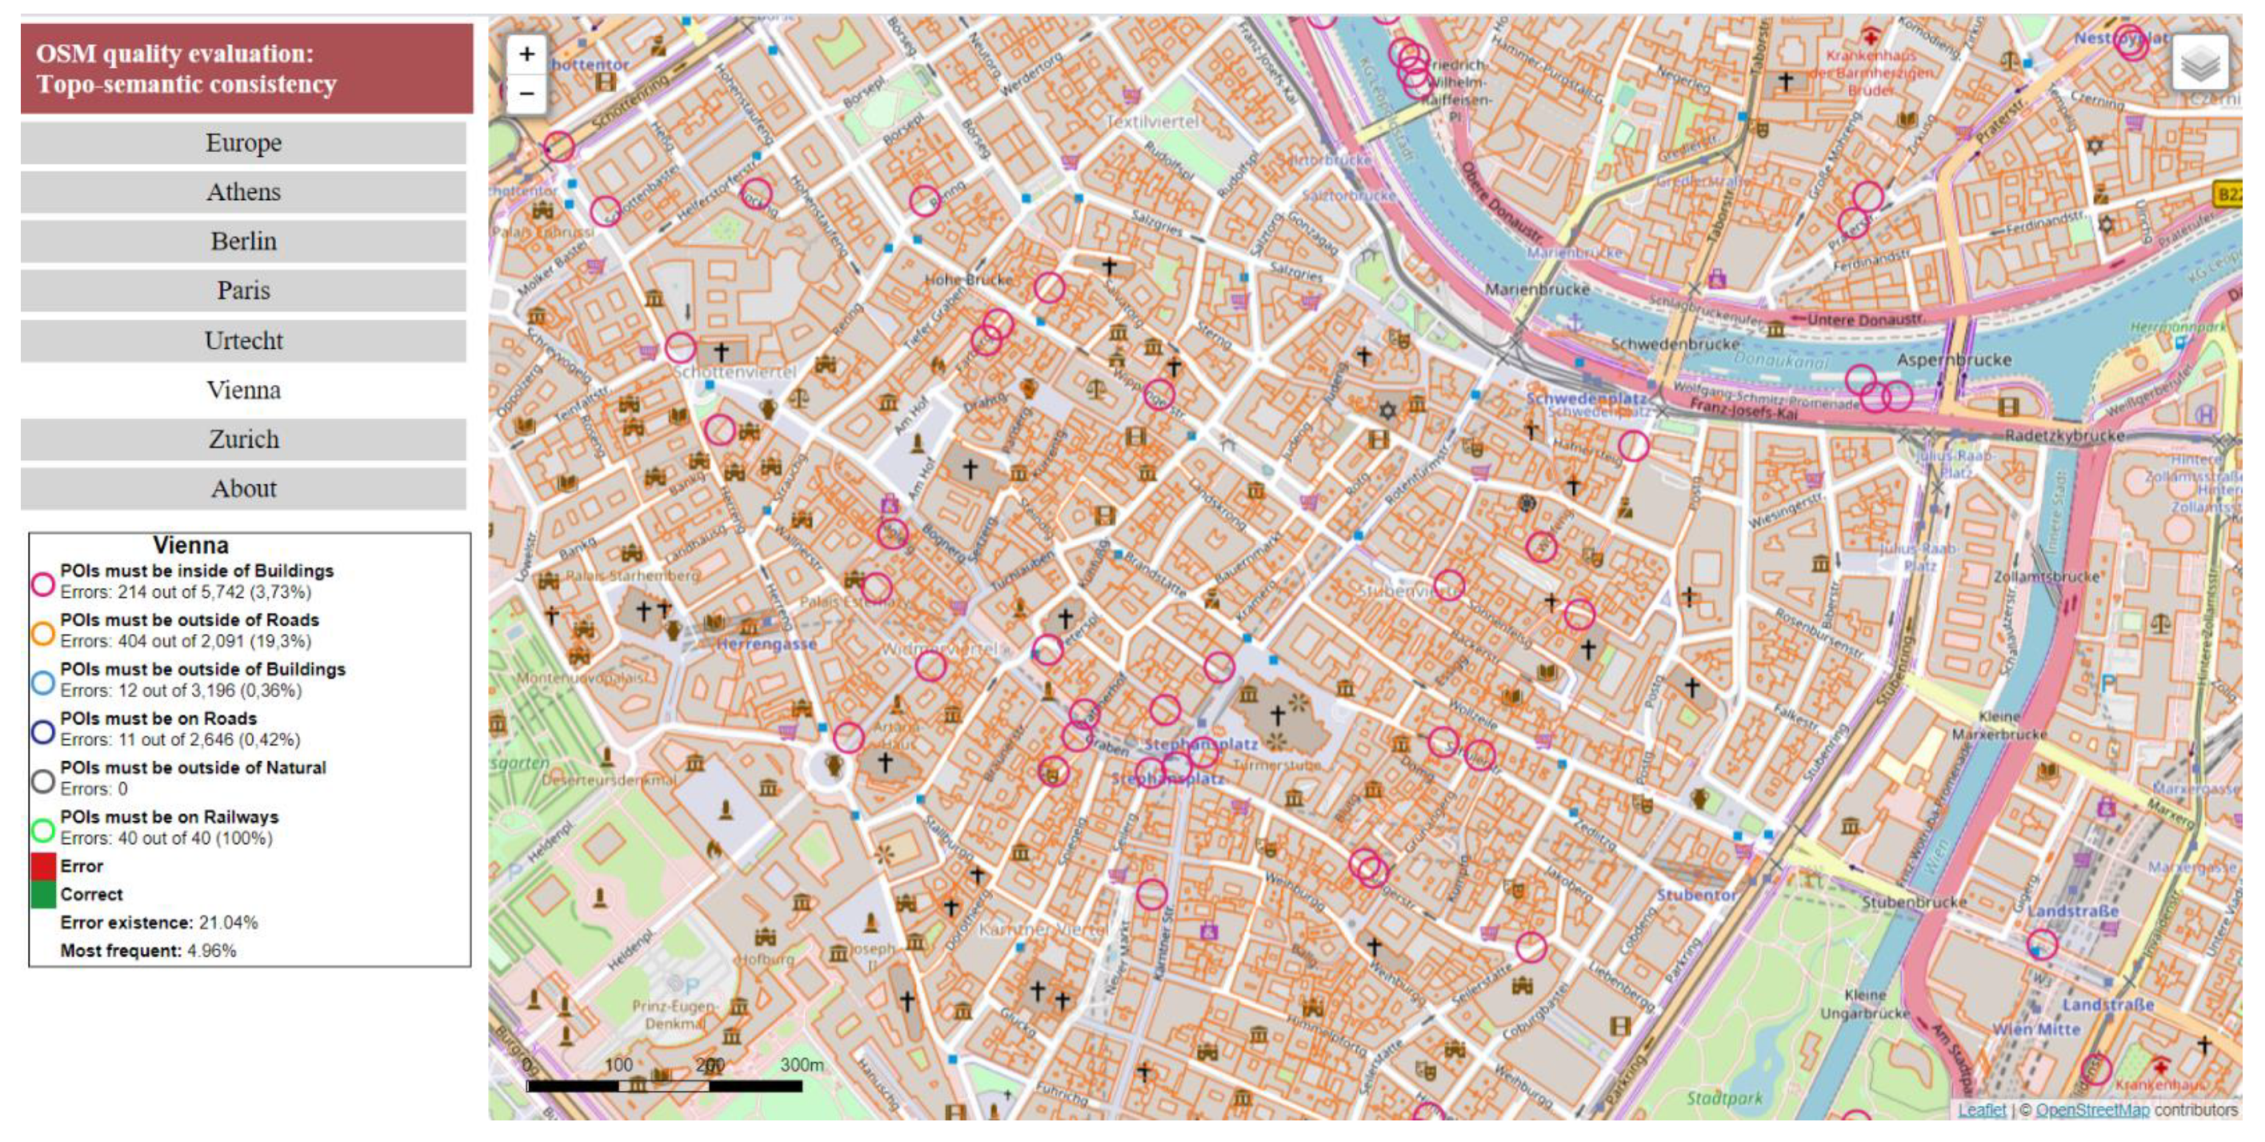
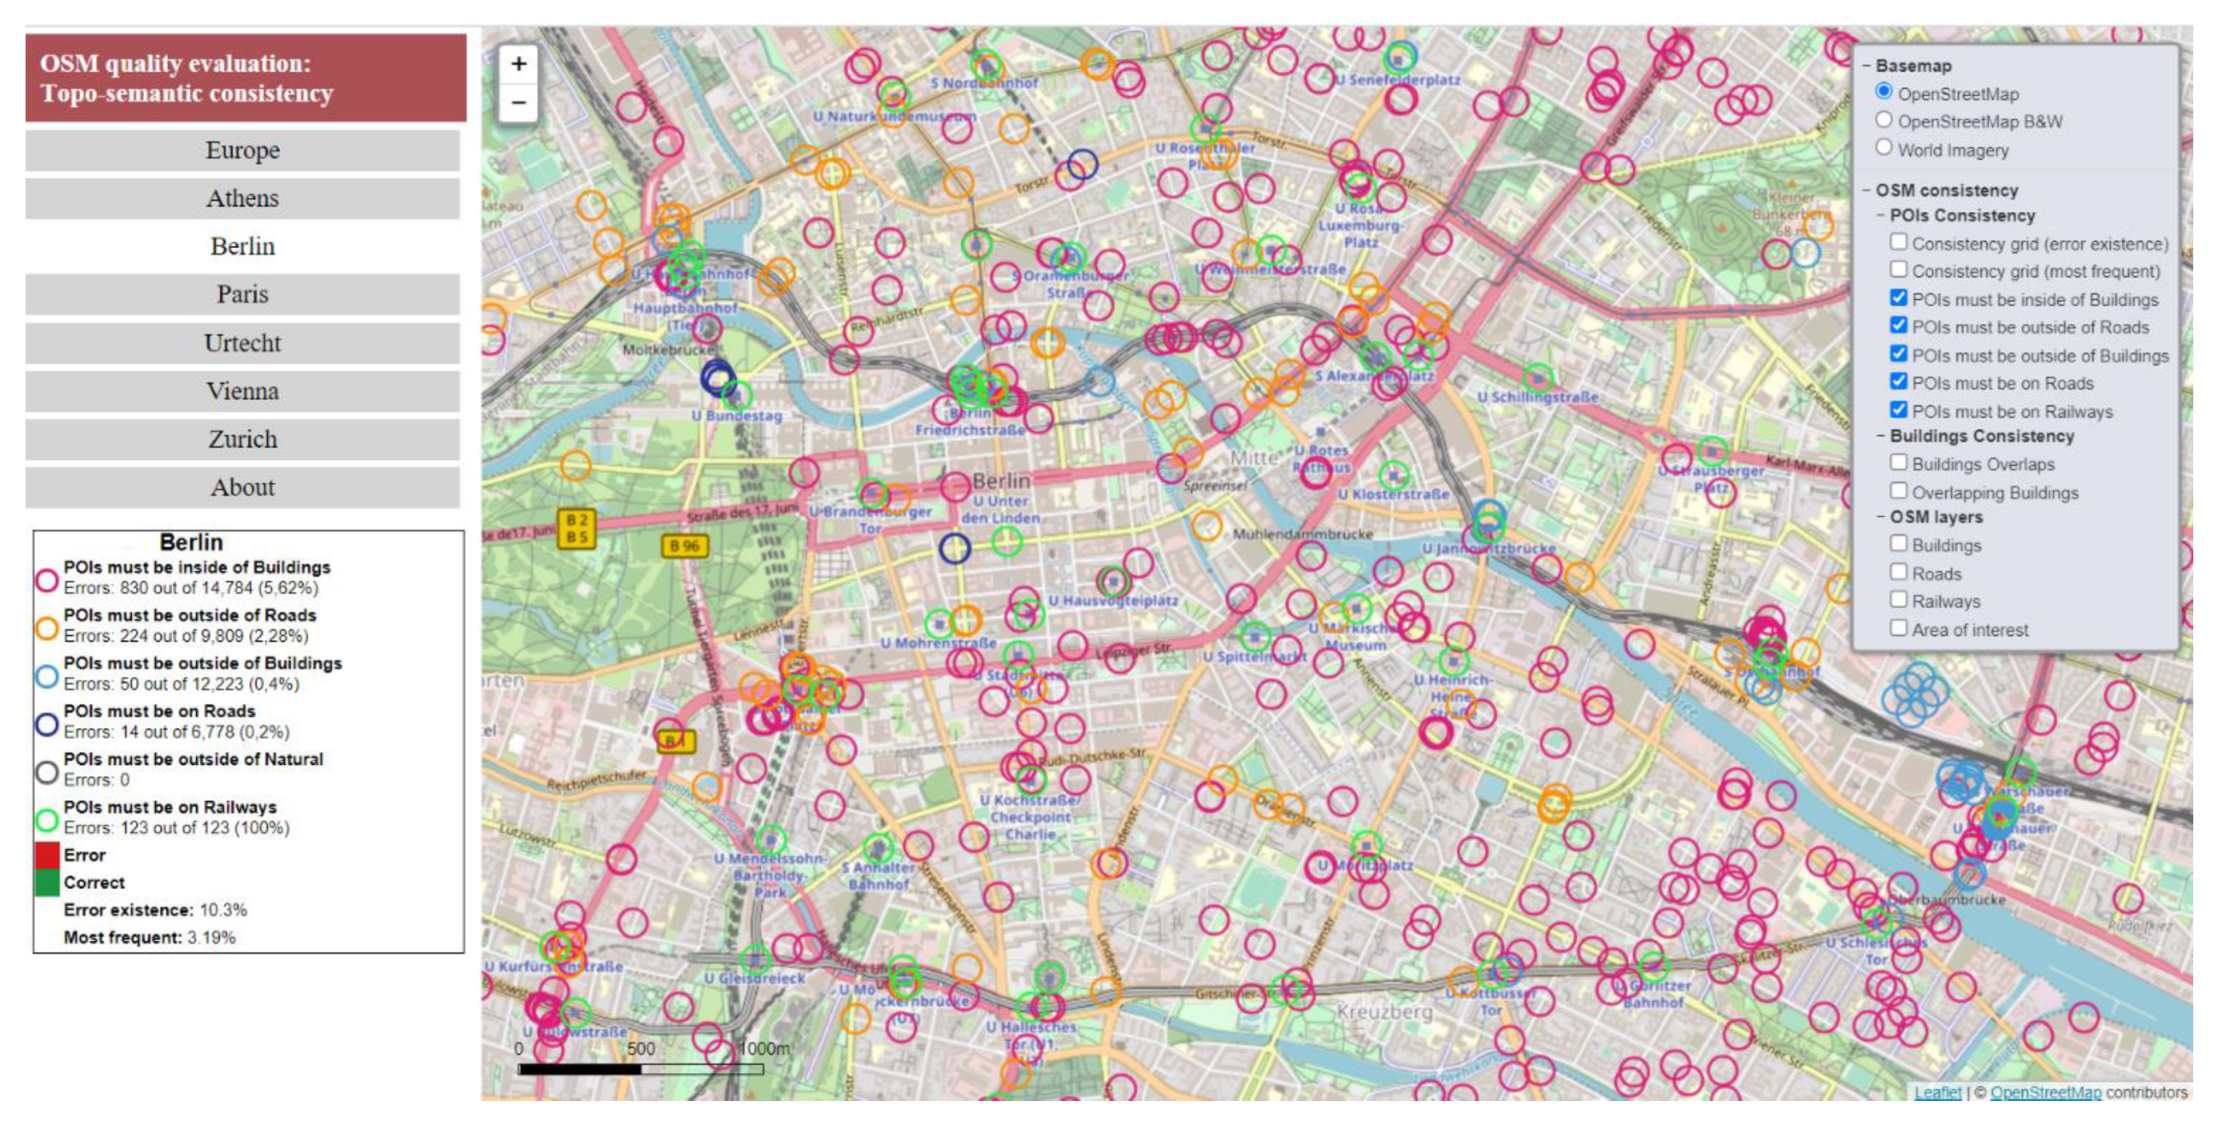
3.4. Design of a Web Mapping Application for the Visualization of the Topo-Semantic Consistency
- Basemap: A list of the available basemaps (e.g., OSM) and the ground truth (e.g., satellite imagery) are provided to the user;
- Thematic maps: Quality visualization is overlaid on the basemap, and extrinsic techniques introduce new graphic objects. The use of OSM map tiles as a basemap does not allow intrinsic visualization methods. Quality visualization appears upon user request, and the OSM experience is not altered;
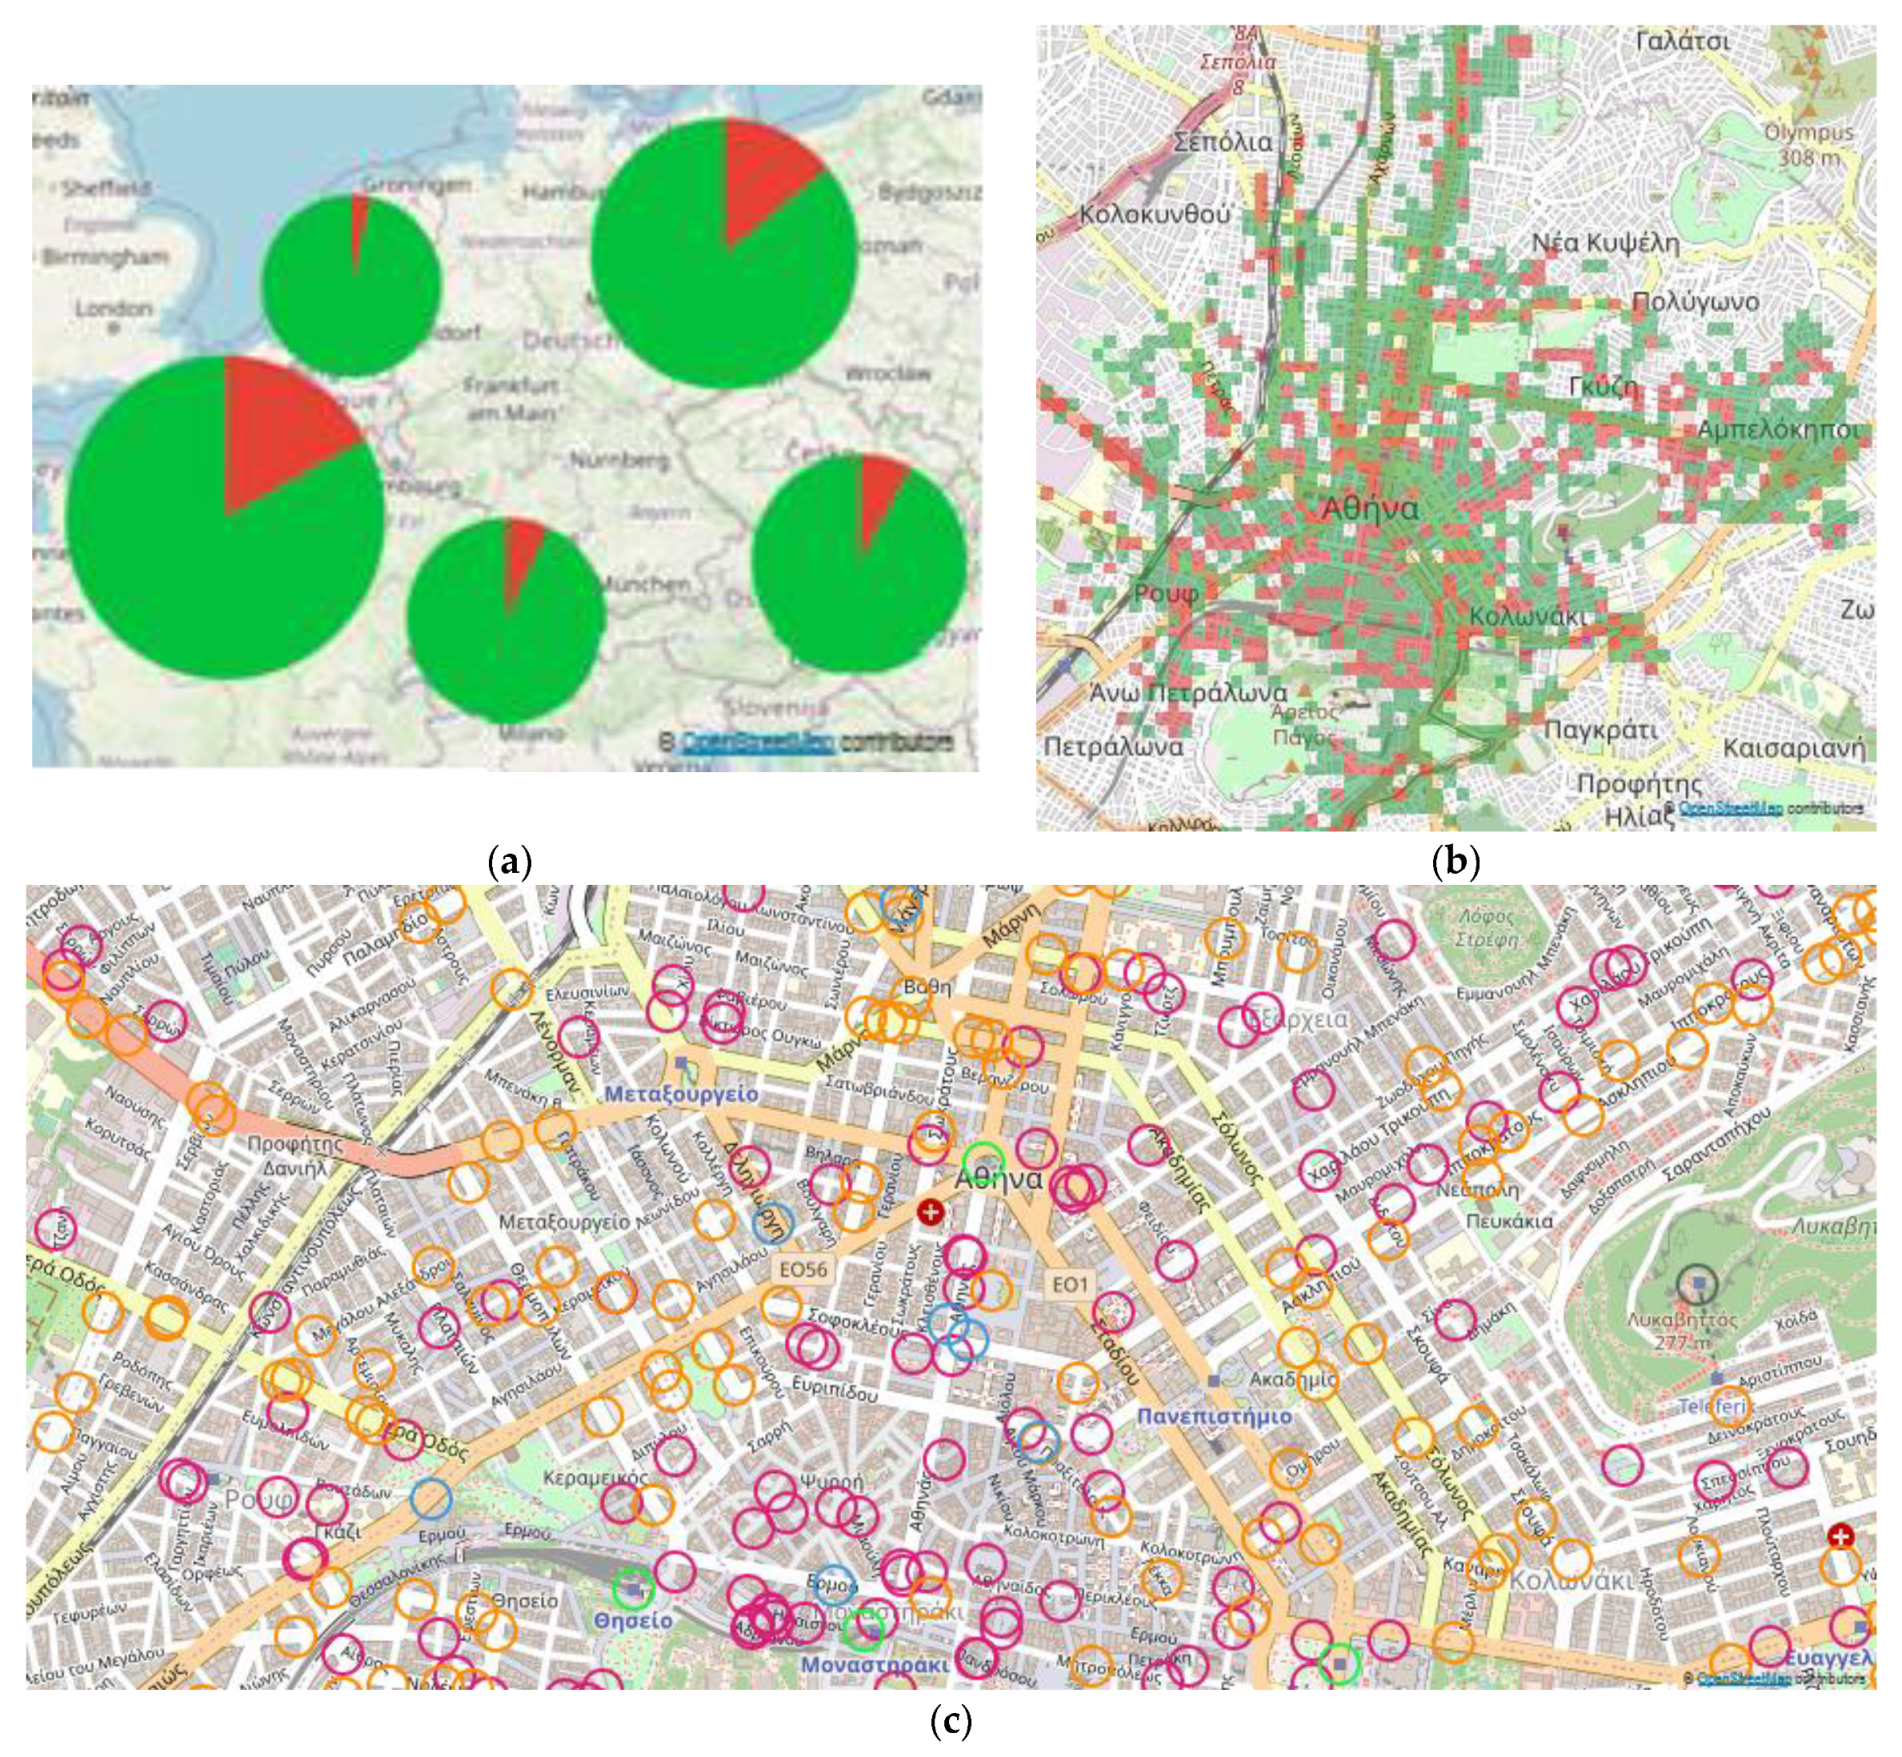
- Scale: Multiscale consistency visualization at the regional (i.e., Europe), city (e.g., Paris), and feature levels (e.g., POI) is provided. A scale bar in meters informs the user about the map scale;
- Legend: A visual explanation of the symbols used in the map is provided;
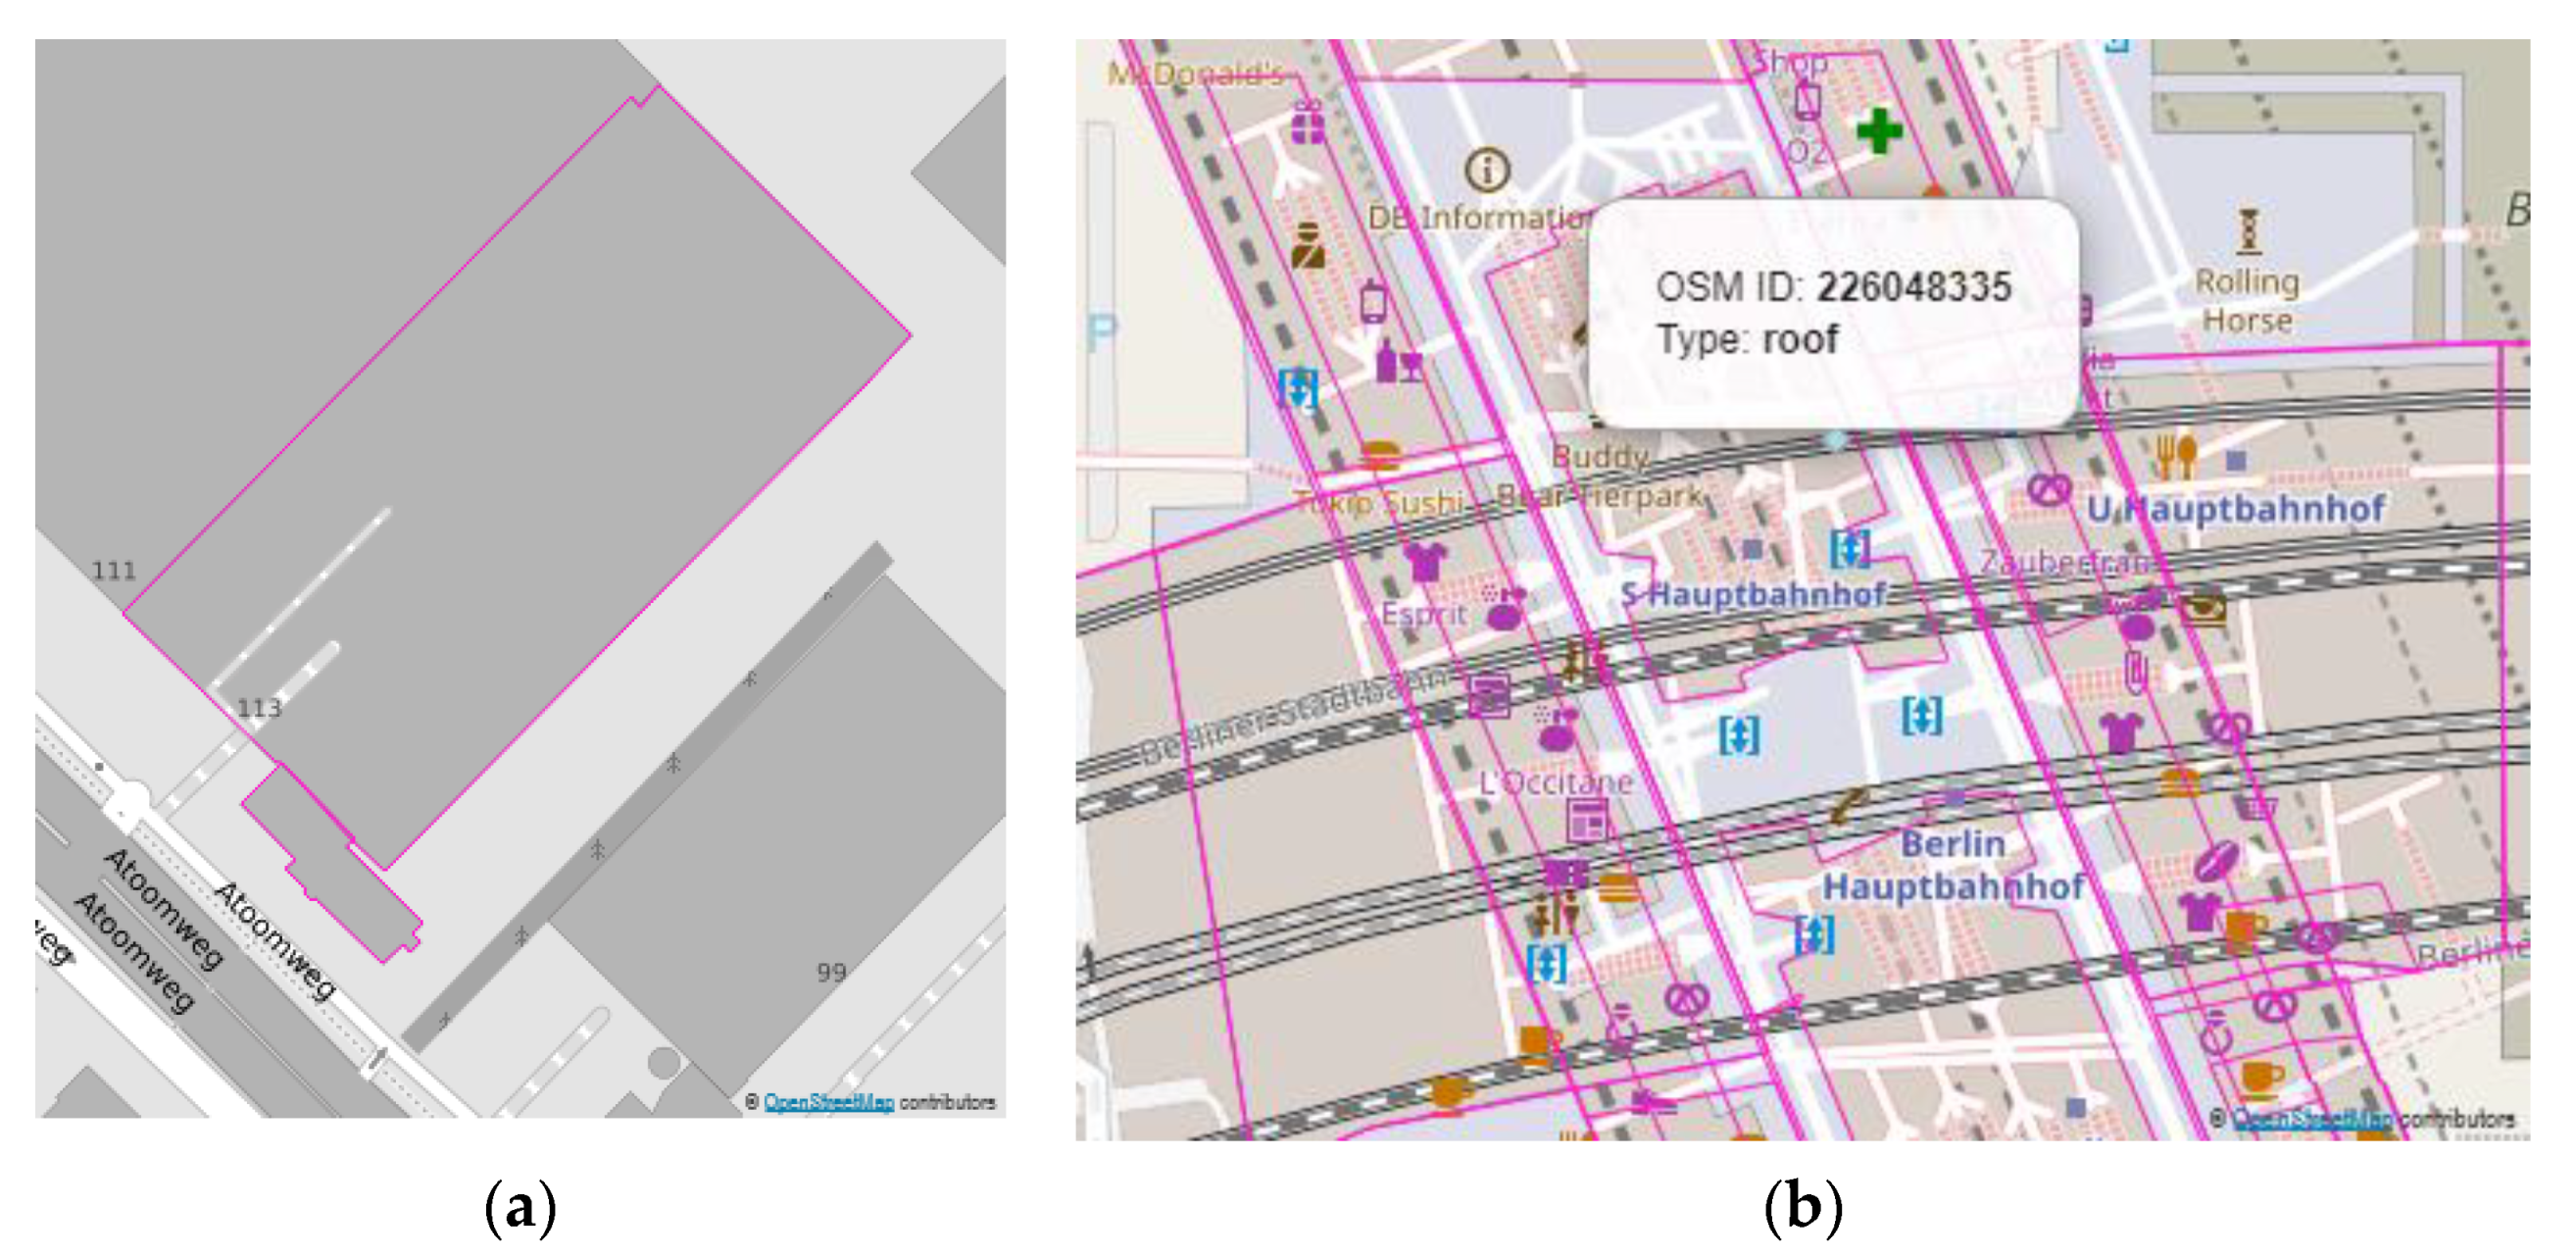
- Retrieval of consistency information at the city and feature levels;
- Interactivity and map navigation: An interactive graphic user interface and essential map navigation tools, such as zoom and pan, are available.
4. Case Study and Results
4.1. Data
4.2. VGI Quality
4.2.1. Completeness Check and Information about the Type
4.2.2. Internal Topology Checks
4.2.3. Topo-Semantic Consistency
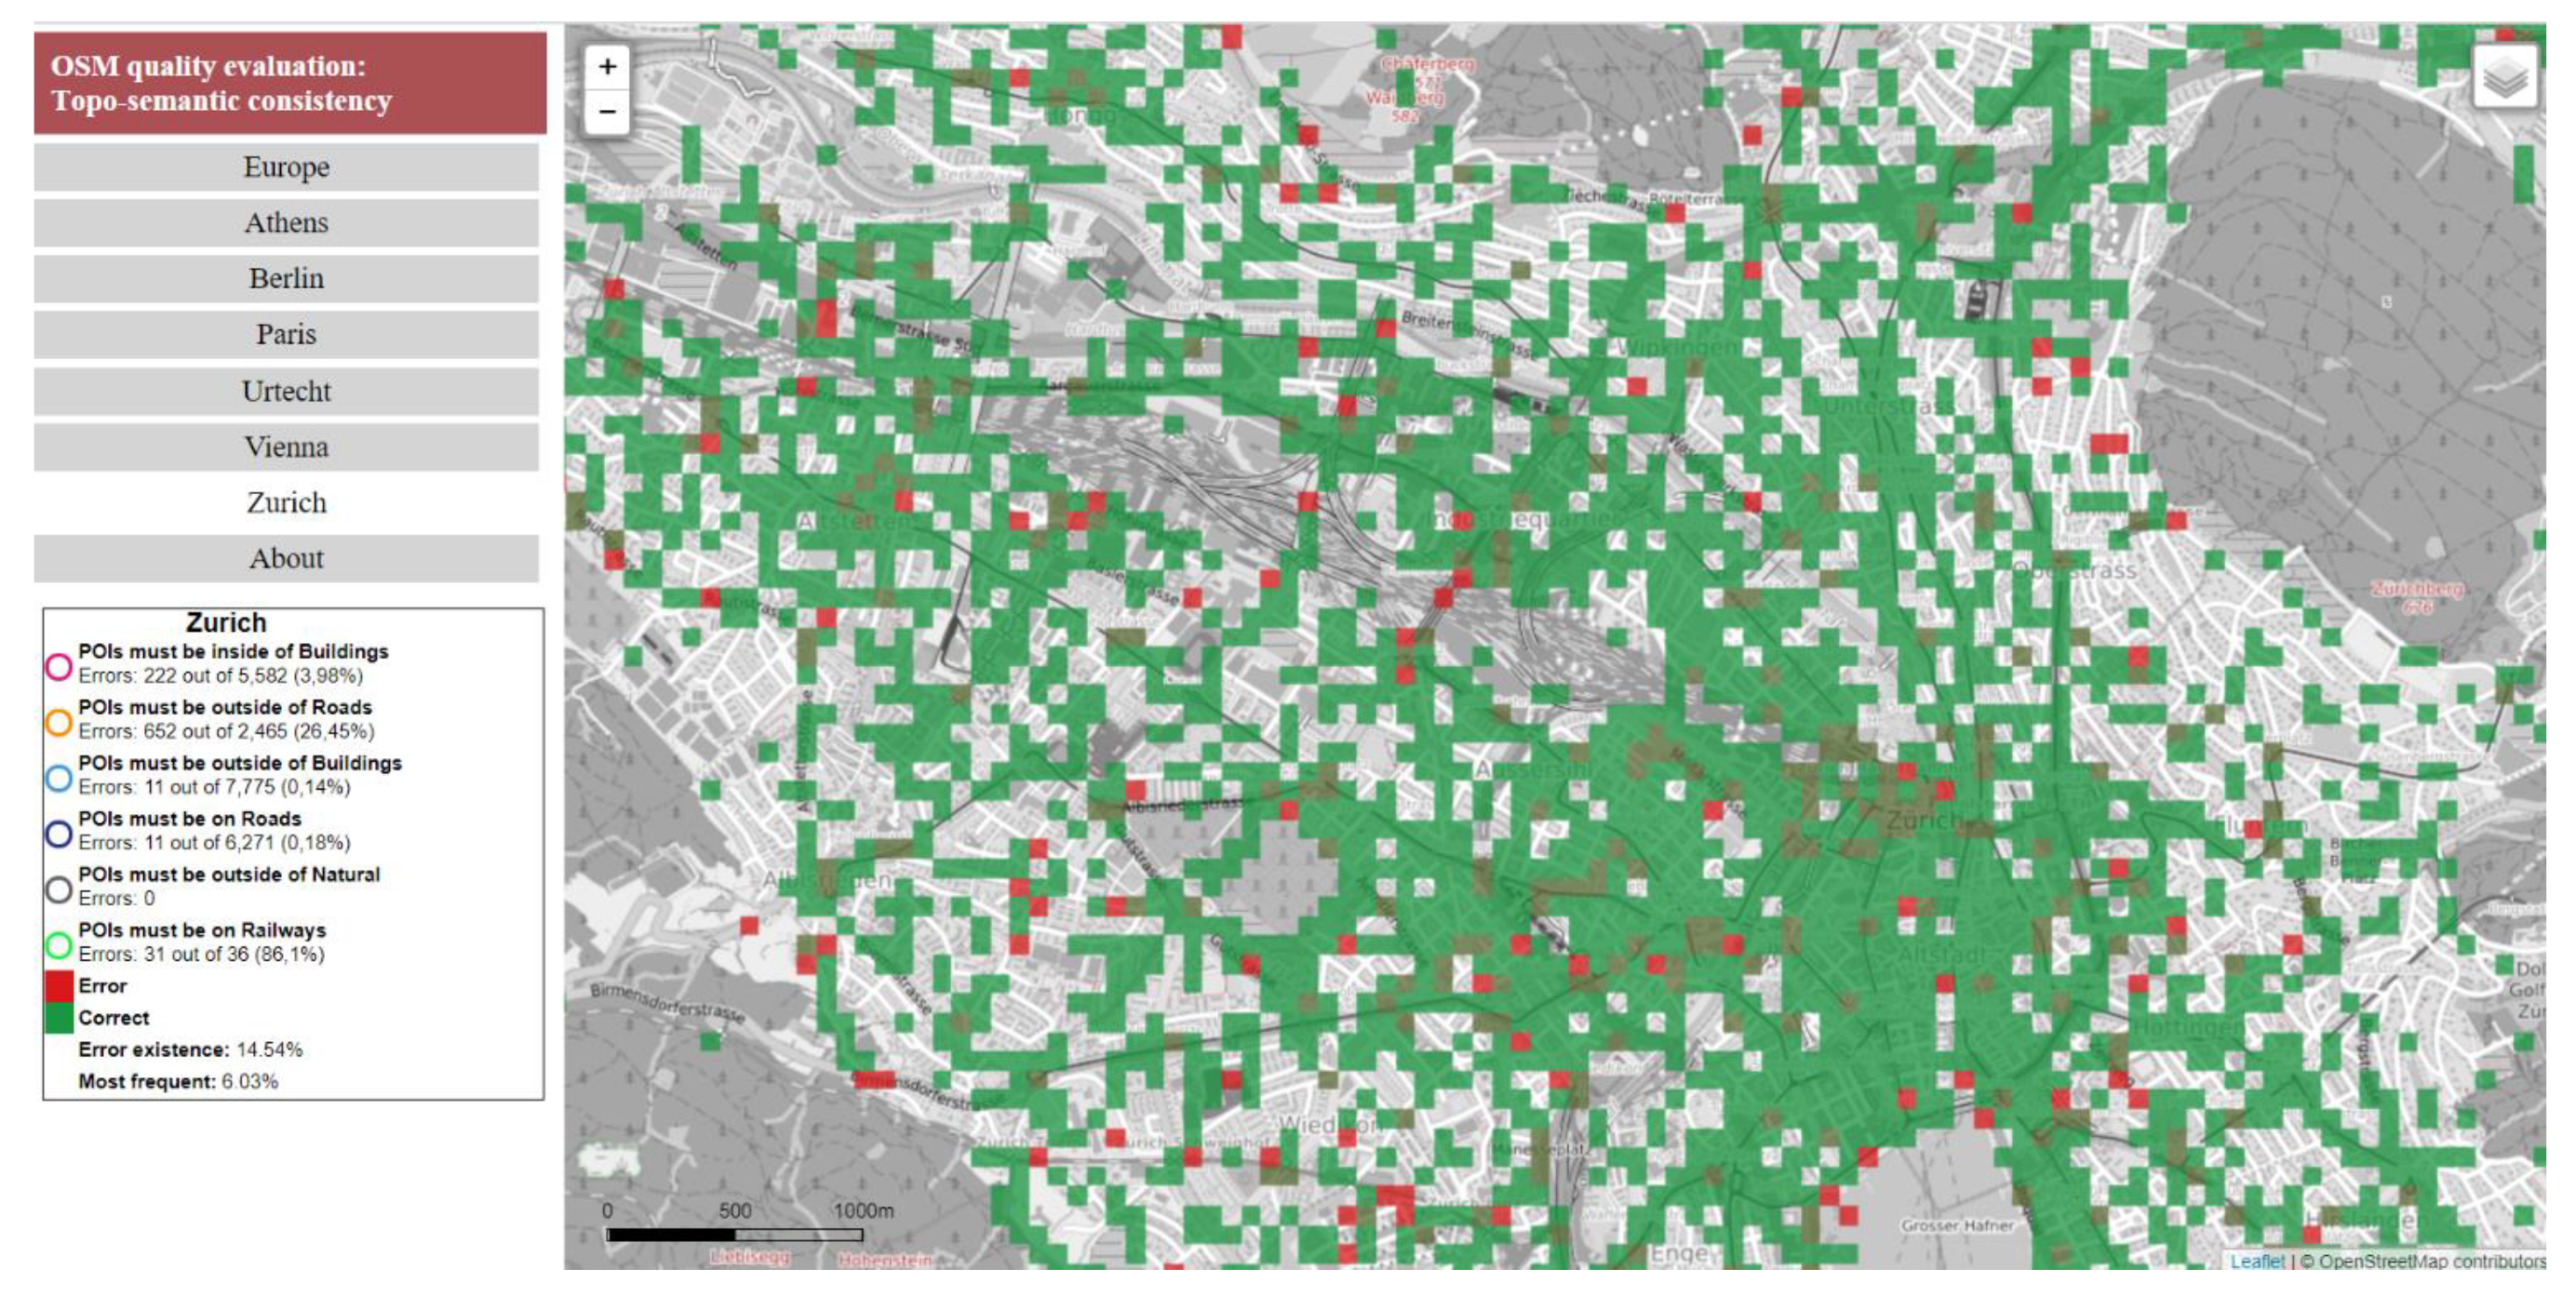
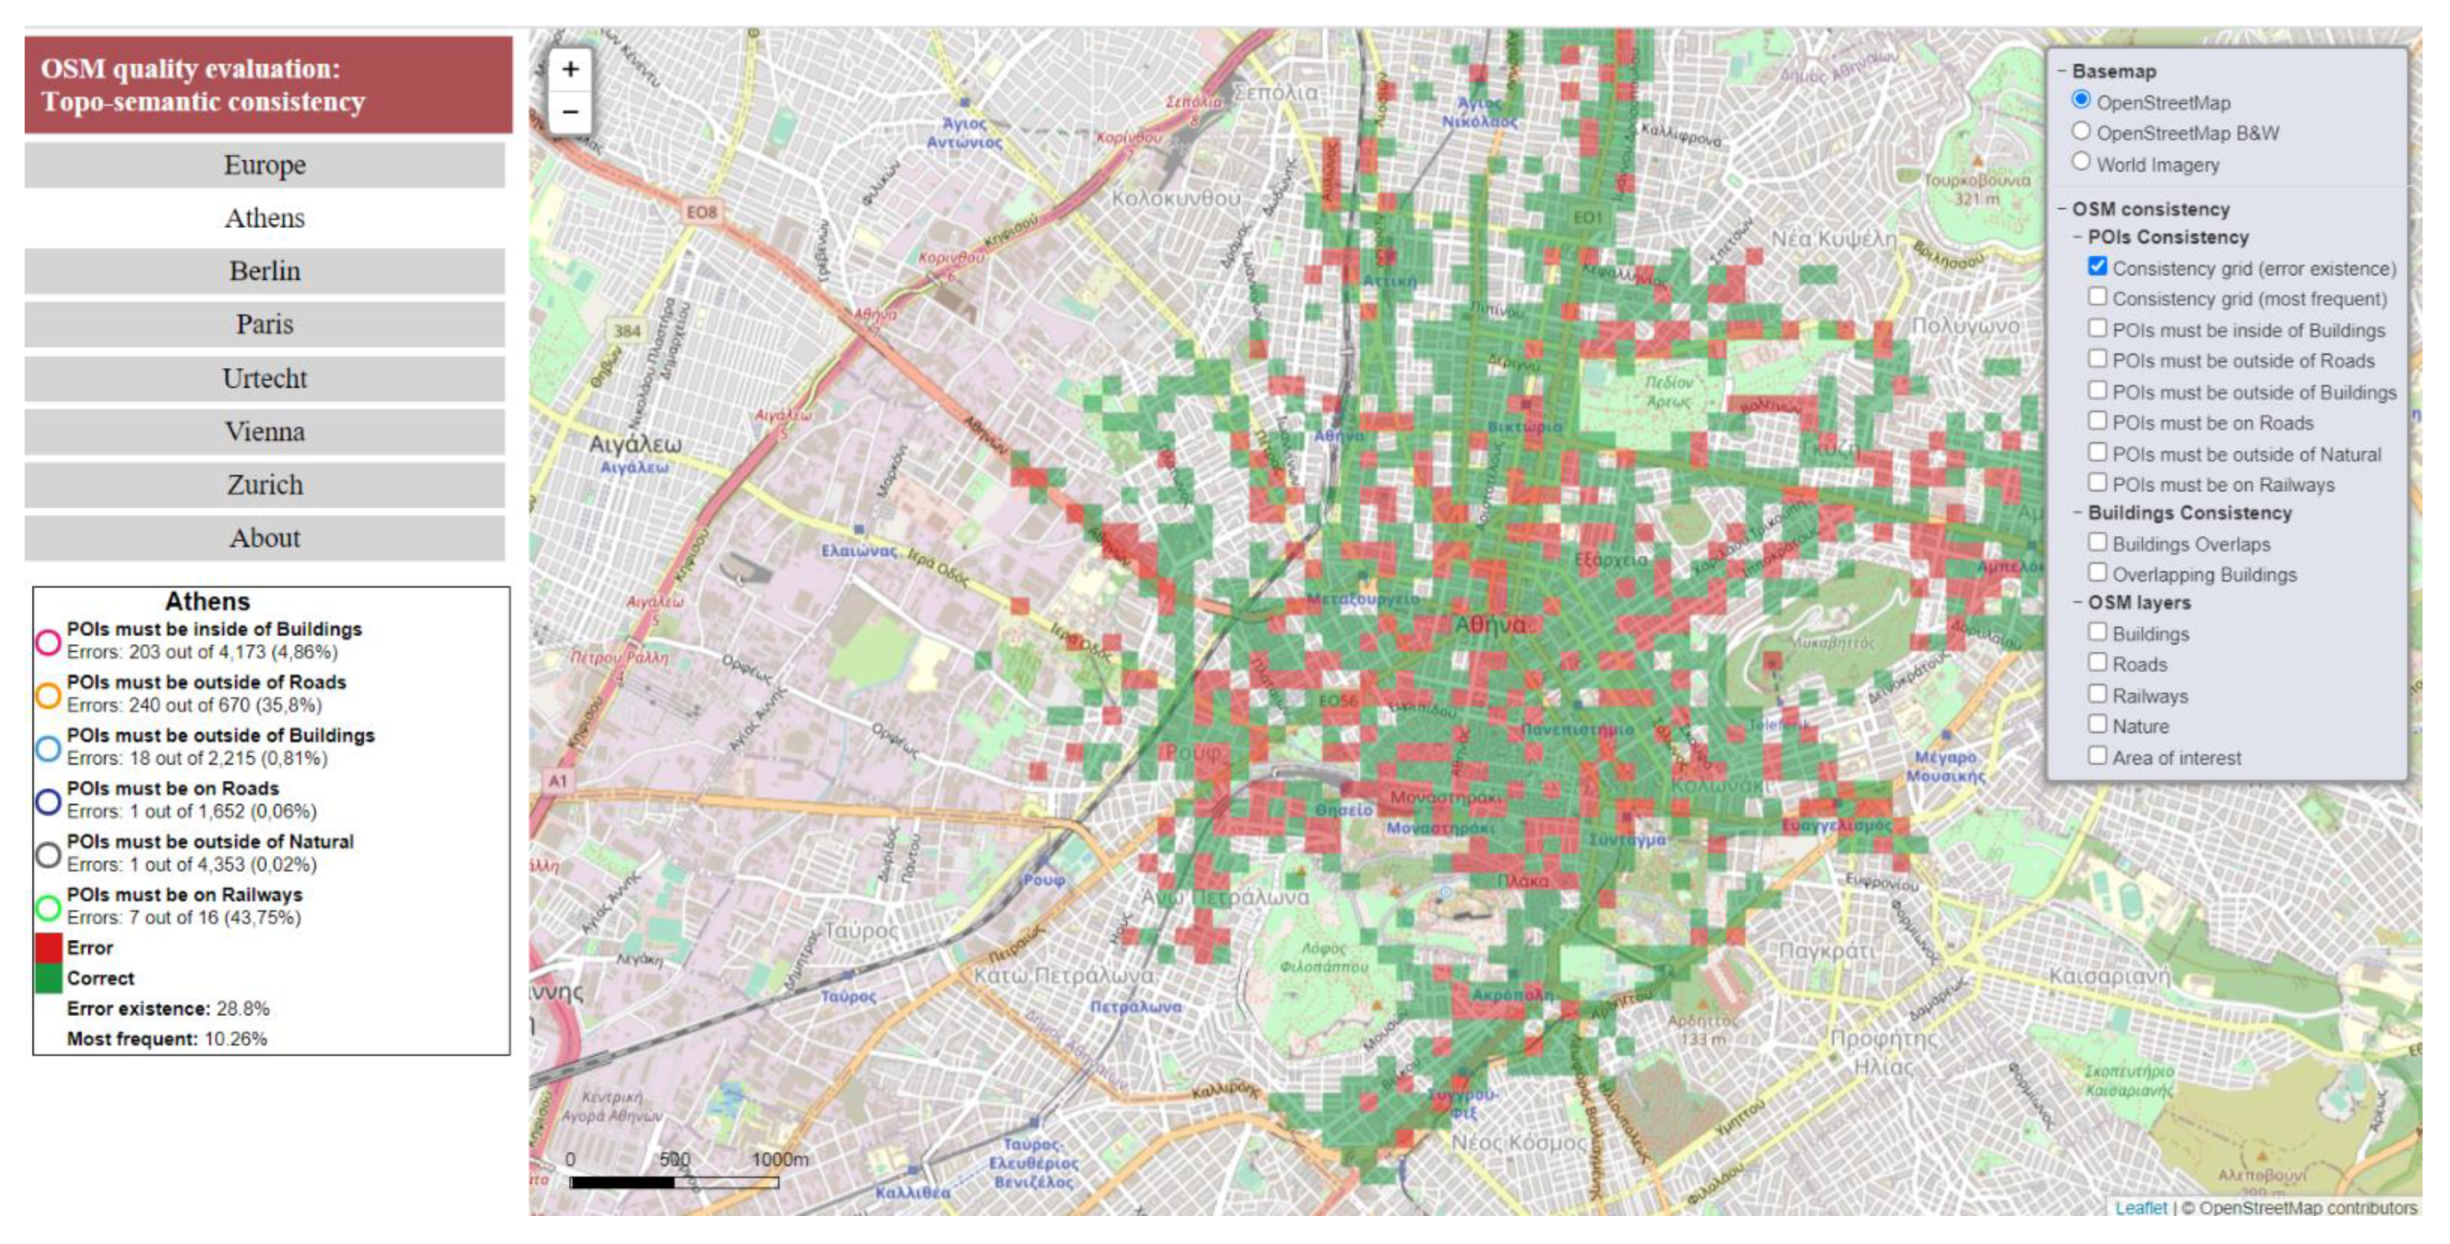
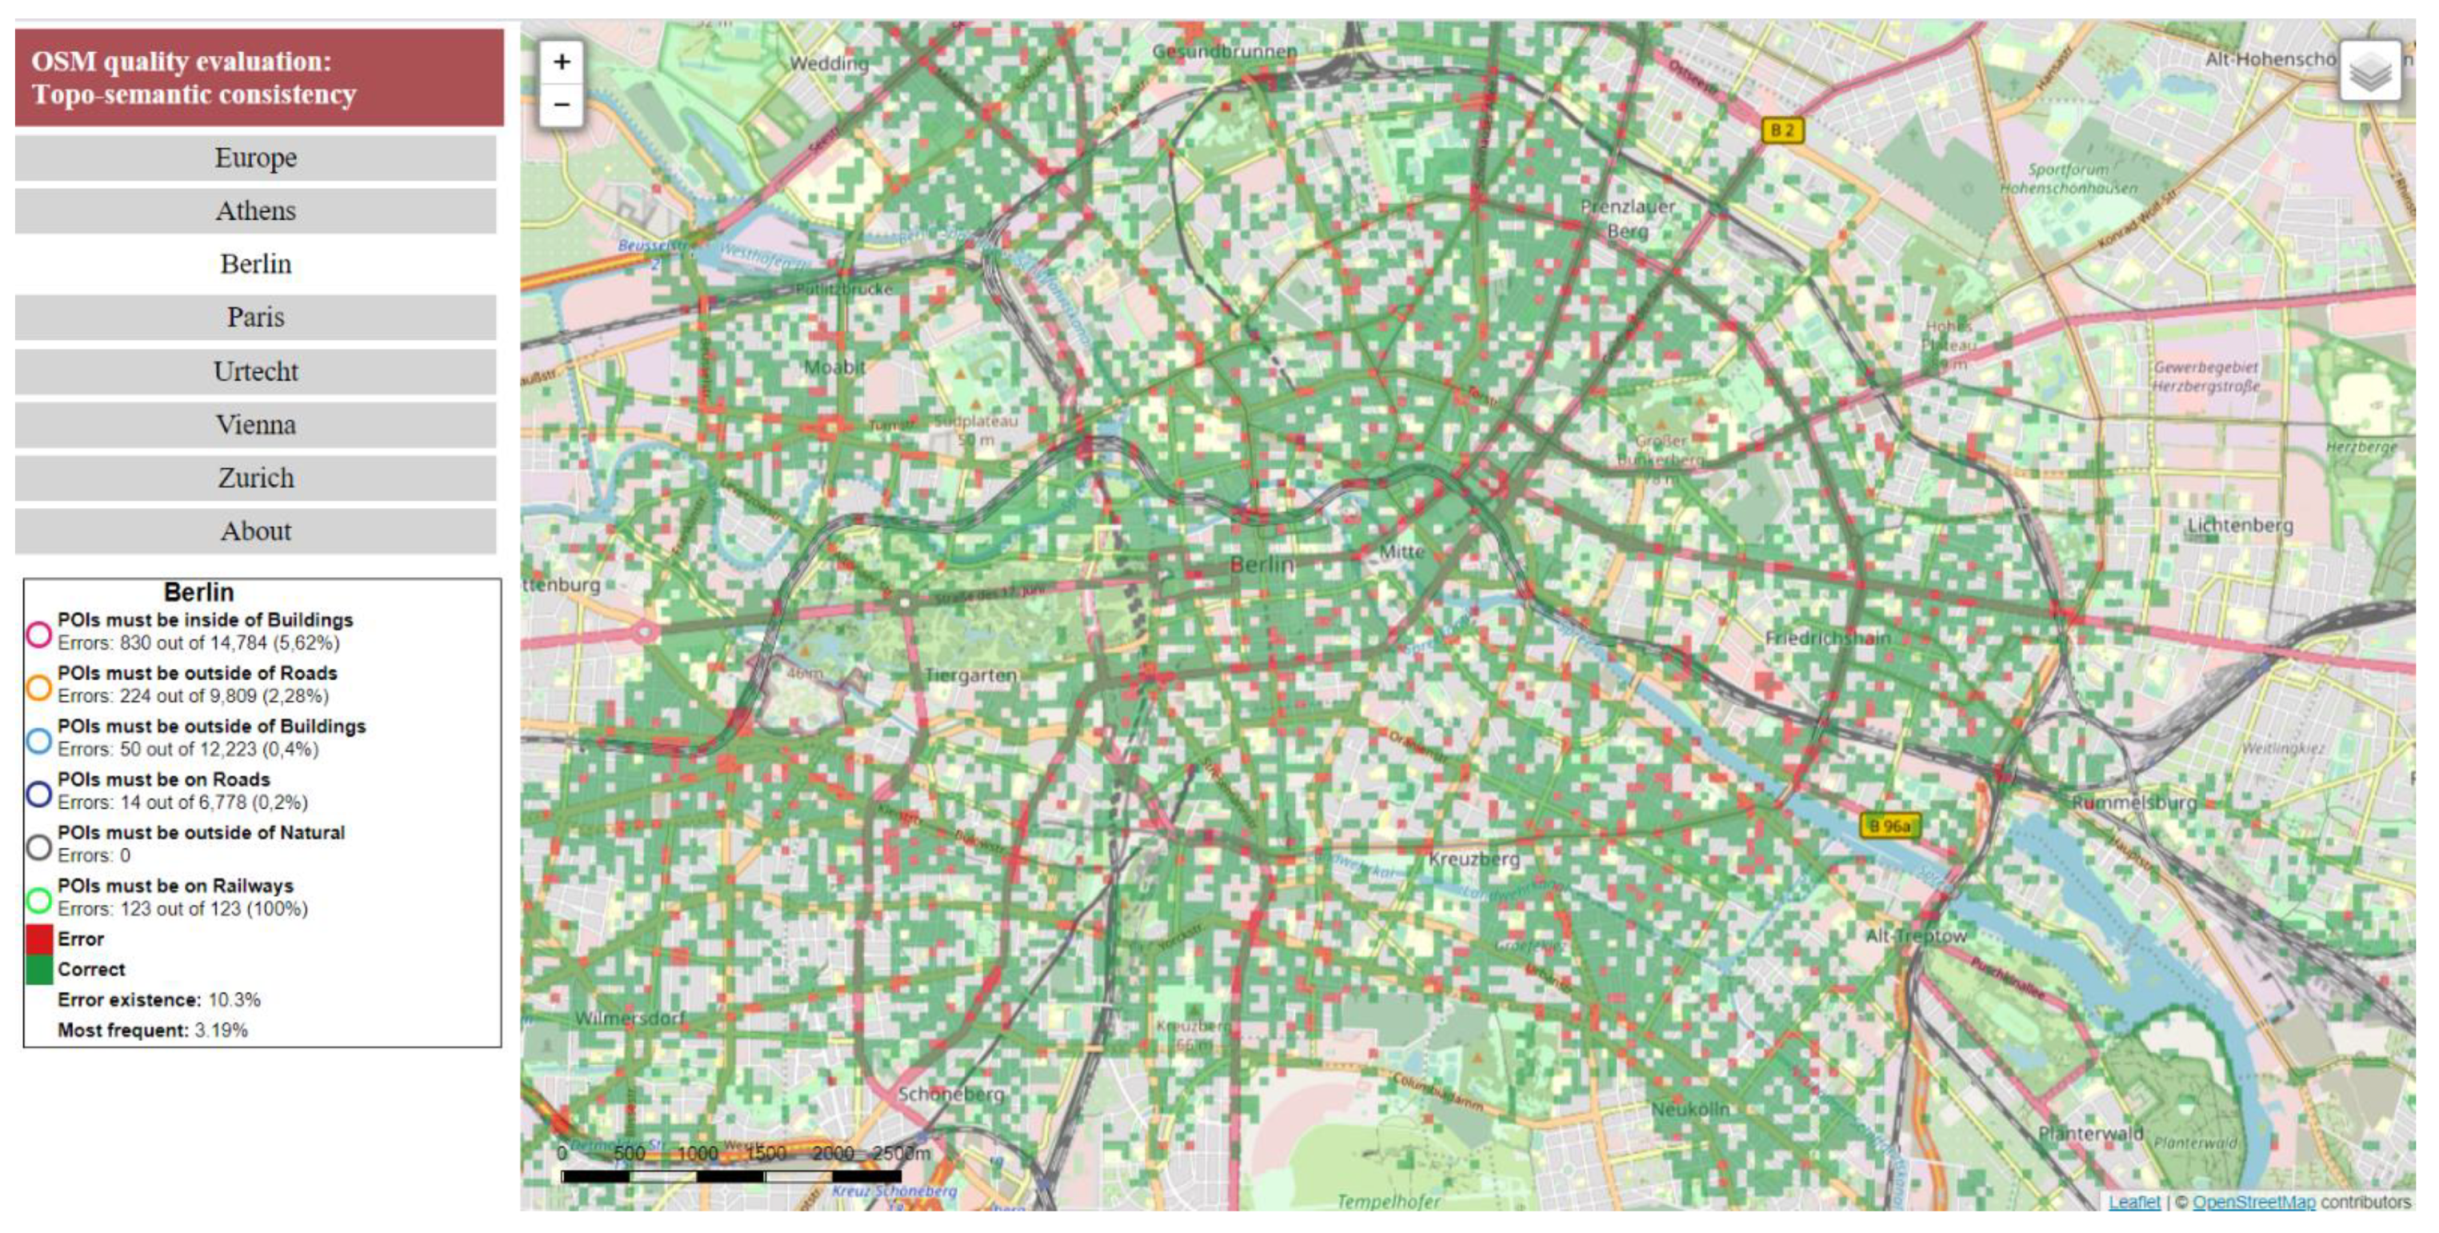
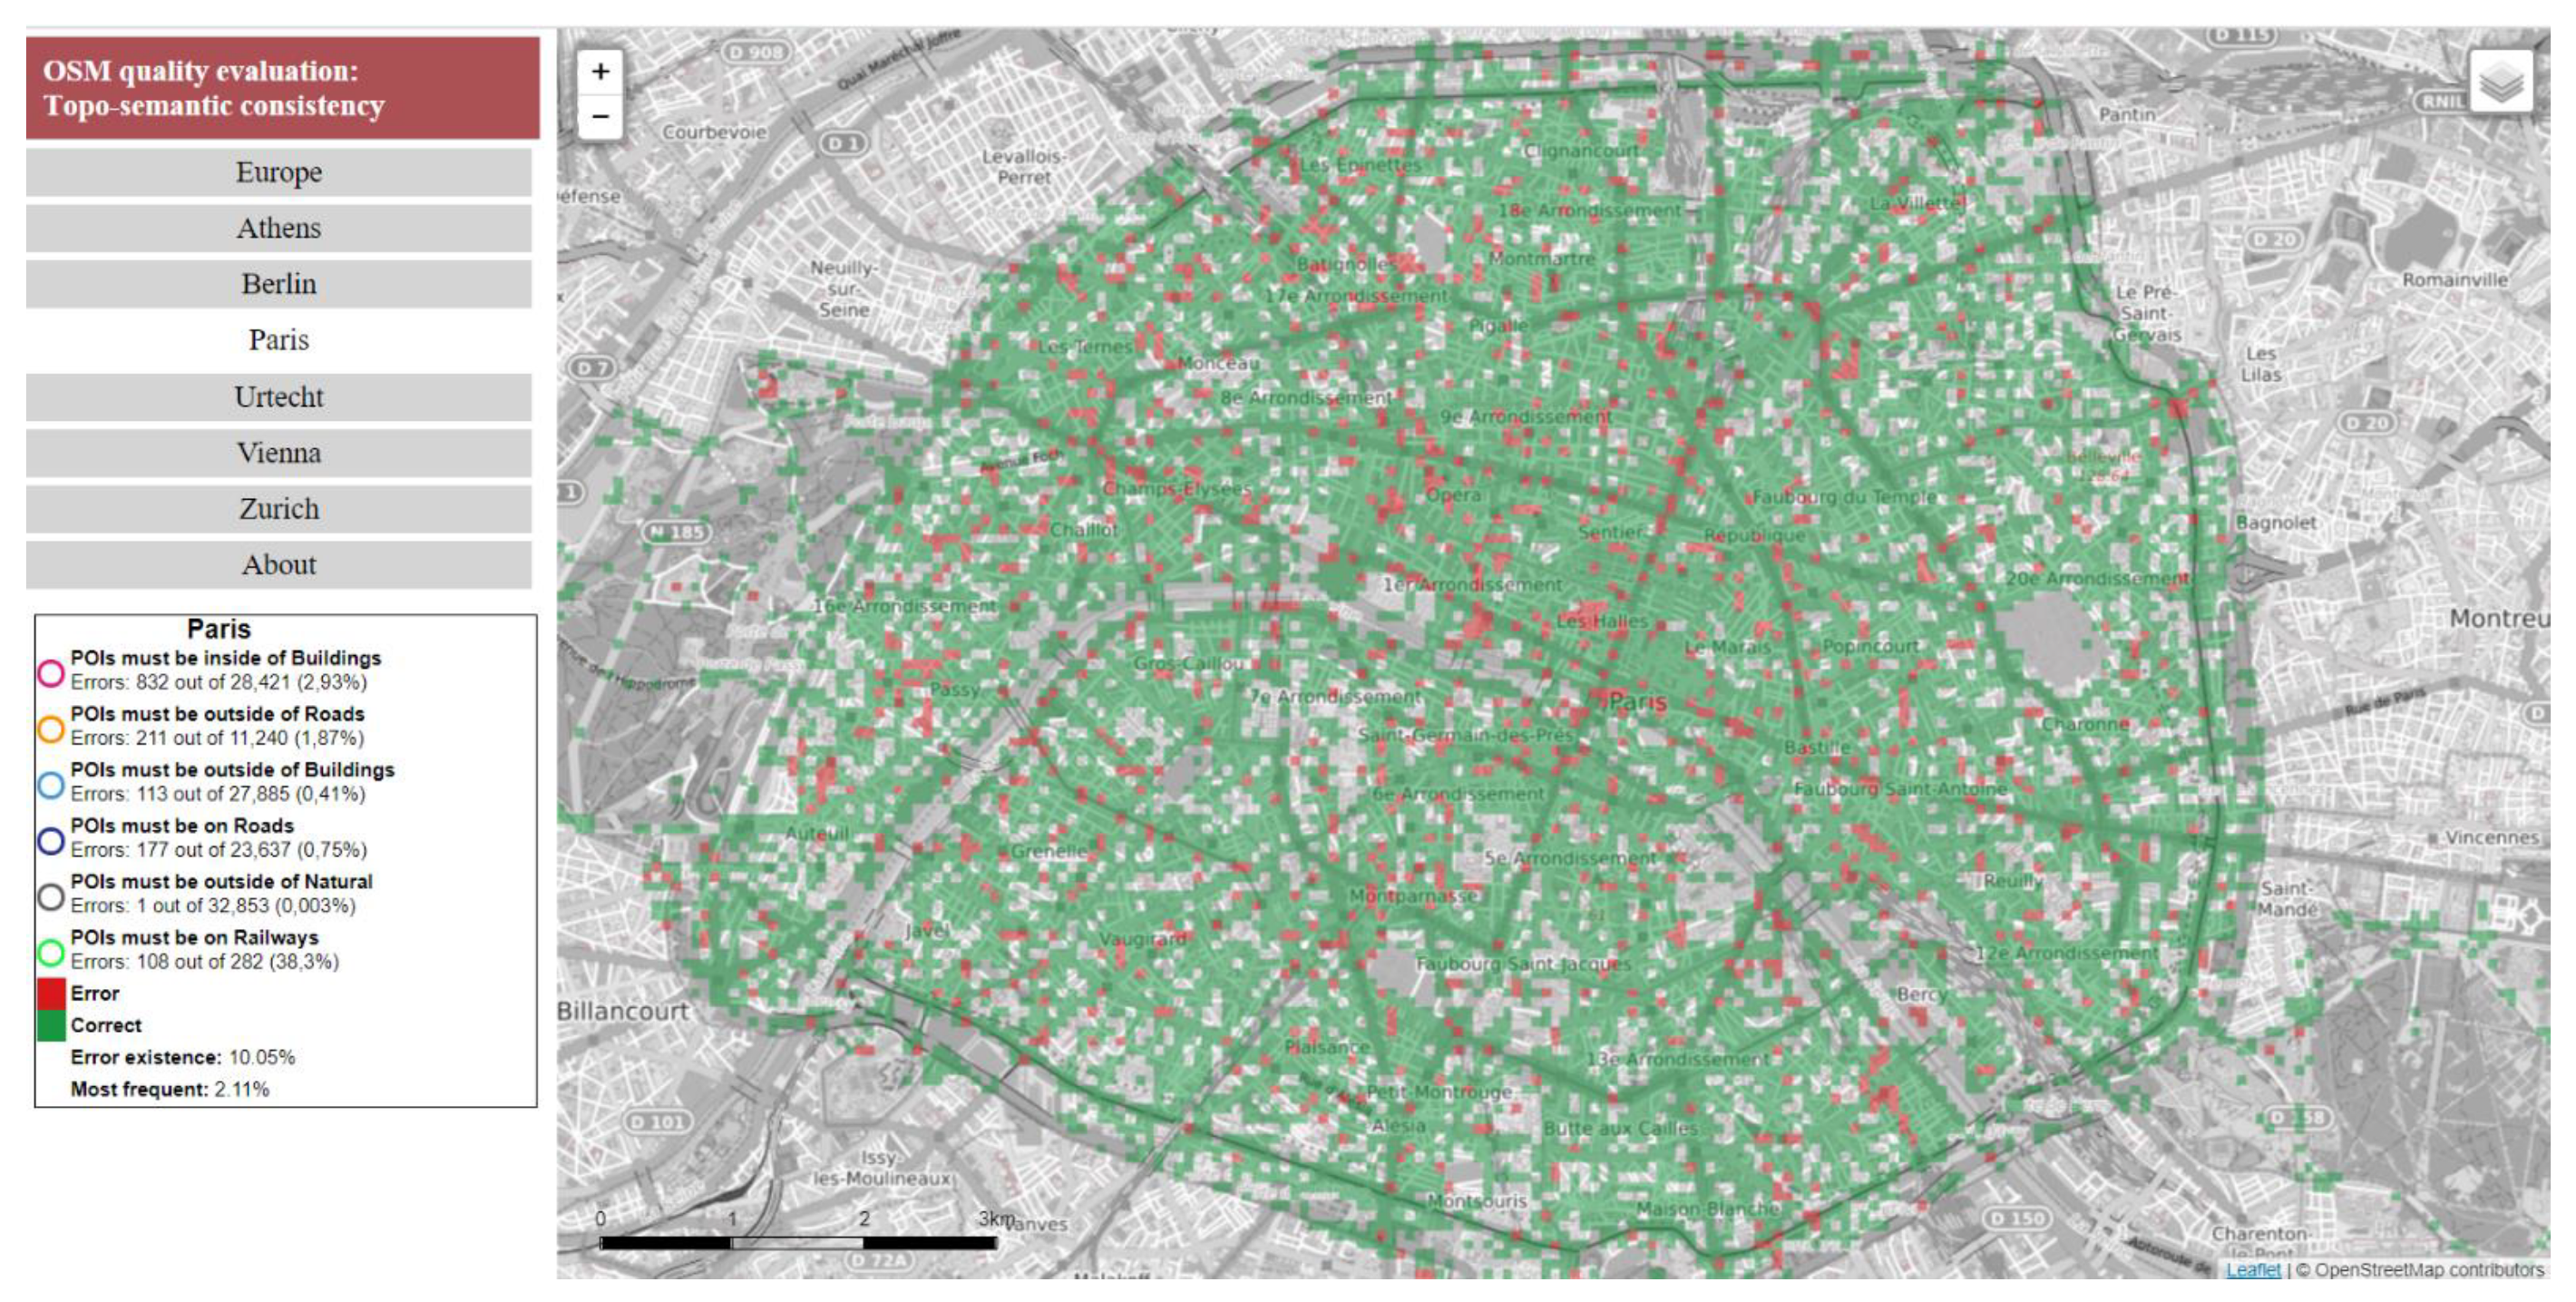
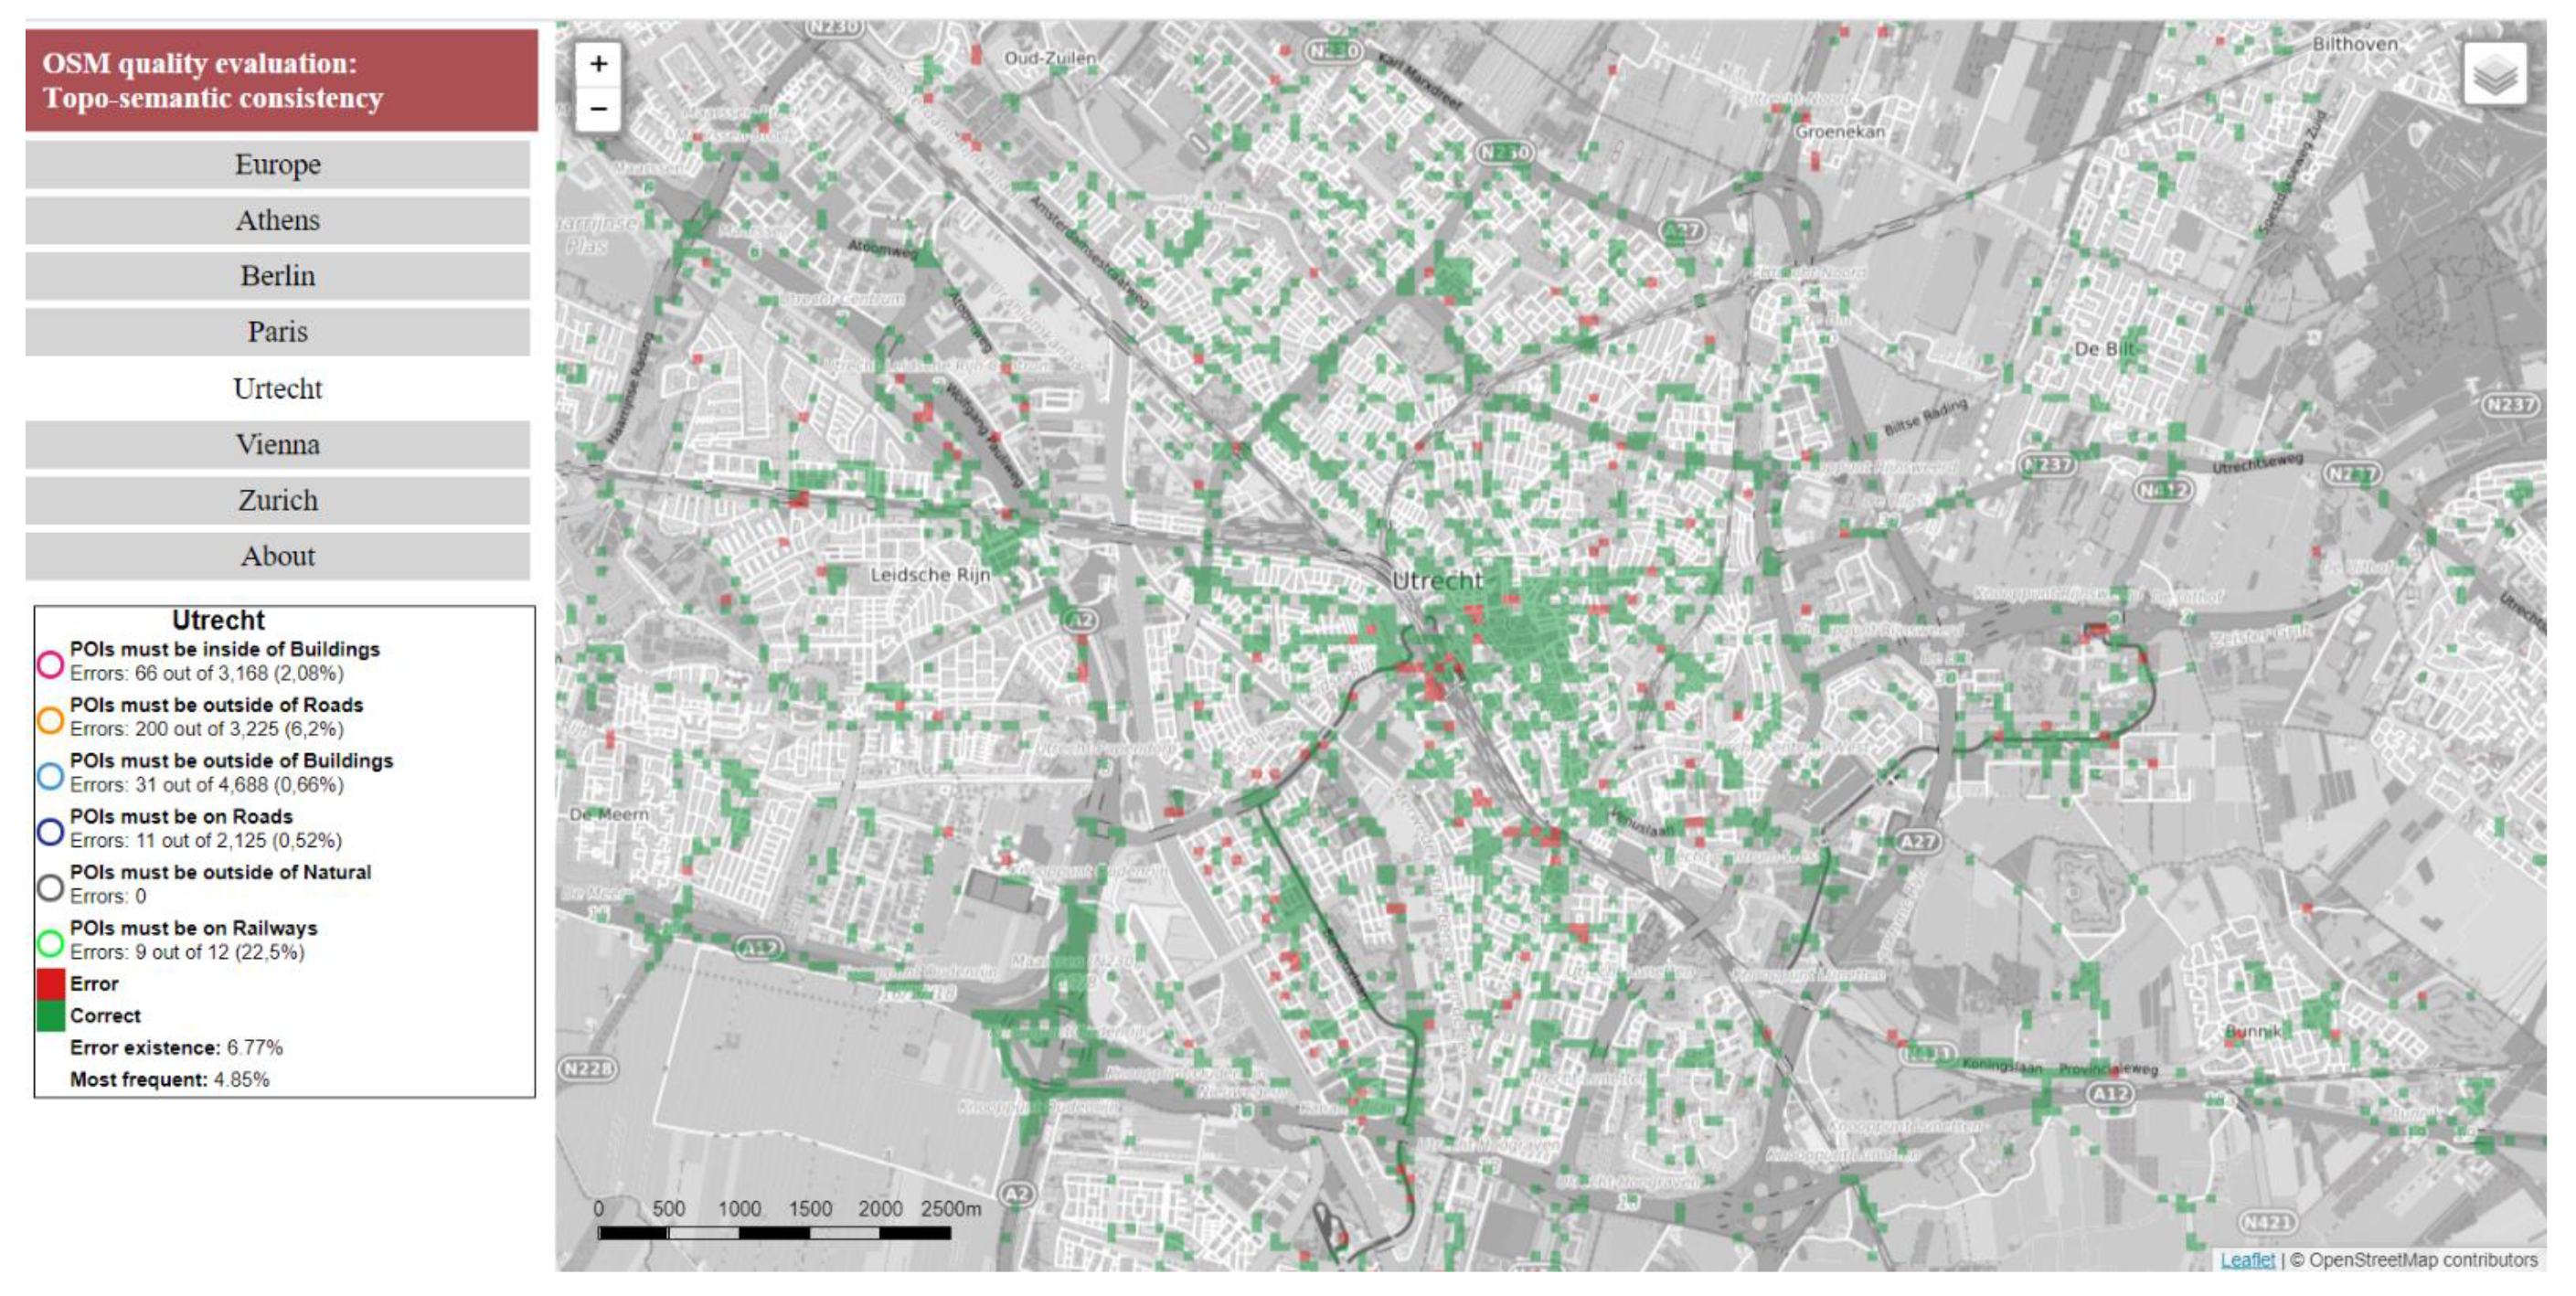
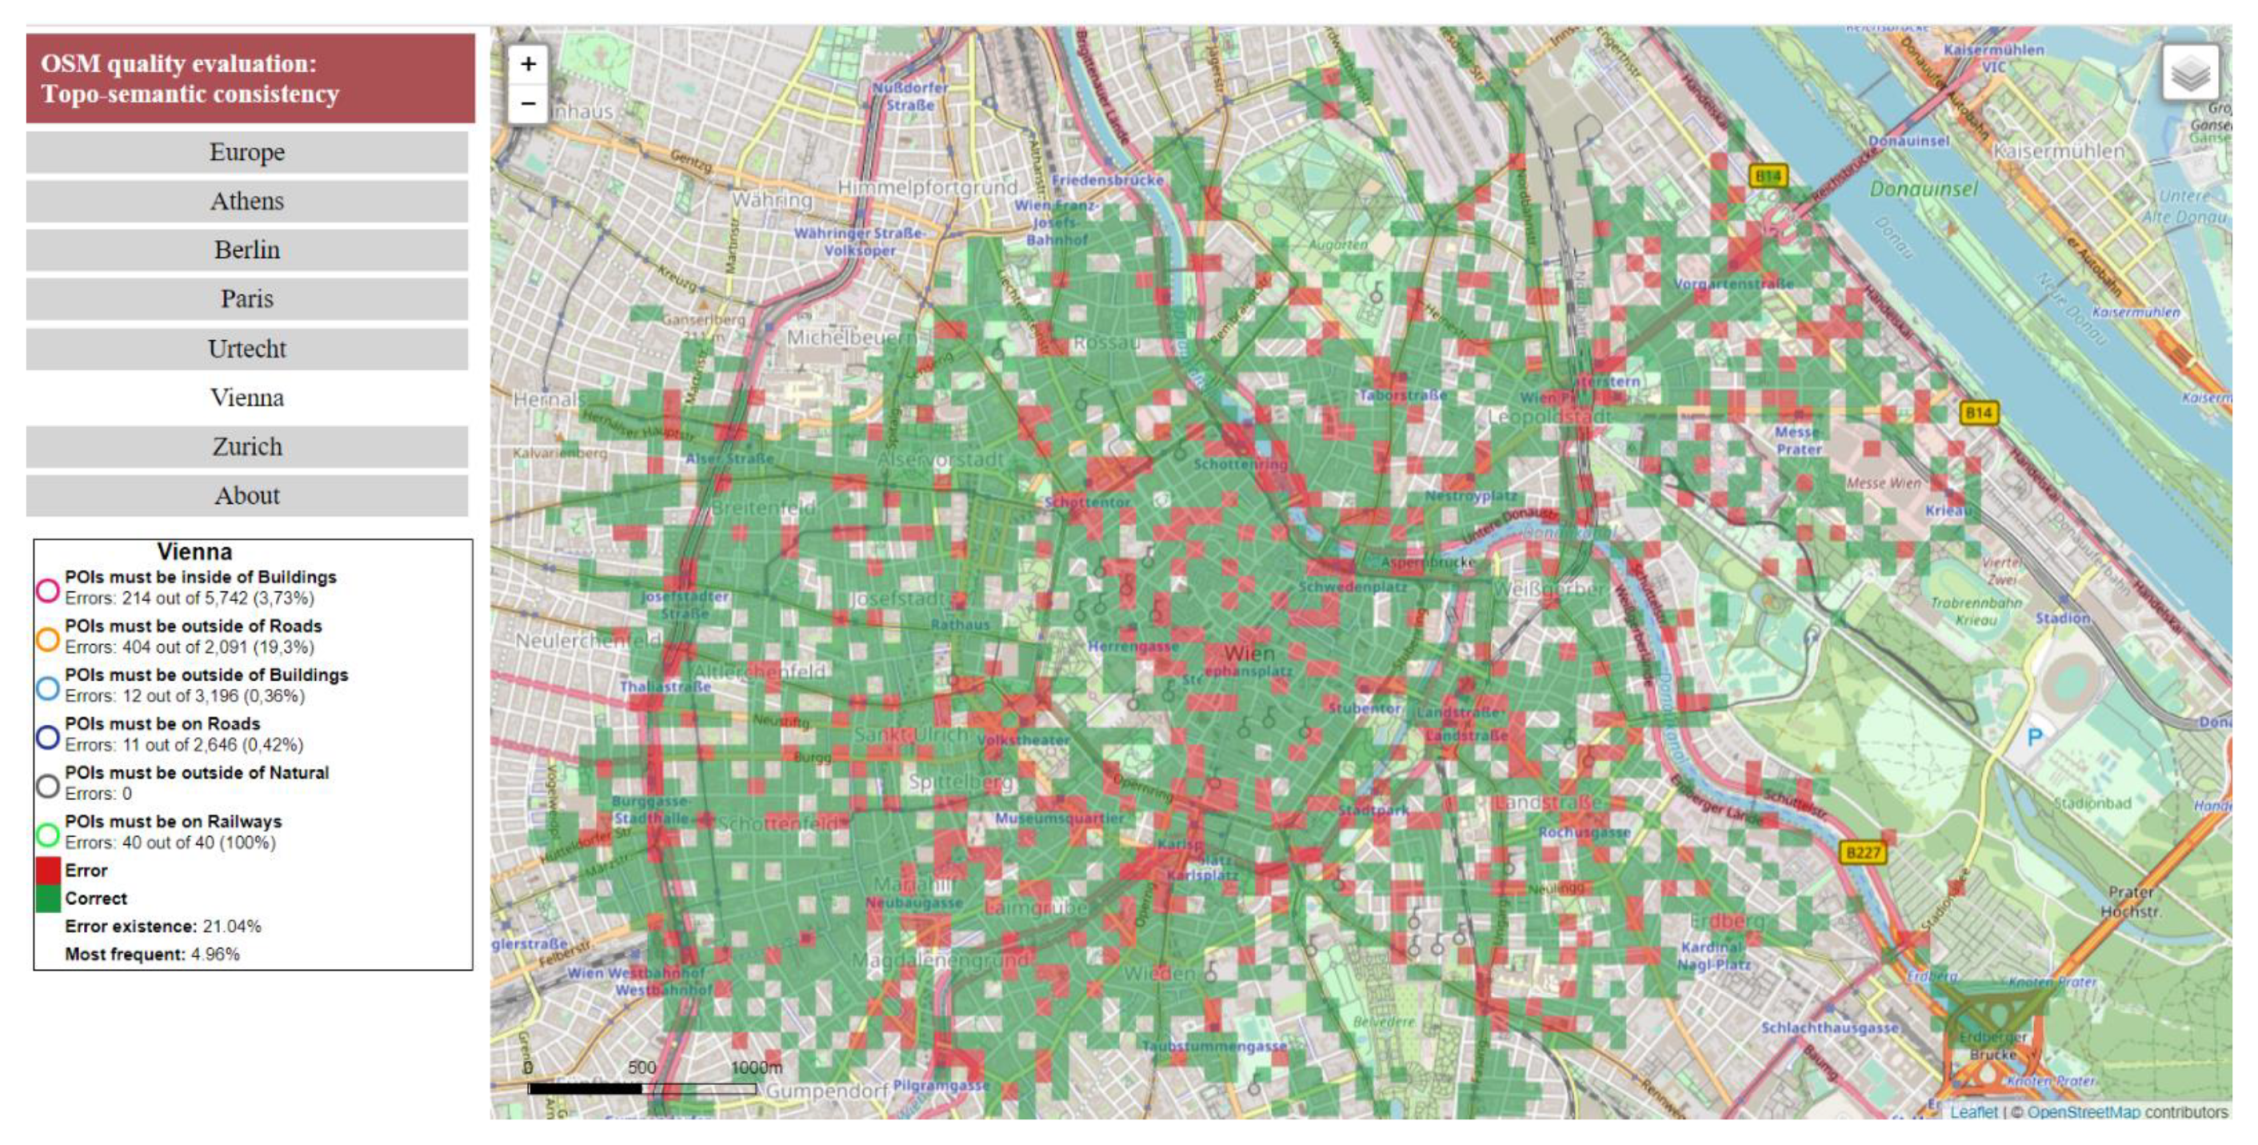
- Check 1 (POIs must be inside buildings): Berlin exhibited the most errors (15.9%) while Utrecht (2.4%) exhibited the fewest. The cities of Athens, Zurich, and Vienna had an error percentage of about 5%, and that of Paris was less than 20%. In this check, POIs on the borders of buildings were encountered as errors. If they were considered correct (see Check 1 with on border in Table 5), the percentages for Paris and Berlin diminished, and the values for all cities became similar, ranging from 2% to 6%;
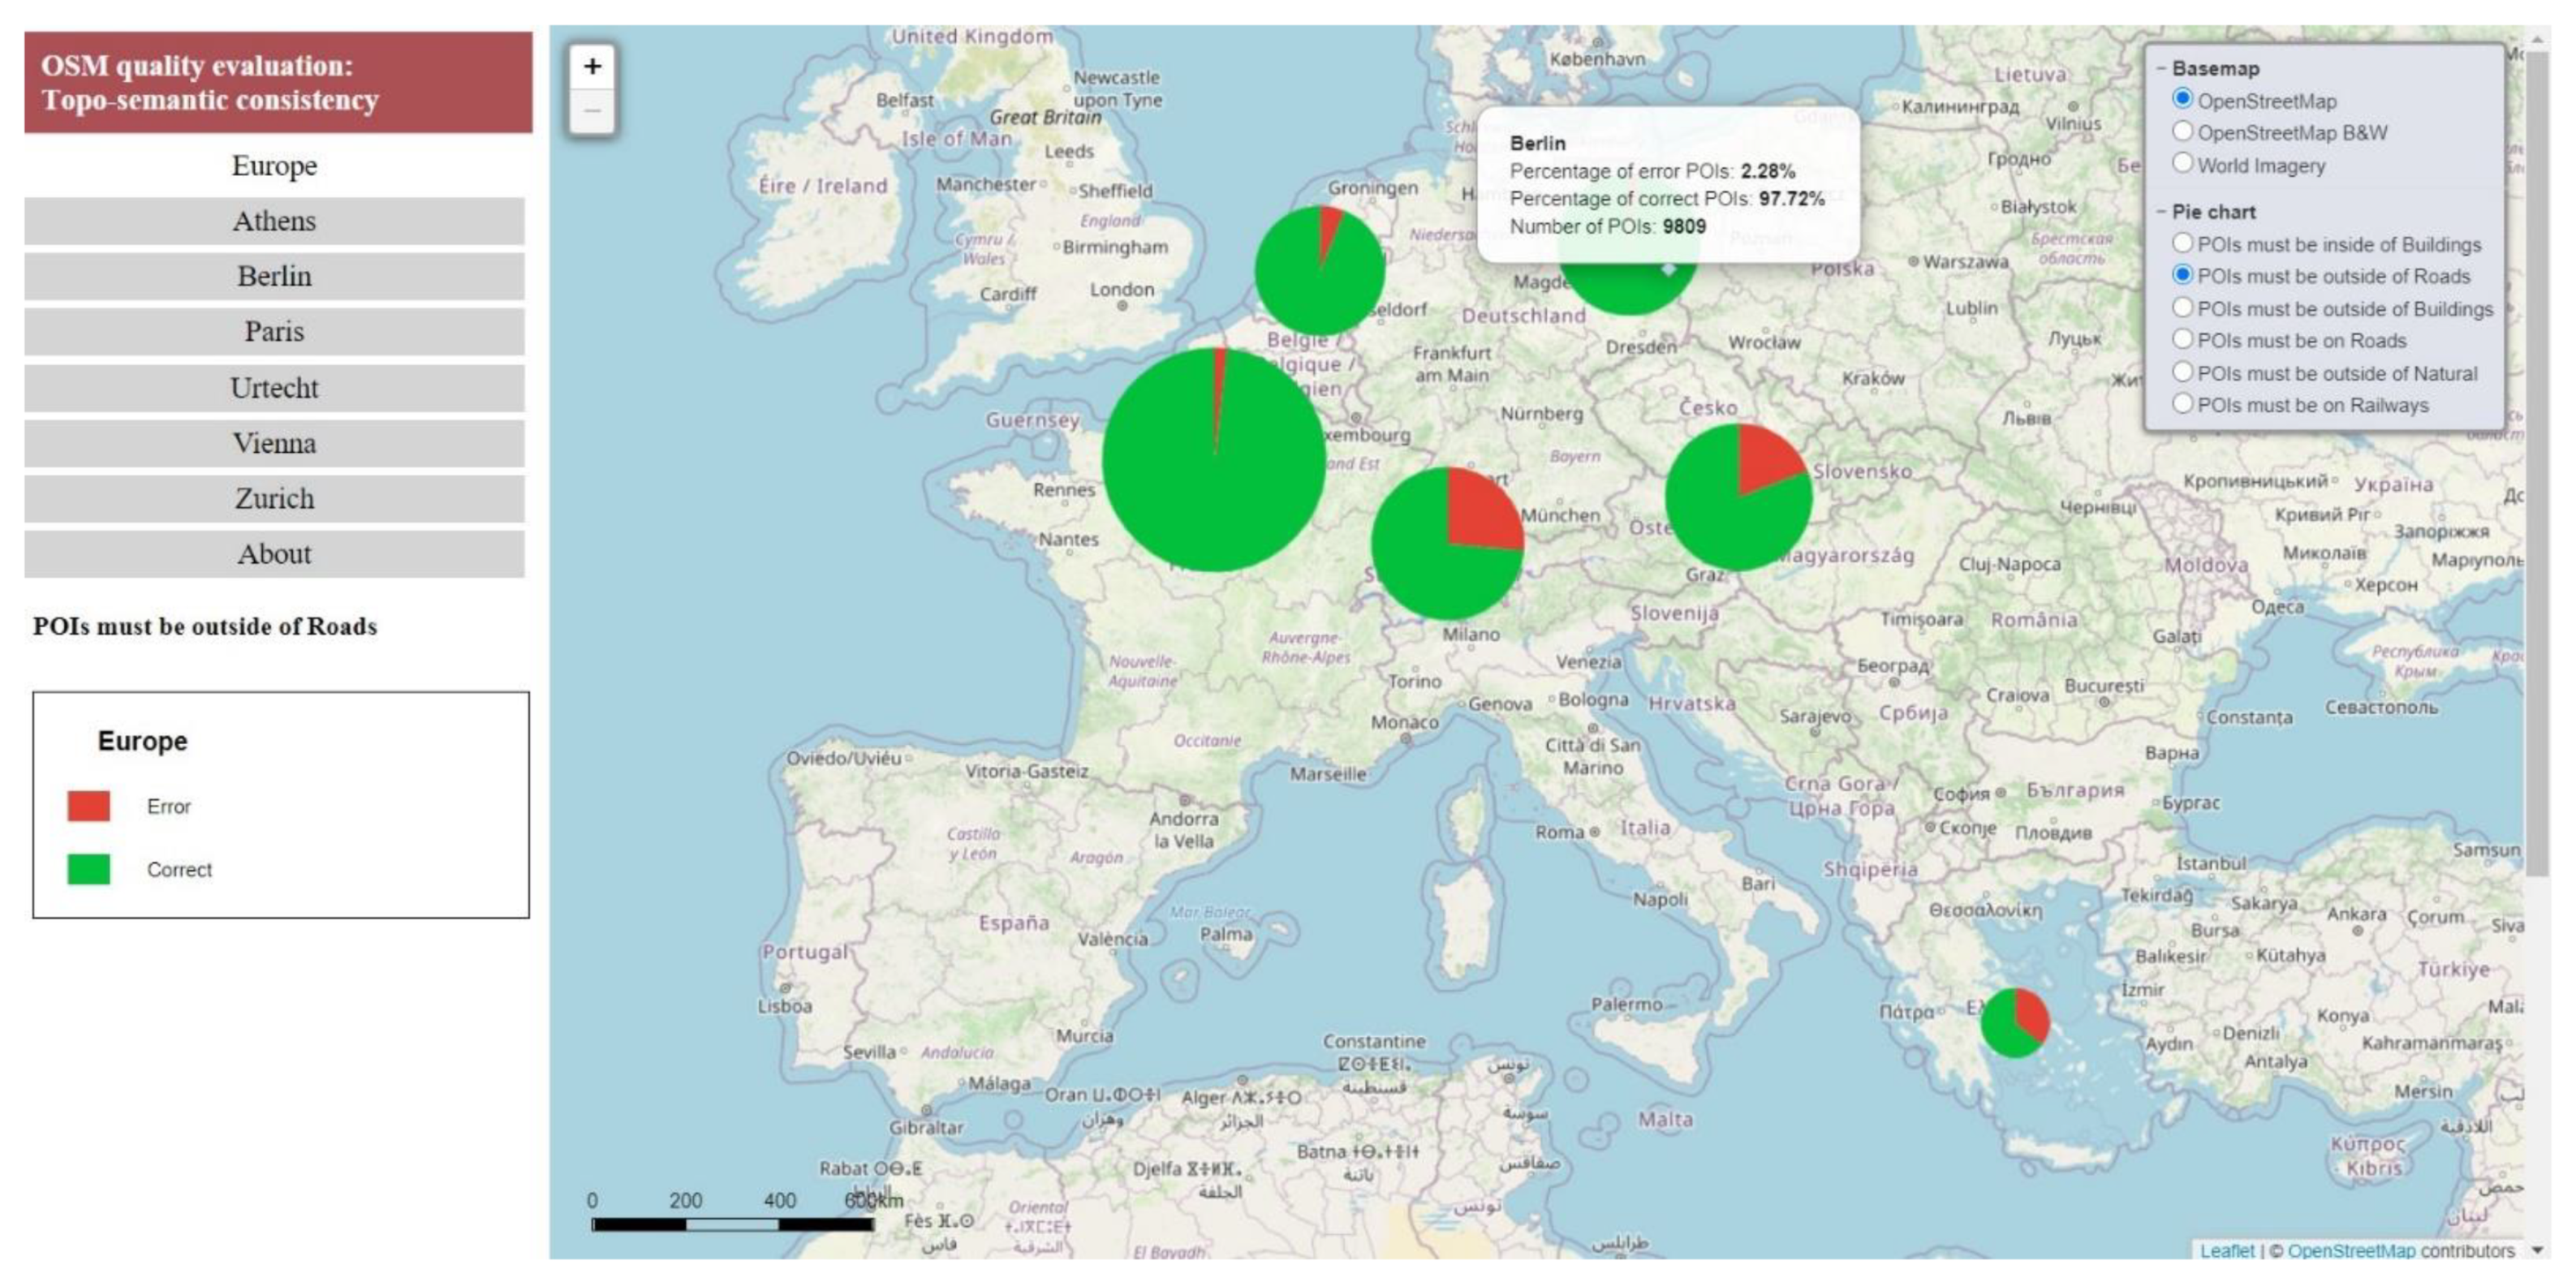
- Check 2 (POIs must be outside of roads): The highest error rate was observed in Athens (35.8%), and the lowest was in Paris (1.9%). The cities of Berlin and Utrecht exhibited error rates of less than 7%, while Vienna and Zurich had higher rates around 20–30%. This check refers to POIs such as bus stops, stops, and parking, which should not be on the road. All types of POIs may appear as error or correct, and no conclusion in terms of “Type” could be extracted. These types of POIs are not visible in the satellite imagery, and therefore, they are positioned according to the user’s personal knowledge. Additionally, they may have been imported from existing datasets where they needed to be on the road axis;
- Check 3 (POIs must be outside of buildings): The error rate was less than 1% for all cities and could be considered insignificant;
- Check 4 (POIs must be on roads): The error rate was less than 1% for all cities and could be considered insignificant;
- Check 5 (POIs must be outside of nature polygons): The lowest percentages were observed while some cities had no error at all. It is worth noting that the nature polygons had low coverage in all cities, which could justify the negligible error percentages;
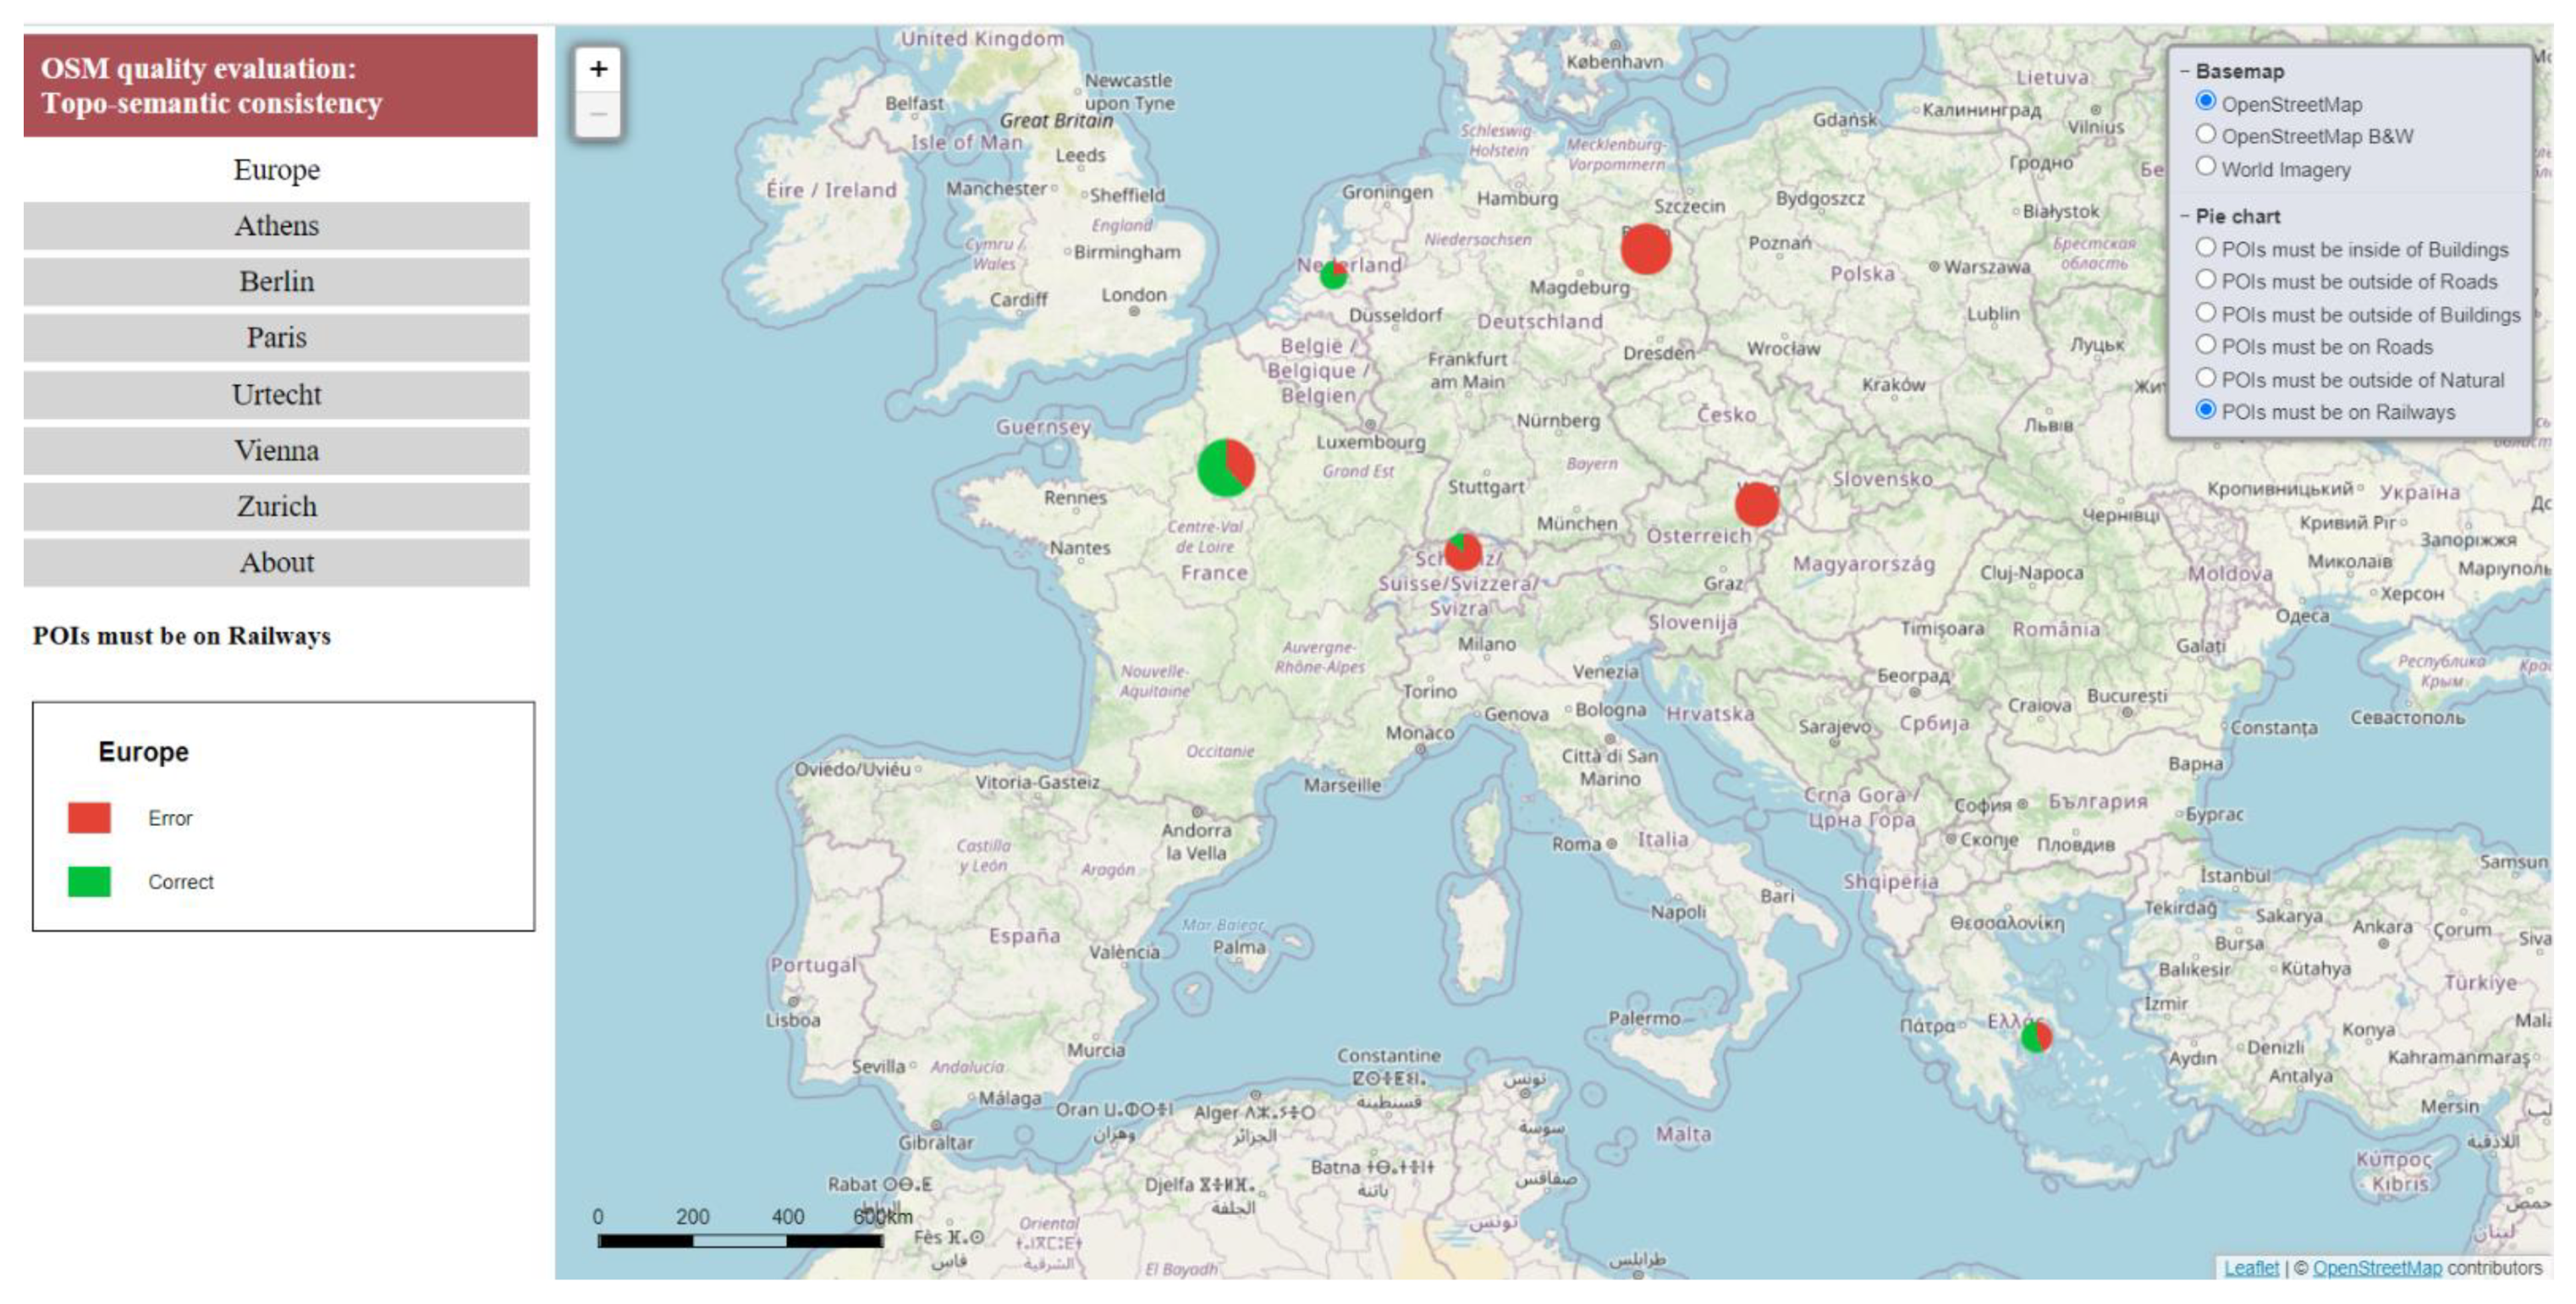
- Check 6 (POIs must be on the rail network): This was the category with the highest percentages (70–100%), and this is discussed in more detail in the following paragraphs.
4.3. Presentation of the Web Mapping Application for Quality Visualization
5. Discussion, Conclusions, and Future Work
5.1. Contribution to VGI Research and Limitations
5.2. Conclusions
- Attribute completeness: This was present in most layers. In contrast, the percentages of omissions were high for buildings, but Berlin and Utrecht had percentages lower than 50%, signaling a lead in attribute completeness for these cities;
- Building overlap: Small percentages were found for all cities. Berlin, Vienna, and Zurich exhibited a lead in data consistency for buildings;
- Road overlap: Insignificant values were found for all cities;
- Regarding POΙs that must be inside buildings, the error percentages were similar for all cities, ranging from 2% to 6%. Some errors were caused by the omission of buildings. It can be seen that for all cities, almost half of the POIs were located in the sidewalk area (<2 m), a critical percentage from 56% to 90% was on the same side of the street (<5.5 m), and an essential percentage from 76% to 94% was in the broader street area. Excluding outliers, an average position error was estimated at four meters;
- For POIs that must be outside of roads and POIs that must be on rails, significant errors were observed in all cities;
- Topo-semantic consistency error grids: Utrecht had the best score based on the “Consistency Grid (error existence)”, and Paris had the best score for “Consistency Grid (most frequent)”. Athens had the worst scores. Berlin, Paris, and Utrecht exhibited average values in both grids and could be considered as having acceptable consistency.
5.3. Proposals
Author Contributions
Funding
Conflicts of Interest
Appendix A. Topo-Semantic Tests for POIs

| OSM Type | Check 1 | Check 2 | Check 3 | Check 4 | Check 5 | Check 6 |
|---|---|---|---|---|---|---|
| arts_centre | x | |||||
| atm | x | |||||
| bakery | x | |||||
| bank | x | |||||
| bar | x | |||||
| beauty_shop | x | |||||
| beverages | x | |||||
| bicycle_rental | x | |||||
| bicycle_shop | x | |||||
| bookshop | x | |||||
| bus_stop | x | x | x | |||
| butcher | x | x | ||||
| cafe | x | x | ||||
| camera_surveillance | x | |||||
| car_dealership | x | x | x | |||
| car_rental | x | x | ||||
| cinema | x | x | ||||
| clothes | x | x | ||||
| college | x | x | ||||
| community_centre | x | x | ||||
| computer_shop | x | x | ||||
| convenience | x | x | ||||
| crossing | x | x | ||||
| dentist | x | x | ||||
| department_store | x | x | ||||
| doctors | x | x | ||||
| doityourself | x | x | ||||
| fast_food | x | x | ||||
| fire_station | x | x | ||||
| florist | x | x | ||||
| fuel | x | x | ||||
| furniture_shop | x | x | ||||
| gift_shop | x | x | ||||
| greengrocer | x | x | ||||
| guesthouse | x | x | ||||
| hairdresser | x | x | ||||
| hostel | x | x | ||||
| hotel | x | x | ||||
| jeweller | x | x | ||||
| kindergarten | x | x | ||||
| kiosk | x | |||||
| laundry | x | x | ||||
| library | x | x | ||||
| mobile_phone_shop | x | x | ||||
| motorway_junction | x | x | ||||
| museum | x | x | ||||
| nightclub | x | x | ||||
| optician | x | x | ||||
| outdoor_shop | x | x | ||||
| parking | x | x | ||||
| parking_bicycle | x | x | ||||
| parking_underground | x | |||||
| pharmacy | x | x | ||||
| pitch | x | |||||
| police | x | x | ||||
| post_office | x | x | ||||
| pub | x | x | ||||
| railway_station | x | |||||
| restaurant | x | x | ||||
| school | x | x | ||||
| shoe_shop | x | x | ||||
| sports_centre | x | x | ||||
| sports_shop | x | x | ||||
| stop | x | x | ||||
| street_lamp | x | x | ||||
| supermarket | x | x | ||||
| taxi | x | x | ||||
| theatre | x | x | ||||
| toy_shop | x | x | ||||
| traffic_signals | x | x | ||||
| travel_agent | x | x | ||||
| turning_circle | x | x | ||||
| vending_any | x | |||||
| veterinary | x | x |
Appendix B. The Web Mapping Application


References
- Goodchild, M.F. Citizens as sensors: The world of volunteered geography. Geo. J. 2007, 69, 211–221. [Google Scholar] [CrossRef] [Green Version]
- Connors, J.P.; Lei, S.; Kelly, M. Citizen science in the age of neogeography: Utilizing volunteered geographic information for environmental monitoring. Ann. Assoc. Am. Geogr. 2012, 102, 1267–1289. [Google Scholar] [CrossRef]
- Klonner, C.; Marx, S.; Usón, T.; de Albuquerque, J.P.; Höfle, B. Volunteered geographic information in natural hazard analysis: A systematic literature review of current approaches with a focus on preparedness and mitigation. ISPRS Int. J. Geo-Inf. 2016, 5, 103. [Google Scholar] [CrossRef] [Green Version]
- Olteanu-Raimond, A.-M.; Laakso, M.; Antoniou, V.; Fonte, C.C.; Fonseca, A.; Grus, M.; Harding, J.; Kellenberger, T.; Minghini, M.; Skopeliti, A. VGI in National Mapping Agencies: Experiences and Recommendations. In Mapping and the Citizen Sensor; IFoody, G., See, L., Fritz, S., Mooney, P., Olteanu-Raimond, A.-M., Fonte, C.C., Antoniou, V., Eds.; Ubiquity Press: London, UK, 2017; pp. 299–326. [Google Scholar] [CrossRef] [Green Version]
- See, L.; Estima, J.; Pődör, A.; Arsanjani, J.J.; Bayas, J.-C.L.; Vatseva, R. Sources of VGI for Mapping. In Mapping and the Citizen Sensor; Foody, G., See, L., Fritz, S., Mooney, P., Olteanu-Raimond, A.-M., Fonte, C.C., Antoniou, V., Eds.; Ubiquity Press: London, UK, 2017; pp. 13–35. [Google Scholar] [CrossRef] [Green Version]
- Santos, T.; Mendes, R.N.; Vasco, A. Recreational activities in urban parks: Spatial interactions among users. J. Outdoor Recreat. Tour. 2016, 15, 1–9. [Google Scholar] [CrossRef]
- MacEachren, A.M.; Brewer, C.; Pickle, L.W. Mapping health statistics: Representing data reliability. In Proceedings of the 17th International Cartographic Conference, Barcelona, Spain, 3–9 September 1995; pp. 311–319. [Google Scholar]
- Leitner, M.; Buttenfield, B.P. Guidelines for the display of attribute certainty. Cartogr. Geogr. Inf. Sci. 2000, 27, 3–14. [Google Scholar] [CrossRef]
- Cliburn, D.C.; Feddema, J.J.; Miller, J.R.; Slocum, T.A. Design and evaluation of a decision support system in a water balance application. Comput. Graph. 2002, 26, 931–949. [Google Scholar] [CrossRef]
- Deitrick, S.A. Uncertainty visualization and decision making: Does visualizing uncertain information change decisions? In Proceedings of the 23rd International Cartographic Conference, Moscow, Russia, 4–10 August 2007; pp. 4–10. [Google Scholar]
- Patroumpas, K.D.; Skoutas, G.; Mandilaras, G.; Athanasiou, S. Exposing Points of Interest as Linked Geospatial Data. In Proceedings of the 16th International Symposium on Spatial and Temporal Databases, Vienna, Austria, 19–21 August 2019; pp. 21–30. [Google Scholar]
- Brown, G.C.; Pullar, D.V. An evaluation of the use of points versus polygons in public participation geographic information systems using quasi-experimental design and Monte Carlo simulation. Int. J. Geogr. Inf. Sci. 2012, 26, 231–246. [Google Scholar] [CrossRef]
- Patroumpas, K.; Georgomanolis, N.; Stratiotis, T.; Alexakis, M.; Athanasiou, S. Exposing INSPIRE on the Semantic Web. J. Web Semant. 2015, 35, 53–62. [Google Scholar] [CrossRef]
- Mulligann, C.; Janowicz, K.; Ye, M.; Lee, W.C. Analyzing the spatial-semantic interaction of points of interest in volunteered geographic information. In Proceedings of the International Conference on Spatial Information Theory COSIT, Belfast, ME, USA, 12–16 September 2011; pp. 350–370. [Google Scholar]
- Jonietz, D.; Zipf, A. Defining fitness-for-use for crowdsourced points of interest POI. ISPRS Int. J. Geo-Inf. 2016, 59, 149. [Google Scholar] [CrossRef] [Green Version]
- Antoniou, V.; Skopeliti, A.; Fonte, C.C.; See, L.; Alvanides, S. Using OSM, geo-tagged Flickr photos and authoritative data: A quality perspective. In Proceedings of the 6th International Conference on Cartography and GIS, Albena, Bulgaria, 13–17 June 2016; pp. 482–492. [Google Scholar]
- Touya, G.; Antoniou, V.; Olteanu-Raimond, A.M.; Van Damme, M.D. Assessing crowdsourced POI quality: Combining methods based on reference data, history, and spatial relations. ISPRS Int. J. Geo-Inf. 2017, 63, 80. [Google Scholar] [CrossRef]
- Touya, G.; Antoniou, V.; Christophe, S.; Skopeliti, A. Production of Topographic Maps with VGI: Quality Management and Automation. In Mapping and the Citizen Sensor; Foody, G., See, L., Fritz, S., Mooney, P., Olteanu-Raimond, A.M., Fonte, C.C., Antoniou, V., Eds.; Ubiquity Press: London, UK, 2017; pp. 61–91. [Google Scholar] [CrossRef] [Green Version]
- Zhang, L.; Pfoser, D. Using OpenStreetMap point-of-interest data to model urban change—A feasibility study. PLoS ONE 2019, 14, e0212606. [Google Scholar] [CrossRef] [PubMed]
- Fonte, C.C.; Antoniou, V.; Bastin, L.; Estima, J.; Arsanjani, J.J.; Bayas, J.C.L.; See, L.; Vatseva, R. Assessing VGI Data Quality. In Mapping and the Citizen Sensor; Foody, G., See, L., Fritz, S., Mooney, P., Olteanu-Raimond, A.M., Fonte, C.C., Antoniou, V., Eds.; Ubiquity Press: London, UK, 2017; pp. 137–163. [Google Scholar] [CrossRef] [Green Version]
- Goodchild, M.F.; Li, L. Assuring the quality of volunteered geographic information. Spat. Stat. 2012, 1, 110–120. [Google Scholar] [CrossRef]
- Meek, S.; Jackson, M.J.; Leibovici, D.G. A flexible framework for assessing the quality of crowdsourced data. In Proceedings of the 17th AGILE International Conference on Geographic Information Science, Castellón, Spain, 3–6 June 2014; Available online: https://agile-online.org/conference_paper/cds/agile_2014/agile2014_112.pdf (accessed on 16 March 2020).
- Bordogna, G.; Carrara, P.; Criscuolo, L.; Pepe, M.; Rampini, A. A user-driven selection of VGI based on minimum acceptable quality levels. ISPRS Ann. Photogramm. Remote Sens. Spat. Inf. Sci. 2015, II-3/W5, 277–284. [Google Scholar] [CrossRef] [Green Version]
- Antoniou, V.; Skopeliti, A. Measures and indicators of VGI quality: An overview. In Proceedings of the ISPRS Geospatial Week 2015, La Grande Motte, France, 28 September–2 October 2015; pp. 345–351. Available online: http://www.isprs-ann-photogramm-remote-sens-spatial-inf-sci.net/II-3-W5/345/2015/isprsannals-II-3-W5-345-2015.pdf (accessed on 17 March 2021).
- Senaratne, H.; Mobasheri, A.; Ali, A.L.; Capineri, C.; Haklay, M. A review of volunteered geographic information quality assessment methods. Int. J. Geogr. Inf. Sci. 2016, 31, 1–29. [Google Scholar] [CrossRef]
- VGIscience Priority Programme. Available online: https://www.vgiscience.org/about.html (accessed on 16 May 2021).
- Keil, J.; Edler, D.; Kuchinke, L.; Dickmann, F. Effects of visual map complexity on the attentional processing of landmarks. PLoS ONE 2020, 15, e0229575. [Google Scholar] [CrossRef] [PubMed] [Green Version]
- Skopeliti, A.; Antoniou, V.; Bandrova, T. Visualization and Communication of VGI Quality. In Mapping and the Citizen Sensor; Foody, G., See, L., Fritz, S., Mooney, P., Olteanu-Raimond, A.M., Fonte, C.C., Antoniou, V., Eds.; Ubiquity Press: London, UK, 2017; pp. 197–222. [Google Scholar] [CrossRef] [Green Version]
- Kinkeldey, C.; MacEachren, A.M.; Schiewe, J. How to assess visual communication of uncertainty? A systematic review of geospatial uncertainty visualization user studies. Cartogr. J. 2014, 51, 372–386. [Google Scholar] [CrossRef]
- Skopeliti, A.; Antoniou, V.; Stamou, L. Visualisation and Communication of VGI Quality. In Proceedings of the 14th National Cartographic Conference, Thessaloniki, Greece, 2–4 November 2016. (In Greek). [Google Scholar]
- Girres, J.F.; Touya, G. Quality assessment of the French OpenStreetMap dataset. Trans. GIS 2010, 14, 435–459. [Google Scholar] [CrossRef]
- Arsanjani, J.J.; Barron, C.; Bakillah, M.; Helbich, M. Assessing the quality of OpenStreetMap contributors together with their contributions. In Proceedings of the 16th AGILE International Conference on Geographic Information Science, Leuven, Belgium, 14–17 May 2013; pp. 14–17. [Google Scholar]
- Ali, A.L.; Schmid, F. Data quality assurance for Volunteered Geographic Information. In Geographic Information Science, Proceedings of the 8th International Conference-GIScience 2014, Vienna, Austria, 24–26 September 2014; Duckham, M., Pebesma, E., Stewart, K., Frank, A.U., Eds.; Springer International Publishing: Cham, Switzerland, 2014; pp. 126–141. ISBN 978-3-319-11593-1. [Google Scholar]
- Sehra, S.S.; Singh, J.; Rai, H.S. A systematic study of OpenStreetMap data quality assessment. In Proceedings of the 11th International Conference on Information Technology: New Generations, Las Vegas, NV, USA, 7–9 April 2014; pp. 377–381. [Google Scholar] [CrossRef] [Green Version]
- Touya, G.; Brando, C. Detecting Level-of-Detail inconsistencies in volunteered geographic information data sets. Cartographica 2013, 48, 134–143. [Google Scholar] [CrossRef] [Green Version]
- Àvila Callau, A.; Pérez-Albert, Y.; Serrano Giné, D. Quality of GNSS Traces from VGI: A Data Cleaning Method Based on Activity Type and User Experience. ISPRS Int. J. Geo-Inf. 2020, 9, 727. [Google Scholar] [CrossRef]
- Antoniou, V.; Skopeliti, A. The Impact of the Contribution Micro-environment on Data Quality: The Case of OSM. In Mapping and the Citizen Sensor; Foody, G., See, L., Fritz, S., Mooney, P., Olteanu-Raimond, A.M., Fonte, C.C., Antoniou, V., Eds.; Ubiquity Press: London, UK, 2017; pp. 165–196. [Google Scholar] [CrossRef] [Green Version]
- Duchêne, C.; Ruas, A.; Cambier, C. The CartACom model: Transforming cartographic features into communicating agents for cartographic generalization. Int. J. Geogr. Inf. Sci. 2012, 26, 1533–1562. [Google Scholar] [CrossRef]
- Brando, C.; Bucher, B.; Abadie, N. Specifications for User Generated Spatial Content. In Advancing Geoinformation Science for a Changing World, Springer-Verlag Lecture Notes in Geoinformation and Cartography; Geertman, S., Reinhardt, W., Toppen, F., Eds.; Springer: Berlin/Heidelberg, Germany, 2011. [Google Scholar]
- Brando, C. Un Modèle d’ Operations Réconciliables Pour l’ Acquisition Distribuée de Données Géographiques. Ph.D. Thesis, Université Paris-Est, Champs-sur-Marne, France, 2013. [Google Scholar]
- Servigne, S.; Ubeda, T.; Puricelli, A.; Laurini, R. A methodology for spatial consistency improvement of geographic databases. GeoInformatica 2000, 4, 7–34. [Google Scholar] [CrossRef]
- Kainz, W. Spatial relationships-topology versus order. In Proceedings of the Fourth International Symposium on Spatial Data Handling, Zurich, Switzerland, 23–27 July 1990; pp. 814–819. [Google Scholar]
- Martínez, P.; Martí, P.; Querin, O.M. Growth method for size, topology, and geometry optimization of truss structures. Struct. Multidisc. Optim. 2006, 33, 13–26. [Google Scholar] [CrossRef]
- Papadias, D.; Mamoulis, N.; Delis, B. Algorithms for querying by spatial structure. In Proceedings of the 24th Very Large Data Bases Conference, New York, NY, USA, 24–27 August 1998; pp. 546–557. [Google Scholar]
- Rodríguez, M.A.; Brisaboa, N.; Meza, J.; Luaces, M.R. Measuring consistency with respect to topological dependency constraints. In Proceedings of the 18th SIGSPATIAL International Conference on Advances in Geographic Information Systems, New York, NY, USA, 2–5 November 2010; pp. 182–191. [Google Scholar] [CrossRef]
- Brisaboa, N.; Luaces, M.; Rodríguez, M.A. Cognitive adequacy of topological consistency measures. In International Conference on Conceptual Modeling; Springer: Berlin/Heidelberg, Germany, 2011; pp. 241–250. [Google Scholar]
- Brisaboa, N.R.; Luaces, M.R.; Rodríguez, M.A.; Seco, D. An inconsistency measure of spatial data sets with respect to topological constraints. Int. J. Geogr. Inf. Sci. 2014, 28, 56–82. [Google Scholar] [CrossRef]
- Open Street Map Wiki. Available online: https://en.wikipedia.org/wiki/OpenStreetMap (accessed on 18 March 2021).
- Open Street Map. Available online: https://www.openstreetmap.org/ (accessed on 18 March 2021).
- Geofabrik. Available online: www.geofabrik.de (accessed on 18 March 2021).
- BBBike. Available online: https://download.bbbike.org/osm/bbbike/ (accessed on 18 March 2021).
- Ramm, F. OpenStreetMap Data in Layered GIS Format Free Shapefiles. 2019. Available online: https://download.geofabrik.de/osm-data-in-gis-formats-free.pdf (accessed on 8 May 2021).
- Nakos, B. The SP-Displacement Measure for Assessing Line Simplification. Spat. Sci. 2004, 49, 1–11. [Google Scholar] [CrossRef]
- Davidovic, N.; Mooney, P.; Stoimenov, L.; Minghini, M. Tagging in volunteered geographic information: An analysis of tagging practices for cities and urban regions in OpenStreetMap. ISPRS Int. J. Geo-Inf. 2016, 512, 232. [Google Scholar] [CrossRef] [Green Version]
- Mooney, P.; Minghini, M.; Laakso, M.; Antoniou, V.; Olteanu-Raimond, A.-M.; Skopeliti, A. Towards a Protocol for the Collection of VGI Vector Data. ISPRS Int. J. Geo-Inf. 2016, 5, 217. [Google Scholar] [CrossRef] [Green Version]
- Zacharopoulou, D. Development of a GIS Tool for the Assessment of VGI Quality. Diploma Thesis, School of Rural and Surveying Engineering, National Technical University of Athens, Athens, Greece, October 2018. [Google Scholar]
- Zacharopoulou, D. Evaluation and Visualization of Volunteered Geographic Information Consistency: Study of OpenStreetMap for European Cities. Master’s Thesis, School of Rural and Surveying Engineering, National Technical University of Athens, Athens, Greece, July 2020. [Google Scholar]
- Urban Corridor Road Design: Guides, Objectives and Performance Indicators Sidewalks. Available online: https://www.roadspace.eu/wp-content/uploads/2019/11/MORE_D1_2_FINAL.pdf (accessed on 10 March 2021).
- Roads. 2018. Available online: https://ec.europa.eu/transport/road_safety/sites/roadsafety/files/pdf/ersosynthesis2018-roads.pdf (accessed on 10 March 2021).
- OSM Zoom Levels. Available online: https://wiki.openstreetmap.org/wiki/Zoom_levels (accessed on 13 May 2021).


| City | Area (km2) | POIs | Buildings | Roads | Nature | Rails | POIs Checked (%) |
|---|---|---|---|---|---|---|---|
| Athens | 17.5 | 8428 | 33,939 | 5863 | 1 | 122 | 80 |
| Berlin | 107.6 | 101,560 | 62,597 | 45,167 | 4 | 3295 | 32 |
| Paris | 105 | 188,466 | 103,946 | 40,724 | 4 | 3185 | 34 |
| Utrecht | 285.6 | 18,969 | 244,301 | 44,331 | 6 | 1501 | 45 |
| Vienna | 22.5 | 34,438 | 16,671 | 12,182 | 2 | 1027 | 31 |
| Zurich | 112 | 31,668 | 53,339 | 37,243 | 6 | 3289 | 48 |
| City | Percentage of Omission in “Type” for Buildings | Geodetic Reference System |
|---|---|---|
| Athens | 96 | GGRS87 |
| Berlin | 42 | ETRS89/LCC Germany (E-N) |
| Paris | 94 | RGF93/Lambert-93 |
| Utrecht | 42 | Amersfoort/RD New |
| Vienna | 90 | MGI/Austria Lambert |
| Zurich | 72 | CH1903/LV03 |
| City | POIs | Buildings | Roads | Railways | Nature |
|---|---|---|---|---|---|
| Athens | 120 | 42 | 18 | 5 | 1 |
| Berlin | 155 | 140 | 24 | 5 | 1 |
| Paris | 154 | 91 | 27 | 6 | 4 |
| Utrecht | 150 | 76 | 26 | 3 | 1 |
| Vienna | 141 | 58 | 23 | 4 | 1 |
| Zurich | 154 | 62 | 26 | 6 | 1 |
| Percentage of Overlapping Polygons | Percentage of Sliver Polygons | |
|---|---|---|
| Athens | 0.75 | 43 |
| Berlin | 0.80 | 18 |
| Paris | 0.84 | 23 |
| Utrecht | 0.55 | 36 |
| Vienna | 1.13 | 19 |
| Zurich | 0.44 | 14 |
| City | Check 1 | Check 1 With on Border | Check 2 | Check 3 | Check 4 | Check 5 | Check 6 |
|---|---|---|---|---|---|---|---|
| Athens | 5.4 | 4.9 | 35.8 | 0.8 | 0.0 | 0.02 | 87.5 |
| Berlin | 15.9 | 5.6 | 2.3 | 0.4 | 0.2 | 0 | 100 |
| Paris | 9.9 | 2.9 | 1.9 | 0.4 | 0.7 | 0.003 | 38.3 |
| Utrecht | 2.4 | 2.1 | 6.2 | 0.7 | 0.5 | 0 | 22.5 |
| Vienna | 5.3 | 3.7 | 19.3 | 0.4 | 0.4 | 0 | 100 |
| Zurich | 4.8 | 4.0 | 26.4 | 0.1 | 0.2 | 0 | 86.1 |
| Distances >0 m | Percentage of POIS | Distances ≤11 m | ||||||||
|---|---|---|---|---|---|---|---|---|---|---|
| Min | Mean | Median | St. Dev. | Max | <2 m | <5.5 m | <11 m | Mean | St. Dev. | |
| Athens | 0.001 | 5.1 | 2.7 | 6.8 | 47.2 | 58 | 71 | 89 | 4.3 | 2.6 |
| Berlin | 0.001 | 6.1 | 1.9 | 11.9 | 176.5 | 86 | 89 | 94 | 4.3 | 1.7 |
| Paris | 0.001 | 6.8 | 2.2 | 7.4 | 99.9 | 87 | 90 | 94 | 4.3 | 1.9 |
| Utrecht | 0.001 | 8 | 3 | 13.1 | 73.9 | 57 | 64 | 80 | 4.6 | 2.2 |
| Vienna | 0.001 | 7.3 | 2.4 | 12 | 73.2 | 68 | 76 | 86 | 4.3 | 2.1 |
| Zurich | 0.003 | 9.7 | 5.8 | 13.9 | 121.2 | 46 | 56 | 76 | 6.5 | 5.8 |
| Distances (m) | Percentage of POIs | Distances ≤11 m | ||||||||
|---|---|---|---|---|---|---|---|---|---|---|
| Min | Mean | Median | St. Dev. | Max | <2 m | <5.5 m | <11 m | Mean | St. Dev. | |
| Athens | 1.2 | 2.97 | 2.09 | 1.8 | 6.48 | 43 | 86 | 100 | 2.97 | 1.8 |
| Berlin | 0.4 | 4.2 | 4.56 | 1.9 | 9.88 | 20 | 71 | 80 | 4.21 | 1.9 |
| Paris | 0.13 | 4.8 | 1.75 | 7.60 | 36.90 | 59 | 78 | 89 | 2.51 | 1.5 |
| Utrecht | 2.09 | 6.9 | 5.01 | 5.22 | 20.79 | 0 | 56 | 89 | 5.16 | 1.9 |
| Vienna | 0.39 | 4.7 | 3.25 | 3.49 | 14.75 | 23 | 65 | 93 | 4 | 2.5 |
| Zurich | 0.84 | 7.3 | 4.97 | 5.59 | 20.22 | 19 | 58 | 74 | 4.35 | 2.4 |
| City | Consistency Grid (Error Existence) | Consistency Grid (Most Frequent) |
|---|---|---|
| Athens | 29.2 | 10.3 |
| Berlin | 10.3 | 3.2 |
| Paris | 10.0 | 2.1 |
| Utrecht | 6.8 | 4.8 |
| Vienna | 21.0 | 5.0 |
| Zurich | 14.54 | 6.0 |
Publisher’s Note: MDPI stays neutral with regard to jurisdictional claims in published maps and institutional affiliations. |
© 2021 by the authors. Licensee MDPI, Basel, Switzerland. This article is an open access article distributed under the terms and conditions of the Creative Commons Attribution (CC BY) license (https://creativecommons.org/licenses/by/4.0/).
Share and Cite
Zacharopoulou, D.; Skopeliti, A.; Nakos, B. Assessment and Visualization of OSM Consistency for European Cities. ISPRS Int. J. Geo-Inf. 2021, 10, 361. https://doi.org/10.3390/ijgi10060361
Zacharopoulou D, Skopeliti A, Nakos B. Assessment and Visualization of OSM Consistency for European Cities. ISPRS International Journal of Geo-Information. 2021; 10(6):361. https://doi.org/10.3390/ijgi10060361
Chicago/Turabian StyleZacharopoulou, Dimitra, Andriani Skopeliti, and Byron Nakos. 2021. "Assessment and Visualization of OSM Consistency for European Cities" ISPRS International Journal of Geo-Information 10, no. 6: 361. https://doi.org/10.3390/ijgi10060361
APA StyleZacharopoulou, D., Skopeliti, A., & Nakos, B. (2021). Assessment and Visualization of OSM Consistency for European Cities. ISPRS International Journal of Geo-Information, 10(6), 361. https://doi.org/10.3390/ijgi10060361